Land Use and Land Cover Change Detection and Prediction in the Kathmandu District of Nepal Using Remote Sensing and GIS - MDPI
←
→
Page content transcription
If your browser does not render page correctly, please read the page content below
sustainability

Article
Land Use and Land Cover Change Detection and
Prediction in the Kathmandu District of Nepal Using
Remote Sensing and GIS
Sonam Wangyel Wang 1 , Belay Manjur Gebru 2 , Munkhnasan Lamchin 2 ,
Rijan Bhakta Kayastha 3 and Woo-Kyun Lee 2, *
 1    Ojeong Eco-Resilience Institute (OJERI), Division of Environmental Science and Ecological Engineering,
      College of Life Sciences, Korea University, Seoul 02841, Korea; wangsonam@gmail.com
 2    Division of Environmental Science and Ecological Engineering, College of Life Sciences, Korea University,
      Seoul 02841, Korea; arsemabm@gmail.com (B.M.G.); nasaa@korea.ac.kr (M.L.)
 3    Department of Environmental Science and Engineering, Kathmandu University, Dhulikhel 6250, Nepal;
      rijan@ku.edu.np
 *    Correspondence: leewk@korea.ac.kr

 Received: 25 March 2020; Accepted: 2 May 2020; Published: 11 May 2020

 Abstract: Understanding land use and land cover changes has become a necessity in managing and
 monitoring natural resources and development especially urban planning. Remote sensing and
 geographical information systems are proven tools for assessing land use and land cover changes that
 help planners to advance sustainability. Our study used remote sensing and geographical information
 system to detect and predict land use and land cover changes in one of the world’s most vulnerable
 and rapidly growing city of Kathmandu in Nepal. We found that over a period of 20 years (from 1990
 to 2010), the Kathmandu district has lost 9.28% of its forests, 9.80% of its agricultural land and 77% of
 its water bodies. Significant amounts of these losses have been absorbed by the expanding urbanized
 areas, which has gained 52.47% of land. Predictions of land use and land cover change trends for 2030
 show worsening trends with forest, agriculture and water bodies to decrease by an additional 14.43%,
 16.67% and 25.83%, respectively. The highest gain in 2030 is predicted for urbanized areas at 18.55%.
 Rapid urbanization—coupled with lack of proper planning and high rural-urban migration—is the
 key driver of these changes. These changes are associated with loss of ecosystem services which
 will negatively impact human wellbeing in the city. We recommend city planners to mainstream
 ecosystem-based adaptation and mitigation into urban plans supported by strong policy and funds.

 Keywords: Kathmandu; land use and land cover; urbanization; remote sensing

1. Introduction
      At the crossroads of the twenty first century, threats from climate change, increasing frequency
of disasters and other unknown potential effects of global environmental change continue to arrest
human progress in achieving the sustainable development goals. Yet, ironically, human activities
have been proven to be responsible for driving these changes resulting in modified landscapes that
negatively impact ecosystem services and human wellbeing [1–4]. Major drivers of global environmental
change include, but are not limited to, rapid urbanization [5,6], increasing population [7] and other
socio-economic development activities resulting in deforestation [8], biodiversity loss [9], encroachment
into arable agricultural land [10] and water resources. Further, scientific studies [11–13] also confirm
that landscape changes are significantly associated with biodiversity loss, degrading water quality and
increased carbon emissions as well as other detrimental impacts on aquatic and terrestrial ecosystem.
For instance, large areas of agricultural and forestry land that were converted into urban land, mining

Sustainability 2020, 12, 3925; doi:10.3390/su12093925                        www.mdpi.com/journal/sustainability
Sustainability 2020, 12, 3925                                                                         2 of 18

quarries, and mega industrial estates were characterized by poor biodiversity, loss of ecosystem
services, and thus prone to land degradation [14,15]. In addition, numerous studies [16,17] have also
reported that land cover changes impact radiative, thermodynamic and hydrological processes that can
lead to changes in local climate. Such changes can create a more variable environment that are more
susceptible to global temperature change, as well as increase the vulnerability and reduce resilience of
communities, ecosystems and places to climatic stresses [13,18].
      Teketay [2] asserted that landscape change is one of the most important indicators for
understanding the interaction between humans and the environment. Understanding and monitoring
the dynamics of land use and land cover changes, their intensity, direction, drivers, and impacts
provide useful information for sustainable development planning [19,20] and therefore remains an
important goal in the field of land cover change science. Remote sensing in combination with GIS
technology has been proven to provide scientifically credible results and policy recommendations that
have assisted decision-makers and planners to advance sustainable development especially in fast
growing urban settings [21]. As a result, remote sensing and GIS have become popular tools for better
understanding of spatiotemporal and spectral characteristics of land use and land cover changes at local
and global scales [22,23]. Geospatial modeling analysis that lies at the heart of these techniques [22,24]
attempts to detect where the changes occurred or will potentially occur [25]. Most of these models use
historical land use data to assess the past land transformation and transition, which in combination
with environmental variables can predict future land use scenarios [26]. Predicted land use changes
exhibiting major modifications and alternations can help land use planners, resource managers and
conservation officers in promoting sustainable land management and mitigating negative impacts.
Consequently, detecting and predicting land use changes have become an important consideration in
variety of fields including, modeling rural and urban plans [27,28], identifying biodiversity hotspots
for prioritizing conservation efforts, studying desertification dynamics, etc. [29]. Geospatial analysis
uses various statistical and rule-based modeling approaches for detecting and predicting land use
changes [30]. Commonly used models in land use and land cover change (LULC) studies include;
statistical models [31], evolutionary models [32], cellular models [33], Markov models [34], hybrid
models [35], expert system models [36] and multi-agent models [37]. Of these, the most popularly used
are the cellular and Markov chain analysis and their hybrid model called the CA–Markov model [38,39].
      Markov chain analysis is a random stochastic modeling approach that is discrete in both time and
state. It determines land use changes at two different time periods [40] to project probabilities of land
use changes for the future. The underlying assumption here is that the probability of a system being in
a certain state at certain time can be determined if its state at an earlier time is known [41]. The known
probabilities generated from past changes are applied to predict future changes. The Markov model
is suitable for land use modeling as land use data are spatially dependent [30]. Compared to other
methods, the Markov model has the ability to predict all multi-directional land use changes among
all land use categories available. The model also considers spatial interactions, making it the most
preferred model in land use change prediction studies [42]. However, the Markov model is best used
for short term projections [4,43] as its analyses are not spatially explicit [44] and do not consider spatial
information allocation within each class. In addition, the probabilities of change between landscape
states are not constant. Hence, it can offer the right magnitude, but not the right direction of change.
This short coming is mitigated by combining the Markov model with a more dynamic and empirical
cellular automata (CA) model and commonly referred to as the CA–Markov model. The cellular
automata incorporates the spatial dimension and thus adds modeling direction. Thus, the CA–Markov
model has the advantage of predicting two-way transitions among the available land use types and is
proven to have outperformed regression-based models in predicting land use change [28].
      A review of global literature on the use of remote sensing and GIS models for detecting and
predicting land use and land cover changes revealed that a significant amount research [7,11,45–52]
have used the CA–Markov model. These studies have generated highly credible information on the
state of land use changes and their drivers, which can inform better decision making for sustainable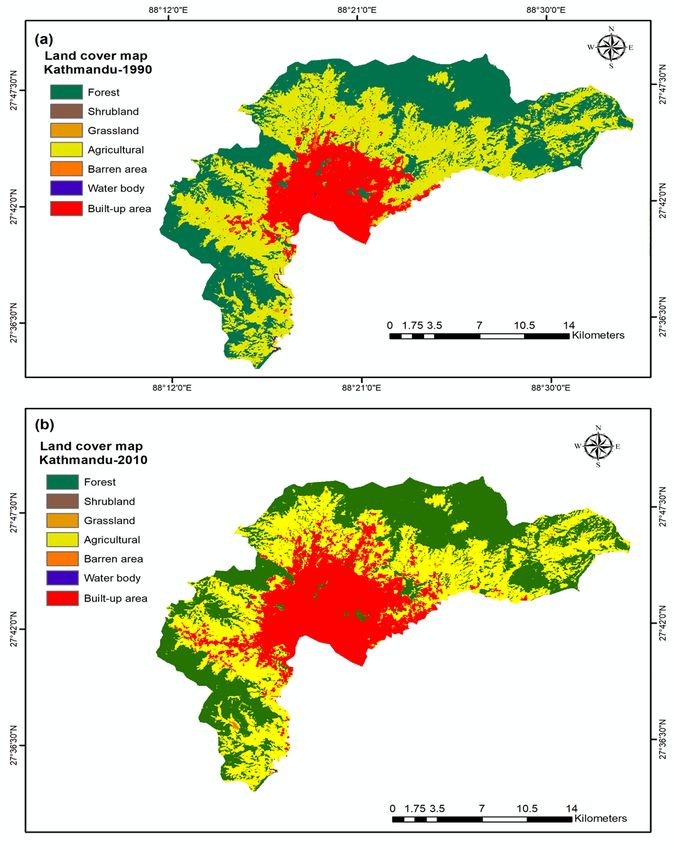
Sustainability 2020, 12, 3925                                                                        3 of 18

management of natural resources [19]. Hence, the CA–Markov model was used in this study to
predict land use and land cover changes. However, the assessment of land use and land cover change
studies by economic levels and geographic locations confirmed fewer such studies were carried out
in developing countries and this trend decreases as the countries and regions become more remote.
Nepal, a landlocked and remote country in the rugged Himalayan mountain is one such a country
where only few studies to detect and predict land use and land cover changes are available [53–58].
      Geographically, Nepal is a small developing country located in the rugged landscape of the eastern
Himalayas between India to the south and China to the north. Despite the efforts of the government
and development agencies to secure Nepal’s forests and ecosystem services, Nepal’s landscape is fast
changing due to deforestation [59,60] and rapid urbanization [61,62]. Historical agricultural practices
combined with increasing population, aggressive development programs including construction of
roads, hydropower plants, topped with expanding urban areas are the main drivers of land use
changes and their effects are further exacerbated by the impacts of climate change [63]. A review
of studies on land use and land cover changes in Nepal carried out by Paudel, et al. [63] validated
these claims, stating that the forest and snow/glacier cover has decreased with increasing crop
land and built structures—especially urbanization associated with habitat fragmentation. This is a
serious finding, as habitat fragmentation and deforestation—topped with urbanization—pose a critical
threat to sustainable development of Nepal’s natural resources that provide vital ecosystem services.
Similar findings highlighting the unprecedented land use and land cover changes over the last 30 years,
especially in urban cores, including Kathmandu were reported in existing studies [61–66]. For instance,
in their analysis of historical urban growth patterns in Kathmandu valley, Khanal, et al. [61] report that
settlement areas more than doubled between 2000 and 2018. A similar study by Ishatique, et al. [62]
reports that urban area expanded by almost 412% in 30 years and points out the urgent need for major
systemic analysis of the urbanization trend and land use and land cover. Based on a 33 years of time
series data, Thapa and Murayama [65] observed that the urban built-up areas in Kathmandu valley
had a slow trend of growth in the 1960s and 1970s which rapidly increased since the 1980s. In addition,
Haack and Rafter [66] in their study to ascertain urban changes in the Kathmandu valley reported an
increase of 450% between 1970 and 2000, confirming the findings reported by other studies [61–65] that
the urban growth has expedited significantly since 2000. Despite the immense threats posed by rapid
urbanization to ecosystem services and human wellbeing, none of these studies neither focused on the
Kathmandu district which is the core of the Kathmandu valley nor predicted future land use and land
cover changes, which is important for planners and policy makers. These studies, however, agreed and
emphasized the need for more robust scientific studies to deepen the existing understanding of land
use and land cover change dynamics [67], to guide politicians, decision-makers and urban planners to
design and implement sustainable development plans.
      Kathmandu is the crucible of Nepal’s socio-economic development and home to over
1,423,515 people [68], which is projected to double by the year 2030 [69]—mainly due to high rural-urban
migration [70]. An open-tourism policy further bloats the city population, putting significant pressure
on the environment and urban infrastructure, forcing the city to expand rapidly. Like in any other
city, better facilities such as employment, quality education, health, security, and entertainment are
resulting in high immigration into Kathmandu. Past studies on Kathmandu valley [61–66] did not
abode well for biodiversity conservation and ecosystem services in the district, as their results indicated
an increasing deforestation, habitat fragmentation and rapid urbanization. In recent years, rapidly
expanding city has been responsible for converting agricultural and forest lands into built-up areas
with little planning, resulting in loss of biodiversity and increasing slum settlements especially on
the marginal lands such as flood plains that are not only vulnerable to seasonal flooding, but also
threatening the riparian ecosystem [61]. While its demonstrated that scientific studies using high
resolution images and GIS can provide essential information for planning environmental and economic
development programs that are sensitive to achieving social and environmental goals [71,72], no such
studies to detect and predict land use and land cover change scenarios for this cosmopolitan district
Sustainability 2020, 12, 3925 4 of 18
has been carried out. To fill this existing gap, this study attempts to detect and predict land use and
land cover changes in the Kathmandu district of Nepal by using remote sensing and GIS.
2. Study Area
The study was carried out in the landlocked and high-altitude urban district of Kathmandu, Nepal
with an area of about 433.6 km2 and located between 27◦ 270 E to 27◦ 490 E longitude and 85◦ 100 N
to 85◦ 320 N latitude, in the eastern Himalayas. The Kathmandu district is one of the three districts
(other two being Lalitpur and Bhaktapur) that constitutes the Kathmandu valley and is the capital
city of Nepal. The Kathmandu district is composed of flat plains at 1300 m above mean sea level
surrounded by mountains ranging up to 2800 m tall [66]. About 20% of the valley has slopes greater
than 20◦ [73]. The Kathmandu district has a sub-tropical climate (below 2000 m) and temperate climate
(above 2000 m) and is influenced by south Asian monsoon [67]. The annual average precipitation is
about 1407 mm with monsoon period that lasts from June to September accounting for more than 80%
of its annual precipitation. The annual average temperature in the valley is around 18.1 ◦ C, with some
mountain tops remaining under seasonal snow [62]. The main vegetation type of the district is mixed
conifer and broadleaved forests at lower elevations, slowly transitioning to conifers to shrub land and
occasional snow at higher elevations.
Like many urban areas in the developing countries, Kathmandu is grappling with classic challenges
of unplanned and unregulated urban development with poor infrastructure. As the host to Nepal’s
capital, the Kathmandu district has a large population of over 1,423,515 people compounded by high
rural-urban migration and large number of tourists. Over population, urban poverty, and traffic
congestion continues to test the limits of city’s current infrastructure and threaten ecosystem services
and urban wellbeing. Thus, the IIED [70] has designated Kathmandu as one of the 15 most vulnerable
cities in the world.
3. Methodology
Data processing flow chart (Figure 1) outlines the conceptual framework for detecting and
predicting land use and land cover changes in the study area. Key steps in the process include:
(i) data acquisition and preparation; (ii) land use and land class classification for 1990 and 2010;
and (iii) prediction of land use and land classification in 2030 using the CA–Markov model.
3.1. Data Acquisitions and Use
Spatial data and socio-economic data were collected for evaluating the land use and land cover
change process. Landsat-5 Thematic Mapper (TM) and Landsat-8 Operational Land Imager (OLI)
images at a resolution of 30 m were acquired for the years 1990 (01/28/1990: path/row: 141/41) and 2010
(01/13/2010: path/row: 141/41), respectively, to investigate the changes in spatiotemporal patterns of
land use and land cover change in the high altitude and landlocked city of Kathmandu in the eastern
Himalayas. These two time periods correspond to profound socio-political changes in Nepal that
were associated with policy changes including land rights. We selected 1990 because the images were
cloud-free and it marked the end of the Panchayat system of governance and the introduction of land
tenure system changes. This was followed by the Maoist insurgency from 1996 to 2006 that not only
saw the introduction of significant changes in the land ownership system, but also large inflow of
immigrants into Kathmandu city. These factors have triggered rapid conversion of land consistently
after 2000 [62] and as such detection of land use and land cover changes from pre-Maoist insurgency
period of 1990 and post Maoist insurgency period of exacerbated socio-economic development would
yield useful information for planners and policy makers.Sustainability 2020, 12, 3925 5 of 18
Sustainability 2019, 11, x FOR PEER REVIEW 5 of 18
Data collection
Landsat 5 TM 1990 Landsat 8 TM 2010 DEM & Road
Image processing including corrections and normalizations
Select training samples
and
classify using maximum likelihood classification
Accuracy
validation
LULC classification maps and change detection
CA-Markov model
Predict the LULC in year 2030
Figure 1. Flow chart of the methodology used.
Figure 1. Flow chart of the methodology used.
The satellite images were obtained from the US Geological Survey (USGS) Center for Earth
The satellite images were obtained from the US Geological Survey (USGS) Center for Earth
Resources Observation and Science (EROS) found at http://glovis.usgs.gov/. These data sets were
Resources Observation and Science (EROS) found at http://glovis.usgs.gov/. These data sets were
imported in ENVI 5.3, ERDAS Imagine version 10.4 and ARC GIS 10.6 satellite image processing
imported in ENVI 5.3, ERDAS Imagine version 10.4 and ARC GIS 10.6 satellite image processing
software to create a false color composite. Other geospatial data collected from Kathmandu City
software to create a false color composite. Other geospatial data collected from Kathmandu City office
office include, digital elevation model (DEM) and infrastructure data such as road networks, drainage
include, digital elevation model (DEM) and infrastructure data such as road networks, drainage
networks, water bodies, buildings and other important establishments in the city. Additionally, field
networks, water bodies, buildings and other important establishments in the city. Additionally, field
consultations with select communities, experts and planners from the city office were held to collect
consultations with select communities, experts and planners from the city office were held to collect
relevant socio-economic data and perceptions on the causes of land use and land cover changes
relevant socio-economic data and perceptions on the causes of land use and land cover changes
including climate change.
including climate change.
3.2. Image Preprocessing
3.2. Image Preprocessing
Preprocessing of satellite images was required to avoid data distortion or manipulation and
Preprocessing
to establish of satellite
direct linkage imagesdata
between wasand
required to avoid
biophysical data distortion
phenomena. We or manipulation
used and
atmospheric andto
establish direct linkage between data and biophysical phenomena. We used atmospheric
topographic correction (ATCOR3) procedures in ERDAS Imagine to remove haze, atmospheric noise and
topographic
and correction (ATCOR3)
surface reflectance that could procedures in ERDAS
be caused by Earth’s Imagine
rotation to remove
[74]. haze, atmospheric
In addition, noise
considering the
and surface reflectance that could be caused by Earth’s rotation [74]. In addition, considering the
rugged terrain of the eastern Himalayas where the study site was located, terrain correction and
temporal normalizations were also carried out.Sustainability 2020, 12, 3925 6 of 18
rugged terrain of the eastern Himalayas where the study site was located, terrain correction and
temporal normalizations were also carried out.
3.3. Land Cover Classification
Both supervised and unsupervised classifications [75–77] were used to identify land use types in
the study area. Hyperclustering approach was used as the exact number of spectral classes in the data
set was unknown. Considering the Nepal land classification system and the goal of this study, we
used google earth observation, other land use maps and familiarity of the study area, to identify seven
land use clusters (Table 1), namely; forests (F—broadleaved and conifer forests whether natural or
planted are included in this class), shrub land (SL—this class represents the low height woody plants
and other bushy vegetation), grassland (GL—grass lands and pastures are included in this class),
agricultural land (AL—land dedicated to cultivation of crops, mainly rice, mustard, maize, potatoes
and vegetables is included in this class), barren area (BA—this land class is composed of bare lands,
rock-strewn, and other exposed soil surfaces that remain devoid of vegetation throughout the year),
water bodies (WB—this class is comprised of open water bodies such as lakes, rivers, ponds, streams)
and built-up area (BUA—this class represents structures of all types including residential, commercial
infrastructure, industrial zones, roads, airports and other paved surfaces). Spectrally similar classes of
the identical land use types were merged [66]. The comprehensive set of the spectral class signature
was used in the second stage as training data for supervised classification. For data training purposes,
about 180 signatures were randomly collected for each year. Simple random sampling was employed
to generate these signatures from high resolution google earth engine topped with expert knowledge
and familiarity with the study area. The signature points were then tested for statistical similarities [12]
which indicated a good degree of similarity-based on spectral distance. Consequently, reasonable
signatures were extracted for each land use and land cover types using a triangulation of information
from aerial images, google earth, field observation and image enhancement processes. Signatures were
considered satisfactory when the confusion between the land uses was minimal [53]
We then carried out supervised classification of all images using the maximum likelihood classifier
(MLC) algorithm [78] in the ERDAS Imagine software and GIS. MLC uses a parametric statistical
approach to prepare the probability density distribution functions for each individual land use
class [79,80]. Compared to other methods, MLC is proven to be more accurate, robust and a popular
algorithm, as it calculates the total amount of variance and the correlation of the spectral values
of different bands according to the specimen. MLC then uses this property for the association of
pixels classified into one of the groups and is based on the most similarity between the pixels [79,80].
In addition, MLC also reflects the intensity of land use changes and the visual differences in land use
types and considers not only the cluster center, but also its shape, size and orientation [81,82].
3.4. Classification Accuracy Assessment
Accuracy validation was carried out on the resulting classified imagery using error matrix and
kappa index [83,84] to test the precision and accuracy of imagery and comparing them with actual
points from the field supplemented by high resolution google earth data. Kappa coefficient was
calculated using the formula confirmed and used by Congalton and Green [85];
Pk Pk
i=1 nii − i=1 nii (Gi Ci )
Kappa coe f f icient = (1)
n2 − ki=1 nii (Gi Ci )
P
where, i is the class number, n is the total number of classified pixels that are being compared to actual
data, nii is the number of pixels belonging to the actual data class i, that were classified with a class i, Ci
is the total number of classified pixels belonging to class i and Gi is the total number of actual data
pixels belonging to class i.Sustainability 2020, 12, 3925 7 of 18
In order to deepen the understanding of major land uses and drivers of their changes and
socio-environmental implications, the principal investigator carried out field visits in 2019. During the
field visits, field observations and consultations were held with the stakeholders including communities,
experts and city officials—as well as collected biophysical and climatic data. Discussions with city
planners and locals focused around: evolution of land use, their observations, why the changes and
their causes and their perception on socio-environmental resilience. In addition, records of major
incidents such as disasters (fire, floods), plantation efforts, urban policy changes, etc. were also noted
to relate and/or validate land use and land cover types.
3.5. Land Use Land Cover Change Analysis
One of the widely used modeling tools and techniques to detect and predict land use and land
cover changes is the CA–Markov model [38]. This model integrates the cellular automata (CA) and
Markov chain to forecast land use and land cover change dynamics and characteristics over time [11].
Due to its ability to model both spatial distribution and temporal changes in landscape over time,
the model is popularly used by planners and scientists [39] to characterize the dynamics of land use
and land cover change, urban growth, modeling watersheds, etc.
We used the CA–Markov model to quantify the extent and magnitude of land use and land
cover transition, the rate of change and changed detection matrices [49] for each land use and land
cover types between the 1990 and 2010 images. We used ArcGIS cross-tabulation tool functionality to
ascertain the transition rates from one land use type to another under certain intrinsic conditions [86].
This determination is possible because land use transitions are proven to follow rules that control the
change of a cell’s state during a subsequent iteration [87]. These have cellular automata tendencies,
which are based on the likely rate of transition from one cell function of its state, cell suitability and
its transition probability rule. Finally, land use and land cover change predictions for 2030 were
carried out.
3.5.1. Markov Chain Analysis
The Markov model is commonly used in detecting and predicting land use and land cover
changes [38], because it has the ability to predict all multi-directional land use changes among all land
use categories available and considers spatial interactions [42]. The Markov chain analysis is a random
stochastic modeling approach that is discrete in both time and state. The Markov chain model defines
the land use and land cover transition from one time (t1 ) to the next (t2 ) to predict future change at a
time [40], to project probabilities of land use changes for the future. The underlying assumption here is
that the probability of a system being in a certain state at certain time can be determined if its state at an
earlier time is known [41]. The known probabilities generated from past changes are applied to predict
future changes. The model generates a transition area matrix and a transition probability matrix to
predict land use change trends. The Markovian chain analysis is represented as, S(t,t+1) = Pij × S(t),
where, S(t) is the system status at time of t, S(t + 1) is the system status at time t + 1; Pij is the transition
probability matrix in a state, which is calculated using the following formula [11,50]:
P11 P12 ··· P1n
P21 P22 ··· P2n
Pij = . 0 ≤ Pij ≤ 1 (2)
.. .. .. ..
. . .
Pn1 Pn2 ··· Pnn
where, P is the Markov probability matrix, and Pij stands for the probability of converting from current
state i to another state j in next time period. Low transition will have a probability near (0) and high
transition probability near (1).
The 1990 land use and land cover image of the Kathmandu district was used as the base (t1 )
image while 2010 land use and land cover map as the later (t2 ) image in Markov model to obtainSustainability 2020, 12, 3925 8 of 18
the transition matrix between 1990 and 2010 for prediction of land use and land cover types in 2030.
Markov chain analysis generates two significant probabilities: (i) transition probability matrix, where
the probabilities of transition represent the probability that a pixel of a given class will move to some
other cell class in the next time period, and (ii) transition area matrix, which represents the total area
(in cells) expected to change from one land use and land cover class to another over the prescribed
number of time units. It is generated by multiplying each column in the transition probability matrix
by the number of pixels of corresponding class in the later image. The transition probability matrix is
expressed in a text file that records the likelihood of moving each land use and land cover category to
some other category, while the transition area matrix, also represented in a text file records the number
of pixels required to transition from one land use and land cover class to another over the specified
number of time unit. The transition area matrix obtained from the two time periods was used as a
basis for predicting the future land use and land cover scenarios.
3.5.2. The CA–Markov Model
Markov model is suitable for land use modeling as land use data are spatially dependent [30].
However, the Markov model is best used for short term projections [4,43] as its analysis is not spatially
explicit [44] and does not consider spatial information allocation within each class and the probabilities
of change between landscape states are not constant. Hence, it can offer the right magnitude, but not the
right direction of change. This short coming is mitigated by combining the Markov model with a more
dynamic and empirical cellular automata model and commonly referred to as the CA–Markov model.
Thus, the CA–Markov model is the combination of cellular automata model’s ability to stimulate
spatial variation in complex systems and the transition probability matrix generated by the cross
tabulation of two different images.
Cellular automata is a bottom up dynamic model that incorporates the spatial dimension and
thus adds modeling direction [35]. The ability of CA to demonstrate the spatial and dynamic process
in simulations are important in land use studies. Thus, the CA–Markov model has the advantage of
predicting two-way transitions among the available land use types and is proven to have outperformed
regression-based models in predicting land use changes [28]. We used the CA–Markov model to
predict 2030 land use and land cover change for the Kathmandu district. Inputs into the CA–Markov
models included DEM, road infrastructure data and transition probability matrix and data from 1990
and 2010 of Kathmandu. In order to ensure that the model is reliable in predicting land use and land
cover types for 2030, we used Kappa statistics.
4. Results and Discussion
4.1. Classification Accuracy Results
Accuracy and validation of classification models is an important pre-requisite step in classification,
detection and prediction of land use and land cover change studies. The Kappa statistic is a commonly
used metric for quantifying the classification accuracy of both the model as well as the user of the
model of classification [88,89]. The Kappa coefficient values represent the measure of agreement or
accuracy between the reference data and the land use and land cover values in the classified image and
can take on values from +1 to −1 [85]. Kappa values ofSustainability 2020, 12, 3925 9 of 18
4.2. Analysis of Land Use and Land Cover Types
Results from classification of the preprocessed satellite images in 1990 and 2010 are presented in
Figure 2. We classified 7 land use class types as: forests (F), shrub land (SL), grassland (GL), agricultural
land (AL), barren area (BA), water bodies (WB) and built-up area (BUA). Areas and proportions of land
under different land use categories as derived from the classification results are also given in Table 1.
Sustainability 2019, 11, x FOR PEER REVIEW 9 of 18
4.2.1. Analysis of Land Use and Land Cover Classes for 1990
Results of of the
theanalysis
analysisofofthethe1990
1990 image
image (Figure
(Figure 2) show
2) show thatthat forest
forest cover cover and agricultural
and agricultural land
land dominated the landscape, 2 (42.44%) and 1832 km2 (41.73%), respectively. However,
dominated the landscape, withwith 1862 km
186 km (42.44%) and 183 km (41.73%), respectively. However, the
the forest
forest cover
cover is confined
is confined to the
to the higher
higher elevations
elevations away awayfrom from
the the
corecore of the
of the city.city. Agricultural
Agricultural farms
farms are
are mostly
mostly foundfound in between
in between thethe urban
urban core
core and
and theremote
the remoteforest,
forest,indicating
indicatingits itsdependence
dependence on forest
for natural inputs
inputs such
suchas aswater,
water,manure,
manure,pasture,
pasture,etc.etc.and
and access
access to markets
to markets whichwhichare are mostly
mostly in
in the
the 2
city.city.
TheThethirdthird largest
largest landland use type
use type is composed
is composed of built-up
of built-up area atarea
65.09at km
65.09
2 km (14.83%)
(14.83%) which is which
mostly is
mostly
located located
towards towards the southern
the southern part ofpart
theofdistrict
the district
which which is the
is the flattest
flattest and andhome
hometotothe the core
core of
Kathmandu
Kathmandu City. City. There
There are
are very little vegetation and agricultural
agricultural farms in this area signaling reduced
ecosystem
ecosystem services.
services. Similar
Similar findings
findingswerewerealso
alsoreported
reportedbybyearlier
earlierstudies
studies [61,62]
[61,62] forfor
thethe
larger area
larger of
area
Kathmandu
of Kathmandu valley. Grassland
valley. Grassland (0.67%), shrubshrub
(0.67%), land (0.03%), waterwater
land (0.03%), body (0.11%), and barren
body (0.11%), and area
barren(0.18%)
area
made
(0.18%) upmade
the rest
up ofthethe land
rest area.
of the Such
land low
area. coverage
Such by grassby
low coverage lands,
grassshrub
lands,landshrubandland
waterandbody
wateris
an indication
body of low levels
is an indication of low of levels
ecological diversitydiversity
of ecological and highand potential for drought
high potential for and waterand
drought shortage.
water
In addition,
shortage. Ingrassland
addition, ecosystems provide important
grassland ecosystems provideecological
importantand social services
ecological [91] especially
and social for
services [91]
livestock
especiallygrazing, whichgrazing,
for livestock is an important
which islivelihood
an important activity [60]. activity [60].
livelihood
Figure 2. Land use and land cover change (LULC) change map of the Kathmandu district in 1990 (a)
Figure 2. Land use and land cover change (LULC) change map of the Kathmandu district in 1990
and 2010 (b).
and 2010.
4.2.2. Analysis of Land Use and Land Cover Classes for 2010
Compared to 1990 results, findings from the year 2010 shows a significant increase in the cover
of build-up area followed by a slight increase in grassland cover. The rest of the land cover classes
decreased significantly (Figure 2) with water body, barren area, and shrub land almost disappearing.
Despite these decreases, forest land and agricultural land maintained their dominance with a
coverage of 168.93 km2 (38.49%) and 165.16 km2 (47.63%), respectively. However, the built area
2Sustainability 2020, 12, 3925 10 of 18
4.2.2. Analysis of Land Use and Land Cover Classes for 2010
Compared to 1990 results, findings from the year 2010 shows a significant increase in the cover
of build-up area followed by a slight increase in grassland cover. The rest of the land cover classes
decreased significantly (Figure 2) with water body, barren area, and shrub land almost disappearing.
Despite these decreases, forest land and agricultural land maintained their dominance with a coverage
of 168.93 km2 (38.49%) and 165.16 km2 (47.63%), respectively. However, the built area expanded
into the agricultural and forest lands with 99.24 km2 representing over 22% of the total district
land. This represents an increase of almost 8% increase since 1990 and has sustainable management
consequences including degradation of land and ecosystem services. Past studies by Khanal, et al. [61],
Ishtiaque, et al. [62] and Paudel, et al. [63] attributed the reduction of agricultural and forest lands to
rapid urbanization and lack of stringent policies governing land conversions. Khanal et al. [61] also
reported that the rate of urbanization in Kathmandu increased rapidly after the civil war ended in 2006.
A slight increase in grassland is probably due to deforestation and abandonment of agricultural land.
4.3. Analysis of Land Use and Land Cover Class Change Trends between 1990 and 2010
The land use and land cover class change trend analysis indicate the direction of land class
changes based on their respective initial years as a reference [45]. The results (Table 1) show that
both forest and agriculture coverage have decreased by 17.28 km2 (9.28%) and 17.95 km2 (9.80%),
respectively. Similar trends were also reported by previous studies in urban areas in Nepal [63]
including Kathmandu valley [61,62] and elsewhere in the world [11,45,48,50]. These decreases signal
a warning for degrading ecosystem services and increase in food insecurity that could be triggered
by unsustainable utilization of forest resources, drought (lack of irrigation water), land conversion to
urban and settlement centers and impacts of climate change. The biggest decrease (98%) by proportion
to 1990 is the shrub land coverage which has ecological consequences including loss of biodiversity,
soil protection and water retention properties. This topped with loss of water body by 77% is a
serious finding calling for urgent management interventions especially under continuous drying of
water sources across the globe due to global warming [29]. In the case of Kathmandu, filling in of
water bodies such as canals, riparian zones and wetlands to create space for infrastructure may have
exacerbated the rate of water body loss. Decrease in water bodies poses an imminent water crisis for
the already water scare city especially under global warming scenarios. Communities especially in
the more vulnerable sections such as the slums are being impacted severely by water shortages and
often resort to polluted water for domestic. Women and children who are mostly tasked with cooking
and washing while men go out to work bear the brunt of these impacts including exposure to water
borne diseases. City authorities and planners must urgently implement adaptation and mitigation
programs to protect the existing water sources in the city as well as conserve watersheds and water
bodies upstream. Such programs must emphasize water conservation programs and water use ethics
coupled with stricter penalties for those who do not comply.
Built-up area has expanded by 52.47% from 1990 (14.83%) to 2010 (22.61%), representing a
significant increase in area built-up of 34.15 km2 . This rapid increase in built-up area confirms past
report by the United Nations Department of Economic and Social Affairs [67] and subsequently by other
researchers [61–63] who asserted that Kathmandu valley in particular—and Nepal in general—is facing
unchecked and unplanned urbanization. It is obvious from the results that land use classes such as
forest and agriculture have transitioned into other land uses by the year 2010. Rapid urbanization is
mainly responsible for the conversion of agricultural and forest lands into built-up areas. The increase
in urban growth has been higher in adjacent areas of the cities and built-up areas along the main roads
by creating new cores. Past studies reporting similar findings for Kathmandu valley [61–63] reasoned
that the rate of urbanization and its spread outwards from the urban core increased sharply after the
civil war ended in 2006, which was followed by reinvigorated development. Increasing of grassland
cover (62.36%) also shows that forest lands are being degraded and replaced by grass lands.Sustainability 2020, 12, 3925 11 of 18
Table 1. Composite table of area statistics (km2 and%) of the Kathmandu district in 1990 and 2010.
1990 2010 Overall Change 1
Land Cover Types % Change 2
Area (km2 ) % Area (km2 ) % Area (km2 )
Forest 186.21 42.44 168.93 38.49 −17.27 −9.28
Shrub land 0.15 0.03 0.0027 0.00 −0.15 −98.20
Grass land 2.96 0.67 4.806 1.10 1.85 +62.36
Agricultural 183.11 41.73 165.16 37.63 −17.95 −9.80
Barren area 0.80 0.18 0.6084 0.14 −0.19 −23.95
Sustainability 2019, 11, x FOR PEER REVIEW 11 of 18
Water body 0.47 0.11 0.108 0.02 −0.37 −77.02
Built-up area 65.09 14.83 99.24 22.61 34.15 +52.47
Total
Total 438.79
438.79 100.00
100.00 438.86
438.86 100.00
100.00 0.07
0.07
1 indicates overall change in area of different land cover types between
1 indicates 1990 and 2010. change
overall change in area of different land cover types between 1990 and 2010. 2 indicates percentage
in land cover types between 1990 and 2010.
2 indicates percentage change in land cover types between 1990 and 2010.
4.4. Land Use and Land Cover Change Transition Matrix from 1990–2010
4.4. Land Use and Land Cover Change Transition Matrix from 1990–2010
The land use and land cover matrix from 1990 to 2010 showed important trends in land use
The land use and land cover matrix from 1990 to 2010 showed important trends in land use
transition from one class to another. The distribution of transition between land use classes were
transition from one class to another. The distribution of transition between land use classes were
mapped in Figure 3 and the detailed coverage of area transition from one to another classes in Table 2.
mapped in Figure 3 and the 2detailed coverage of area transition from one to another classes in Table
Overall, a total of 127.26 km of land transitioned from one to another class. This represented about
2. Overall, a total of 127.26 km2 of land transitioned from one to another class. This represented about
29% of the total land area with the highest transition recorded from forest to agricultural land (43%).
29% of the total land area with the highest transition recorded from forest to agricultural land (43%).
Spatially this change has happened in areas further away from existing urban core. In addition, forest
Spatially this change has happened in areas further away from existing urban core. In addition, forest
land is also being transitioned into built-up areas (4.67 km2 ) and grassland (1.92 km2 ). This trend will
land is also being transitioned into built-up areas (4.67 km2) and grassland (1.92 km2). This trend will
threaten biodiversity and ecosystem services as fully functioning forests are cleared. Interestingly,
threaten biodiversity and ecosystem services as fully functioning forests are cleared. Interestingly,
the biggest agricultural land transition is into forest land (40%), partly due to the commendable
the biggest agricultural land transition is into forest land (40%), partly due to the commendable
government support to encourage private and community forests [92]. This transition has offset the
government support to encourage private and community forests [92]. This transition has offset the
otherwise large conversion of forest land into agricultural land. Compared to forest land, significantly
otherwise large conversion of forest land into agricultural land.2 Compared to forest land, significantly
more agricultural land transitioned to built-up area (27.9 km ) with very little area of built-up area
more agricultural land transitioned to built-up area (27.9 km2) with very little area of built-up area
converting to either agricultural or forest lands. As discussed in preceding sections, as the urban area
converting to either agricultural or forest lands. As discussed in preceding sections, as the urban area
expands into the nearby agricultural areas, it has pushed the agricultural areas further into the forests
expands into the nearby agricultural areas, it has pushed the agricultural areas further into the forests
and watersheds. Similar trends have also been reported by Khanal et al. [61] demanding sustainable
and watersheds. Similar trends have also been reported by Khanal et al. [61] demanding sustainable
management of cities including ecosystem-based adaptation pathways.
management of cities including ecosystem-based adaptation pathways.
Figure 3. Distribution of the LULC class that transitioned between 1990–2010.
Figure 3. Distribution of the LULC class that transitioned between 1990–2010.
Table 2. Confusion matrix.
Shrub Grass Agricultural Barren Water Built-up
Forest
land land land area body areaSustainability 2020, 12, 3925 12 of 18
Table 2. Confusion matrix.
Shrub Grass Agricultural Barren Water Built-up
Forest
Land Land Land Area Body Area
Forest 113.68 0.00 1.92 43.62 0.24 0.02 4.67
Shrub land 0.04 0.00 0.00 0.06 0.00 0.00 0.03
Grass land 0.68 0.00 0.05 0.94 0.01 0.00 1.21
Agricultural 40.29 0.00 2.44 103.10 0.29 0.05 27.90
Barren area 0.01 0.00 0.00 0.16 0.00 0.00 0.62
Sustainability 2019, 11, x FOR
Water body 0.02PEER REVIEW
0.00 0.00 0.18 0.01 0.01 0.0512 of 18
Built-up area 0.98 0.00 0.06 3.31 0.03 0.00 58.92
Built-up area 0.98 0.00 0.06 3.31 0.03 0.00 58.92
4.5. Land Use Land Cover Change Prediction
4.5. Land Use Land Cover Change Prediction
The predicted distribution and coverage of different land use and land cover types for the
Kathmandu district in 2030 are presented in Figure 4 and Table 3, respectively.
Figure 4. Potential distribution of LULC types of the Kathmandu district in 2030.
Figure 4. Potential distribution of LULC types of the Kathmandu district in 2030.
Figure 4 shows an overwhelming growth of built-up area outwards indicating the expansion
Figure 4 shows an overwhelming growth of built-up area outwards indicating the expansion of
of urban center that is consuming other land classes especially agricultural land, which in turn is
urban center that is consuming other land classes especially agricultural land, which in turn is
consuming forest land. In particular, there is a new growth of built-up area in the eastern tip of the
consuming forest land. In particular, there is a new growth of built-up area in the eastern tip of the
district indicating a growth of a new urban center. Our analysis predicted that the built-up area would
district indicating a growth of a new urban center. Our analysis predicted that the built-up area
expand by about 19% by 2030 compared to 2010 coverage (Table 3). While there have been no prior
would expand by about 19% by 2030 compared to 2010 coverage (Table 3). While there have been no
studies that predicted land use and land cover changes for the Kathmandu district, these trends are not
prior studies that predicted land use and land cover changes for the Kathmandu district, these trends
only typical characteristics of the Kathmandu district, but across many global cities especially under
are not only typical characteristics of the Kathmandu district, but across many global cities
the business as usual scenarios [93–95]. Figure 4 also show an increase in grassland by 6% especially
especially under the business as usual scenarios [93–95]. Figure 4 also show an increase in grassland
in the previously forested land. While increasing grassland may be beneficial for livestock which is
by 6% especially in the previously forested land. While increasing grassland may be beneficial for
important for agriculture and dairy products, it also indicates deforestation and lack of reforestation
livestock which is important for agriculture and dairy products, it also indicates deforestation and
efforts. Compared to 2010 areas, predicted agricultural land and shrub land would decrease by about
lack of reforestation efforts. Compared to 2010 areas, predicted agricultural land and shrub land
17% and 33%, respectively. Under no intervention scenarios, water bodies would have been reduced
would decrease by about 17% and 33%, respectively. Under no intervention scenarios, water bodies
by 25%, compared to 2010 conditions and as such projects a very bleak future for water and energy
would have been reduced by 25%, compared to 2010 conditions and as such projects a very bleak
security with increased potential for drought.
future for water and energy security with increased potential for drought.
Table 3. LULC prediction statistics of the Kathmandu district for 2030.
LULC classes Area (km2) %
Forest 144.55 −14.43
Scrub land 0.00 −33.33Sustainability 2020, 12, 3925 13 of 18
Table 3. LULC prediction statistics of the Kathmandu district for 2030.
LULC Classes Area (km2 ) %
Forest 144.55 −14.43
Scrub land 0.00 −33.33
Grass land 5.09 +5.84
Agricultural 137.65 −16.67
Barren area 0.58 −4.88
Water bodies 0.08 −25.83
Built-up area 117.65 +18.55
5. Conclusions
Our study used GIS and remote sensing techniques to detect and predict land use and land
cover changes in the Kathmandu district over a 30-year period. Our observations in the Kathmandu
district exhibits the magnitude and extent of threats and challenges that unplanned urbanization trends
occurring at high altitude and land locked locations across the Himalaya will face.
Quantitative evidence from our study also indicate that the Kathmandu district has undergone
significant land use and land cover changes since 1990. Forest and agricultural lands followed by
built-up area dominated the coverage of the study area during the period from 1990 to 2010. However,
rapid increase in urbanization remains a key driver of land use and land cover changes and is taking
over agricultural and forest lands. There is also an overwhelming reduction of water bodies which
calls for urgent adaptation and mitigation plans. Our prediction analysis did not abode well for water,
food and energy securities as well as ecosystem health in the Kathmandu district. Unfortunately,
these trends are not only typical characteristics of the Kathmandu district, but across many global
cities especially under the business as usual scenarios [93–95]. Such trends if unchecked can result
in loss of biodiversity and ecosystem services associated with deteriorating conditions for human
well-being, thereby increasing the vulnerability of humans and ecosystem to small changes in the
system including climate.
A combination of increasing urban population and their livelihoods, unplanned urbanization,
traffic congestion, air pollution and global climate change are responsible for the driving land use and
land cover changes. The city with a population of almost 1.5 million people with high rural-urban
migration compounded by large number of tourists is exceeding the carrying capacity of its unplanned
infrastructure and crippling its ecosystem services. This has resulted in spatial expansion of the urban
cores outwards into agricultural land pushing the farmers further into the nearby watersheds and forests
thereby exacerbating the loss of biodiversity and ecosystem services which are adversely impacting
human wellbeing. The rate of these conversions expedited after 2006, due to rapid urbanization
post-civil war coupled with lack of stringent policies governing land conversions and weak monitoring
in the face of corruption. Under such circumstances, objective assessment of land use and land cover
changes using GIS and remote sensing technology can provide critical information that can help
planners plan development more sustainably.
We recommend that Kathmandu City adopt an ecosystem-based approach to addressing
socio-economic and ecological issues in the city and mainstream such approaches into their short-
and long-term developmental plans. Urban development plans must provide policy and financial
support for implementing smart interventions such as: water harvesting and water conservation;
planting fruit bearing trees along roads and open spaces; provide safe living quarters for those who are
currently living in slums and in vulnerable areas; reduce hard surfaces by converting them into green
spaces; improving public transportation that use green fuels; encourage urban agroforestry programs
to boost food production; restore and protect water sources and watersheds; forest hillsides; and pass
regulations that restrict unplanned development and promote green spaces.Sustainability 2020, 12, 3925 14 of 18
Finally, our prediction study has not taken externalities such as unpredictable natural and
artificial events such as political uprising (war) and disasters such as earthquakes, large fires, etc.
in consideration.
Author Contributions: Conceptualization, S.W.W.; methodology, S.W.W.; B.M.G.; M.L.; software, S.W.W.; B.M.G.;
M.L.; validation, S.W.W.; R.B.K.; formal analysis, S.W.W.; B.M.G.; M.L.; investigation, S.W.W.; resources, S.W.W.;
W.-K.L.; data curation, S.W.W.; B.M.G.; M.L.; writing—S.W.W.; writing—review and editing, R.B.K.; visualization,
S.W.W.; B.M.G.; M.L.; supervision, S.W.W.; project administration, S.W.W.; funding acquisition, S.W.W.; W.-K.L.
All authors have read and agreed to the published version of the manuscript.
Funding: The research was funded by Environmental GIS/RS Center and Ojeong Eco-Resilience Center (OJERI) of
Korea University, South Korea.
Acknowledgments: The authors would like to thank all the city authorities for providing information and urban
residents for participating in discussions and sharing perceptions.
Conflicts of Interest: There is no conflict of interest.
References
1. Shiferaw, H.; Bewlet, W.; Alamirew, T.; Zeleke, G.; Teketay, D.; Bekele, K.; Schaffner, U.; Eckert, S. Implications
of land use/land cover dynamics and Prosopis invasion on ecosystem service values in Afar Region, Ethiopia.
Sci. Total Environ. 2019, 675, 354–366. [CrossRef]
2. Teketay, D. Deforestation, wood famine, and environmental degradation in Ethiopia’s highland ecosystems:
Urgent need for action. Northeast Afr. Stud. 2001, 1, 53–76. [CrossRef]
3. Lambin, E.F.; Turner, B.L.; Geist, H.J.; Agbola, S.B.; Angelsen, A.; Bruce, J.W.; Coomes, O.T.; Dirzo, R.;
Fische, G.; Folke, C.; et al. The cause of land use and land cover change: Moving beyond the myths.
Glob. Environ. Chang. 2001, 11, 261–269. [CrossRef]
4. Lambin, E.F. Modelling and monitoring land-cover change processes in tropical regions. Progr. Phys. Geogr.
1997, 21, 375–393. [CrossRef]
5. Abbas, I.I.; Muazu, K.M.; Ukoje, J.A. Mapping land use-land cover change detection in Kafur local government,
Katsina, Nigeria (1995–2008) using remote sensing and GIS. Res. J. Environ. Earth Sci. 2010, 2, 6–12.
6. Screenivasulu, V.; Bhaskar, P.U. Change detection in land use and land cover using remote sensing and GIS
techniques. Int. J. Eng. Sci. Technol. 2010, 2, 7758–7762.
7. Hassan, M.M.; Nazem, M.N.I. Examination of land use/land cover changes, urban growth dynamics,
and environmental sustainability in Chittagong city, Bangladesh. Environ. Dev. Sustain. 2015, 18, 9672–9678.
[CrossRef]
8. Torbick, N.M.; Qi, J.; Roloff, G.J.; Stevenson, R.J. Investigating impacts of land-use land cover change on
wetlands in the Muskegon river watershed, Michigan, USA. Wetlands 2006, 26, 1103–1113. [CrossRef]
9. Sala, O.E.; Chapin, F.S.; Armesto, J.J.; Berlow, E.; Bloomfield, J.; Dirzo, R.; Huber-Sanwald, E.; Huenneke, L.F.;
Jackson, R.B.; Kinzig, A.; et al. Global biodiversity scenarios for the year 2100. Science 2000, 287, 1770–1774.
[CrossRef]
10. Batisani, N.; Yarnal, B. Urban expansion in Centre County, Pennsylvania: Spatial dynamics and landscape
transformations. Appl.Geogr. 2009, 29, 235–249. [CrossRef]
11. Liping, C.; Yujun, S.; Saeed, S. Monitoring and predicting land use and land cover changes using remote
sensing and GIS techniques—A case study of a hilly area, Jiangle, China. PLoS ONE 2018, 13, e0200493.
[CrossRef] [PubMed]
12. Rojas, C.; Pino, J.; Basnou, C.; Vivanco, M. Assessing land-use and cover changes in relation to geographic
factors and urban planning in the metropolitan area of concepcion’ (Chile). Implications for biodiversity
conservation. Appl. Geogr. 2013, 39, 93–103. [CrossRef]
13. Jianchu, X.; Fox, J.; Vogler, J.B.; Yongshou, Z.P.F.; Lixin, Y.; Jie, Q.; Leisz, S. Land use and land cover change
and farmer vulnerability in Xishuangbanna Prefecture in Southwestern China. Environ. Manag. 2005, 36,
404–413. [CrossRef] [PubMed]
14. Li, L.; Lu, L.; Kuang, D. Examining urban impervious surface distribution and its dynamic change in
Hangzhou Metropolis. Remote Sens. 2016, 8, 265. [CrossRef]
15. Basommi, L.P.; Guan, Q.-F.; Cheng, D.-D.; Singh, S.K. Dynamics of land use change in a mining area: As case
study of Nadowli District, Ghana. J. Mt. Sci. 2016, 13, 633–642. [CrossRef]You can also read