Industry survey turbot and brill in the North Sea - WUR E-depot
←
→
Page content transcription
If your browser does not render page correctly, please read the page content below
Industry survey turbot and brill in the North
Sea
 Set up and results of a fisheries-independent survey using commercial fishing vessels 2018-2020

Authors: Edward Schrama, Niels Hintzena, Jurgen Batsleera, Tony Wilkesa, Katinka Bleekera,   Wageningen University &
Morgane Amelota, Wouter van Broekhovenb, David Rasb, Emma de Boerc, Brita Trapmanc,          Research report C037/21
Nathalie A. Steinsa
Industry survey turbot and brill in the North
Sea

Set up and results of a fisheries-independent survey using commercial fishing vessels 2018-2020

Authors:           Edward Schrama, Niels Hintzena, Jurgen Batsleera, Tony Wilkesa, Katinka Bleekera, Morgane
                   Amelota, Wouter van Broekhovenb, David Rasb, Emma de Boerc, Brita Trapmanc, Nathalie A.
                   Steinsa

a
    Wageningen Marine Research
b
    Cooperatie Kottervisserij Nederland U.A. (VisNed)

c
    Nederlandse Vissersbond

Wageningen Marine Research
IJmuiden, April 2021

                                                        Wageningen Marine Research report C037/21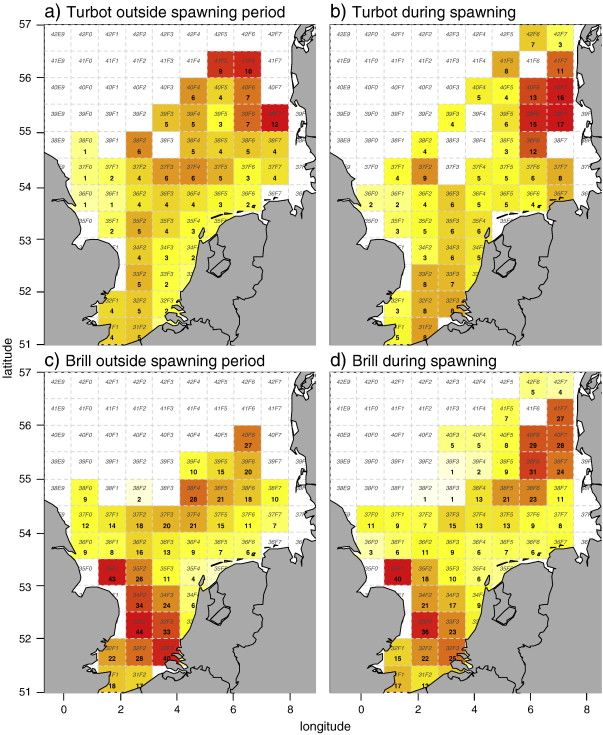
Keywords: Industry survey, turbot, brill, stock assessment
European Union, European Maritime and Fisheries Fund (EMFF)
Client: Rijksdienst voor Ondernemend Nederland
Attn.: A.P.M. Vaessen
Postbus 93144
2509 AC, Den Haag
This report can be downloaded for free from https://doi.org/10.18174/544588
Wageningen Marine Research provides no printed copies of reports
Wageningen Marine Research is ISO 9001:2015 certified.
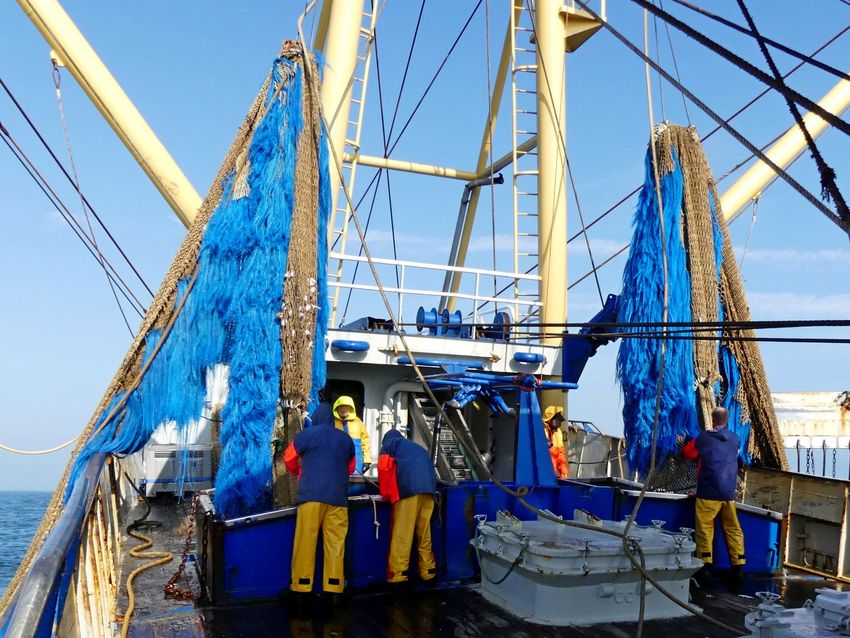
Photo cover: Edward Schram
© Wageningen Marine Research
Wageningen Marine Research, an institute Wageningen Marine Research accepts no liability for consequential damage, nor
within the legal entity Stichting for damage resulting from applications of the results of work or other data
Wageningen Research (a foundation under obtained from Wageningen Marine Research. Client indemnifies Wageningen
Dutch private law) represented by Marine Research from claims of third parties in connection with this application.
Dr. ir. J.T. Dijkman, Managing director All rights reserved. No part of this publication may be reproduced and / or
published, photocopied or used in any other way without the written permission
of the publisher or author.
KvK nr. 09098104,
WMR BTW nr. NL 8113.83.696.B16.
Code BIC/SWIFT address: RABONL2U
IBAN code: NL 73 RABO 0373599285
2 of 52 | Wageningen Marine Research report C037/21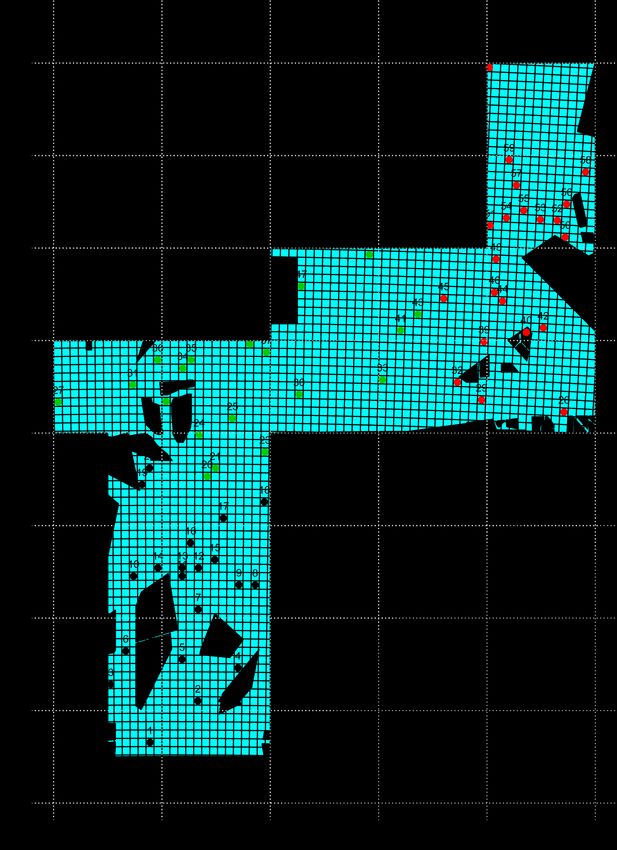
Contents

Industry survey turbot and brill in the North Sea                                                             1

Samenvatting                                                                                                  5

Summary                                                                                                       7

1      Introduction                                                                                           8

       1.1   Background                                                                                       8
       1.2   Initial pilot industry survey                                                                    8
       1.3   Industry survey turbot and brill                                                                 9
       1.4   Guide for readers                                                                                9

2      Survey design and implementation                                                                      10

       2.1   Introduction                                                                                    10
       2.2   Survey 2018                                                                                     10
             2.2.1    Original survey design                                                                 10
             2.2.2    Practical implementation and evaluation of the 2018 survey                             13
             2.2.3    Conclusions and lessons learned                                                        14
       2.3   Survey 2019                                                                                     14
             2.3.1    Modifications to the survey design                                                     14
             2.3.2    Practical implementation of the 2019 survey                                            16
             2.3.3    Evaluation 2019 survey                                                                 17
             2.3.4    Conclusions and lessons learned                                                        18
       2.4   Survey 2020                                                                                     18
             2.4.1    Modifications to the survey design                                                     18
             2.4.2    Practical implementation 2020 survey                                                   21
             2.4.3    Evaluation 2020 survey                                                                 21
             2.4.4    Conclusions and lessons learned                                                        22
       2.5   Otolith sampling                                                                                22
       2.6   Data management                                                                                 23

3      Results                                                                                               24

       3.1   Contribution to stock assessment data                                                           24
       3.2   Age-length keys                                                                                 28
             3.2.1    Model selection and parameterization                                                   28
             3.2.2    Goodness of fit of the age-length keys                                                 29
             3.2.3    Temporal distributions                                                                 31
             3.2.4    Spatial-temporal distribution of survey locations                                      34
             3.2.5    Outcomes ALK                                                                           35

4      Conclusions and recommendations                                                                       37

       4.1   Survey design                                                                                   37
       4.2   Added value of the industry survey                                                              37
       4.3   Requirements for implementation in stock assessments                                            38
       4.4   Collaboration                                                                                   39
             4.4.1    Science industry research collaboration                                                39
             4.4.2    International Research partnership                                                     39
       4.5   Summarising conclusions and recommendations                                                     40
       4.6   Acknowledgements                                                                                40

                                                           Wageningen Marine Research report C037/21   | 3 of 52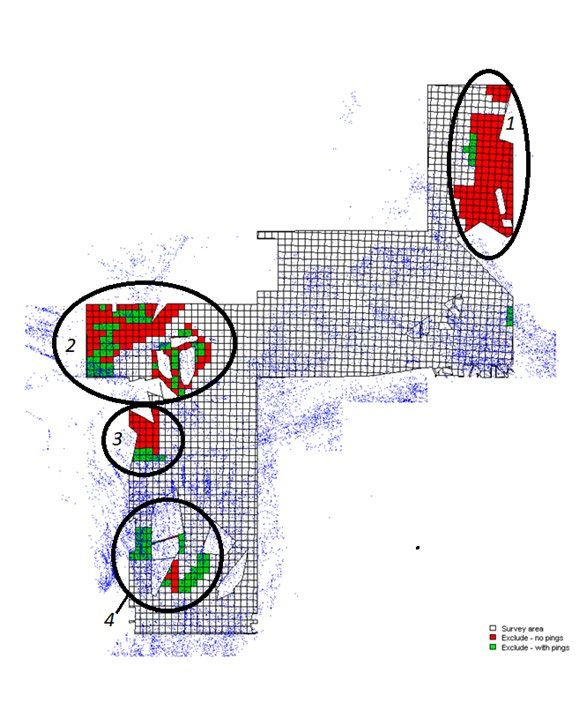
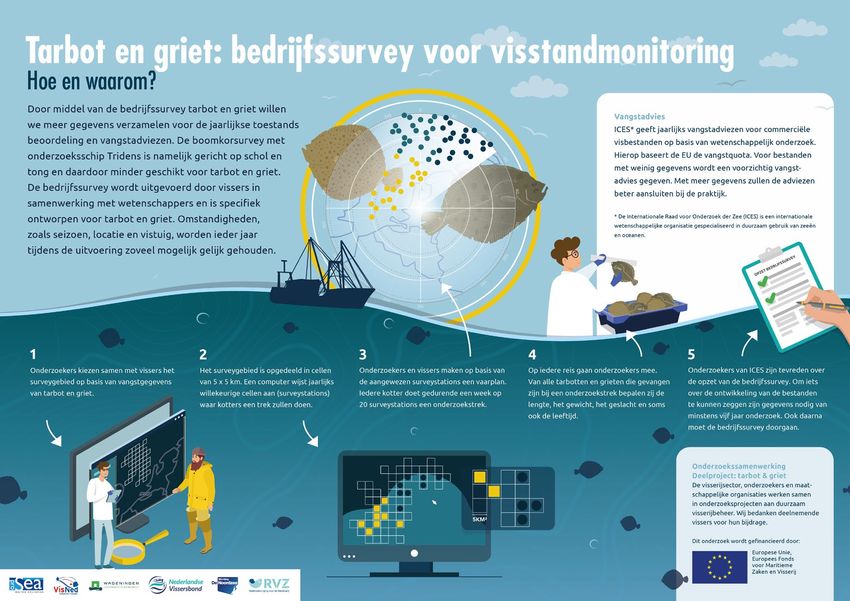
5      Quality Assurance                                41

References                                              42

Justification                                           43

Annex 1 Age-Length Keys (ALK)                           44

Annex 2 Infographic Industry Survey                     51

4 of 52 |   Wageningen Marine Research report C037/21
Samenvatting

De platvissen tarbot (Scophthalmus maximus) en griet (Scophthalmus rhombus) in de Noordzee zijn
belangrijke commerciële bijvangsten voor de Nederlandse visserij. De Internationale Raad voor
Onderzoek der Zee (ICES) geeft op basis van zogenaamde bestandsschattingen advies aan de
Europese Commissie over de maximale hoeveelheid te vangen vis. Dit advies vormt de basis voor het
vaststellen van de vangstquota door de Europese visserijministers.

Griet is momenteel een data-arme soort ('data limited stock'). Daarom gebruikt ICES voor de
bestandsschatting een methode die is gebaseerd op trends in de commerciële aanlandingen per
eenheid visserijinspanning (LPUE, 'landings per unit of effort'). Vanwege deze methode valt griet voor
ICES in categorie 3 en is deze bestandsschatting met veel onzekerheden omgeven. Voor tarbot zijn er
meer gegevens beschikbaar, waardoor de advisering gebaseerd kan worden op een volledige
analytische beoordeling. Desondanks bestaat er nog aanzienlijke onzekerheid in de beschikbare
gegevens over het bestand, wat de algehele kwaliteit van de beoordeling ondermijnt.

Volgens de ICES moet een nieuwe gestandaardiseerde bestandsopname met een hogere
vangstefficiëntie van grote platvis worden ontwikkeld om de beoordeling van deze soorten te
verbeteren. Om deze reden werd een speciale bedrijfssurvey voor tarbot en griet ontworpen en
uitgevoerd. Het project besloeg een periode van drie jaar en werd gefinancierd uit de regeling
Samenwerkingsprojecten Wetenschap en Visserij in het kader van het Nederlandse operationele
programma voor het Europees Fonds voor Maritieme Zaken en Visserij.

Het ontwerp van de survey is het resultaat van drie jaarlijkse cycli van uitvoering, evaluatie met
vissers en met onderzoekers binnen ICES en wijziging van het oorspronkelijke ontwerp. Het
oorspronkelijke ontwerp is gemaakt bij de start van het project in 2018. In het definitieve ontwerp
(2019-2020) is het onderzoeksgebied gebaseerd op de vangst van tarbot en griet en de ruimtelijke
spreiding van de boomkorvloot (VMS-data). Het gebied werd bijgesneden tot een haalbare grootte
voor drie kotters, waarbij rekening werd gehouden met hun normale visgronden. Huidige en
toekomstige voor visserij gesloten gebieden (bijv. N2000-gebieden, windparken) werden uit het
surveygebied verwijderd en er werd een raster van 5x5 km toegepast op het surveygebied.

In het definitieve surveyontwerp wordt het onderzoek jaarlijks uitgevoerd in september-oktober. De
meetstations worden jaarlijks opnieuw vastgesteld door een willekeurige trekking van 60 rastercellen,
die vervolgens gelijk worden verdeeld over drie schepen. De meetstations worden tijdens gewone
visweken bevist door de deelnemende schepen. De schippers krijgen de opdracht hun vistuig in de
geselecteerde rastercellen uit te zetten om een surveytrek te starten. Daarna zijn schippers vrij om de
route van de surveytrek te bepalen. Voor elke surveytrek worden alle tarbot en griet uit de vangst
gesorteerd. De aantallen per soort en lengte en gewicht van individuele vissen worden bepaald door
onderzoekers aan boord. Geslacht en leeftijd (op basis van otolieten) worden bepaald voor een
subgroep.

In 2020 konden onderzoekers niet mee aan boord van de kotters vanwege COVID-19-beperkingen.
Daarom werden alle op de meetstations gevangen tarbot en griet door de bemanningen van de
schepen verzameld, gelabeld en aan het einde van de visweek overgedragen aan de onderzoekers
voor verwerking van de survey-vis aan land.

De data die in 2019 en 2020 met de bedrijfssurvey zijn verzameld, zijn beschikbaar gesteld via de
ICES-databank voor surveygegevens, DATRAS.

Geconcludeerd wordt dat het huidige surveyontwerp uitvoerbaar is en kan worden gebruikt voor de
voortzetting van de bedrijfssurvey. De bedrijfssurvey levert naast bestaande surveys een aanzienlijke
hoeveelheid extra gegevens op. De toegevoegde waarde van deze extra gegevens voor de

                                                            Wageningen Marine Research report C037/21   | 5 of 52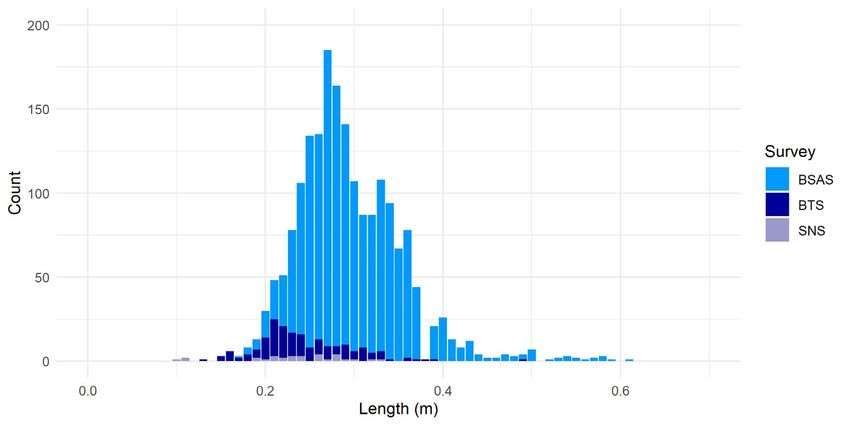
toestandsbeoordelingen van de tarbot en griet bestanden moet echter nog worden bepaald in een
ICES-benchmark. Om een ICES-benchmark aan te kunnen vragen en om de minimaal vereiste
tijdreeks van 5 jaar te verkrijgen voor gebruik van de data, moet de survey nog minstens drie jaar
worden voortgezet (tot 2023). De schippers en bemanning van de deelnemende schepen en de
sectorvertegenwoordigers zijn gemotiveerd om de survey de komende jaren voort te zetten. De
subsidieaanvraag voor de voortzetting van de bedrijfssurvey tot en met 2023 werd begin 2021
gehonoreerd.

6 of 52 |   Wageningen Marine Research report C037/21
Summary

The flatfish species turbot (Scophthalmus maximus) and brill (Scophthalmus rhombus) in the North
Sea are important commercial bycatches for the Dutch commercial fleet. Based on so-called stock
assessments, the International Council for the Exploration of the Sea (ICES) advises the European
Commission on fishing opportunities. Brill is currently a data-limited species, which is why ICES for its
stock assessment uses a method based on trends in the commercial landings per unit of effort.
Because of this method, brill falls into ICES category 3 and its assessment is associated with
uncertainties. For turbot more data are available and the advice for turbot is currently based on a full
analytical assessment. Nevertheless, there is still considerable uncertainty in the input data which
undermines the overall quality of the assessment. According to ICES a new standardized survey with
higher catch rates for large flatfish should be developed to improve assessments for these species. For
this reason a dedicated industry survey for turbot and brill was designed and implemented. The
project covered a period of three years and was funded by a science-fisheries partnership grant under
the Dutch Operational Programme for the European Maritime and Fisheries Fund.

The survey design is the result of three annual cycles of implementation, evaluation with fishermen
and international scientists in the context of ICES and modification of the original survey design. The
original design was made at the start of the project in 2018. In the final design (2019-2020), the
survey area was based on turbot and brill catches (LPUE), spatial distribution of the beam trawl fleet
(VMS data). The area was cropped to a feasible size for three vessels taking into account their normal
fishing grounds. Current and future areas closed for fisheries (e.g. N2000 areas, wind farms) were
removed and a 5x5 km grid was applied to the survey area.

In its final design, the survey is conducted annually in September-October. The survey stations for
each year result from a random draw of 60 grid cells, which are then equally divided over three
vessels. Survey stations are fished during regular fishing weeks by the participating vessels. The
skippers are instructed to deploy their fishing gear and start a survey haul anywhere within the grid
cells selected as survey stations. After that, skippers are free to determine the route of the survey
haul. For each survey haul all turbot and brill are sorted from the catch. Numbers per species and
length and weight of individual fish are determined by researchers on board. Sex and age (based on
otoliths) are determined for a subset. In 2020 researchers were unable to board the fishing vessels
due to COVID-19 restrictions. Therefore all turbot and brill caught at the survey stations were
collected and labelled by the vessel’s crews for processing onshore by researchers.

Survey data collected in 2019 and 2020 according to the final survey design have been made available
via the ICES database DATRAS.

It is concluded that the current survey design is appropriate and feasible and can be readily used for
continuation of the industry survey. The survey provides a significant amount of data in addition to
existing surveys. However, the added value of these data for stock assessments remains to be
determined in an ICES benchmark. To successfully request an ICES benchmark as well as obtain the
minimal required timeseries of 5 years to use the survey data in stock assessments, the survey needs
to be continued for at least another three years (until 2023). The skippers and crew are motivated to
continue the survey in the next years. Also the fisheries associations are fully committed to this survey
and its continuation. A follow-up grant proposal (2021-2023) has been successfully submitted.

                                                             Wageningen Marine Research report C037/21   | 7 of 52
1 Introduction

1.1 Background
Turbot (Scophthalmus maximus) and brill (Scophthalmus rhombus) in the North Sea are important
commercial bycatches for the Dutch commercial fleet. While the International Council for the
Exploration of the Sea (ICES) provides individual advice on fishing opportunities for both species, they
are managed under a joint Total Allowable Catch (TAC) under the European Common Fisheries Policy
(CFP). Since 2019, both species are managed under the European landing obligation, which means
that discarding is no longer allowed unless an exemption has been granted. Currently, turbot is
exempt from the landing obligation for beam-trawlers (80-199mm mesh and >120mm mesh) (VisNed,
2021). While discarding of these high-value species historically has been limited, there are indications
that in the years prior to 2019, discarding increased as a result of quota restrictions and the response
of Dutch Producers' organisations (POs). Within their remit under the market policy of the CFP, the
POs took measures to prevent early exhaustion of the quota and increased the minimum landing size
for turbot. While these PO measures where relaxed as of 2017, discarding in 2017 and 2018 remained
high. Discards are not included in the assessment (ICES, 2019a).

The reliability of the catch data, which is the most important link in the status assessment, especially
for turbot, and the commercial biomass index based on it have thus decreased. This in turn leads to
further catch limits and more discards. This situation has direct consequences for the sustainable
management of these stocks. Another factor in this context is that both turbot and brill form a 'choke
species' in the context of both the CFP's landing obligation and the multi-annual management plan for
North Sea demersal fisheries (MAPNS) (EU, 2018). In its advice for fishing opportunities for turbot and
brill, ICES indicates that an index based on a fisheries-independent survey that covers the distribution
area and the different length classes would improve the stock assessments (ICES, 2015; 2019a).

Brill is currently a data-limited species and ICES advice is given on the basis of a category 3
assessment, which is based on commercial landing per unit of effort trends. Turbot in the North Sea is
currently a category 1 stock, with a full analytical assessment. The stock was upgraded following the
2018 ICES inter-benchmark (ICES, 2018a). The stock is assessed using an age-structured model
(SAM), which relies on age-composition data from two fisheries-independent surveys (SNS and BTS-
ISIS), commercial landings (discards currently not included), as well as a commercial LPUE index.
Despite recent improvements in the assessment methodology, there is still considerable uncertainty in
the input data which undermines the overall quality of the assessment. The ICES inter-benchmark
therefore recommended: "Currently, scientific surveys show relatively poor performance (due to low
catch rates) in assessments of large flatfish. A new standardized survey with higher catch rates for
large flatfish should be developed to improve assessments for these species" (ICES, 2018a).

1.2 Initial pilot industry survey
In 2013-15, the Dutch fishing company Ekofish Group and the NGO Stichting de Noordzee (North Sea
Foundation) commissioned a study into the possible contribution of a fisheries-independent industry
survey towards improving the status assessments of four flatfish species associated with the target
species common sole (Solea solea) and plaice (Pleuronectus platessa): (1) turbot, (2) brill, (3) lemon
sole (Microstomus kitt), and (4) dab (Limanda limanda). This study showed that an industry survey is
technically feasible and for turbot and brill can make an important contribution to the improvement of
the stock assessments. There are two reasons for this. First, in the pilot industry survey the catch
success of turbot and brill was larger compared to the annual research survey, the Beam-Trawl Survey
(BTS, see ICES, 2019b). Second, in the pilot industry survey also the age groups 1-9 were caught
whereas the BTS catches are limited to 1-4 years. Inclusion of new (industry) survey data in the ICES

8 of 52 |   Wageningen Marine Research report C037/21
stock assessments requires, however, a longer time series (Van der Reijden et al., 2015). This longer
time series could not be developed as the pilot study did not continue. First, , it was not possible to
raise the funding to set up an industry survey for turbot and brill. Second, at the time, the
development of an industry survey was complicated by concerns amongst the main national fisheries
associations. They worried that improvements in the stock assessment for the 'associated species'
turbot and brill would eventually lead to their inclusion in the Individual Transferable Quota (ITQ)
system for the target species common sole and plaice (Van Hoof et al., 2020). The industry considers
ITQs for associated species undesirable.

1.3 Industry survey turbot and brill
The persistent catch restrictions and increasing discards, the landing obligation and the Multi Annual
Plan North Sea (MAPNS), caused a shift in the Dutch industry's support for conducting a turbot and
brill industry survey and finding long-term funding to build up a time series. It is also clear that an
improved stock assessment does not have to translate into an ITQ system; after all, this would be a
national policy decision for which there must be support. A dedicated industry survey for turbot and
brill designed to complement the shortcomings of the current research surveys funded under the
European Data Collection Framework (DCF) would improve the knowledge base in support of
sustainable mixed fisheries management in the North Sea. This is also highlighted in the ICES advice
for both stocks (ICES, 2015; 2019a). As there were no funding resources under the Dutch DCF, a
science-industry research collaboration project proposal (Onderzoekssamenwerking 2.0) was
successfully submitted under the European Fund for Maritime Affairs and Fisheries (EMFF). The project
consortium comprises Wageningen Marine Research (WMR), the main fisheries organisations
(Nederlandse Vissersbond, VisNed, Redersvereniging voor de Zeevisserij), and the environmental NGO
Stichting de Noordzee and educational NGO ProSea.

The fisheries-independent industry survey turbot and brill (BSAS) started in 2018. EMFF funding
covered the period until 2020. For the continuation of the time series a follow up project (2021-2023)
has been successfully submitted. Three beam-trawl vessels cover the survey area and, together with
scientists from Wageningen Marine Research, sample a total of ca. 60 survey stations. The survey was
set up and improved along the way in consultation with the ICES Working Group on the Assessment of
Demersal Stocks in the North Sea and Skagerrak (WGNSSK). This report provides information on the
set up of the survey, its results and conclusions and recommendations.

1.4 Guide for readers
In chapter 2, we present the BSAS survey methodology. This includes the initial set up and changes
that were made following evaluation with the participating skippers and the WGNSSK. It also includes
otolith sampling and data management, including availability for the ICES DATRAS database. Chapter
3 presents the results of the first 3 years of the BSAS, followed by conclusions and recommendations
in chapter 4. The report is written in English to make it accessible to an international audience and in
particular the ICES WGNSSK and future benchmarks groups.

                                                              Wageningen Marine Research report C037/21   | 9 of 52
2 Survey design and implementation
2.1 Introduction
The design for the industry survey turbot and brill (bedrijfssurvey tarbot en griet, BSAS) is the result
of three annual cycles of implementation, evaluation and modification of the original survey design
made at the start of the project. This process is chronologically described below with the objective to
document all considerations and decisions made that led to the final survey design.
2.2 Survey 2018
2.2.1 Original survey design
2.2.1.1 Sources of variation
At the start of the project in 2018 a first survey design was made. The design was bound to the
availability of three commercial fishing vessels and one fishing week per vessel per year for a period of
three years. The survey design aimed to reduce or eliminate all factors that may contribute to
variation in yearly catches, except changes in stocks. An analysis of potential sources of variation in
turbot and brill catches in consecutive years and options for their elimination or reduction resulted in
the following conditions to be met by the survey design (Table 1).
Table 1 Sources of variation in turbot and brill catches and conditions to be met by the survey design to
eliminate or reduce variation.
Sources of variation to be eliminated or Conditions
reduced
Inhomogeneous distribution of fish Once chosen, locations of hauls are fixed: hauls
are always at the same locations.
Seasonal variation in fish density due to Survey period is fixed, same period every year
(spawning) migration.
Fishing effort / Haul duration Fishing effort (haul duration, fishing speed) will be
standardized as much as possible and documented
at haul level.
Catch efficiency of gear Per vessel always use the same standardized gear.
Fishing conditions Survey period is fixed, same period every year.
Conditions with known (negative) effects on
catches (e.g. strong NW winds) will be avoided at
the costs of not doing the surveys in exactly the
same weeks every year.
Vessels The same vessels with their standardized gears are
used each year.
Gear type Fixed combinations of gear type and survey
locations.
Survey area The survey area is fixed
2.2.1.2 Survey area
First we selected ICES rectangles based on LPUE data. Figure 1 (taken from Van der Hammen et al.,
2013) shows the LPUE of turbot heavier than 4 kg and brill heavier than 1 kg by beam trawling
outside and during the respective spawning seasons. Because the survey was scheduled to be
conducted in September, only the LPUE data outside the spawning season (panels a) and c) in Figure
1) were considered. We distinguished four different types of locations: hot spots, warm spots, cold
spots and no go-areas (Table 2). Given Figure 1, two hotspots roughly appear: 1) German bight –
10 of 52 | Wageningen Marine Research report C037/21Danish west coast (mainly turbot) and 2) most Southern North Sea (mainly brill). Other maps with
beam trawl LPUE for 2007 to 2016 (not shown) showed annual variation in LPUE for both turbot and
brill indicating that local abundancy may vary between years. Brill seems less patchy than turbot.
Figure 1. LPUE (kg/day at sea) per ICES rectangle for the Dutch beam trawl fleet > 221 kW, of the largest
market category (1) consisting of > 4 kg turbot or > 1 kg brill, averaged over 2004–2010. a,c: outside
spawning period (turbot: Jan–Apr and Aug–Dec, brill: Jan–Feb and Aug–Dec). b,d: during spawning period
(turbot: May–Jul, brill: Mar–Jul). Only those rectangles are selected where turbot (a,b) or brill (c,d) was
caught in all years 2004–2010. The colours indicate the levels of the LPUE. (taken from Van der Hammen et
al., 2013).
Wageningen Marine Research report C037/21 | 11 of 52It was decided that the survey area will include ‘hot spots’ and ‘warm spots’ but not ‘cold spots’ and
(obviously) ‘no-go areas’. The rationale behind this survey location selection is that surveying ‘cold
spots’ was considered non informative. At the hotspots, large catches can be expected as required to
obtain sufficient numbers of fish in the survey. However, changes in abundance are probably not
easily or early detected at hot spots as the abundancies at hot spots may be the last to decline in case
of population decline while population increase may not be detected at hot spots where the maximum
density possibly already has been reached. We expected that population increase and decrease are
easiest and earliest detected at locations that provide suboptimal habitats; the ‘warm spots’.
Table 2. Types of locations with the survey area.
Type of location Characteristics Included in the
survey?
Hot spots Locations with an (expected) relatively high Yes
abundance of turbot and brill.
Warm spots Locations around or between hot spots Yes
where turbot and brill are expected to be
present but in lower numbers.
Cold spots Locations where turbot and brill are expected No
to be absent, either based on anecdotic
information, previous surveys on habitat
characteristics.
No-go areas Areas that cannot be fished or were fishing is No
not permitted now or in the near future
(wind farms, wrecks, etc.)
Hot spots and warm spots were identified at the level of ICES rectangles based on LPUE and/or CPUE
data. Fishermen were consulted to identify areas that cannot be fished. This resulted in three survey
areas (Figure 2). Each area consisted of 6-7 ICES rectangles, including some half rectangles and
resulting in 5.5 ICES rectangles per sub-area and vessel. Per ICES rectangle two haul locations
(stations) were randomly selected from a list of BTS survey stations. In addition the skippers were
allowed to choose two additional ‘free’ survey stations in each ICES rectangle. This resulted in a total
of four survey hauls per ICES rectangle, 22 survey stations (11 assigned, 11 freely chosen) per sub-
area and vessel, and 66 survey stations in total.
Survey stations were considered starting points for the survey hauls. In year 1 skippers were free to
choose the route of the haul starting from a survey station. Once these routes were established in
year 1 (and recorded in the vessels’ navigation equipment) they were considered fixed for the entire
life-span of the survey as well as linked to one vessel with its gear. The skippers determined an
optimal route passing all stations assigned to their vessel.
2.2.1.3 Data and otolith collection
Data and otoliths are collected during survey hauls. Survey hauls are regular commercial hauls of
approximately 100-120 min. For each survey haul all turbot and brill were sorted from the catch. Upon
completion of the sorting of the entire catch, two researchers processed the collected turbot and brill.
For each fish its species, length, weight and sex were determined. Otoliths were collected from two
fish per cm-class per ICES rectangle (subject to availability in the catches). A trawl list was completed
by the skipper to record conditions at haul level. The gears were characterized by completing a
‘benthis list’ for each vessel (confidential) and mesh size measurements (20 stretched meshes per
cod-end, using an OMEGA meter).
12 of 52 | Wageningen Marine Research report C037/21Figure 2. Survey areas for the 2018 industry survey turbot and brill.
2.2.2 Practical implementation and evaluation of the 2018 survey
2.2.2.1 Evaluation by project team
Two survey weeks with two vessels were completed in 2018. The third week with the third vessel was
postponed multiple times due to poor weather conditions before being cancelled because it could no
longer be conducted in the same period of the year as the other two survey weeks. The combination
of fixed and free survey locations was not successful. The main reason for introducing the ‘free hauls’
was an interest in the ability of skippers to actively target turbot and brill. Addressing this question
was however never an objective of the industry survey. In practice it appeared that the ‘free hauls’
were not free. Instead their starting location and route was dictated by the surrounding fixed survey
locations.
2.2.2.2 ICES WGNSSK 2018 and 2019
Prior to the first survey, Wouter van Broekhoven, scientist of VisNed, presented the plans for the BSAS
survey and initial survey design to the ICES WGNSSK in 2018 (ICES, 2018b). Various possibilities and
considerations for the survey design were given by the group. For example, a short discussion was
held on the pros and cons of aiming for the three survey vessels to undertake the survey in the same
week versus in separate weeks. The former has the advantage of reducing variability due to factors
such as the weather or moon phase, but practical considerations such as availability of staff would
probably dictate carrying out the survey in separate weeks. Another discussion concerned criteria for
defining the survey area, such as known occurrence based on surveys, or landings combined with
VMS, or anecdotal evidence. Individual conversations were held following the plenary presentation to
Wageningen Marine Research report C037/21 | 13 of 52get a broader perspective on these and other points of consideration for the survey design. Input was
taken into account in the above described survey design for 2018.
The survey design and practical experiences of the first survey year (2018) were presented to the
2019 meeting of the WGNSSK by Wouter van Broekhoven (VisNed) with the objective of informing the
WG on the survey and to receive feedback. Feedback by the working group was deemed useful to
further improve the survey design as well as facilitate future acceptance of the survey data for use in
stock assessments.
Specific issues relating to the design of the survey were put to the WGNSSK group for discussion.
Useful feedback was provided by the group (ICES, 2019c), which then fed into the design of the
survey from 2019 onwards. One issue which was discussed was the gear used, because one of the
vessels in 2018 used a pulse gear. After the survey had started it became clear however, that this
gear would be banned as of 2021. The WGNSSK advised to switch from the pulse gear to an
alternative gear immediately as of 2019, rather than continue using the pulse gear and risk causing an
irreparable break in the data series in 2021. Comparative fishing between the pulse gear and the
alternative e.g. classic beam trawl with tickler chains in order to establish a conversion factor was
considered very uncertain in terms of expected success. The issue with the distance between survey
stations needing to be covered in the current survey design was also discussed, in conjunction with
perceived difficulties relating to the statistical treatment of the combination of predetermined and free
hauls. An arrangement used in a joint Danish / Swedish survey using a relatively fine-scale permanent
grid from which cells are randomly assigned each year within which skippers are free to execute the
hauls as they see fit was offered as a potential alternative setup. In general it was advised not to
maintain the ICES rectangles as the basis for the definition of the survey zones if this leads to overly
large distances to be covered. The discussions on gear and spatial survey design together led the
group to advise to redesign the survey from 2019 and consider 2018 as a pilot year. A redesign which
will be kept stable starting from 2019 was considered the most robust approach to building a data
series which is likely to be used in the stock assessments of turbot and brill in future.
2.2.3 Conclusions and lessons learned
The survey design seems feasible in terms of the ability of the participating vessels to cover their
share of the survey stations within the survey area in a regular fishing week. The survey area nor the
number of stations seem too large. However, the WGNSSK gave clear recommendations for
modification of the survey design to be addressed before the next survey in 2019 (WGNSSK, 2019c).
2.3 Survey 2019
2.3.1 Modifications to the survey design
For 2019 the survey design was revised. The main reason for the revision was the ban on pulse
trawling. Catch efficiency of turbot and brill probably differs between pulse and conventional tickler
chain beam trawling. As a consequence, replacing a pulse trawler by a beam trawler will result in a
break in the time series of data. Given the possible complete ban on pulse trawling, WGNSSK
recommended to replace the participating pulse trawler by a conventional beam trawler using tickler
chains immediately to secure continuity of the survey (ICES, 2019c). This combined with only two of
the three survey weeks being completed in 2018, rendered the data collected in 2018 unusable for a
time series. Now that 2018 was lost for the time series anyway, we were free to completely revise the
survey design for 2019 and years beyond based on the lessons learned in 2018. The revision of the
survey design included the following changes compared to the 2018 design:
1. The use of ICES rectangles as a grid defining the survey area was abandoned;
2. The inclusion of two types of survey hauls, fixed and free, was abandoned;
3. The fixed survey locations, i.e., return to each location every year was abandoned.
Survey area
To (re)define the survey area data on turbot and brill catches (LPUE) and beam trawl fleet data (VMS)
were considered in the following step-wise process:
14 of 52 | Wageningen Marine Research report C037/211. Calculate LPUE for turbot in the southern North Sea over a 6 year period (2007-2009 and
2012-2014) (Figure 3A)
2. Define the positions were 60% of the LPUE is realized, combine these positions and draw a
polygon around it (Figure 3B)
3. Crop the area to a feasible size for three vessels, taking into account their normal fishing
grounds (Figure 3C).
4. Remove current and future areas closed for fisheries (N2000, wind farms) and apply a 5x5 km
grid to the survey area (Figure 3D)
A B
C D
Figure 3. Stepwise construction of the survey area.
Assignment of survey stations
Each grid cell in the survey area is a potential survey station. Each year 60 grid cells are to be
randomly selected using an R-script. Because the cutting out of unfishable areas resulted in some cells
having irregular shapes and smaller surface areas than regular 5x5 km grid cells, the probability of
being randomly selected as survey station was made proportional to their surface areas. The selected
survey stations are then equally (~ 20 survey stations each) distributed over the participating vessels
on the basis of their normal fishing grounds. A detailed protocol for the random selection of survey
stations using the R-script and their distribution of the vessels was written (in Dutch, not included in
this report).
Survey hauls
Wageningen Marine Research report C037/21 | 15 of 52The skippers are instructed to start the survey hauls, i.e., deploy their fishing gear anywhere within the grid cells selected as survey stations between 7:00 a.m. and midnight. After that, the skippers are free to determine the route of the survey haul. Thus only the starting point of a survey haul and the period during the day are dictated by the survey protocol. Other than that, survey hauls are no different from regular, 100-120 min commercial hauls. Next to the approximately 20 survey hauls, each skipper conducts some 20 regular ‘no survey hauls’ to fill up the fishing week to a regular total of some 40 hauls. The skippers are free to choose in which order the survey stations assigned to them are fished and how they alternate survey hauls with ‘no survey hauls’. In practice the ‘no survey hauls’ are either used to cover distances between survey stations while fishing or for fishing in the period between midnight and 7:00 a.m. Data collection Data are collected during survey hauls at the survey stations. Data collection was not modified from the 2018 design except for the collection of otoliths (see next paragraph). For each survey haul all turbot and brill were sorted from the catch. Upon completion of the sorting of the entire catch, two researchers determined species, length, weight and sex for the collected turbot and brill. Otolith collection Analysis (see 3.5) of age-length relations for turbot and brill revealed no spatial effects within the survey area. In other words, the length of each age group is the same throughout the survey area. This means that otoliths can be collected from anywhere within the survey area to obtain an age- length key which is representative for the entire survey area. The protocol to collect otoliths from each subsection within the survey area (e.g. ICES rectangles) as was done in the 2018 survey could thus be abandoned. Instead, a desired number of otoliths per cm-class for each species and sex (within species) was determined. These otoliths can be collected from any survey station. In practice, otoliths were collected starting from the first survey haul until the desired numbers had been collected. This otolith sampling schedule is subject to annual reconsideration based on the construction of age-length keys using the data collected till then. 2.3.2 Practical implementation of the 2019 survey For the 2019 survey, 60 grid cells were randomly selected to serve as survey station. These 60 stations were manually distributed over the three participating vessels on the basis of their normal fishing grounds (Figure 4). All three survey weeks were realized as scheduled. A detailed practical protocol for researchers on-board the participating vessels was written (in Dutch, not included in the report). 16 of 52 | Wageningen Marine Research report C037/21
Figure 4. Survey stations and their distribution over the vessels for the 2019 survey.

2.3.3 Evaluation 2019 survey

2.3.3.1   Skippers
The survey design proved to be practically feasible, meaning that the number of survey stations and
their spatial distribution could be adequately covered by the participating vessels. Out of the total of
60 survey stations, 50 stations were sampled. The main reason for not sampling a station was that the
location was deemed unfishable by the skipper as for the sea floor conditions.

2.3.3.2   ICES WGNSSK 2020
The 2019 survey was again presented and discussed in the WGNSSK meeting in 2020 by Wouter van
Broekhoven of VisNed with the objective to inform the WG on the survey and to receive feedback.

                                                              Wageningen Marine Research report C037/21   | 17 of 52
WGNSSK raised several points (ICES, 2020) that will be investigated further by the BSAS project
partners (Table 3).
Table 3 Points raised by WGNSSK 2020 and the responses to these points by Wouter van Broekhoven of
VisNed.
Points raised by WNSSK 2020 Response / follow up
The question was asked whether maturity is This is not currently the case, but the feasibility
recorded on the survey. and the merits of adding this to the survey in
future could be investigated further.
The survey area was discussed in terms of the Budgetary restrictions allow for the current design
sufficiency of the total area covered. Ideally a using a maximum of three vessels, leading to the
larger area would be covered current survey area which can be covered in
practice.
There was a question from Germany whether a The programme partners intend to share their
vessel could potentially be added to the survey by project proposal intended to cover the cost of the
Germany, in order to improve coverage in the survey years 2021 – 2023 with the German
German Bight. This could provide a useful representative once it is sufficiently ready, so that
expansion of the survey area covered (see a discussion can be held to explore options to try
previous point). and achieve this.
An issue was raised in relation to the This issue will be investigated further by WMR.
determination of an index intended to identify
trends over time, where the question was whether
abundance trends can be distinguished from
spatial distribution shifts.
2.3.4 Conclusions and lessons learned
Based on the 2019 survey it can be concluded that at least 50 survey stations can be covered by three
vessels in three fishing weeks within the survey area. Not all 60 survey stations were sampled in 2019
and this was attributed to part of the survey area being unsuitable or unsafe for beam trawl fisheries.
It was concluded that covering 60 stations seems feasible and that necessary to re-address the survey
area and remove grid cells that cannot be fished to ensure the sampling of all stations in future
surveys.
2.4 Survey 2020
2.4.1 Modifications to the survey design
Survey area
In 2019 not all selected survey stations were surveyed and some survey hauls were shorter than the
regular 120 min. The reason for this is that the locations of these survey stations were deemed
unfishable or unprofitable by the skippers at the time of the survey. To ensure as much as possible
that all selected survey stations are surveyed in the future we aimed to remove cells from the survey
area that either:
1. Cannot be fished.
2. Are unprofitable fishing grounds during the survey period.
The removal of cells that cannot be fished is appropriate when the fishing ground is unsuitable or too
dangerous for the fishing gears used by the participating vessels. The removal of cells that are
unprofitable fishing grounds is appropriate because the principal idea of this industry survey is that
data are collected during regular commercial sole fishing activities. Commercial fishing does not take
place in areas that are deemed unprofitable fishing grounds by skippers.
Cells were removed in a two-step procedure. First the skippers were asked to review the survey area.
To this end the survey area was made available to the participating skippers and one other skipper
familiar with part of the survey area as a file that can be viewed on the ‘plotters’ of the vessels
18 of 52 | Wageningen Marine Research report C037/21(TimeZero / MaxSea). All cells were numbered (1 to 2219). The skippers were instructed to use only
the criterion of ‘unfishable’ or ‘unprofitable’ for the elimination of cells. The criterion of ‘no or low
turbot or brill catches’ was not allowed to exclude cells. The skippers provided lists of cells that
according to them should be removed from the survey area (red and green cells in Figure 5).
In the second step the list provided by the skippers was reviewed using the following information:
- VMS data describing historic fishing activity in the survey area (2007-2009 data => only
beam trawl, 2017-2019 => beam trawl & pulse trawl).
- LPUE data for turbot
For both data sets we mainly considered data from October, the month in which the survey takes
place (as opposed to data of a full year). This way we accounted for seasonality in the use of fishing
grounds. We accepted the removal of cells with no or low fishing activity in October according to VMS
data. Low or no fishing activity was defined as less than 4 ‘pings’ in a cell for which turbot landingsDraft updates of the survey area were reviewed by the skippers several times. These iterations are not described in detail. Instead considerations and final conclusions are presented below for four separate areas within the survey area. Area 1 shows low fishing activity in October both in the period 2007-2009 (only beam trawl with tickler chains, Figure 5) and 2017-2019 (mainly pulse trawl, not shown). Year-round however, the majority of cells in the area show fishing activity (not shown). According to skipper’s information the sole fishery is seasonal in this area. In October sole catches are very small while unwanted bycatches of undersized plaice and dab are large. Also the area is shallow and prone to poor catches as soon as it gets more windy. The area is consequently avoided and there is no regular commercial sole fishing in autumn. The red cells within Area 1 as shown in Figure 5 are therefore removed from the survey area. Area 2 and 3 shows a mixture of low (red) and higher (green) fishing activity in October 2007-2009 (Figure 5). Year-round most of the areas show fishing activity (not shown). In 2017-2019 however, almost the entire area 2 is not fished in October (not shown), probably because pulse fisheries moved its activity elsewhere at the cost of this area. Because it cannot be excluded that with the ban on pulse fisheries, beam trawlers will start fishing the area again in the coming years, we do not want to exclude it from the survey area. We therefore consider the fishing activity in area 2 in 2007-2009 (Figure 5) and only exclude the red cells. Area 3 shows mainly low fishing activity in October based on 2007-2009 data (Figure 5). Year-round however, the area is fished (not shown). Also in 2017-2019 the area is fished in October (not shown). We therefore only exclude the red cells. Area 4 shows high fishing activity, in October in both periods (2007-2009, Figure 5; 2017-2019, not shown) as well as year-round (not shown), expect for some cells. These red cells are removed. Also the two corridors of very small cells between the three future wind mill parks are removed for practical reasons. The final survey area (and the stations for 2020) is shown in Figure 6. It should be noted that this update of the survey area before the execution of the 2020 survey does not affect the usability of the data of the 2019 survey. In 2019 none of the actually surveyed stations lie in the areas that are now removed from the survey area. COVID-19 restrictions The survey involves the boarding of the participating fishing vessels by two researchers. This was not possible under the restrictions implemented in 2020 to prevent the spreading of the COVID-19 virus. Therefore an alternative protocol was developed in liaison with ICES turbot and brill stock coordinators to ensure the continuity of the survey. In brief: the survey design remained unchanged but instead of the direct on-board processing by researchers of turbot and brill caught at the survey stations, the survey fish were sorted from the catches and then labelled per station and stored by the vessel’s crews. At the end of the survey week all collected survey fish was handed over to a team of researchers for processing. All procedures were detailed in protocols for skippers and crews and researchers (in Dutch, not included in the report). Assignment of survey stations The procedure for the random selection of survey stations and their assignment to the vessels remained unchanged from 2019 except for the number of selected stations. Instead of selecting the required 60 stations, a total of 75 stations were selected. Sixty stations were manually assigned to the vessels (20 each) and the remaining 15 stations were kept as ‘spares’, undisclosed to the skippers. Stations among the first 60 stations that were considered not feasible by the skippers could then be replaced by spare stations without the need for a new draw of stations. The procedure is described in detail in a protocol for the random selection of survey stations using the R-script (in Dutch, not included in the report). Because of the removal of unfishable areas from the survey area, it is expected that the need to replace stations will be a rare event. Data and otolith collection Data and otolith collection remained as in 2019. 20 of 52 | Wageningen Marine Research report C037/21
Figure 6. Final survey area and survey stations for 2020.

2.4.2 Practical implementation 2020 survey

For the 2020 survey all three survey weeks were completed as scheduled. This survey fish were
collected, labelled by haul and corresponding station number and stored at sea by the crews of the
vessels and processed by researchers at the end of the fishing week, all according to protocol.

2.4.3 Evaluation 2020 survey

2.4.3.1   Skippers
The modifications to the survey area proved to be successful as 59 of the 60 survey stations were
sampled in 2020 (compared to 50 out of 60 in 2019 due to stations deemed unsuitable for fisheries by
the skippers). No further refinement of the survey area will take place prior to the 2021 survey.
However, the 60 stations drawn for 2021 will be reviewed by the skippers well in advance of the
survey to allow for planning of optimal routes and replace any station that cannot be fished. The 2020
survey was successfully implemented with no researchers on board under the COVID-19 protocol
described above. In the 2020 BSAS evaluation meeting, one of the skippers mentioned that he prefers
to have researchers on board to be able to discuss and jointly decide on any deviations from the
original plan in case of unexpected changes in conditions.

                                                             Wageningen Marine Research report C037/21   | 21 of 52
2.4.3.2 ICES WGNSSK 2021
The experiences and findings of the 2020 BSAS survey will be shared with the WGNSSK in 2021
together with the current report covering the EMFF project period 2018-2020. Reporting feedback
from WGNSSK 2021 will be part of the follow-up project.
2.4.4 Conclusions and lessons learned
The 2020 survey showed that the industry survey can be successfully executed by having the
fishermen independently collect, store and label survey fish. Data collection was not hampered by the
COVID-19 restrictions. In 2020 59 out of the 60 assigned stations were actually surveyed whereas this
was 50 out of 60 in 2019. This improvement may be attributed to the refinement of the survey area
by removing unfishable cells prior to the 2020 survey.
2.5 Otolith sampling
In the 2018 survey, two fish per cm-class per ICES rectangle were sampled for otoliths, depending on
the availability of these numbers in the catches. The age-data from these samples, together with the
age-data from the market, BTS and SNS surveys, were used to determine the number of otoliths to
sample in the subsequent survey years.
Age-data was used to fit one age-length key (ALK) with BSAS samples, and one ALK with samples
from the other surveys. This was done for both species and sexes separately. There was no difference
in length distribution and age-at-length within the survey area for both turbot and brill in the 2018
survey. Therefore we applied the ALK for the entire survey area.
The fitted ALK was then applied to all samples with known ages to estimate age-at-length. We then
looked at deviations from predicted to observed ages (assuming that observed ages are true ages). As
larger, and thus older, individuals have a larger variation in age-at-length compared to smaller
individuals, it was decided to split the individuals in three length groups ( 45 cm)
and generate an ALK separately for each of these length groups. In order to determine the number of
otoliths to sample, multiple ALKs were generated using different sample sizes (e.g. 25%, 50% or 75%
of samples taken). The ALKs were again applied to all samples to predict the age and look at
deviations from predicted to observed ages. Based on this ad hoc approach, the number of otoliths
sampled per length group and sex was decided and split among cm classes. As a precautionary
approach it was decided to multiply the number of samples per length group with 1.5 to get the final
numbers per length group to be sampled. The final number of otoliths per cm-class targeted per
species, sex and length group during the 2019 and 2020 surveys are presented in Table 4.
Table 4 Targeted number of otoliths per species, length-range and sex.
Species Sex Length group # otoliths per cm-class
Turbot Male ≤ 27 cm 1
≥ 28 cm, ≤ 45 cm 4
≥ 46 cm 1
Turbot Female ≤ 27 cm 1
≥ 28 cm, ≤ 45 cm 4
≥ 46 cm 1
Brill Male ≤ 27 cm 2
≥ 28 cm, ≤ 45 cm 6
≥ 46 cm 2
Brill Female ≤ 27 cm 1
≥ 28 cm, ≤ 45 cm 3
≥ 46 cm 1
22 of 52 | Wageningen Marine Research report C037/212.6 Data management
All data have been entered in the WMR in-house developed software Billie Turf. After data entry, data
have been checked for completeness and outliers of numerical variables (i.e. haul duration, distance
towed, fish length, fish weight, fish age, including length-weight and age-length relationships, fishing
positions) and for completeness and consistency of text variables (i.e. station coding, ship names,
fishing gear). The quality control checks have been carried out using standardised SAS scripts, full
version of scrips available via WMR upon request.
After quality control and -if needed- data correction, the data have been imported into the WMR
database FRISBEE. This oracle based relational database contains information from all fisheries-related
sampling types carried out within WMR projects. The database contains a number of quality assurance
checks, such as consistency of species coding, ship coding, gear coding, on top of format checks for all
fields.
From the WMR database the data have been exported and transferred into the unified format with
header needed for submission to the ICES database DATRAS. Submission possibilities for the industry
survey had to be created in collaboration with ICES Data Centre. Although the format had been agreed
upon in July 2020, the ship codes for the vessels used had to be put on the NOAA list of vessels before
the upload of the survey data could be tested. Ship codes were available since 11th December 2020.
Submission of the data was completed in February 2021 and the data are available at
https://datras.ices.dk/Data_products/Download/Download_Data_public.aspx , choose NL-BSAS for
exchange data download, or for selection of the data when using the webservices use
https://datras.ices.dk/WebServices/Webservices.aspx.
Wageningen Marine Research report C037/21 | 23 of 523 Results
3.1 Contribution to stock assessment data
The industry survey for turbot and brill (BSAS) was set up because two age-structured index time-
series of the fisheries independent surveys, i.e. the Dutch beam trawl survey (BTS-ISIS) and the Sole
Net Survey (SNS), currently used in the assessment show a poor internal consistency, especially for
older ages, leading to a poor tracking of cohorts over time. To evaluate the contribution of BSAS to
data available for future turbot and brill stock assessments, we present descriptive statistics on turbot
and brill catches by each of the surveys (Table 5), for each survey (BSAS, BTS, SNS), year (2019,
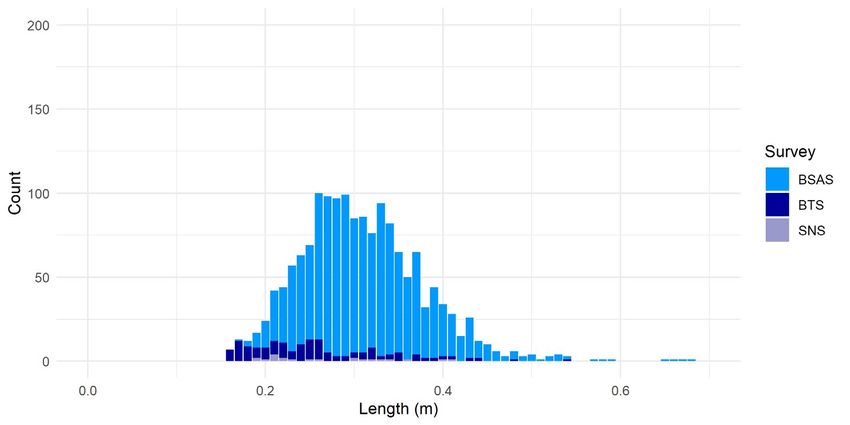
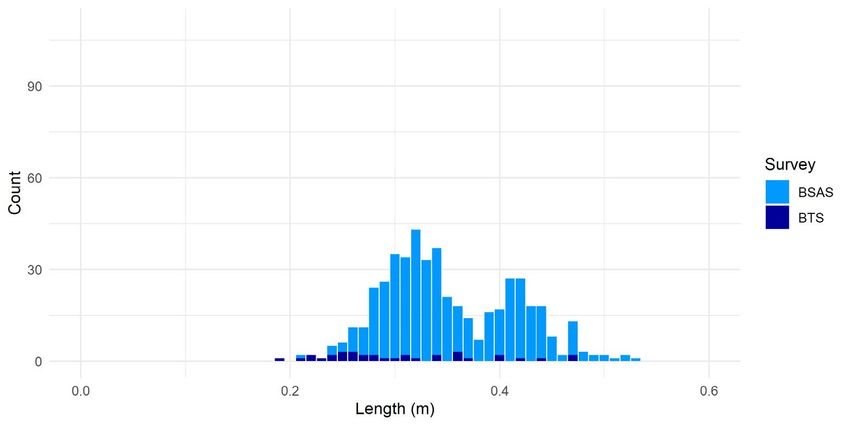
2020) and species the number of fish caught per haul (Figure 7) and the length distributions (Figure
8). BSAS clearly catches more turbot and brill than BTS and SNS. Both, the occurrence (Table 5) and
the number of fish in hauls with occurrence (Figure 7) are highest for BSAS. The catch index
normalizes the different survey hauls for haul duration and this also clearly shows that BSAS catches
more turbot and brill than BTS and SNS (Table 5). The length distributions (Figure 8) also show that
BSAS yields a lot more observations than BTS and SNS and that BSAS adds observations for larger
fish. The survey areas of BSAS, BTS and SNS, as illustrated by the locations of survey stations (Figure
9), show some degree of overlap. The overlap is larger with the BTS, especially in the more offshore
sampling locations where it is expected the larger and as such older individuals in the population
occur. Most noticeable is that survey hauls with no turbot or brill catches are frequent for BTS and
SNS and rare for BSAS.
Table 5. Descriptive statistics for BSAS, BTS and SNS.
Species Survey Year Total # Total # hauls Occurrence CPUE (#/h)
caught (%)1
Turbot BSAS 2018 1035 45 100.0 42.1
2019 1709 50 98.0 57.8
2020 1415 59 98.3 55.7
BTS 2018 181 82 65.9 5.2
2019 191 73 84.9 6.3
2020 162 74 82.4 5.2
SNS 2018 37 45 51.1 1.0
2019 30 44 40.9 1.0
2020 23 46 32.6 0.7
Brill BSAS 2018 518 45 58.7 14.9
2019 785 50 100 26.4
2020 454 59 81.4 17.3
BTS 2018 67 82 35.4 1.8
2019 85 73 53.4 2.7
2020 47 74 33.8 1.7
SNS 2018 30 45 31.1 0.8
2019 10 44 14 0.4
2020 0 46 0 0.0
24 of 52 | Wageningen Marine Research report C037/21Figure 7. Number of fish caught per survey haul by the BSAS, BTS and SNS for brill (top panels) and turbot (bottom panels) in 2019 (left panels) and 2020 (right panels). Note that
hauls with no occurrence of brill or turbot are not included.
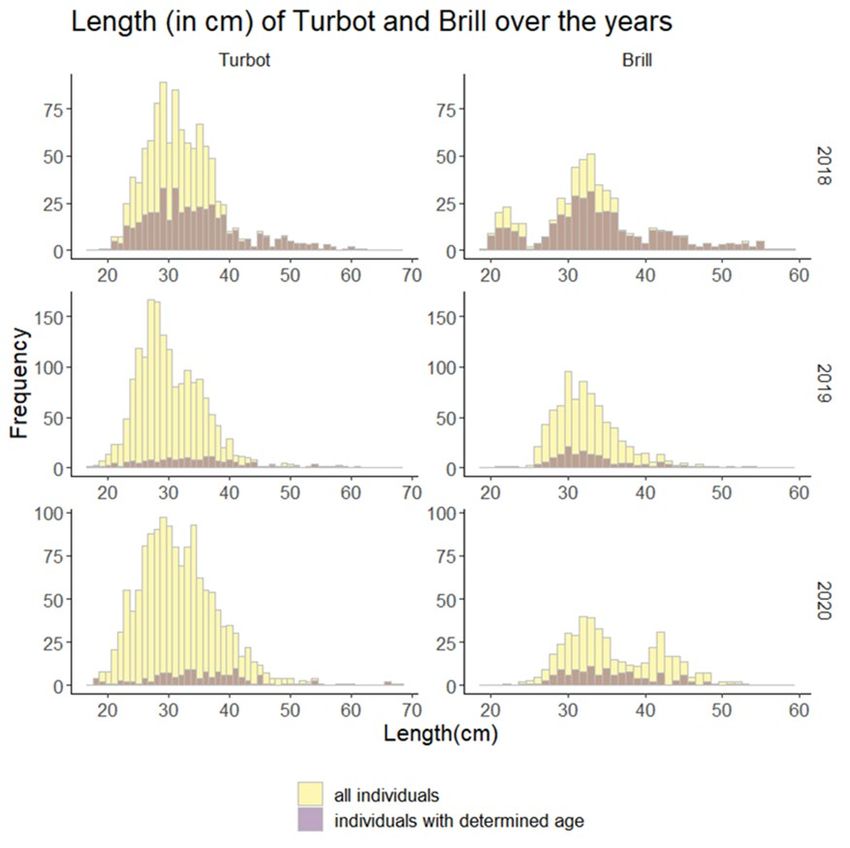
Wageningen Marine Research report C037/21 | 25 of 52Figure 8. Length distributions (cm-classes) for BSAS, BTS and SNS for brill (top panels) and turbot (bottom panels) in 2019 (left panels) and 2020 (right panels). 26 of 52 | Wageningen Marine Research report C037/21
Figure 9. Survey stations for BSAS, BTS and SNS for brill (top panels) and turbot (bottom panels) in 2019 (left panels) and 2020 (right
panels). Note that open circles indicate survey stations for which either turbot or brill was absent in the catch.

                                                                                                                                          Wageningen Marine Research report C037/21   | 27 of 52
3.2 Age-length keys
3.2.1 Model selection and parameterization
Turbot and brill in the North Sea are both species for which age-length data is sparse. The industry
survey is implemented as an alternative method to collect age data. For a selection of length-
measured fish the age was determined by otolith readings (see chapter 2.5), allowing the estimation
of an age-length relation (ALK, age-length key). Such ALK is used to convert the numbers-at-length to
numbers-at-age for those fish for which only length measurements were taken.
ALKs can be constructed by calculating the proportion of ages within a length-bin (cm-classes). This
method can be applied when all length-bins are sufficiently sampled, i.e. for all lengths age is
determined for a representative number of individuals. When age-length relations are missing, e.g.
when lengths were not sampled, the ALK can also be estimated using statistical models. Here, the ALK
for each survey year and each species individually was first determined by calculating the proportions
(enclosed in Annex 1). As for certain lengths, mainly the larger fish, only few or no fish were sampled
in 2019 and 2020 (Figure 12) a modelling approach using non-linear least squares was applied. In
both ALK estimates no distinctions were made between males and females. Combining sexes in the
ALK, may cause a bias in the age-length conversion as growth rates of both sexes are different (i.e.
males remain smaller). Yet, the sex of an individual fish can only be determined by cutting open the
fish which was only done for those fish from which otoliths were extracted. As such, the sex was
determined from a sample of the total number of individuals caught in the survey. Due to uncertainty
in the representativeness of the ratio between males and females the ratio was not extrapolated over
those individuals for which sex was not determined.
The age-length keys were treated as a non-linear least-squares, and as such can de described
mathematically as follows:
Age ~ Normal(μ, σ2)
μ = t0 + log{1 – (Length / Linf)} (–K)-1
Where μ is the mean age and σ2 is the age variance. The parameters Linf, K, and t0 were estimated
using non-linear least squares and represent the following:
- Linf: The asymptotic length (in meters); the length that the fish of a population would reach if
they were to grow indefinitely. Linf must be larger than the maximum length in the data to
prevent that 1 – (Length / Linf) becomes negative (you cannot take the logarithm of a
negative number). So by definition Linf is not necessarily a biologically realistic length.
- K: The growth rate per year at which the asymptotic length is approached.
- t0: The hypothetical age at which a fish of a population would have zero length, had their
early life stages grown in the manner described by the Von Bertalanffy growth function (using
parameters Linf and K).
The age-length keys for brill were fitted as straight-forward non-linear least-squares. This method did
not result in converging age-length keys for turbot. Hence a more advanced method was applied.
For survey years 2018 and 2020, the age-length key of turbot was fit by limiting the Linf parameter
between a minimum and maximum limit value. Linf is defined as the length a fish would reach when
growing indefinitely. The minimum limit for Linf was therefore set to be the maximum length found for
turbot in the data of a given year, max(Ldata). The maximum limit was more difficult to choose: it
turned out that Linf tended to be estimated to whatever maximum limit was chosen. For example, if
the limit maximum for Linf was set to 10 m for 2018 and 2020, Linf was estimated to be 10 m for both
2018 and 2020. When the maximum limit value became too high (i.e. >50 m), there was no
convergence. We eventually chose the limit maximum for Linf to be 5 m for 2018 and 2020.
28 of 52 | Wageningen Marine Research report C037/21You can also read