Revealing the research landscape of Master's degrees via bibliometric analyses
←
→
Page content transcription
If your browser does not render page correctly, please read the page content below
Revealing the research landscape of Master’s degrees
                                                             via bibliometric analyses

                                                                      Nathalia Chaparro1 and Sergio Rojas–Galeano1
                                                            1
                                                                Universidad Distrital Francisco José de Caldas, Bogotá, Colombia.
                                                                                    enathaliach@gmail.com
                                                                                  srojas@udistrital.edu.co
arXiv:2103.09431v1 [cs.DL] 17 Mar 2021

                                               Abstract. The evolution of a Master’s programme, like many other human institutions, can
                                               be viewed as a self-organising system whose underlying structures and dynamics arise pri-
                                               marily from the interaction of its faculty and students. Identifying these hidden properties
                                               may not be a trivial task, due to the complex behaviour implicit in such evolution. Nonethe-
                                               less, we argue that the programme’s body of research production (represented mainly by
                                               dissertations) can serve this purpose. Bibliometric analyses of such data can reveal insights
                                               about production growth, collaborative networks, and visual mapping of established, niche,
                                               and emerging research topics, among other facets. Thus, we propose a bibliometric workflow
                                               aimed at discovering the production dynamics, as well as the conceptual, social and intellec-
                                               tual structures developed by the Master’s degree, in the interest of guiding decision-makers
                                               to better assess the strengths of the programme and to prioritise strategic goals. In addition,
                                               we report two case studies to illustrate the realisation of the proposed workflow. We conclude
                                               with considerations on the possible application of the approach to other academic research
                                               units.

                                               Key words: Master’s degrees evolution, bibliometric analysis, scientific output mapping

                                         1 Introduction
                                         In most countries, master’s degrees are academic programmes in which students are trained in
                                         specialised knowledge and then must complete a dissertation on a given research topic under the
                                         guidance of a faculty supervisor. Perhaps it is the fact that dissertations are carried out as a
                                         teamwork and knowledge-oriented activity, within a decentralised system, what conveys this type
                                         of academic program with the typical features of a complex system [26, 59].
                                             This assumption can naturally be transferred to a scientific community. As with other social
                                         institutions that self-organise to face the uncertainties found in their environments [5], the research
                                         activity of a master’s program exhibits emergence of conceptual and collaborative structures along
                                         with dynamics of continuous change and innovation that renders a research landscape difficult to
                                         identify directly. Nonetheless, we argue that the body of its research output, mainly in the form
                                         of dissertations, are the building blocks of its scientific development, one that can be examined
                                         through the lens of bibliometric methods in an attempt to understand how such landscape has
                                         evolved. In this sense, bibliometrics can be seen as a particular type of data-mining [56], here
                                         tailored to discover patterns that help to explain its complex academic behaviour.
                                             Bibliometric techniques provide useful information on the production and consumption of aca-
                                         demic production in a framework of impartial, systematic and reproducible analysis for a given
                                         bibliographic corpus. The source, context and extent of the corpus will define the purpose and
                                         unit of analysis of the bibliometric study. Therefore, it is possible to perform this type of analysis
                                         to study the behaviour of a variety of academic units, including journals [18, 57, 46, 16, 53, 32],
                                         individual authors [1, 40, 9, 34], scientific disciplines [23, 33, 43, 42], emerging topics [13, 55, 51],
                                         universities [12, 44, 54], university programs or departments [39, 36, 19, 29] and even nation-wide
                                         assessments of specific thematic disciplines [25, 60, 27, 47].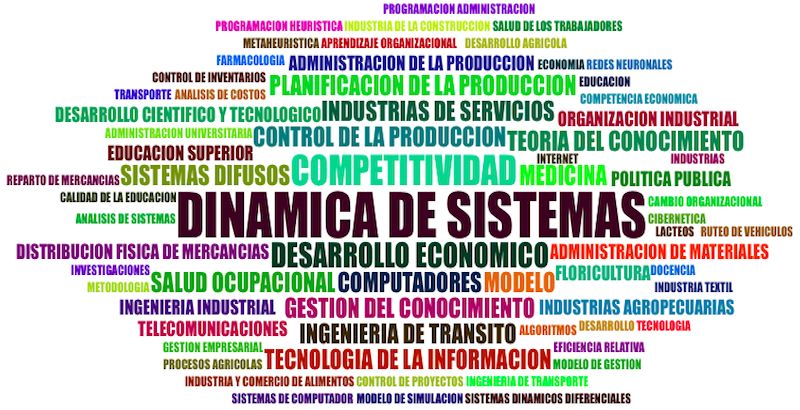
2      Chaparro and Rojas–Galeano

    When applied to a master’s programme, such analysis may lead to a critical appraisal of academic
production in terms of its bibliometric performance, as well as of the development of conceptual,
intellectual and social structures of its associated research activity. Insights into production growth,
faculty and group engagement, dominant and emerging topics of interest, collaboration patterns,
and intellectual structures can convey useful information to decision makers such as the programme
leaders, internal or external evaluators, faculty members and enrolled or future students.
    This study proposes a bibliometric workflow to help reveal the research landscape of a Master
of Science degree, using a multifaceted analysis based on its structural and dynamical properties.
The application of the workflow is illustrated in two case studies of master’s degree programs in
engineering. The paper begins with a brief literature review of related works (Section 2), followed
by an overview of the workflow (Section 3) and a detailed description of the stages involved in it
(Section 4). We then report the results of the case studies (Section 5). The document concludes by
discussing some ideas for future work.

2 Related work
Numerous studies related to the bibliometric analysis of different academic units have been pub-
lished. For example, [54] reports the analysis of the research output of a group of three universities
in Spain, including descriptive and impact metrics to identify the elite of most productive au-
thors on each university. Another work that explores the production, impact and collaboration of
researchers in Information Sciences in Latin America and the Caribbean was carried out using bib-
liometric techniques [50]. A more recent study proposes an approach to exploring the major themes
of a text collection to obtain thematic mappings, with application to Big Data [43].
    In contrast, our work focuses on the analysis of graduate school production. In this regard, [42]
presents a study with quantitative indicators and a conceptual map obtained from dissertations
and theses on chronic diseases in Brazil. Similar works have been reported evaluating the impact of
citations, research topics and preferred journals for the publication of results for the Department
of Library Sciences of the University of Calcutta [39], or for the doctoral thesis in Mathematics
and Political Science at Burdwan University [36, 35]. A study concerning a scientometric analysis
of doctoral theses on the subject of Roma people, has recently been published [49].
    In the same vein, our work describes the application of several performance and scientific map-
ping techniques to a bibliographic dataset of dissertations (we are not introducing either any novel
bibliometric technique), but differs in that instead of a quantitative vs qualitative approach, we
outline a generic workflow for analysing structures and dynamics of knowledge, where a variety
of techniques are explicitly aimed at discovering specific patterns describing the general picture of
the research landscape. This approach is the main contribution of this paper and is explained in
Section 3.
    The realisation of the workflow can be carried out using any bibliometric or scientific mapping
software tool that supports the chosen techniques. Several tools have been applied in the reviewed
literature: VOSviewer [18, 33, 12, 51, 45], Bibexcel [50], Taverna [24], T-LAB [43]. However, in this
regard, we decided to use bibliometrix, an open source R library for full bibliometric analysis and
scientific mapping [6]. Since its recent introduction, this toolkit has been widely adopted by the
community to perform a variety of bibliometric analyses in various disciplines (see [27, 17, 38, 10,
28, 49, 11, 7, 22, 10, 28, 53, 58], to name a few).
    Nonetheless, we note that our approach is tool-independent and therefore any other software
option (or combination of software tools) can be used as long as they are compatible with the
techniques involved. For a complete review of this type of tools, we refer the reader to [37] and
references within.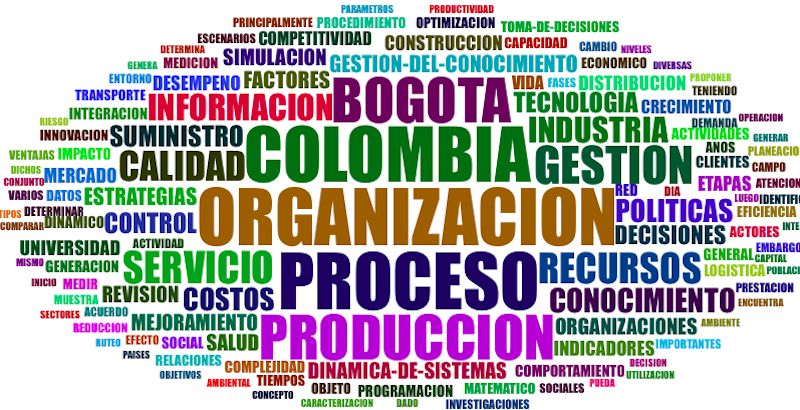
Revealing the research landscape of Master’s degrees      3

3 Workflow description
3.1 Overview
The workflow consists of the stages depicted in Figure 1. The initial stage encompasses the definition
of the questions that guide the analyses aimed at discovering the research landscape of the master’s
programme. We have identified four key questions that we consider relevant for this aim, although
these may be tailored to the specific targets of any particular study. Those questions are described
in Section 3.2.
    The next stage focuses on data collection. Here, once an observation window is defined, the
metadata of the dissertations submitted within it is collected from institutional repositories or
abstract and citation databases (and, optionally, papers derived from them). A detailed schema of
the metadata to be collected is described in Section 3.3.
    From the collected bibliographic corpus, the following stages correspond to the actual analyses,
which include performance bibliometrics and scientific mapping in an attempt to delve into the
evolution of the dynamics and structural facets of the master’s programme. The insights obtained
from each of these facets would provide an enriched evaluation of its production behaviour during
the observation window. The bibliometric techniques that would be used to feed these facets are
described in Section 3.4.
    In the last stage, a final critical assessment is made based on the findings of the previous biblio-
metric analyses; the aim would be to interpret the ideas about the dynamic and structural patterns
discovered from the master’s program, in a unifying reflective perspective that can provide useful
information for strategic planning and decision-making. Furthermore, in view of the continuous
evolution of the programme as a self-organising entity, the workflow can be applied routinely to
account for such changes (a loop indicated by the red arrow in the figure).

             Research           Data           Dynamics         Structure         Critical
             questions        collection       Analysis         Analysis         Assessment

                                   Fig. 1: The proposed workflow.

3.2 Research questions
We propose to focus the analyses on the two key properties that facilitate the appearance of complex
behaviours in most human organisations: dynamics and structure [3]. Therefore, we defined four
central questions to address such aspects (RQ1 to RQ4, see Table 1). RQ1 deals with the dynamics
of the programme’s production, from the point of view of performance: indicators of growth, impact
and activity of research output. RQ2 and RQ3, in turn, are related to the emerging structures that
support the research activity of the program. They were divided in two, RQ2 centred around the
development of knowledge structures, while RQ3 focused on the emerging interaction between the
actors that influence the production of research. Lastly, RQ4 is a synthetic question, the answer to
which would be a reflection on the findings obtained in the other three questions, so as to provide an
overall critical assessment and perspective of the research landscape obtained from the application
of the workflow.
    Although we outlined these questions as a guidance intended to capture the broader picture
of the emergent properties of the master’s degree, we remark that they can be adjusted to other
specific purposes (for example, comparing how the structures or dynamics have change with respect
to an older analysis previously made).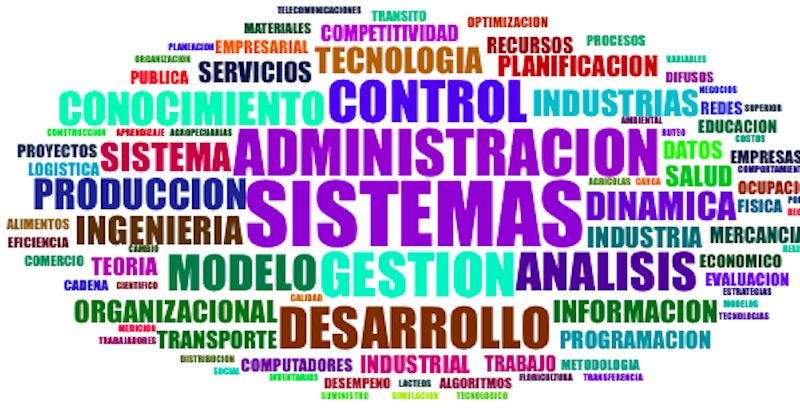
4         Chaparro and Rojas–Galeano

    Id.    Research question                    Motivations
    RQ1. How to characterise the scientific     To identify indicators of publication growth, citation im-
         production dynamics of the Mas-        pact and dynamics of the scientific production originated
         ter’s programme during the obser-      in the research projects carried on by groups during
         vation window?                         the time frame, in summary, the overall research per-
                                                formance.
    RQ2. What are the distinctive features of   To discover frequently used index terms, dominant and
         the conceptual structures developed    emerging topics and thematic areas of research under-
         within the Master’s programme          taken by groups and faculty associated with the Master’s
         during the observation window?         programme.
    RQ3. What are the characteristics of the    To reveal the patterns of collaboration implicitly evolved
         collaboration structures emanated      within the Master’s programme, considering social and
         within the Master’s programme          intellectual networks of authors, groups, and common lit-
         during the observation window?         erature couplings.
    RQ4. What are the critical factors the      To assess the current state and outlook of established and
         board of directors should prioritise   emerging areas of research according to the strengths and
         in order to strengthen the perfor-     weaknesses identified with the analysis conducted in the
         mance of the Master’s degree scien-    previous questions, so as to recommend actions aimed at
         tific landscape in the near future?    improvement of the scientific production structures and
                                                dynamics of the Master’s programme.

               Table 1: Research questions and motivations for the study design stage.

3.3 Dataset collection

To carry out the analyses described in the following section, first a data set must be assembled with
bibliographic records of those dissertations defended during the observation window. To do this, we
recommend organising the metadata corresponding to each record in the scheme shown in Figure 2.
This scheme is designed according to the BIB format used by the BibTeX reference manager (see
[21]). We believe that it is a convenient format because it is available as an export interface in most
bibliographic databases such as Web of Science, Scopus, Google Scholar, institutional databases,
and also in most reference management programs.
    Although the fields in the BIB record were intended to primarily describe the metadata asso-
ciated with papers, they can be reinterpreted to contain analogous information related to disser-
tations. For example, the field journal can be associated with the research group or laboratory to
which the student joined; the actual name of the student can be first author ; the list of other authors
may contain the names of supervisors and advisers, and similarly with the list of affiliations (useful
for external advisors). As we will see later (in Figure 4), the data in each of these fields would be
used in one or more of the bibliometric analyses that are described in the next section.
    In addition to assembling bibliographic records into a .BIB file, we suggest doing some data
cleaning, which involves removing typos, repeated or joined words, and symbols not recognised by
the ANSI UTF-8 standard encoding. In the case of dissertations submitted in Spanish, we suggest
removing accents and other punctuation marks in titles and names (such as á, é, ı́, ó, ú, ñ, etc.),
to improve the accuracy of the software tools used to perform the analysis. Moreover, since most
bibliometric techniques use algorithms for natural language preprocessing, it is also recommended
to configure stop-words and synonyms lists to filter non-informative or redundant terms, which can
help to obtain more accurate results. Links to the .BIB files and lists that we used in the case
studies reported in this study are provided in the Supplementary Material section.
    Lastly, we remark that metadata of papers derived from dissertations could also be collected
and organised as a complementary dataset using the same BIB record of Figure 2, and likewise, it
could be used as input for an additional analysis of the properties described in the following section.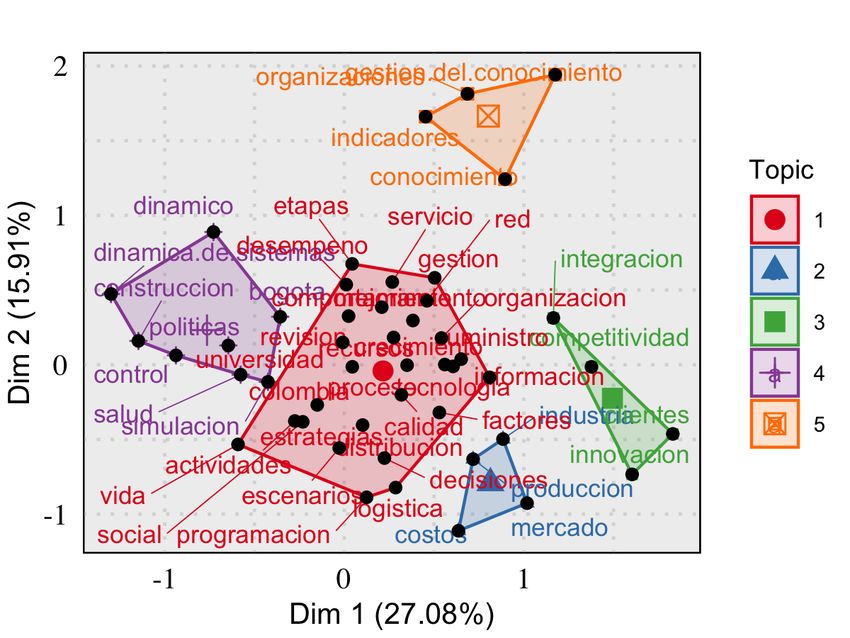
Revealing the research landscape of Master’s degrees       5

Fig. 2: Scheme of the bibliographic record to assemble the corpus. Optional fields are denoted with
dashed lines, single-value fields are depicted with sharp-corner rectangles, and compound fields are
shown with rounded-corner rectangles. The latter correspond to lists of semicolon-separated values.

3.4 Dynamics and structure analyses

According to [41], the two main branches of bibliometric assessment are performance evaluation
and scientific mapping. In line with that vision, we designed the stages of dynamics and structure
analyses to take advantage of the variety of techniques that are usually applied in each of these facets.
By combining these two types of complementary analysis, we aim to build a more comprehensive
assessment of the emerging research landscape of a master’s programme.
    Having this in mind and taking into account the research questions defined above, we chose a
broad set of bibliometric techniques to apply in each analysis. On the one hand, we link the dynamics
analysis with performance bibliometrics, where we consider growth, distribution and descriptive
statistics of research production, author’s timelines, as well as trends of terms, frequent words and
word clouds. Additionally, citation counts and distributions were also included as a measure of
visibility; in this respect, other bibliometric impact indicators, such as the h-index and variants [4]
were not included, since citation impact is not considered a typical outcome of a dissertation. The
descriptions and categories of these techniques are summarised in Table 2.
    On the other hand, we associate the stage of structure analysis with science mapping bibliomet-
rics, choosing techniques such as topic maps, word dendrograms, co-occurrence networks, thematic
maps, collaboration and co-citation networks. These are also described in Table 2, along with the
type of analysis they perform. A final technique was added, energy flow diagrams, which are useful
for visualising aspects of both the dynamics and structure facets of the workflow.
    In fact, we can benefit from this last mentioned diagram (also known as alluvial diagram [48])
to illustrate the design and purpose of these analyses stages of the workflow. This is shown in
Figure 3. Recall that RQ1 focuses on dynamics, while RQ2 and RQ3 refer to structures (knowledge
and social, respectively). The left side of the diagram shows how each technique contributes some of
the insights that help solve each of the research questions (note that some techniques can contribute
to more than one question). The right-hand side, in turn, shows how the synthesis of findings from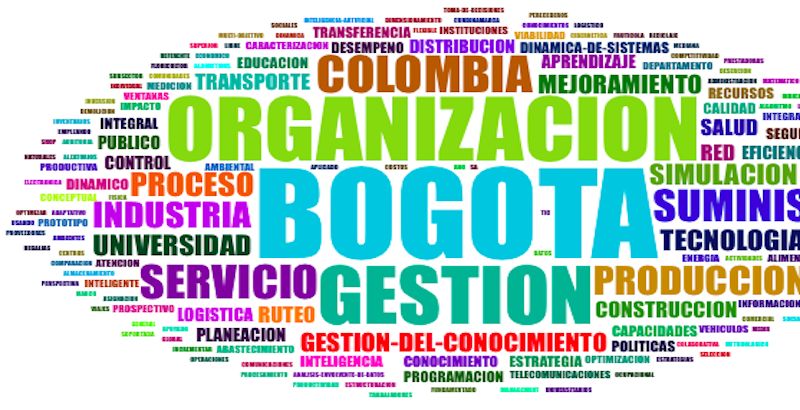
6        Chaparro and Rojas–Galeano

    Bibliometric technique        Description                                                Type
    Production statistics         Statistics of annual scientific production, average ci-    Descriptive analysis (P)
                                  tations and other impact indicators.
    Production growth             Plot of curves representing production counts ar-          Trend analysis (P)
                                  ranged by year.
    Production distribution       Frequency histogram of total dissertations per au-         Descriptive analysis (P)
                                  thors or groups.
    Citation count                Plot of curves representing citation counts (total or      Trend analysis (P)
                                  averaged) arranged by year.
    Citation distribution         Frequency histogram of citations for dissertations (to-    Descriptive analysis (P)
                                  tal or yearly).
    Author’s timelines            A stack of 1D bubble diagrams representing dynamics        Trend analysis (P)
                                  and frequency of author’s production (or also groups)
                                  over individual timelines.
    Word trends                   Plot of word usage trends over the years, obtained by      Trend analysis (P)
                                  title, abstract or keywords.
    Frequent words                Frequency histogram of words appearance, obtained          Descriptive analysis (P)
                                  by title, abstract or keywords.
    Word cloud                    Cloud-shaped visual design of most frequent words,         Descriptive analysis (P)
                                  obtained by title, abstract, keywords.
    Topic map                     A plot where the proximity of words co-occurring in        Conceptual structure (M)
                                  multiple documents is depicted in a 2D map as clus-
                                  ters defining topics or concepts.
    Word dendrogram               An alternative visual format to depict proximity of        Conceptual structure (M)
                                  word co-occurrence, using a hierarchical tree display-
                                  ing level-dependant partitions.
    Co-occurrence network         A network plot representing different features of          Conceptual structure (M)
                                  words and relationships among them: co-occurrence,
                                  dominance and similarity clusters.
    Thematic map                  By clustering words according to centrality (impor-        Conceptual structure (M)
                                  tance in the field) and density (development in the
                                  field) a 2D map can be generated depicting motor,
                                  emerging, declining and fundamental themes.
    Collaboration network         Network of co-authorship patterns revealing collabo-       Social structure (M)
                                  ration links between authors, supervisors and groups.
    Authors coupling network      Network of authors connected if they share references      Social structure (M)
                                  cited in the entire oeuvres bibliography (their lists of
                                  supervised thesis).
    Co-citation network           Networks of co-occurrence of citations, revealing          Intellectual structure (M)
                                  structures of literature and authorship relevance.
    Manuscript coupling network   Network of dissertations that are linked when they         Intellectual structure (M)
                                  refer to shared works in their bibliographies.
    Energy flow diagrams          Visual representation of energy exchange, i.e. the         Conceptual, intellectual,
                                  outflow and inflow of contributions, between biblio-       and social structure (M)
                                  graphic units (also known as Alluvial diagrams).

Table 2: A set of bibliometric techniques suggested to carry out the dynamics and structure analyses
of the proposed workflow. The type of technique is associated to the bibliometric assessment they
perform (P: Performance bibliometrics; M: Science mapping bibliometrics).

descriptive, trend, conceptual, social, and intellectual analysis ultimately adds to the critical wide-
picture reflection of RQ4. The case study reported in Section 4 provides a detailed discussion of the
actual realisation of these flows.
    For completeness sake, we also outline the relations between the metadata scheme of the collected
dataset (see Figure 2) and the set of bibliometric tools used in the analyses (see Table 2). This
is shown in the flow energy diagram of Figure 4. There, it is observed that the main fields are
Title, Author, Keywords and Summary, contributing predominantly to the fulfilment of most of the
analyses. Colours in the flow diagrams are meant to enhance readability of energy transformations;
they do not convey specific meaning.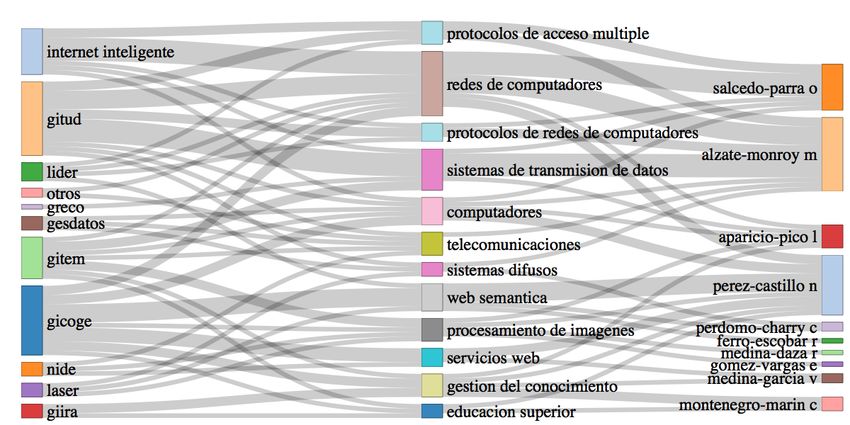
Revealing the research landscape of Master’s degrees   7

Fig. 3: An energy flow diagram between research questions (RQ1-RQ4, as defined in Table 1) and
bibliometric techniques (described in Table 2).

Fig. 4: An energy flow diagram depicting the associations between metadata (shown in Figure 2)
and bibliometric techniques (described in Table 2).
8      Chaparro and Rojas–Galeano

4 Case study
In order to demonstrate the application of the the described workflow, we conducted a study on two
particular Master’s degrees from the School of Engineering, Universidad Distrital Francisco José de
Caldas in Bogotá, Colombia: the MSc. in Industrial Engineering and the MSc. in Information Sci-
ences. In this section we report the results of the study on the first, while in the interest of space, the
results of the second are annexed to the Supplementary section. Besides, we have developed a com-
panion web-based dashboard where all of these and more results can be browsed interactively (visit:
https://srojas.shinyapps.io/shinymasters/). For the sake of completeness, further discussion
on the interpretation of the results will also be provided below, in light of each question.
    We note that for some specific analyses the results contain terms in Spanish, as this is the original
writing language of these dissertations; this certainly does not limits the scope of application of the
approach to analysing dissertations written in other languages, as long as the text cleaning lists
are customised for that purpose. In this sense and in the interest of reproducibility, the datasets,
R scripts and lists for text cleaning used in this study have been made publicly available (visit:
https://github.com/sargaleano/bibliomasters/).
    So, first of all, we set the observation period at 2010-2020, in order to analyze the entire last
decade of program activity. Second, we extracted the metadata of the dissertations completed during
that period from the institutional archive (http://repository.udistrital.edu.co/).

4.1 Research landscape of the MSc. in Industrial Engineering, UDFJC.

This programme was established on 2004 with a focus on the areas of Quality Assurance, Opera-
tions Research and Statistics, and Occupational Health. In 2014, a new direction was given to the
programme with emphasis on the areas of Logistics Systems, and including new lines of research
on Organisation Management and Computational Intelligence for Business. The dataset used to
conduct the analysis, consisted of the metadata of the dissertations carried out during the 2010-
2020 decade, compiled according to the guidelines provided in Section 3.3. We will call it the MIE
dataset. Next, we will report the results of each stage in the proposed workflow.
RQ1. Production dynamics
    Table 3 summarises some descriptive statistics of the MIE dataset. Regarding the dynamics
of production, a total of 143 dissertations were completed during the observation window. The
average number of citations per document is relatively low (0.24 cites/document), compared to
slightly higher averages found in the field of engineering [30, 31]. The number of keywords per
document is around 3.4 (486/143), a typical value. In contrast, the average number of completed
dissertations per year is 13.0 (143/11 years), a low rate considering that roughly twice as many
students enroll yearly in this programme.
    Incidentally, some of this statistics give us a glimpse of the structure of research production.
Specifically, we found a total of 188 different authors. Notice that we assume that this number

                            Dynamics                                      Structure
            Timespan                         2010-2020 Authors                                188
            Documents                            143        Author appearances                295
            Avg. citations per document          0.24       Single-authored documents          4
            Avg. citations per year per doc      0.03       Authors per document              1.31
            Author’s keywords                    486        Co-authors per documents          2.06
            Unigram keywords                     523        Collaboration Index               1.32
            Avg. dissertations per year          13.0       References*                       3690
                                          *References were only available since 2016 (46 documents)

                         Table 3: Bibliometric statistics for the MIE dataset.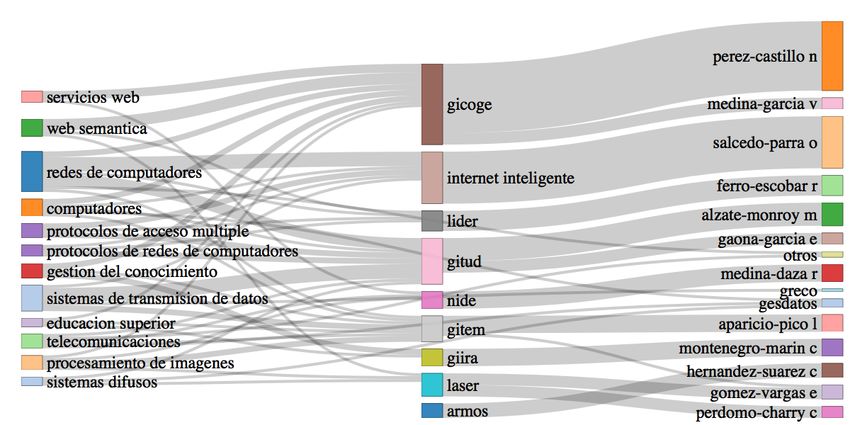
Revealing the research landscape of Master’s degrees     9

comprises the students who were actually the authors of the dissertation document together with
their supervisor(s); thus, we reason that it corresponds to 143 students plus 45 faculty members.
The number of author appearances is 295, which gives a ratio of 2.06 co-authors per document,
meaning that a few students have had more than one supervisor. Only 4 documents are from a
single author (less than 3%, possibly records that lack information about their supervisors).
    Additionally, the average number of unique authors per document is 1.31 (188/143), indicating
that each faculty member must have supervised many dissertations. Moreover, the collaboration
index (that is, the average number of authors in documents by multiple authors [20]), yields a
similar value of 1.32 (184/139), because all records are counted except those 4 missing supervisor
information (139 out of 143 in total). This is a coherent value given that a dissertation is typically
the result of a collaborative effort. Lastly, the ratio of references per document is 80.2 (3690/46)
which is comparable with averages reported elsewhere for engineering programmes [29].
    The results of the additional analysis associated to RQ1 (see Figure 3) are reported in Figure 5.
Figure 5a shows two production peaks in 2012 with 19 dissertations, and in 2015 with 22 dis-
sertations. The remaining years exhibited smaller numbers; a downward trend is observed during
2017-2019, which may suggest that students found it difficult to finish their dissertations during
this interval (although an upturn in production is visible in 2020). Now, regarding citation dynam-
ics (Figure 5b), dissertations completed in 2016 accumulated the highest number of citations (8);
the overall curve shows a sawtooth pattern, but it is noticeable that no cites has been accrued by
dissertations from 2018 to 2020, probably because it is too early in their maturity cycle.
    On the other hand, Figure 5c shows the distribution of the 12 most prolific supervisors (con-
sidered co-author), adding up to 71% of the documents in the dataset (101/143). Similarly, the
distribution of research group affiliations is shown in Figure 5d; the most productive being SES
(Expert Systems and Simulation) and MMAI (Mathematical Models Applied to Industry), repre-
senting 30% (43/143) of the total number of dissertations between them.
    The analysis of the distribution of citations by individual document is shown in Figure 5e, where
two dissertations appear as the most cited, each one with 4 citations: (Buitrago, 2016), “Marco
Conceptual del Conocimiento y el Aprendizaje Organizacional, del Enfoque Clasico al Enfoque de
los Sistemas Adaptativos Complejos” and (Romero, 2013), “Diseno de un Modelo de Controlador
Flexible para un Sistema Integrado de Transporte que Permita Superar las Deficiencias Actuales en
Captura de Datos e Intercambio entre Sistemas Heterogeneos”; these dissertations focus on complex
adaptive systems and control of heterogeneous transport systems, respectively.
    Another view of the production dynamics can be seen in the individual timelines of the most
prolific authors (Figure 5f), where contribution size (document count) and contribution impact
(citations per year) are plotted on an annual basis. This plot is useful for analysing the activity
patterns of supervisors over time. It can be seen that the activity of the bulk of the group of
supervisors has somewhat stagnated since 2017, with only four very active in the last 3 years:
Bohorquez-Arevalo and Mendez-Giraldo in 2018, and Tarazona-Bermudez and Rueda-Velazco in
2020. Similarly, this timeline analysis can be applied to the contributions of the research groups, as
illustrated in the supplementary Figure S1, where a similar pattern is visible.
    From a different angle, the evolution of word trends can provide an interesting picture of changes
in the topics covered by the programme’s dissertations over time. Figure 5g displays curves that
describe the use of the author’s keywords as a cumulative count of terms per year; there, System
Dynamics (Dinamica de Sistemas) is the fastest growing keyword, being the most used as of 2020
(with 9 dissertations mentioning), despite not having been used at all before 2014. It is followed by
Business Competitiveness (Competitividad ) with 6 mentions as of 2020, rising from 2013 on.
    Word trend analysis can also be performed on terms extracted from the abstracts of the disser-
tations. As a result (see Figure 5h), we find that the terms Business (Organizacion) and Process
(Proceso) have been the most widely used during the observation window with nearly 45 counts
each. These are followed by Colombia and Bogota, a reasonable result considering that this is the
public university of the Bogotá District, making evident its immediate geographic area of influence.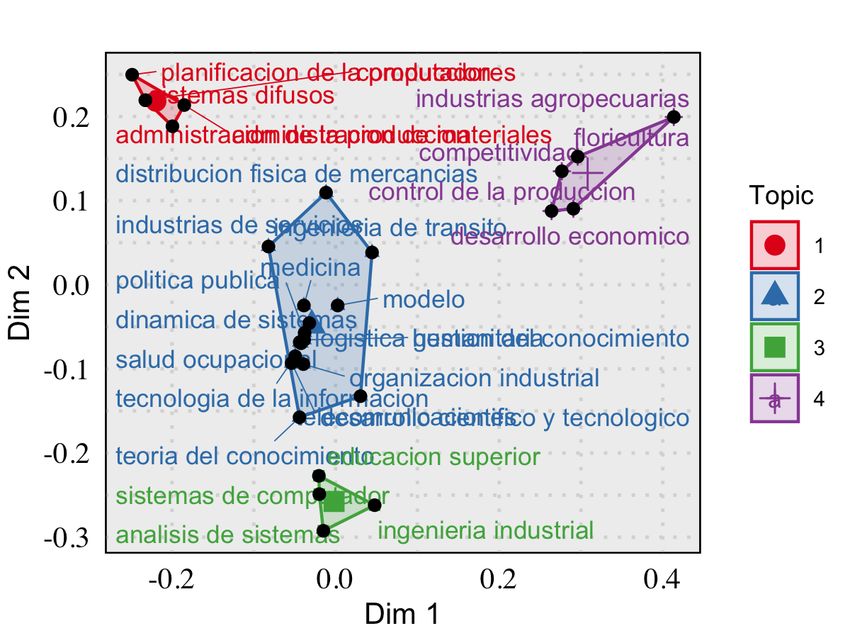
10     Chaparro and Rojas–Galeano

            (a) Production growth                                 (b) Citation count

     (c) Production distribution (authors)               (d) Production distribution (groups)

           (e) Citation distribution                            (f) Author’s timelines

         (g) Word trends (keywords)                          (h) Word trends (abstracts)

         Fig. 5: Results of the RQ1 analysis (production dynamics) for the MIE dataset.
Revealing the research landscape of Master’s degrees 11
RQ2. Conceptual structures
The analyses carried out for this question aim to discover thematic areas, dominant and emerging
topics, and strengths of the research groups and faculty affiliated with the Masters programme. The
results of the MIE dataset are summarised in Figure 6. First, the plot of the 15 most frequent words
used in the titles during the entire observation window is shown in Figure 6a; the term Bogota
appears in 25% of them (36/143), supporting the case of the relevance of the programme to help
expand the scope of industrial engineering applications for the capital city of Colombia. The other
terms are related to pertinent concepts such as Business (Organizacion), Management (Gestion),
Supply (Suministro), Production (Produccion), Industry (Industria), Simulation (Simulacion), etc.
Another appealing choice to visualise the most frequent terms is a word cloud plot, where
frequency and relevance are displayed by the size and central location of the words within the cloud
(colors are used for readability only). Figure 6b shows the word cloud of the terms used in the
corpus abstracts. The most prominent ones actually correspond to those shown in the frequency
histogram mentioned above, but the word cloud allows a broader display of many more terms.
Note that it is possible to obtain both frequency histograms and word clouds from the different
text fields found in the metadata records, that is, title, abstract, author keywords, and unigram
keywords. By contrasting the plots derived from these fields, the analyst may gain an enriched
understanding of the trends and patterns found in relation to the most prominent descriptors,
index terms and word categories used by authors in a particular observation period. For the sake
of clarity, Figure S2 and Figure S3 of the supplementary material section, illustrate this point.
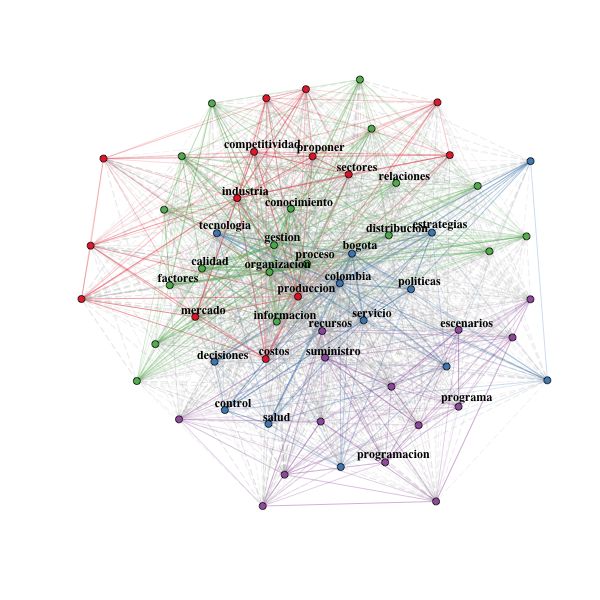
We now turn to the topic map of Figure 6c, where groups of related concepts (“topics”) are
shown representing the knowledge structures most strongly developed by the examined dissertations.
Topics are formed by grouping terms that are proximal, in the sense that they are treated together
in a large proportion of documents in the dataset. There, the 5 most important topics that emerge
are: production planning (topic 1, red), industry services (topic 2, blue), business management
(topic 3, green), competitiveness (topic 4, purple) and logistics (topic 5, orange).
The visualisation of the topic map is obtained by processing the term-to-document occurrence
matrix [6, 8] and applying a dimensionality reduction technique to obtain a 2D projection on the
two dimensions embedding the widest variability (here we used the MCA algorithm [15]).
In Figure 6d one can see an alternative view of the topic map, known as a dendrogram. In
this representation, a hierarchical tree is built from the associations found between proximal terms.
Therefore, each topic correspond to the set of terms sharing a common ancestral branch in the
tree. Different groupings can emerge as one navigates through the levels of the hierarchy; thus, a
cutoff level must be chosen. In this case, we chose the cutoff that produced the same clusters as
those in the topic map shown before (albeit with a distinct colour legend). One of the advantages
of dendrograms is that they allow greater readability of the terms included in each topic; another
is the ability to find more generic or more specialised topics as the analyst move the cutoff level up
or down in the hierarchy.
Let us comment that again, both topic maps and dendrograms can be generated from the various
text fields in the metadata, so visualising and comparing them can be useful to capture a broader
picture of the knowledge structures that develop from the dataset. As an example, we report those
plots in the supplementary section, Figure S4 and Figure S5.
Another useful approach to discovering the underlying conceptual structures of the programme’s
research landscape, is to analyse the co-occurrence of terms in subsets of documents to derive a net-
work graph, such as that obtained from the author’s keywords in the dataset (as seen in Figure 6e).
Here, mainstream concepts appear in the central area of the network, while the unconventional or
highly specialized concepts will be placed on the periphery. For instance, the network in the figure
shows as core concepts, Business management (gestion empresarial ), Production planning (control
de la produccion) or Knowledge management (gestion del conocimiento), whilst System Dynamics
(dinamica de sistemas, Humanitarian logistics logistica humanitaria), Metaheuristics (metaheuris-
ticas) or Fuzzy Systems, (sistemas difusos) appear as specialised concepts.12 Chaparro and Rojas–Galeano
(a) Frequent words (titles) (b) Word cloud (abstracts)
(c) Topic map (keywords) (d) Word dendrogram (keywords)
(e) Co-occurrence network (keywords) (f) Thematic map (keywords)
Fig. 6: Results of the RQ2 analysis (conceptual structures) for the MIE dataset.
In the co-occurrence network, the strength of the relationship is visualised as the intensity of
the edges and the proximity of the vertices. As a result, it is also possible to identify clusters of
concepts that indicate the formation of underlying topics; for example, the brown and green clustersRevealing the research landscape of Master’s degrees 13
in Figure 6e correspond to the Medicine (medicina) and Management models (modelos de gestion)
topics, respectively. Furthermore, these networks can also be generated from the other text fields
in the metadata (e.g. see supplementary Figure S6).
Along the same lines, an alternate representation of the conceptual structures that can be de-
rived from the co-occurrence network is the thematic map. To do this, the topics of the network
are projected onto a 2D map whose dimensions are centrality (relevance of a theme in the research
field) and density (maturity on the development of a theme). Therefore, the four quadrants of the
map (counterclockwise) would represent motor themes (first quadrant), isolated but highly spe-
cialised themes (second), emerging themes (third) and fundamental themes (fourth); centrality and
density are calculated from the co-occurrence of keywords network (see [14] for details). Figure 6f
illustrates the thematic map of the analysed dataset, where topics related to System Dynamics and
Service Industries appear as fundamental themes, Competitiveness and Economy appear as motor
themes, while Fuzzy Systems and Metaheuristics as emerging themes. The companion thematic
map generated from unigram keywords is included in the supplementary Figure S7.
Lastly, to conclude the analysis of the conceptual structures, patterns of concept contributions
from dissertations associated to groups or supervisors, throughout their author’s keywords can
be represented in an energy flow diagram (also known as alluvial diagrams [48]), like the one in
Figure 7. Keywords are positioned in the middle of the flow, between the most prolific groups and
authors; in this way it is possible to identify strengths of the groups, as well as the expertise of
supervisors. The figure shows that, as before, System Dynamics and Competitiveness are two of the
most dominant concepts, receiving contributions from many groups and supervisors. Additionally,
the emerging or specialised topics identified in the previous analyses, can also be discovered here
(e.g. Fuzzy Systems).
RQ3. Collaboration structures
The aim in this stage is to reveal the collaboration patterns implicitly evolved within the Master’s
programme, considering the social networks of authors and groups, and the intellectual networks
of common references found among the dissertations. The results are shown in Figure 8.
Fig. 7: Energy flow through conceptual structures (MIE dataset).14 Chaparro and Rojas–Galeano
(a) Authors collaboration network (b) Authors coupling network
(c) Co-citation references network (d) Manuscript coupling network
Fig. 8: Results of the RQ3 analysis (collaboration structures) for the MIE dataset.
Let us start discussing the network of authors collaboration shown in Figure 8a, which is ob-
tained by finding the co-occurrences in the list of authors of the dissertations. Since we assumed
authors comprise the students and their supervisors, we can identify three different types of struc-
tures in the network. First, there are star-shaped clusters, in which a single supervisor (central node
in the cluster) has collaborated with many students to produce several dissertations (see e.g. clus-
ters with the central label meza-alvarez or medina-garcia in the figure); the number of dissertations
is proportional to the size of the central label.
Secondly, there are some triangle-shape clusters, which indicate that two supervisors collabo-
rated with a student in his/her dissertation (e.g. the benitez+sanchez+alvarez or the perez+calvo+castro
clusters). And thirdly, there are larger clusters that combine the previous two types, repre-
senting extended links of collaboration between several supervisors and students (e.g the or-
juela+soriano+rueda or mendez+torres+guadarrama clusters). The latter suggests the formation
of communities.Revealing the research landscape of Master’s degrees 15
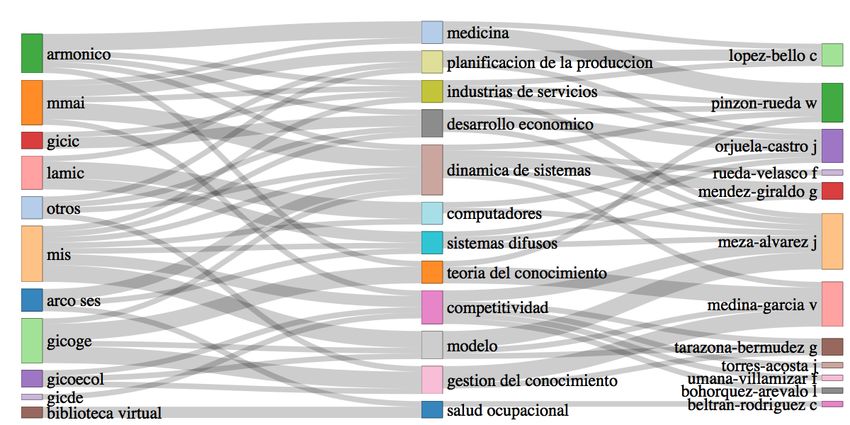
Fig. 9: Energy flow through social structures (MIE dataset).
Now let us move on to the author’s bibliographic coupling network of Figure 8b. In this network,
two authors are connected if they have a common reference cited in the references list of their oeuvres
included in the dataset [61]; in this case, the oeuvres would be individual dissertations for student
authors, or the sets of supervised dissertations, for supervisors. As a result, the formation of several
clusters of active authors sharing research interests can be discovered.
Another perspective of intellectual structures, is given by the network of co-cited references,
that is, the frequency with which two references are cited jointly across many manuscripts [52]. This
network provides a glimpse of influential works in the literature that are being referenced in subsets
of the analysed dataset. As a complement of the topic and thematic maps, this intellectual network
may be useful to identify paradigms, or influential authors adopted by the Master’s communities,
as shown in Figure 8c.
A closely related analysis of intellectual structures is the manuscript coupling network (Figure 8d).
In this case, the connections arise when the dissertations refer to shared works in their bibliogra-
phies. Therefore, this network identifies dissertations that develop related themes using a common
theoretical framework. That said, we note that the analysis can be extended to a variety of other
type of bibliographic couplings, so as to discover further social or intellectual structures underlying
the programme (see [45] or also an in-depth discussion in [8]).
Lastly, we note that the aforementioned energy flow diagram can also be used to visualise
collaboration structures between groups and authors, such as in Figure 9. Here, the widths of the
authors bands are proportional to the amount of supervised dissertations.
RQ4. Critical assessment of the Master’s research landscape
The findings reported for RQ1, RQ2 and RQ3 in previous sections, provide a comprehensive
view of the research landscape of the Masters’ programme, which allow us to draw the following
conclusions. During the 2010-2020 period, the MIE programme exhibited a moderate production
output (average of 13.0 dissertations per year), considering that the student admission rate is nearly
twice this number per year. Besides, the dynamics of production remained stable until 2016, but it
has been decreasing from 2017-2020. It would be prudent to follow up with the authors to verify the
difficulties encountered that delay the research plan of the dissertations started in that subperiod.
On the other hand, supervision has been carried out by 45 professors, although a biased dis-
tribution was found towards 12 supervisors, accounting for around 71% of the thesis production
during the observation period. Given that only four faculty members were active as supervisors of16 Chaparro and Rojas–Galeano
completed dissertations in the last 3 years, it would be cautious to secure additional support (in
funding or dedication time) to promote the willingness to assume supervision duties.
Now, the research strengths of the programme are mainly related to the following driving themes:
production planning, system dynamics and industry competitiveness. Nonetheless, there are emerg-
ing topics gaining momentum, such as fuzzy systems and metaheuristics. In a way, these topics can
be associated to the new focus given to the programme in 2014, emphasising in Logistics (that can
be related to production planning), Organisation Management (related to system dynamics and
industry competitiveness) and Business Intelligence (related to fuzzy systems and metaheuristics).
Regarding citation impact, an average 0.24 cites per manuscript is relatively low compared to
other international programmes; curiously enough, the two most cited dissertations addressed the
topics of complex systems and transport systems, which are not closely related to those dominant
or emerging topics mentioned above. Thus, on the one hand, it would be interesting to reflect on
the contribution of the dominant and emerging thematic areas towards the strategic goals of the
programme proposed for the short- and medium-term. And, on the other hand, it is recommended
to promote a wider visibility of previous works in the incoming students, to facilitate growth of
thematic areas addressed in past dissertations.
Additionally, it is worth noting the programme is deeply motivated to propose industrial en-
gineering applications in the context of the capital city, as nearly a quarter of the dissertations
included the term “Bogotá” in their titles or index terms. This is in line with the historical roots
and closeness that the city maintains with the university, which incidentally is also its main sponsor.
In terms of collaboration structures, the programme has developed a few communities of multiple
faculty researchers working on related subjects, although most of the collaboration is accomplished
as isolated clusters of supervisors working alone with their students. This suggests that intragroup
collaborations are rare, despite the fact that most groups consists of several faculty members rather
than a small number of one-person groups. Therefore, initiatives to promote information-sharing
and co-working, including internal seminars and workshops, would be strongly recommended.
5 Conclusion
The workflow described in this paper leverages a variety of complementary bibliometric facets (de-
scriptive, trends, conceptual, social and intellectual analyses) to assess the research output landscape
of a MSc. programme, with respect to the structure and dynamics patterns emerging during an ob-
servation window. The insights gained from each analysis are aggregated to obtain a comprehensive
picture of such landscape, as demonstrated by the reported cases.
If carried out regularly, the workflow can be used to track the evolution of the programme’s
behaviour over time, providing decision-makers with actionable insights to guide the short, medium
and large–term strategic planning. Thus, it may also be advantageous to perform comparative
studies with similar programmes from different institutions, or to help measure its level of maturity
or academic quality achievements.
The multifaceted nature of our approach is in accordance with the increasingly adopted stance
of a multidimensional understanding of the scientific impact and quality of research output, in
contrast to a citations-focused appraisal (see [2] and references within). We advocate that these
multidimensional assessments provide a more critical and comprehensive overviews of the strengths
and weaknesses of the programme, benefiting the stakeholders, whether being those defining the
orientations inside the programme, or those who review it externally from the funding agencies or
government research policy agencies.
Finally, the workflow can be considered as a framework for analysing master’s profiles for a vari-
ety of products, such as papers, grey literature, or software developed by the groups and researchers
associated with it. Likewise, it can be extended to other existing or novel bibliometrics techniques,
or to different bibliometric software tools. In fact, we anticipate the approach can be applied alsoRevealing the research landscape of Master’s degrees 17
to other academic units, such as PhD. courses, research labs and institutes, or even entire graduate
schools; how to establish the length of the observation window and the frequency of application
depending on the discipline, the purposes and the unit of the study, are interesting questions to
address in future work.
Acknowledgements
The authors are grateful to Lindsay Álvarez from the School of Engineering of Universidad Distrital
Francisco José de Caldas, for her valuable comments and discussions that helped shape the tone
of the manuscript. They also would like to thank Carolina Suárez from the same school, for her
careful review and suggestions that helped clarify some aspects of the text.
References
1. Quratul Ain, Hira Riaz, and Muhammad Tanvir Afzal. Evaluation of h-index and its citation intensity
based variants in the field of mathematics. Scientometrics, 119(1):187–211, 2019.
2. Dag W Aksnes, Liv Langfeldt, and Paul Wouters. Citations, citation indicators, and research quality:
An overview of basic concepts and theories. Sage Open, 9(1):2158244019829575, 2019.
3. Ghada Alaa. Derivation of factors facilitating organizational emergence based on complex adaptive
systems and social autopoiesis theories. Emergence: Complexity & Organization, 11(1):19–34, 2009.
4. Sergio Alonso, Francisco Javier Cabrerizo, Enrique Herrera-Viedma, and Francisco Herrera. h-index:
A review focused in its variants, computation and standardization for different scientific fields. Journal
of informetrics, 3(4):273–289, 2009.
5. Luz E Bohórquez Arévalo and Angela Espinosa. Theoretical approaches to managing complexity in
organizations: A comparative analysis. Estudios Gerenciales, 31(134):20–29, 2015.
6. Massimo Aria and Corrado Cuccurullo. bibliometrix: An R-tool for comprehensive science mapping
analysis. Journal of Informetrics, 11(4):959–975, 2017.
7. Massimo Aria, Michelangelo Misuraca, and Maria Spano. Mapping the evolution of social research and
data science on 30 years of Social Indicators Research. Social Indicators Research, pages 1–29, 2020.
8. Vladimir Batagelj and Monika Cerinsek. On bibliographic networks. Scientometrics, 96(3):845–864,
2013.
9. Dan Ben-David. Ranking israel’s economists. Scientometrics, 82(2):351–364, 2010.
10. João Brito, George P Nassis, André T Seabra, and Pedro Figueiredo. Top 50 most-cited articles in
medicine and science in football. BMJ open sport & exercise medicine, 4(1), 2018.
11. Maura Campra and Paolo Esposito Valerio Brescia. State of the art of covid-19 and business, manage-
ment, and accounting sector. a bibliometrix analysis. International Journal of Business and Manage-
ment, 16(1), 2021.
12. Christian A Cancino, José M Merigó, and Freddy C Coronado. A bibliometric analysis of leading
universities in innovation research. Journal of Innovation & Knowledge, 2(3):106–124, 2017.
13. Mohamad Chahrour, Sahar Assi, Michael Bejjani, Ali A Nasrallah, Hamza Salhab, Mohamad Fares,
and Hussein H Khachfe. A bibliometric analysis of Covid-19 research activity: A call for increased
output. Cureus, 12(3), 2020.
14. Manuel J Cobo, Antonio Gabriel López-Herrera, Enrique Herrera-Viedma, and Francisco Herrera. An
approach for detecting, quantifying, and visualizing the evolution of a research field: A practical appli-
cation to the fuzzy sets theory field. Journal of informetrics, 5(1):146–166, 2011.
15. Corrado Cuccurullo, Massimo Aria, and Fabrizia Sarto. Foundations and trends in performance man-
agement. a twenty-five years bibliometric analysis in business and public administration domains. Sci-
entometrics, 108(2):595–611, 2016.
16. Prabir Kumar Das. Journal of Informetrics: A bibliometric profile. DESIDOC Journal of Library &
Information Technology, 33(3), 2013.
17. Hamid Derviş. Bibliometric analysis using Bibliometrix an R Package. Journal of Scientometric Re-
search, 8(3):156–160, 2019.18 Chaparro and Rojas–Galeano
18. Naveen Donthu, Satish Kumar, and Debidutta Pattnaik. Forty-five years of Journal of Business Re-
search: A bibliometric analysis. Journal of Business Research, 109:1 – 14, 2020.
19. Edward J Eckel. The emerging engineering scholar: a citation analysis of theses and dissertations at
Western Michigan University. Issues in Science & Technology Librarianship, 2009(56), 2009.
20. B Elango and P Rajendran. Authorship trends and collaboration pattern in the marine sciences lit-
erature: a scientometric study. International Journal of Information Dissemination and Technology,
2(3):166–169, 2012.
21. Jurgen Fenn. Managing citations and your bibliography with bibtex. The PracTEX Journal,(4), 2006.
22. Giulio Fortuna, Massimo Aria, Alfonso Piscitelli, Michele D Mignogna, and Gary D Klasser. Global
research trends in complex oral sensitivity disorder: A systematic bibliometric analysis of the structures
of knowledge. Journal of Oral Pathology & Medicine, 49(6):565–579, 2020.
23. Vahid Garousi and Mika V Mäntylä. Citations, research topics and active countries in software engi-
neering: A bibliometrics study. Computer Science Review, 19:56–77, 2016.
24. Arzu Tugce Guler, Cathelijn JF Waaijer, Yassene Mohammed, and Magnus Palmblad. Automating
bibliometric analyses using Taverna scientific workflows: A tutorial on integrating Web Services. Journal
of Informetrics, 10(3):830–841, 2016.
25. Pao-Nuan Hsieh, Tao-Ming Chuang, and Mei-Ling Wang. A bibliometric analysis of the theses and
dissertations on information literacy published in the United States and Taiwan. In Advances in
Intelligent Systems and Applications-Volume 1, pages 337–348. Springer, 2013.
26. Michael J Jacobson, James A Levin, and Manu Kapur. Education as a complex system: Conceptual
and methodological implications. Educational Researcher, 48(2):112–119, 2019.
27. Samir Kumar Jalal. Co-authorship and co-occurrences analysis using Bibliometrix R-package: a case
study of India and Bangladesh. Annals of Library and Information Studies (ALIS), 66(2):57–64, 2019.
28. E Javid, M Nazari, and M Ghaeli. Social media and e-commerce: A scientometrics analysis. Interna-
tional Journal of Data and Network Science, 3(3):269–290, 2019.
29. Madeline Kelly. Citation patterns of engineering, statistics, and computer science researchers: An inter-
nal and external citation analysis across multiple engineering subfields. College & Research Libraries,
76(7):859–882, 2015.
30. Kayvan Kousha and Mike Thelwall. Can Google Scholar and Mendeley help to assess the scholarly
impacts of dissertations? Journal of Informetrics, 13(2):467–484, 2019.
31. Kayvan Kousha and Mike Thelwall. Google Books, Scopus, Microsoft Academic and Mendeley for
impact assessment of doctoral dissertations: A multidisciplinary analysis of the UK. Quantitative
Science Studies, pages 1–26, 2020.
32. José Ricardo López-Robles, Jose Ramón Otegi-Olaso, Rubén Arcos, Nadia Karina Gamboa-Rosales,
and Hamurabi Gamboa-Rosales. Mapping the structure and evolution of jisib: A bibliometric analysis
of articles published in the journal of intelligence studies in business between 2011 and 2017. Journal
of intelligence studies in business, 8(3), 2018.
33. José M Merigó, Manuel J Cobo, Sigifredo Laengle, Daniela Rivas, and Enrique Herrera-Viedma. Twenty
years of Soft Computing: a bibliometric overview. Soft Computing, 23(5):1477–1497, 2019.
34. John Mingers. Measuring the research contribution of management academics using the Hirsch-index.
Journal of the Operational Research Society, 60(9):1143–1153, 2009.
35. Sanjukta Mondal, Amit Kumar Bandyopadhyay, and Bijan Kumar Roy. Bibliometric Analysis of Doc-
toral Dissertations in Political Science: a study of The University of Burdwan. International Research:
Journal of Library and Information Science, 7(3), 2017.
36. Sanjukta Mondal and Bijan Kumar Roy. Bibliometric study of PhD theses in Mathematics of The
University of Burdwan, 2005-2012. International Journal of Library and Information Studies, 8(1):343–
353, 2018.
37. José A Moral-Muñoz, Enrique Herrera-Viedma, Antonio Santisteban-Espejo, and Manuel J Cobo. Soft-
ware tools for conducting bibliometric analysis in science: An up-to-date review. El profesional de la
información (EPI), 29(1), 2020.
38. Vaidehi Nafade, Madlen Nash, Sophie Huddart, Tripti Pande, Nebiat Gebreselassie, Christian Lien-
hardt, and Madhukar Pai. A bibliometric analysis of tuberculosis research, 2007–2016. PloS one,
13(6):e0199706, 2018.
39. Nilofer Nishat, Kaustuv Chakrabarti, and Deep Kumar Kirtania. Bibliometric study of the M. Phil.
Dissertations in Library & Information Science awarded under the University of Calcutta during the
period from 2004 to 2016. Library Philosophy and Practice, pages 1–11, 2019.Revealing the research landscape of Master’s degrees 19
40. Brian A Nosek, Jesse Graham, Nicole M Lindner, Selin Kesebir, Carlee Beth Hawkins, Cheryl Hahn,
Kathleen Schmidt, Matt Motyl, Jennifer Joy-Gaba, Rebecca Frazier, et al. Cumulative and career-stage
citation impact of social-personality psychology programs and their members. Personality and Social
Psychology Bulletin, 36(10):1283–1300, 2010.
41. E Noyons, H Moed, and A Van Raan. Integrating research performance analysis and science mapping.
Scientometrics, 46(3):591–604, 1999.
42. Thalis Regina Silva Paiva, Thaı́s Costa de Oliveira, Ana Mabel Sulpino Felisberto, Thainá Karo-
line Costa Dias, Gerson Ribeiro da Silva, and Isabelle Cristinne Pinto Costa. Scientific production
of dissertations and theses on palliative care and chronic diseases: Bibliometric study. Revista de
Pesquisa, Cuidado é Fundamental Online, 12:723–729, 2020.
43. Anne Parlina, Kalamullah Ramli, and Hendri Murfi. Theme Mapping and Bibliometrics Analysis of
One Decade of Big Data Research in the Scopus Database. Information, 11(2):69, 2020.
44. Banalata Pradhan, Dola Babu Ramesh, et al. Scientometric analysis of research publications of six
Indian Institutes of Technology. Annals of Library and Information Studies (ALIS), 65(1):50–56, 2018.
45. Jun-Ping Qiu, Ke Dong, and Hou-Qiang Yu. Comparative study on structure and correlation among
author co-occurrence networks in bibliometrics. Scientometrics, 101(2):1345–1360, 2014.
46. K. Ramasamy and P. Padma. Mapping The Research Output Of “Journal Of Bioscience And
Bioengineering”(2007-2016): A Single Journal Scientometric Study. Library Philosophy and Practice,
(1586), 2017.
47. Simon Gomez Rosselli and Diego Rosselli. Bibliometric analysis of engineering publications in colombia,
2010-2019: a scopus analisis. DYNA, 88(216):9–14, 2021.
48. Martin Rosvall and Carl T Bergstrom. Mapping change in large networks. PloS one, 5(1):e8694, 2010.
49. Norma Salgado-Orellana, Emilio Berrocal de Luna, and Calixto Gutiérrez-Braojos. A scientometric
study of doctoral theses on the Roma in the Iberian Peninsula during the 1977–2018 period. Sciento-
metrics, pages 1–22, 2020.
50. Rubén Sánchez-Perdomo, Marinelsy Rosario-Sierra, Darlenis Herrera-Vallejera, Yaniris Rodrı́guez-
Sánchez, and Humberto Carrillo-Calvet. Revisión bibliométrica de las Ciencias de la Información en
América Latina y el Caribe. Investigación bibliotecológica, 31(SPE):79–100, 2017.
51. H Zyoud Sa’ed, W Stephen Waring, Samah W Al-Jabi, and Waleed M Sweileh. Global cocaine in-
toxication research trends during 1975–2015: a bibliometric analysis of Web of Science publications.
Substance Abuse Treatment, Prevention, and Policy, 12(1):1–15, 2017.
52. Henry Small. Co-citation in the scientific literature: A new measure of the relationship between two
documents. Journal of the American Society for information Science, 24(4):265–269, 1973.
53. Carolina Suárez-Roldán, Nathalia Chaparro, and Sergio Rojas-Galeano. Bibliometric Study of the
Journal Ingenierı́a (2010-2017). Ingenierı́a, 24:96 – 115, 08 2019.
54. Javier Tarrı́o-Saavedra, Elena Orois, and Salvador Naya. Estudio métrico sobre la actividad inves-
tigadora usando el software libre R: el caso del sistema universitario gallego. Investigación Bib-
liotecológica: archivonomı́a, bibliotecologı́a e información, (especial de bibliometrı́a):221–247, 2017.
55. Daniel Torres-Salinas. Ritmo de crecimiento diario de la producción cientı́fica sobre Covid-19. Análisis
en bases de datos y repositorios en acceso abierto. El Profesional de la Información, 29(2), Apr 2020.
56. Anthony F.J. van Raan and C.M. Noyons. Discovery of patterns of scientific and technological devel-
opment and knowledge transfer. In Conference on Current research information systems (CRIS2002),
2002.
57. Anjali Verma, Sharad Kumar Sonker, and Vibha Gupta. A Bibliometric Study of The Library Philos-
ophy And Practice (E-Journal) For The Period 2005-2014. Library Philosophy and Practice, (1292),
2015.
58. Thierry Warin. Global Research on Coronaviruses: An R Package. Journal of medical Internet research,
22(8):e19615, 2020.
59. Geoff Woolcott, Simon Leonard, Amanda Scott, Robyn Keast, and Dan Chamberlain. Partnered re-
search and emergent variation: developing a set of characteristics for identifying complexity in higher
education partnerships. Journal of Higher Education Policy and Management, 43(1):91–109, 2021.
60. Dejian Yu, Zeshui Xu, and Wanru Wang. Bibliometric analysis of fuzzy theory research in China: A
30-year perspective. Knowledge-Based Systems, 141:188–199, 2018.
61. Dangzhi Zhao and Andreas Strotmann. Evolution of research activities and intellectual influences
in information science 1996–2005: Introducing author bibliographic-coupling analysis. Journal of the
American Society for Information Science and Technology, 59(13):2070–2086, 2008.You can also read