Environmental Modelling and Software - WUR E ...
←
→
Page content transcription
If your browser does not render page correctly, please read the page content below
Environmental Modelling and Software 141 (2021) 105054
Contents lists available at ScienceDirect
Environmental Modelling and Software
journal homepage: www.elsevier.com/locate/envsoft
Ambiguity in social ecological system understanding: Advancing modelling
of stakeholder perceptions of climate change adaptation in Kenya
Charlotte Esmeralda de Jong a, c, *, Kasper Kok b
a
Soil Geography and Landscape Group, Wageningen University & Research, P.O. Gox 47, 6700AA, Wageningen, the Netherlands
b
Environmental Systems Analysis Broup, Wageningen University & Research, P.O. Box 47, 6700AA, Wageningen, the Netherlands
c
NoorderRuimte, Institute of Future Environments, Hanze University of Applied Sciences, Zernikeplein 7, P.O. Box 3037, 9701 DA, Groningen, the Netherlands
A R T I C L E I N F O A B S T R A C T
Keywords: Climate change adaptation requires understanding of complex social ecological systems (SESs). One source of
Ambiguity uncertainty in complex SESs is ambiguity, defined as the range and variety of existing perceptions in and of an
Social ecological systems SES, which are considered equally valid, resulting in a lack of a unique or single system understanding. Current
Fuzzy cognitive maps
modelling practices that acknowledge the presence of ambiguity in SESs focus on finding consensus with
Climate change adaptation
Participatory modelling
stakeholders; however, advanced methods for explicitly representing and aggregating ambiguity in SESs are
underdeveloped. Moreover, understanding the influences of ambiguity on SES representation is limited. This
paper demonstrates the presence and range of ambiguities in endogenous and exogenous system drivers and
internal relationships based on individual fuzzy cognitive maps derived from stakeholder perceptions of climate
change adaptation in Kenya and introduces an ambiguity based modelling process. Our results indicate that
acknowledging ambiguity fundamentally changes SES representation and more advanced methods are required.
1. Introduction include system dynamics models, Bayesian networks, coupled compo
nent models, agent-based models, and knowledge-based models (Kelly
Referred to by popular media as “the biggest threat facing humanity”,1 et al., 2013). Recently, eight major challenges for SES modelling were
future climate change is recognised as being hazardous for human and identified by Elsawah et al. (2020) including bridging epistemologies,
natural systems (IPCC, 2014). Adapting to climate change is a complex dealing with uncertainties, and integrating the human dimension, which
issue because of the numerous interactions between the human and form the broad focus of this research. First, the challenge of bridging
natural systems (Pahl-Wostl, 2007). A leading concept in adaptive epistemologies emerges because scientists disagree on how to represent
complex systems thinking is the notion of the social ecological system a system due to fundamental paradigmatic differences between the so
(SES; Audouin et al., 2013, Berkes and Folke, 1998; Biggs et al., 2015; cial and environmental sciences. Second, the challenge of dealing with
Preise et al., 2018). In a SES, human and natural systems are inherently uncertainties emerges because of the disagreement between what is
intertwined; human systems include elements such as values, decisions, considered structural uncertainty (i.e. model context and model pur
and perceptions, and natural systems relate to biophysical elements pose) and model uncertainty (i.e. data and parameters). Third, inte
including the ecological and hydrological cycles. Interactions are the grating the human dimension in SES models remains challenging due to
result of any behaviour within or between the human and natural sys a lack of understanding about specific social systems and disagreement
tems that reinforce or modify SES dynamics (Berkes and Folke, 1998). on the approaches to generalise social behaviour. Such a lack of un
Many different approaches, methods, and tools have been success derstanding is compounded by limited research funding in this area as
fully applied to improve SES understanding (e.g. Binder et al., 2013; well as privacy issues associated with the use of ‘big data’ to study social
Levin et al., 2013; Liu et al., 2007; Ostrom, 2009), often involving behaviour patterns. Here, we argue that these three challenges are
modelling aimed at predicting, exploring, communicating, and learning connected by one common theme—the presence of ambiguity within
(Brugnach and Pahl-Wostl, 2008). Common modelling approaches and about SESs, and the absence of mutually acceptable and replicable
Abbreviations: ABA, Ambiguity based aggregation.
* Corresponding author.
E-mail address: c.e.de.jong@pl.hanze.nl (C.E. de Jong).
1
https://www.nytimes.com/2018/03/29/climate/united-nations-climate-change.html.
https://doi.org/10.1016/j.envsoft.2021.105054
Accepted 5 April 2021
Available online 14 April 2021
1364-8152/© 2021 The Authors. Published by Elsevier Ltd. This is an open access article under the CC BY license (http://creativecommons.org/licenses/by/4.0/).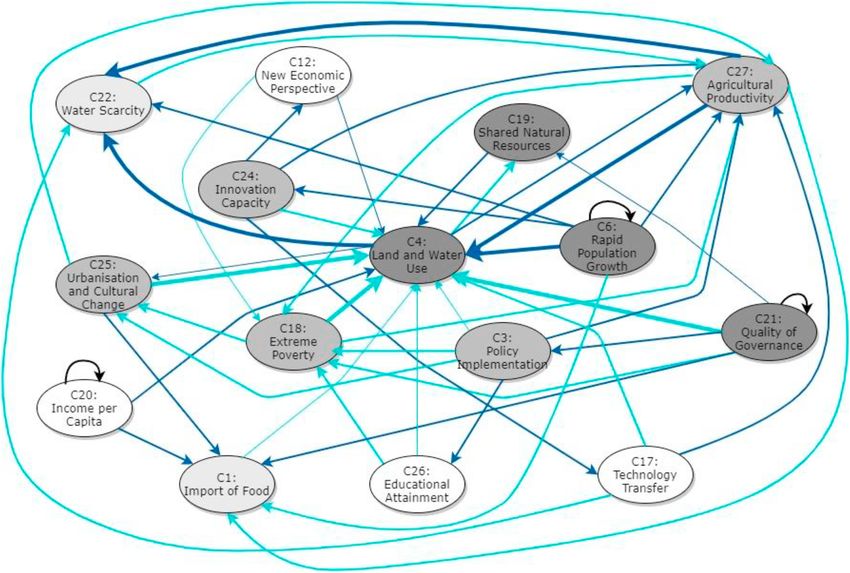
C.E. de Jong and K. Kok Environmental Modelling and Software 141 (2021) 105054
approaches to address ambiguity in current modelling practices. Aggregating individual FCMs can aid the capture of complexity because
Ambiguity is a type of uncertainty caused by the presence of multiple individual FCMs tend to contain few or no feedback loops (Levy et al.,
knowledge frames both about and within SESs, where “there is not a 2018). However, while particularly accounting for ambiguity, advanced
unique and complete understanding of the system to be managed” (Brugnach and mature FCM aggregation methods remain underdeveloped. To
et al., 2008). Multiple knowledge frames are considered equally valid address these limitations, the main objectives of this study are to (1)
and have an impact on, for example, how a problem is defined (Dewulf explicitly represent ambiguity in complex SESs using FCMs; (2) advance
et al., 2005). Here, we define ambiguity in SESs as the range and variety the aggregation process of FCMs while explicitly representing ambigu
of existing perceptions in and of an SES, which are equally valid, and ity; and (3) understand the influence of FCM aggregation on SES
which result in a lack of unique or single system understanding. Ambi representation.
guity in SESs is currently addressed in models through participatory
modelling (PM), which aims to generate multiple perceptions of SES 2. Background
system dynamics (Voinov et al., 2016). For example, some modelling
approaches specifically seek to integrate the opinions and values of 2.1. Ambiguity in SESs
scientists and stakeholders (Tuler et al., 2017; Voinov and Gaddis,
2017). An advantage of PM is that it can facilitate understanding of the Ambiguity, as a type of uncertainty described by Brugnach et al.
underlying beliefs and values of stakeholders about their environment (2008), can be approached using two broad strategies. First, a general
(Paolisso and Tombley, 2017), with a broad aspiration to improve ised ‘correct’ representation can be sought using epistemic strategies or,
standardised reporting and reproducible methods (Gray et al., 2018). alternatively, ambiguity is accepted as an inherent structural uncer
Therefore, we regard participatory modelling as an important example tainty that is addressed via ontological strategies. Through these ap
of how ambiguity is currently recognised and—at least parti proaches, epistemic strategies involve the negotiation of a mutually
ally—accounted for in SES modelling. acceptable frame, and ontological strategies relate to working with
Group-modelling workshops are a novel PM method for addressing different frames, respectively. Both approaches assume that a unique
ambiguity in which stakeholders are facilitated towards a common un system exists. In practice, the combination of these two approaches is
derstanding of an SES (e.g. Diniz et al., 2015; Henriksen et al., 2012; used to simulate the heterogeneity of perceptions by, for example,
Simon and Etienne, 2010; van der Sluis et al., 2019). An advantage of splitting stakeholders into different actor groups (Mehryar et al., 2019).
group modelling is that ambiguity is addressed by facilitating the deci Ambiguity in SESs can result from multiple system characteristics,
sion space in a way that supports collaboration; however, it is ques such as poorly defined system boundaries or multi-scale interactions
tionable whether group-modelling results in a common understanding (Cash et al., 2006), the treatment of system entities or structures (Kelly
because represented knowledge is dependent on group power dynamics et al., 2013), and the types of data employed (Elsawah et al., 2020). In
(Gray et al., 2014; Turnhout et al., 2020). Alternative methods address the case of the treatment of system entities or structures, the entities of
this issue by collecting and aggregating individual perceptions of system dynamics encompass both endogenous drivers (concepts) and
stakeholders into one model (e.g. Solana-Gutiérrez et al., 2017; Lavin exogenous drivers (drivers) as well as their interrelationships. Ambi
et al., 2018; Mehryar et al., 2019). While this approach increases the guity in concepts appears when decisions are made about whether or not
understanding of individual SES system dynamics (Gray et al., 2014), a certain element is included in the system representation; ambiguity in
when aggregated, heterogeneity in stakeholder perceptions is lost drivers appears when decisions are made about the driving capacity of
(Mehryar et al., 2019). Occasionally, studies have combined specific elements; and ambiguity in relationships appears when decision
group-modelling workshops and the collection of individual and/or are made about the existence, influence, and direction of these re
aggregated perceptions (e.g. Salliou et al., 2017). lationships. All of these system entities determine the representation and
If the goal of PM is to model how stakeholders perceive their SES, it is understanding of a system.
crucial to explicitly address the diversity of perceptions and, thereby, Ambiguity is mainly addressed through the collection of data for
inherent ambiguity. Most models derived using PM aim to develop a multiple knowledge frames. For example, Brugnach and Ingram (2012)
consensus system by aggregating perspectives, assuming that each provide recommendations for dealing with ambiguity at the stakeholder
stakeholder has limited knowledge of the entire system. Therefore, facilitation stage, including facilitating recognition of in
models that represent ambiguity are underdeveloped (Brugnach and terdependencies, building relationships, and creating a decision space
Ingram, 2012). We argue that explicitly representing ambiguity funda that supports collaboration. Therefore, excellent facilitation and careful
mentally changes the way we understand and represent complex SESs. stakeholder interaction are crucial for addressing ambiguity. Addition
Additionally, increasing transparency in the ambiguity of models is ally, following Bremer and Meisch (2017), who performed a compre
necessary to advance the field of PM and complex SES representation. hensive literature study on participation (or co-production) in climate
Identifying how one system can be modelled whilst also explicitly rep change research, eight ‘lenses’ of participation that bridge two funda
resenting multiple knowledge frames (i.e. ambiguity) is, therefore, a key mental usages of participation. First, participation is seen as a method to
research challenge. reach a common ‘normative’ goal. Second, ‘descriptive’ participation
Fuzzy cognitive maps (FCMs) are commonly used for PM-based focusses on how science and society shape each other and how this in
group model building and/or eliciting individual perspectives. In envi fluences both. This framing does not, however, address methodologies
ronmental sciences, FCMs are used in a participatory setting to bridge aimed at processing multiple knowledge frames toward a posteriori
the knowledge gap between stakeholders and scientists (Mallampalli models.
et al., 2016; Van Vliet, 2010), qualitative and quantitative modelling
(Kok, 2009; Van Vliet et al., 2017), and policy and practice (Sol 2.2. Fuzzy cognitive maps
ana-Guitiérrez et al., 2017). Moreover, FCMs are used to understand
stakeholder perspectives on concepts, driving relationships, and feed A FCM is a graphical presentation of a combination of endogenous
back loops within a system (Diniz et al., 2015; Özesmi and Özesmi, drivers (“concepts”) of a system and exogenous drivers (“drivers”) (Kok,
2004). Current FCM practices concentrate on finding consensus by 2009; Kosko, 1986; Jetter and Kok, 2014). Drivers are activated during
group modelling or aggregating individual FCMs. Aggregation practices each iteration step by the state vector and are usually ‘pure’ drivers,
aim to find similarities in the internal FCM structure using, for example, indicating concepts that do not have any incoming relationships from
mathematical simulations (Özesmi and Özesmi, 2004), whereas FCMs the system. The visualisation of FCMs takes the form of a FCM (Fig. 1,
that represent multiple perspectives could be more beneficial when di left), an adjacency matrix (Box 1), and a dynamic output (Fig. 1, right) as
versity and ambiguity are openly considered (van Vliet et al., 2010). a result of the final state of concepts from the iterations. The dynamic
2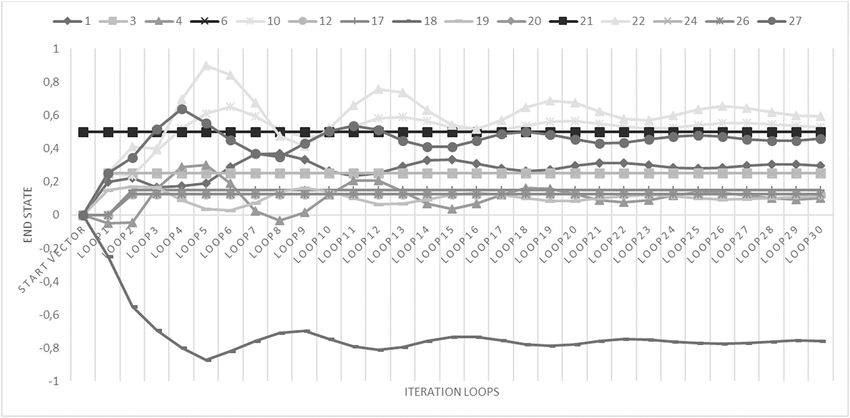
C.E. de Jong and K. Kok Environmental Modelling and Software 141 (2021) 105054
Fig. 1. Example of concepts and relationships in a fuzzy cognitive map (FCM, left) and an example of a FCM output (right) adapted from Kok (2009).
Box 1
Matrix iterations in FCM
Formula.
Ai = Ai-1 * E.
In which Ai is the (new) state vector after each iteration (i); A1 is the initial state vector for the iterations, usually set based on the drivers; and E
represents the matrix of all relationships.
To use the example of Figure 6:
State vector A1 = (1, 0, 1).
Matrix E =
Ai = A1 * E = (1, 0, 1) * = (1, 1.5, 1).
The new state vector is (1, 1.5, 1).
This process can be repeated until the FCM reaches a stable state.
output can diverge, converge, be cyclic, or be stable, depending on the Özesmi, 2018; Özesmi and Özesmi, 2004) to explore individual concepts
matrix. Only stable outputs are interpretable without a threshold (or and relationships or the overall FCM. One example is indegree, which is
‘clipper’ function). FCMs usually have a focal issue/concept around used to determine the sum of weights of incoming relationships that
which the system is built (Jetter and Kok, 2014). influence a certain concept. Indices used to analyse overall FCMs include
The aggregation of individual FCMs is frequently performed using the number of concepts and density, which is a measure of complexity
matrix algebra (e.g. Singh, 2011; Solana-Gutiérrez et al., 2017; Mehryar calculated as the actual number of relationships divided by the total
et al., 2019), in which numerical values are first assigned to the re maximum number of relationships in a FCM.
lationships of individual FCMs and then combined by taking the average
or median values. This can be based on either individual relationships or
groups of relationships (see Aminpour et al., 2020). Some alternative 2.3. Project background
methods aggregate individual FCMs using Atlas.ti coding to determine
the value of relationships (see Rahimi et al., 2018). Usually, all the The ‘SENSES2’ project (2017–2020) was part of the European
aforementioned relationships are included in the final aggregated FCM. Research Area for Climate Services (ERA4CS) with partners from the
Averaging solves the problem of conflicting relationships when one Netherlands, Germany, Sweden, and Austria. The SENSES project aimed
stakeholder indicates a strong negative relationship and another has a to make “scenario information accessible to users in interactive transparent
weak positive relationship. Nevertheless, this can result in an aggregated and comprehensible ways that help to convert scenario data into user-specific
FCM with a majority of medium relationships. As a result, averaging can scenario knowledge”. The overall project objective of SENSES was to
cause relationships to cancel each other out (for instance, − 0.8 and + develop a toolkit in which scenarios are communicated and tailored to
0.8 will be 0), which results in the appearance that there is no rela specific user groups and stakeholders by integrating climate change
tionship (Ozesmi, 2006). As such, the logic and reasoning of individual scenario information, participatory methods, and visualisation tools.
FCMs are lost, and relationships derived from individual stakeholders (i. The project incorporated regional case studies in the Netherlands
e. single-stakeholder relationships) can have a large influence on the
total system.
2
FCMs are frequently analysed using FCM indices (Özesmi and http://senses-project.org, https://climatescenarios.org/, http://www.jp
i-climate.eu/ERA4CS, http://www.jpi-climate.eu/home.
3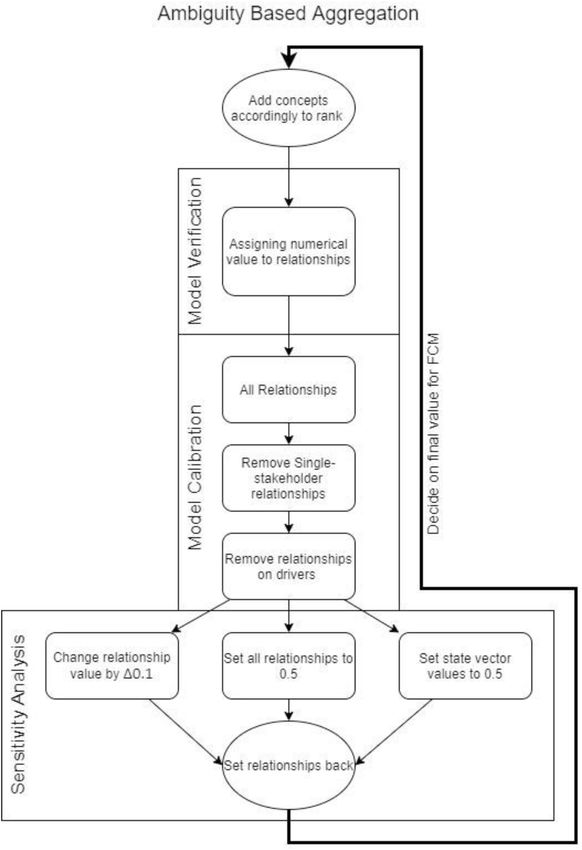
C.E. de Jong and K. Kok Environmental Modelling and Software 141 (2021) 105054
and Kenya. The Kenyan case study focussed on integrating the indirect currently addressed by the national government. The focus question of
impacts of climate change—so-called transnational climate impacts the brainstorm session was ‘What are the most important drivers for un
(TCI; Hedlund et al., 2018)—into climate change adaptation scenarios derstanding Kenya’s vulnerability to future transnational climate risks?’,
for Kenya. In the Global South in particular, climate change can lead to which was framed as challenges for climate change adaptation within
increased vulnerability and the deterioration of natural resources. As and outside of Kenya. For the first round of brainstorming, each
such, Kenya has been classified as a water-scarce country (Falkenmark, participant presented two concept ideas, which were written down on
1989) and prolonged droughts and extreme precipitation events have post-it notes. Participants could then choose to present one or two
already led to severe impacts across society, which will presumably additional ideas.
aggravated by climate change in the future (NCCAP2018-2022). All individuals’ ideas were then presented to the group, collected on
Therefore, societal adaptation to climate change is urgently required. the wall, and grouped into named clusters by the SENSES facilitation
The impacts of climate change span borders, sectors, and actors team. At the beginning of the next session, the workshop lead facilitator
including agriculture, water, energy, tourism, wildlife, and health, and verified that the participants agreed on the clusters. The concepts were
the national government, civil society, and youth (NCCAP2018-2022). subsequently labelled to determine their importance and uncertainty.
Agriculture in Kenya, which is mostly rain-fed, is the largest contributor Each participant received five red voting stickers to indicate the un
to the economy and is increasingly affected by water scarcity, leading to certainty of a concept, and five green voting stickers to indicate the
economic losses (NWMP, 2013). Therefore, land and water use are importance of a concept. This exercise began the development part of
strongly related. The involvement of multiple actors and sectors with the workshop but it served to determine the focal issue of the FCM.
multiple knowledge frames, and the fact that climate change can have Finally, the concepts derived from the stakeholders and the concepts
severe impacts on land and water use, suggests that climate change provided by Schweizer and O’Neill (2014) were combined to generate a
adaptation in Kenya requires deeper SES understanding. comprehensive list of concepts.
3. Stakeholder engagement and methodology 3.1.3. Eliciting FCMs via interviews
Interviews were conducted to further explore stakeholder perspec
3.1. Stakeholder engagement tives on relationships between the pre-defined concepts derived from
the workshop. During the interviews, individual FCMs were created to
Our stakeholder engagement adopted a mixed method approach connect the concepts, which were printed out to enable the stakeholders
consisting of the following three elements: (1) performing a stakeholder to indicate those that were most relevant from their own personal
analysis, (2) determining FCM concepts, and (3) eliciting individual perspective.
FCMs. The stakeholder analysis was based on the grey literature, FCM The purpose of the interview was explained to each participant, and
concepts were derived during a stakeholder workshop, and individual a FCM was shown to visualise the goal of the interview. The participants
FCMs were elicited during the stakeholder interviews. were assured that no direct quotes would be used, and permission was
sought for the interview to be recorded for verification purposes. Sub
3.1.1. Stakeholder analysis sequently, following some introductory questions, the stakeholders were
The stakeholder analysis utilised an analytical categorisation (top- invited to share their views on climate change effects in Kenya to
down) and a stakeholder-led categorisation (bottom-up) of sectors and stimulate conceptual and relational thinking.
actors (Reed et al., 2009). The analytical categorisation was based on Each stakeholder then constructed their individual FCM, placing the
national policy documents, with the Government of Kenya proposing focal issue in the centre. Concepts were then added to the map based on
several stakeholder lists via their climate adaptation policy documents the following questions:
(KNAP2015-2030; NCCAP2018-2022). In this context, actors were
defined as having an influence on climate change adaptation or being 1. Which concepts have a direct relationship with the focal issue?
influenced by climate change adaptation. Furthermore, the policy doc 2. Which concepts are directly influenced by the focal issue?
uments indicated several sectors involved in climate change adaptation
(NCCAP2018-2022). A stakeholder analysis by Ngigi et al. (2011) This provided the first outline of the individual’s FCM, after which
identified actors and sectors in Kenya, and ranked the (formal) influence the following questions were used to systematically discuss positive
of stakeholders on smallholder farmers. Here, actors who have and/or negative relationships between each concept:
large-to-moderate influence (i.e. non-governmental organisations
(NGOs) and ministries) and sectors that are primarily involved in 3. Do you think concept C1 influences concept C2? (Yes/No, if so why?)
climate change adaptation (environment, water, and agriculture) were 4. If concept C1 increases, then will concept C2 increase? (Yes/No, if so
selected. why?)
3.1.2. Defining concepts in a stakeholder workshop Finally, the stakeholders had the opportunity of adding concepts and
We used the output of a stakeholder workshop brainstorming session defining the relative strength of their relationships based on the
to define a list of concepts for the FCMs and the focal issues of the FCM. following questions:
The objective of the workshop, as part of the overall Kenyan case study,
was to create a skeleton (or base) for future scenarios as tools to explore 5. Do you think that there are crucial concepts which are missing?
future transnational climate impacts for Kenya. In the brainstorming 6. If concept C1 increases, how strongly does concept C2 increase? (If X
session, participants were invited to contribute ideas on the concepts of doubles, will Z double too?)
transnational climate impacts for Kenya. Global challenges for adapta 7. In relative terms, will the relationship A be stronger than relationship
tion from earlier research (Schweizer and O’Neill, 2014) were posted on B (Yes/No, if so why?)
the wall of the workshop room for inspiration. Additionally, the ‘Big
Four Agenda’ from Kenya Vision20303 was provided to highlight issues 3.2. Methodology
The analysis methodology consisted of three elements organised
3
The ‘Big Four Agenda’ from the Kenya Vision 2030 includes the four main around the three objectives. First, ambiguity was elucidated based on
governmental focus points of (1) food security, (2) affordable housing, (3) the individual FCMs. Second, a combined FCM was constructed using an
manufacturing, and (4) affordable healthcare for all. ambiguity based aggregation (ABA) process. Third, the effects of the
4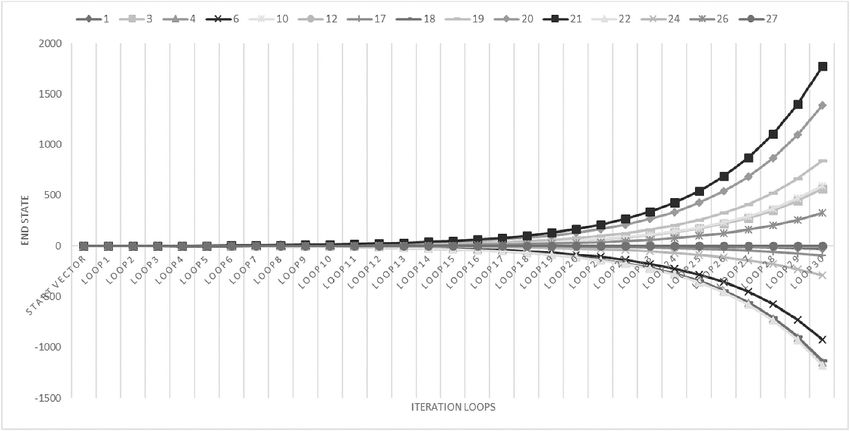
C.E. de Jong and K. Kok Environmental Modelling and Software 141 (2021) 105054
ABA process on the FCM indices were determined and compared with agreement, and so on. This approach elucidated the ambiguity regarding
the indices of the common aggregation method. the inclusion of concepts in the overall SES representation.
Step 2 involved ranking the drivers of the individual FCMs. The
3.2.1. Elucidating ambiguity agreement on the system drivers was tested by counting how often a
Three important steps were considered to explicitly represent am concept was considered to be a driver, defined as those concepts having
biguity using FCMs. The first step involved ranking the concepts, the no incoming relationships in the individual FCMs. The driver ranks were
second step involved ranking the drivers, and the third step involved then coupled to the concept ranks so that each rank indicated the
summarising the individual matrices. In step 1, the predefined concepts number of concepts and drivers (i.e. rank 10 with X concepts and X
were ranked according to how often they were included in all of the drivers). Furthermore, with the intention of limiting the number of
individual FCMs. For example, a rank score of 10 indicated agreement drivers in the SES representation, only those were used as concepts in
between 100% of the stakeholders, a rank score of 9 indicated 90% more than 30% of the individual FCMs were included. This elucidated
Fig. 2. Steps of ambiguity based aggregation (ABA) for fuzzy cognitive maps (FCMs).
5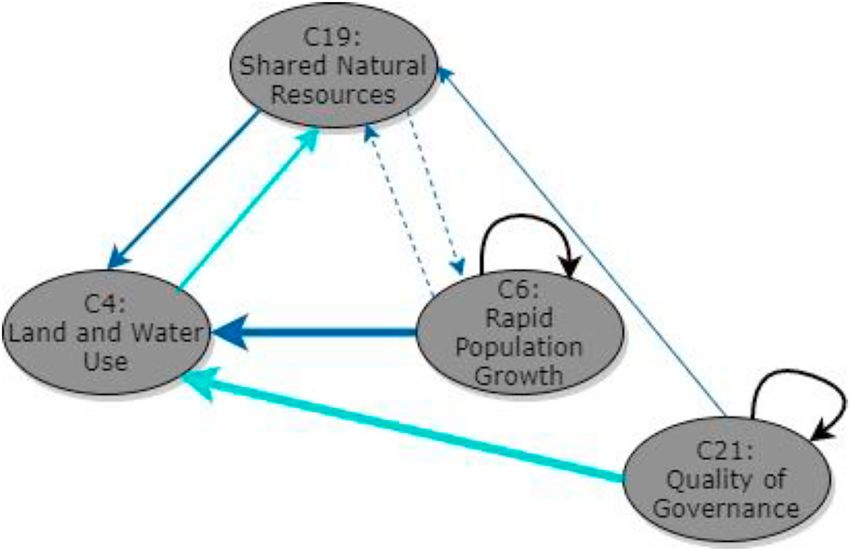
C.E. de Jong and K. Kok Environmental Modelling and Software 141 (2021) 105054
the ambiguity regarding the inclusion of drivers in the overall SES Using the calibrated output and behavioural understanding of the
representation. core FCM, the concepts and drivers with the second highest ranks (9)
In step 3, the individual matrices representing the individual FCMs were added (ABA-9). This process was then repeated until a desired
were combined into one matrix. The relationships in the matrix were aggregated system representation (with a corresponding range of am
summarised as indicated in the individual FCMs (i.e. strong, medium, biguity) was reached. The repetition of the process can be modified
and weak; and positive and negative) without quantifying the re regarding the objective of the FCM. For example, if the aim is to un
lationships. This elucidated the ambiguity in the system relationships derstand the core of an agreement, repetition can be limited; if the aim is
and summarised the perceptions of the presence, strength, direction, and to create a holistic view of stakeholder perceptions, repetition can be
influence (positive/negative) of the relationships in the overall SES maximized.
representation.
3.2.3. Comparing FCM indices
3.2.2. Ambiguity based aggregation (ABA) FCM system representation can be analysed in several ways (Levy
The ABA process (Fig. 2) was based on the notion of a core agree et al., 2018; Özesemi and Özesemi, 2004). Özesemi and Özesemi (2004)
ment, where we aimed to include part of the FCM characteristics (con proposed a number of indices including the number of drivers (Nd),
cepts and drivers) that were found to have the largest degree of number of concepts (Nc), number of relationships (Nr), and density (D),
agreement. Accordingly, the starting point of the ABA were the concepts which is defined as Nr/Nc.2 These FCM indices were calculated for the
with the highest rank. Subsequently, the corresponding drivers with the individual FCMs as well as the aggregated FCM using standard aggre
highest ranking were designated, and all relationships between the gation methods (see section 2.2). To understand how FCM indices were
concepts and drivers were then included. altered by the aggregation, the average and median indices of the
The ABA process adopted three common modelling procedures aggregated FCM were calculated and compared to the average and
(verification, calibration, and sensitivity analysis) as presented by Aral median values of the individual FCMs. Finally, to examine how the FCM
(2010), where “verification is a demonstration that the modelling indices were altered by the ABA process, they were calculated for the
formalism is correct”, calibration is “the adjustment of parameters of the three calibration steps of each ABA rank and compared with the indi
mathematical model such that the model agreement is maximized with vidual and standard aggregated values.
respect to the observation data we have on the modelled system”, and a
sensitivity analysis is “a simulation through which the modeler evalu 4. Results
ates the response of the model to changes in input parameters or
boundary condition of the model” (Aral., 2010, p.45–48). 4.1. Stakeholder engagement
The three modelling procedures were modified to fit the re
quirements for FCM development. 4.1.1. Stakeholder participation
The modified verification step aimed to interpret the relationships The stakeholder workshop, facilitated by the Swedish/Kenyan part
between the concepts according to the collective logic of the stake ners of the project, was organised on the 10th of January 2019 in Nai
holders and quantify them accordingly. Following La Mere et al. (2020), robi. To ensure consistency between the interviewees and workshop
verification was performed by comparing the summarised matrix of the participants, stakeholders to be interviewed were first approached
directly elicited individual FCMs with the transcribed interviews. First, during the workshop. The list of stakeholders was expanded by adding
as described by Jetter and Kok (2014), the direction of the relationship missing actors from the workshop and asking the participants for addi
(i.e. positive or negative) was determined; second, the relative strength tional names. A total of 11 stakeholders were interviewed in Nairobi
(strong, medium, or weak) was determined; and third, the actual nu during ten one-and-a-half hour interviews in January and February
merical integer was assigned. Strong relationships received a value be 2019, which provided ten individual FCMs. With a gender distribution
tween (− )0.9 and (− )0.7; medium relationships received a value of 55% female and 45% male, a workshop-interview consistency of
between (− )0.6 and (− )0.4; and weak relationships received a value of 36%–64% no-yes, and a mix of private and public actors within climate
(− )0.3 or (− )0.2. In each case, the final relationship value depended on change-affected sectors, we were able to capture a representative sample
a relative comparison with other relationships according to interview of stakeholder perceptions (Table 1).
question 7 (see section 3.1). Relationships identified by only one
stakeholder receive a value of (− )0.1, thereby moderating the influence
of single stakeholder relationships in the dynamic output of the overall
system representation. All of these verification steps and considerations
were summarised in a table for the core system, which provided an Table 1
overview of the core assumptions of the total ABA-FCM. Stakeholders interviewed during the case study. Gender distribution, actor
The subsequent calibration step aimed to generate an interpretable group, sector, and presence in the SENSES workshop are indicated (NGO = non-
stable dynamic FCM output. For this, we used Microsoft Excel to run 45 governmental organisation).
iterations and analyse the dynamic output by visualising a graph of the Actor group Sector Gender Workshop
iteration and corresponding state values of the concepts. Single- attendee
stakeholder relationships strongly influenced the dynamic output, Intergovernmental Climate F No
despite their low values; therefore, all single-stakeholder relationships National government Agriculture & Livestock F Yes
were removed. Additionally, all relationships between the concepts and National government Water (drought) M Yes
National government Environment F No
drivers were removed because of their disproportionate effect on the
County government Environment M Yes
dynamic output. These modifications generated a stable and calibrated University Climate change F Yes
dynamic FCM output. adaptation
A sensitivity analysis was then used to examine the behaviour of the University Climate change M Yes
system based on the ‘one factor at a time’ (with Δ0.1) approach (Ten adaptation
Consultant Climate change F Yes
Broeke et al., 2016), This generated an understanding of the influence of adaptation
the final relationship weights on the overall system. Next, all the rela NGO Climate change M Yes
tionship values were set to medium relationships (value of 0.5) and, adaptation
similarly, the state vector was halved (0.5) to examine the influence of NGO Energy M No
NGO Land use F No
this boundary condition on the dynamic output.
6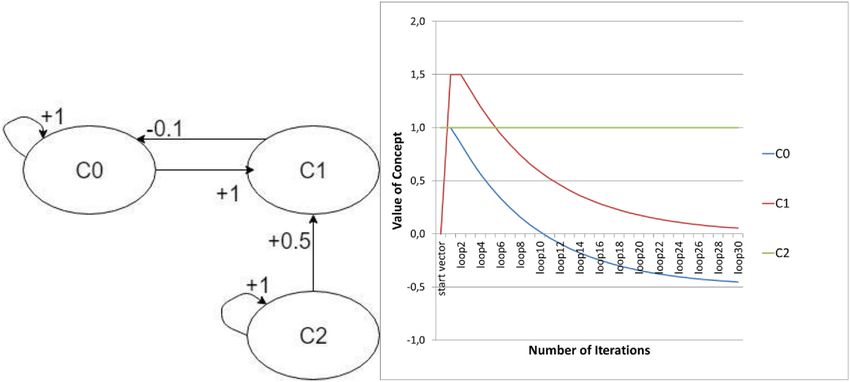
C.E. de Jong and K. Kok Environmental Modelling and Software 141 (2021) 105054
4.1.2. List of concepts Table 2
The workshop brainstorm session resulted in 19 concepts in which List of pre-defined concepts.
land and water use (C4) was prioritised. The concept list was completed Concept Name Description Source
with the addition of eight concepts listed by Schweizer and O’Neill
C1 Import of food Amount and type of food Workshop
(2014), giving 27 concepts considered a challenge for climate change that is imported in Kenya.
adaptation in Kenya (see Table 2). C2 Regional collaboration on The degree of collaboration Workshop
TCI in East-African boarder
4.1.3. Individual FCMs regions to share
information.
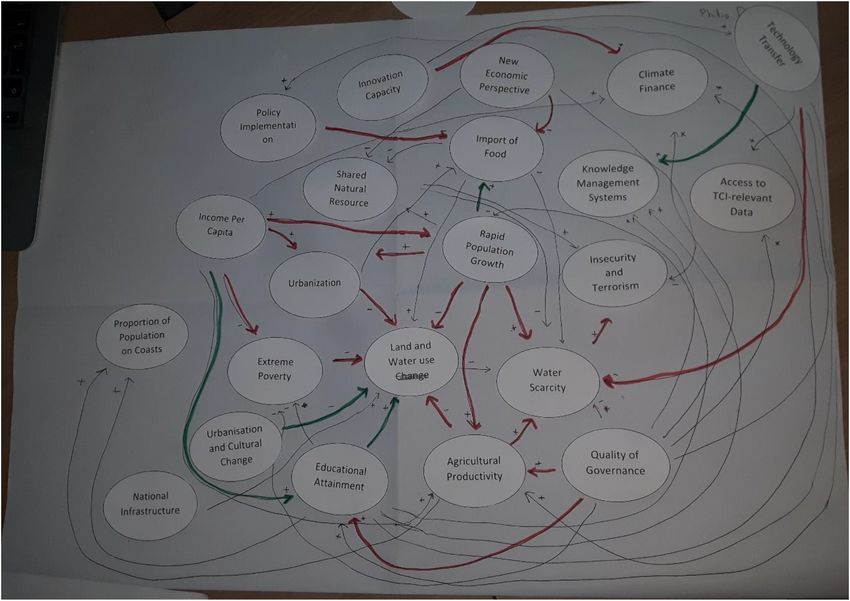
An example of an individual FCM is shown in Fig. 3. In general, C3 Policy implementation The degree in which policy Workshop
stakeholders found it difficult to define relatively stronger and weaker is transformed in to
relationships, and two stakeholders refused to do so. Some of the re tangible actions.
lationships were, therefore, only defined in terms of their direction. C4 Land use change in Kenya The amount of land and Workshop
(subsequently ‘land and water used.
water use’, identified as the
4.2. Ambiguity in FCM concepts, drivers, and relationships focal issue)
C5 Knowledge management The degree of access to Workshop
Considerable ambiguity was revealed in the FCM concepts, drivers, systems information platforms and
and relationships (Fig. 4). Of the 27 pre-defined concepts, all except C14 (international) sharing of
data/information.
(supply chain risk management) were included in the individual FCMs. C6 Rapid population growth The degree of population Workshop
Overall, four concepts were mentioned by every stakeholder, indicating growth in Kenya.
that 15% of the FCM concepts were mutually agreed upon. These four C7 Access to TCI-relevant data The degree of access to Workshop
concepts were C4 (land and water use, identified as the focal issue), C6 data regarding
transnational climate
(rapid population growth), C19 (shared natural resources), and C21
impacts.
(quality of governance). C8 Importing energy The amount of energy Workshop
There was no mutual agreement among drivers, however, with a imported.
total of 19 identified as those concepts having no incoming relationships C9 Climate finance The amount and access to Workshop
in the individual FCMs. The highest rank score was an agreement of 50% climate finance.
C10 Urbanisation and cultural The increase of rural to Workshop
for drivers C6 and C21. Based on a constraint of at least 30% agreement, change urban migration and
the following five drivers remained: C6 (rapid population growth), C9 decline of rural traditions/
(climate finance), C11 (national infrastructure), C20 (income per cap knowledge.
ita), and C21 (quality of governance). Two of the constrained drivers (C6 C11 National infrastructure Infrastructure that is Workshop
vulnerable to climate
and C21) correspond to the four concepts of mutual agreement.
change, especially flooding
Ambiguity in the FCMs was also strong in the identified concept (e.g. power dams/roads).
relationships, with no single relationship included in all cases. However, C12 New economic perspective Circular economy Workshop
relationship between C6 (rapid population growth) and C4 (land and businesses.
water use) was identified in 90% of the individual FCMs. The strength C13 Tourism in Kenya Wildlife migration/ Workshop
extinction and the effect of
and influence (positive/negative) of the relationships also varied, and in tourism.
some cases, relationships were undefined by the stakeholders, indicating C14 Supply chain risk An integrated and Workshop
uncertainty about their relative strengths. Table 3 displays the ABA-7 management sustainable value chain of
matrix and its corresponding concepts, drivers, and relationships, indi products.
C15 Insecurity and terrorism The decline of adaptive Workshop
cating a 70% agreement on the concepts. A fully summarised matrix is
capacity due to (the fear of)
provided in the Supplementary Materials. terrorism.
C16 Healthcare Access to healthcare and Workshop
4.3. Ambiguity based aggregated FCM emerging terminal
illnesses.
C17 Technology transfer Research and development Workshop
For brevity, here we show the verification step and the calibration of technologies to reduce
step of the ABA approach in detail, which accurately demonstrate the vulnerabilities.
overall process using the verification step of ABA-10 and the calibration C18 Extreme poverty Proportion of people in Workshop
step of ABA-7. The sensitivity analysis of the ABA-7 FCM is also extreme poverty.
C19 Shared natural resources Water availability and the Workshop
described for illustration.
quality of water/land.
ABA-10 (Fig. 5) included four concepts (C4, C6, C19, and C21), of C20 Income per capita See Schweizer and O’Neill Literature
which two were drivers (C6 and C21). Between the concepts and drivers, (2014)
seven relationships were defined, of which two were single stakeholder C21 Quality of governance See Schweizer and O’Neill Literature
relationships (and, therefore, has not yet been removed). (2014)
C22 Water scarcity See Schweizer and O’Neill Literature
The verification step, in which the relationships were quantified for (2014)
ABA-10, is shown in Table 4. The differences in the strength and influ C23 Proportion of population on See Schweizer and O’Neill Literature
ence (positive/negative) of the relationships occurred due to different coasts (2014)
interpretations of the concepts. For instance, as the focal issue, C4 was C24 Innovation capacity See Schweizer and O’Neill Literature
(2014)
interpreted as the amount of land and water use as well as sustainably
C25 Urbanization (subsequently See Schweizer and O’Neill Literature
managed land and water use. Moreover, shared natural resources were merged with C10) (2014)
interpreted as physical areas around the borders of Kenya by some C26 Educational attainment See Schweizer and O’Neill Literature
stakeholders while others implied the inclusion of all shared resources (2014)
within Kenya, such as national parks. C27 Agricultural productivity See Schweizer and O’Neill Literature
(2014)
Using the ABA-7 FCM matrix to illustrate the calibration steps, 15
concepts were included, of which three were drivers connected by 94
relationships. Starting with all relationships (calibration step 1), the
dynamic output was unstable (Fig. 6); the end state of the concepts
7
C.E. de Jong and K. Kok Environmental Modelling and Software 141 (2021) 105054
Fig. 3. An example individual stakeholder FCM. Red lines indicate strong relationships, green lines indicate weak relationships, and blue lines indicate medium-
strength relationships. The + and – signs next to the arrows indicate positive and negative relationships, respectively.
Fig. 4. Ambiguity in fuzzy cognitive map (FCM) concepts (see Table 2) and drivers. Concept rank relates to the degree of agreement where the rank 10 implies 100%
agreement, 9 implies 90% agreement, etc. The dotted line demonstrates the driver constraint of more than 30% agreement.
increased exponentially between 20 and 30 iterations. As a next step dynamic FCM outputs, the focal issue (C4) is pushed to the highest end
(calibration step 2), all single-stakeholder relationships were removed state. The second highest end state was C10 (urbanisation and cultural
from the matrix. This produced very similar results, with the same change) followed by C27 (agricultural productivity). In addition, one
concepts showing positive and exponentially increasing values. In cali concept (C18, extreme poverty) was identified as having a strong
bration step 3, the additional removal of relationships on drivers led to a negative value. This indicates that the three drivers of rapid population
stable set of concept values (Fig. 7). This shows that when calibrating a growth, income per capita, and quality of governance (C6, C20, and
FCM, removing influences on drivers is crucial. As is common in C21) increased the amount of land and water use, enhanced
8
C.E. de Jong and K. Kok                                                                                          Environmental Modelling and Software 141 (2021) 105054

      Table 3
      Ambiguity in relationships with a summarised matrix of up to 70% agreement (ABA-7) in which relationships between 15 concepts (see Table 2) and three
      drivers are displayed. “s” indicates strong relationships, “m” indicates medium-strength relationships, and “w” indicates weak relations; “o” represents
      relationships that were not defined in the individual FCMs. Yellow boxes indicate single-stakeholder relationships, dark shade positive and light shade
      negative.

Fig. 5. Constructed ABA-10 graph. Dark blue arrows indicate positive relationships and light blue arrows indicate negative relationships. The size of the arrow
(thick, medium, or small) represents a strong, medium, or weak relationship, respectively. Dotted arrows are single stakeholder relationships and black arrows
are drivers.

urbanisation and cultural change, increased agricultural productivity,               strong relationships stronger yields an explosive system that does not
and reduced extreme poverty.                                                         stabilise. Other value changes cause minor changes in the shape and
   The FCM is sensitive to strong relationships; the Δ0.1 change making              end-states of the concepts. When weakening the relationships by 0.1, the

                                                                                 9
C.E. de Jong and K. Kok Environmental Modelling and Software 141 (2021) 105054
Fig. 6. Dynamic fuzzy cognitive map (FCM) output with the ABA process up to 70% agreement on 15 concepts and three drivers, at step 1 of the calibration.
ranked order of land and water use, urbanisation, and cultural change This indicates that an ABA process can produce a stable output with FCM
was altered, but no other considerable end-state shifts occur. A recon indices similar to individual FCMs while, at the same time, elucidating
struction of the ABA-7 FCM (Fig. 8) shows a strong feedback loop be and aggregating multiple perspectives.
tween land and water use, water scarcity, agricultural productivity, and
back to land and water use. As a driver, rapid population growth en 5. Discussion and conclusions
forces agricultural productivity and land and water use, making this
loop even stronger. Given that FCMs display a substantial amount of ambiguity, our ABA
approach provides transparent steps for aggregating multiple FCMs. The
4.4. Influence of aggregation on FCM indices FCM aggregation method applied substantially influences FCM indices
and, therefore, SES representation. Nevertheless, explicitly representing
There was a wide range of drivers, concepts, and relationships in the ambiguity in complex SESs using FCMs, while advancing the aggrega
individual FCMs (see Table 5); the number of drivers ranged from one to tion process and understanding its influence on SES representation, does
nine, the number of included concepts varied from eight to 18, and the not come without some shortcomings, which we discuss in the following
number of relationships varied between 12 and 48. Importantly, the section in context of our original objectives.
index values of the common aggregation method differ from those of the
individual FCMs (Table 5); the common aggregation method produced a 5.1. Explicitly represent ambiguity in complex SESs with FCMs
FCM without any drivers and with a considerably higher density value,
mainly because of the high number of relationships. Although outside of Grey et al. (2014) discussed multiple options for collecting data to
the scope of this paper, it is worth noting that the dynamic behaviours of build a FCM. In this study, we focussed on consensus building and scope
the aggregated FCMs were, consequently, also very different. setting by framing FCM concepts during a stakeholder workshop. This
Similar to commonly used aggregation methods, the ABA method provided predefined concepts that served as inputs for the subsequent
also influenced the FCM properties (Table 6), with highest the density interviews. The main advantages of using predefined concepts for FCM
values in each agreement rank with all relationships (e.g. for ABA-10, co-production include (1) a collaborative understanding of concepts; (2)
step 1 had the highest density, and for ABA-7, step 1 had the highest achieving a focussed discussion on relationships instead of concepts
density). Importantly, the density values of almost all the steps were during interviews; (3) increased comparability of individual FCMs, and
higher than those obtained from the common aggregation method, (4) minimised time requirements of individual stakeholders, thus
largely due to the low number of concepts and the relatively high limiting stakeholder fatigue.
number of relationships. However, stakeholders (re-)interpreted the identified concepts
The two subsequent calibration steps significantly reduced the differently, resulting in partially conflicting interpretations. As
number of relationships and reintroduced drivers. This indicates that the described by Jetter and Kok (2014), differences in the meaning of con
calibrated ABA-7 included three drivers, 15 concepts, and 45 relation cepts are common, even after a plenary participatory discussion.
ships, corresponding to a density of 0.22. These properties are closer to Limiting conflicting interpretations of concepts could be facilitated
the average and median properties of the individual FCMs than the during the interviews, by briefly explaining the concepts before dis
values obtained using the common aggregated method. The calibration cussing the relationships between them for example, although this
steps were, therefore, crucial for not only providing a stable dynamic brings the focus back on the concepts and limits stakeholders’ freedom
FCM output but also to change the FCM properties. of thought. As every FCM displays an individual narrative of logic be
Based on Tables 5 and 6, the properties of the common FCM aggre tween concepts, we aimed to record this narrative rather than forcing
gation method do not correspond with the properties of the individual one meaning upon them prior to the interview as this might lead to
FCMs. For example, the disappearance of drivers and the high number of stakeholders repeating what we told them rather than voicing their own
concepts and relationships are substantially different from individual opinions. In our view, this ex-ante validation limits stakeholder input.
perceptions. In comparison, after calibration, the ABA-7 properties When research is specifically aimed at comparing relationships in indi
correspond to the average and median FCM properties, and provide a vidual FCMs, an increased consensus view among stakeholders could
more similar aggregated model compared to stakeholder perceptions. increase comparability.
10C.E. de Jong and K. Kok Environmental Modelling and Software 141 (2021) 105054
Table 4 Table 4 (continued )
Overview of the verification step of the ABA-10 FCM. Relationships are repre Relationship Names Combining Verification step FCM
sented as concept → concept. individual value
Relationship Names Combining Verification step FCM FCMs
individual value transboundary areas.
FCMs An example is the
C21 → C4 Quality of Mentioned by It is assumed that a − 0.9 forced migration of
governance → six good quality of pastoral groups in the
Land and stakeholders: governance strongly northern part of
water use 3 strong decreases the amount Kenya resulting in
negative of land and water that more land and water
2 strong is used, and increases use of shared natural
positive sustainable land and resources, such as
1 medium water use. This is water and grassland,
negative because it is expected which is assumed to
that policies will result in the
guide Kenyans to use degradation of these
less land and water or resources mainly due
more sustainable land to overexploitation.
and water use. Moreover,
C6 → C4 Rapid Mentioned by It is assumed that a 0.8 deforestation for
population nine larger population will agricultural practices
growth → stakeholders: use more land and is a common practice
land and 5 strong water, primarily for in Kenya, which also
water use positive food production. As influences the shared
3 medium most Kenyans rely on use of natural
positive agriculture, this was resources, such as
1 neither identified as a strong national parks,
positive nor relationship. Rapid bordering
negative population growth is neighbouring
also presumed to regions. The more
result in more sustainable land and
subdivision of land water use is, the
because family land higher the quality of
will be split among the resource.
the children. These C21 → C19 Quality of Mentioned by It is assumed that 0.3
smaller allocations governance → two government
are, in some cases, Shared stakeholders enforcement and
not enough to provide natural 1 medium legislation will
for the family, resources positive increase the
therefore people will 1 weak management of
look elsewhere for positive protected areas,
more land and/or which can increase
water. the quality of shared
C19 → C4 Shared Mentioned by The quality of shared 0.6 natural resources.
natural five natural resources C6 → C19 Rapid Mentioned by The stakeholder 0.1
resources → stakeholders: influences the population one stated that with more
land and 4 medium amount of land and growth → stakeholder people, more
water use positive water that is or can be Shared 1 medium resources will be
1 strong used. ‘Low’ quality natural positive used, leading to the
positive means less available resources deterioration of
land and water with natural resources.
sufficient quality to C19 → C6 Shared Mentioned by The stakeholder 0.1
be used. Some natural one stated that with a
transboundary resources → stakeholder better state of shared
rivers/lakes dry up or Rapid 1 strong natural resources,
drop their water table population positive more food can be
due to the presumed growth produced and a better
(over)exploitation of state of health will be
neighbouring reached, which
regions. Another causes population
example is the water growth.
quality of Lake
Victoria, which
results in forced While explicitly representing ambiguity, we quantified three types of
changes of land and ambiguity in the studied SESs. The first type concerns the presence of
water use practices. concepts; the second the presence and driving capacity of concepts; and
C4 → C19 Land and Mentioned by The more land and − 0.4
water use → three water is used, the less
the third the presence, direction, influence, and strength of relationships
shared natural stakeholders: the state/quality of between the concepts. Elucidating ambiguity in the first two types has
resources 1 medium shared natural been realised by assessing similarities and differences in individual
negative resources will be. FCMs and demonstrates that multiple knowledge frames have a large
1 medium This is because it is
range of ambiguities. Importantly, there might be additional types of
positive assumed that
1 strong Kenyans expand their ambiguity, and more exploration is needed to quantify other potential
negative agricultural or sources including the importance of concepts and relationships, the
pastoral practices to probability of relationships, the dynamics of the system, and emerging
properties. Nevertheless, our research clearly demonstrates that the
11C.E. de Jong and K. Kok Environmental Modelling and Software 141 (2021) 105054
Fig. 7. Dynamic fuzzy cognitive map (FCM) output with the ABA process up to 70% agreement on 15 concepts and three drivers, at step 3 of the calibration.
Fig. 8. Construction of the ABA-7 FCM. Dark blue arrows indicate positive relationships and light blue indicate negative relationships. Arrow thicknesses indicate
strong, medium, or weak relationships, respectively. Note that this reconstruction does not show single-stakeholder relationships. The darkness of the concept (see
Table 2) relates to the degree of agreement; dark grey, grey, light grey, and white correspond to ABA-10, ABA-9, ABA-9, and ABA-7, respectively.
range of ambiguities in complex SESs is already extensive. Furthermore, analysis. These three steps create a stable FCM with a coinciding range
it is evident that dealing with ambiguity is essential when attempting to of ambiguities. By adding concepts according to their agreement rank, a
understand SESs in a participatory setting owing to its strong influence FCM can be constructed with a transparent and flexible method that
on the represented system. accounts for the degree of common understanding among all
stakeholders.
A central matter in FCM aggregation remains the translation of the
5.2. Ambiguity based aggregation linguistic valuation of relationships (strong/weak) to numerical in
tegers. As presented, the most commonly used method for quantifying
The ABA process involves verification, calibration, and sensitivity
12C.E. de Jong and K. Kok Environmental Modelling and Software 141 (2021) 105054
Table 5 most FCMs derived through PM.
Fuzzy cognitive model (FCM) properties of individual FCMs, averages, median, While the proposed ABA methodology provides a more systemic way
and sum. Abbreviations Nd, Nc, Nr, and D represent the number of drivers, to represent ambiguity, an additional validation step would be advan
concepts, relationships, and density, respectively. tageous. As indicated by earlier research (Kok et al., 2011), the valida
FCM properties Nd Nc Nr D tion of stakeholder perceptions is an iterative process. Here, more
FCM1 3 16 31 0.12 practical reasons (e.g. budget, time, etc.) prevented us from including a
FCM2 6 10 23 0.23 validation step. Therefore, we do not claim that our methodology results
FCM3 2 16 33 0.13 in a ‘correct’ representation of stakeholder perceptions but primarily
FCM4 5 15 33 0.15 serves as an example of a method to explicitly account for ambiguity,
FCM5 4 14 30 0.15
FCM6 1 11 27 0.22
offering an ontological approach for capturing the range of stakeholder
FCM7 9 18 32 0.10 ambiguities in aggregated models.
FCM8 2 8 12 0.19
FCM9 6 15 48 0.21 5.3. Influence of FCM aggregation on SES representation
FCM10 4 15 32 0.14
Average individual FCMs 4 14 30 0.17
Median individual FCMs 4 15 32 0.15 Recognising and addressing ambiguity is essential as the manner by
Common aggregation 0 26 176 0.26 which we address it (or not) can fundamentally change the way we
ABA-10 aggregation 2 4 5 0.31 represent aggregated FCMs. often leads to FCMs that have radically
ABA-9 aggregation 2 8 19 0.30 different properties to any of the individual FCMs used to construct it.
ABA-8 aggregation 2 11 33 0.27
ABA-7 aggregation 3 15 45 0.22
This is demonstrated by the large differences in the FCM indices of the
common aggregation and ABA methods. Although sometimes the whole
can be more than the sum of the parts, this is not desirable in this
instance. In our work, we provided all identified concepts as inputs,
Table 6
thereby aiming for a description of the entire system from each stake
Fuzzy cognitive map (FCM) properties step 1–3 of the ambiguity based aggre
gation (ABA) calibration. Abbreviations Nd, Nc, Nr, and D represent the number
holder. In this case, it is desirable to maintain the properties that indi
of drivers, concepts, relationships, and density, respectively. vidual stakeholders attach to the system in the final product. In more
general terms, we argue that it should always be an aim to maintain
Agreement rank ABA calibration step Nd Nc Nr D
stakeholder views on system functioning to best represent the collective
ABA-10 Step 1 1 4 7 0.44 views of a stakeholder group.
Step 2 2 4 5 0.31
FCM indices are typically used to identify the characteristics of a
Step 3 2 4 5 0.31
ABA-9 Step 1 1 8 28 0.44 FCM. In addition to those used in this study, a range of additional
Step 2 2 8 19 0.30 properties have been suggested including centrality, indegree, out
Step 3 2 8 19 0.30 degree, complexity, hierarchy, number of transmitters, and number of
ABA-8 Step 1 1 11 58 0.50 receivers (Grey et al., 2014; Özesmi and Özesmi, 2004). Here, we pur
Step 2 2 11 33 0.27
Step 3 2 11 33 0.27
posefully avoided using more complicated indices as these are highly
ABA-7 Step 1 0 15 94 0.42 correlated with the counting of concepts and relationships, and illustrate
Step 2 0 15 49 0.22 the ambiguities in other aspects of SES characteristics. Other studies (e.
Step 3 3 15 45 0.22 g. Lavin et al., 2018) have also used indices to determine whether in
dividuals share a paradigm and categorise individual FCMs into groups.
relationships is to calculate an average value. This has the advantages of Although an interesting approach, there is no documented evidence that
being straightforward, reproducible, and does not require value judg FCM properties are indicative of the logic of the underlying system. We
ments from the researchers. It also solves the problem of reproducing argue that FCM properties are useful for comparing FCMs and matrices
conflicting relationships when, for example, one stakeholder indicates a but they cannot be used to make conclusions about stakeholder under
strong negative relationship and another stakeholder indicates a weak standing and reasoning in an SES.
positive relationship. Nevertheless, the resulting aggregated FCMs are
likely to have a majority of ‘medium’ relationships that did not exist in 5.4. Modelling with ambiguity
the original individual FCMs and, furthermore, relationship scores
might cancel each other out (Özesmi, 2006). Therefore, we argue that Our research focussed on identifying how a complex SES can be
averaging should not be used because the advantages do not outweigh modelled with FCMs while explicitly elucidating ambiguity. We used a
the disadvantages. mix of ontological and epistemic strategies by first identifying a range of
We adopted extra verification step, therefore, to quantify the re ambiguities followed by reconstructing one FCM. In line with the
lationships between concepts and drivers, providing the possibility of participatory paradigm (Heron and Reason, 1997), it is assumed that
incorporating logic and reasoning back into the aggregated FCM. We reality is co-created by an objective and subjective set of experiences.
strongly argue that such a verification step enhances FCM aggregation, However, the aggregation stage of the research adopts a more positivist
and this process should not be simplified by mathematical configura paradigm, assuming that a consistent part of perceptions on which
tions if stakeholder perceptions and ambiguity in SESs are to be fully stakeholders agree exist and can be modelled. Modelling multiple per
understood. Although the proposed verification step still contains a ceptions remains a careful balancing act but can provide insights into
subjective modelling choice, this choice is transparent and structured, similar stakeholder paradigms. Nevertheless, a model is merely a tool to
which enhances reproducibility. enable understanding of what is being modelled. Using a
The calibration step yielded a stable FCM output in this study; mixed-paradigmatic approach, as we did, emphasises the diversity of
however, this will not always be the case. For example, when an indi multiple perspectives while providing one model. A deep understanding
vidual FCM contains a large number of relationships (especially feed of SESs, therefore, requires new methods to structure and quantify the
back loops) and is highly complex, the applied calibration method will range of ambiguities from different perspectives.
not suffice. However, in practice, FCMs developed from individual PM The strength of individual PMs might not lie in the model that is
activities do not typically have large density values. Therefore, we created but in the systematic understanding of the paradigms of the
hypothesise that the calibration steps proposed here will be useful for stakeholders involved. If a model shares a paradigm with the user, it may
improve the uptake of the model. In particular, if PM is focussed on
13You can also read