2018 Energy & Carbon Summary - Positioning for a Lower-Carbon Energy Future - ExxonMobil
←
→
Page content transcription
If your browser does not render page correctly, please read the page content below
2018 Energy & Carbon Summary
Positioning for a Lower-Carbon Energy Future

                                               1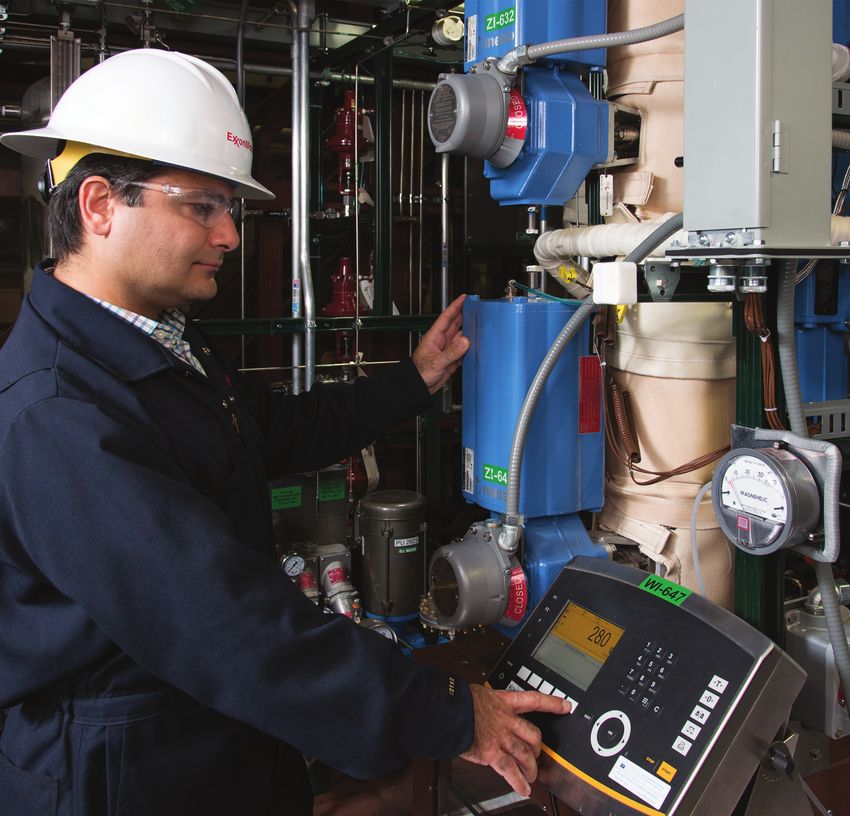
1 Letter from the Chairman
     2 Summary at-a-glance
     3 Highlights from our Outlook for Energy
     6 Considering 2°C scenarios
    10 Potential proved reserves and resources impacts considering 2°C scenarios
    13 Positioning for a lower-carbon energy future
    16 ExxonMobil is part of the solution
    21 Investment planning
    22 Managing risks to meet energy demand
    24 Disclosures
    24 Footnotes

    COVER PHOTO: ExxonMobil has established an
    enhanced management program to reduce
    methane emissions. Further details can be
    found on page 17.

    Statements of future events or conditions in this report, including projections, targets, expectations, estimates, and business plans, are forward-looking statements. Actual
    future results or conditions, including demand growth and energy source mix; the impact of new technologies; production rates and reserve growth; efficiency gains and
    cost savings; emission reductions; and results of investments could differ materially due to, for example, changes in the supply in and demand for crude oil, natural gas, and
    petroleum and petrochemical products and resulting price impacts; the outcome of exploration and development projects; the outcome of research projects and ability
    to scale new technologies on a cost-effective basis; changes in law or government policy, including environmental regulations and international treaties; the actions of
    competitors and customers; changes in the rates of population growth and economic development; unexpected technological developments; general economic conditions,
    including the occurrence and duration of economic recessions; unforeseen technical difficulties; and other factors discussed in this report and in Item 1A of ExxonMobil’s
    most recent Form 10-K. Third-party scenarios discussed in this report reflect the modeling assumptions and outputs of their respective authors, not ExxonMobil. References
    to “resources”, “resource base,” and similar terms include quantities of oil and gas that are not yet classified as proved reserves under SEC definitions but that we believe will
    ultimately be produced. For additional information see the “Frequently Used Terms” on the Investors page of our website at exxonmobil.com.
    References to “oil” and “gas” include crude, natural gas liquids, bitumen, synthetic oil, and natural gas.
    Prior years’ data have been reclassified in certain cases to conform to the 2016 presentation basis.
    The term “project” as used in this publication can refer to a variety of different activities and does not necessarily have the same meaning as in any government payment
    transparency reports.

2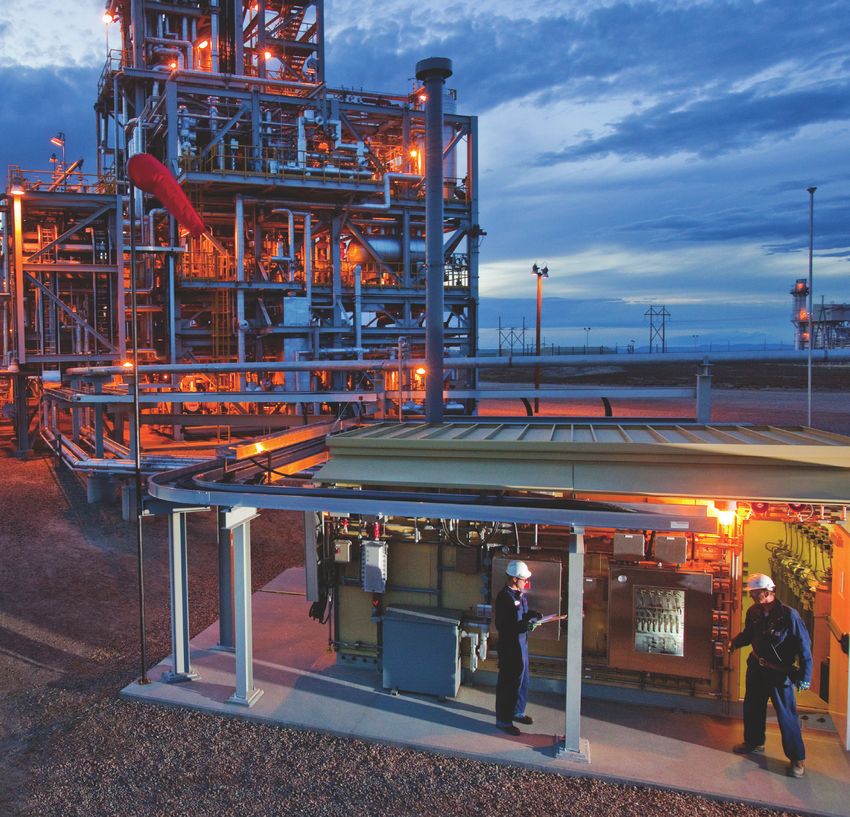
Letter from the Chairman

Providing affordable energy to support prosperity          future. Our partnership with FuelCell Energy, Inc. has
while reducing environmental impacts – including           potential to dramatically lower the cost of carbon capture.
the risks of climate change – is our industry’s            Additionally, we are developing technology to lower the
dual challenge.                                            energy intensity of industrial processes.

                                                           We are at the forefront in developing all these exciting
Ensuring ExxonMobil does our part to address this          technologies, many of which could play big roles in a
challenge is a priority of mine. We are working hard       lower-carbon future. I’m a firm believer in the power of
across our businesses to find effective solutions that     technology to solve hard problems, and to improve and
meet the needs of society.                                 transform lives.

In the near term, we are improving our own operations.     Policy has a place here, too. We’ve been vocal in
Our drive to operate more efficiently also reduces         our support of a carbon tax, and recently joined the
emissions and environmental impacts.                       pro-carbon-tax Climate Leadership Council. We also
                                                           support the Paris Agreement.
Our chemical businesses manufacture products that
improve the sustainability of our customers’ products      ExxonMobil is positioned to remain the energy industry
and reduce associated emissions.                           leader, now and in the future.

We are also helping to lower emissions in today’s power    The report you are reading looks into a lower-carbon
sector by facilitating the switch to cleaner-burning       future. It provides a perspective on what such a future
natural gas.                                               might mean for our business.

For the longer term, more technological solutions are      As one of the world’s premier technology companies,
needed. The global energy system is massive. The world     we are well positioned to succeed in a changing world.
needs solutions that can scale. ExxonMobil has been a      Over the past 135 years, our company has evolved and
leader in researching and developing potential energy      adapted to a variety of environments and conditions.
and environmental game changers. I’m excited about the     We will continue to build long-term value for our
progress we’re making.                                     shareholders and stakeholders. We are committed
                                                           to successfully addressing the dual challenge.
Our algae biofuel program holds great promise. The
world will need liquid transportation fuels for road,
sea, and air. We are conducting fundamental science
in pursuit of needed breakthroughs.

We are also a leader in carbon capture and storage (CCS)   Darren Woods, Chairman and CEO
research. The world will need much more CCS in the

                                                                                                                         1
E X XO N M O B I L 2018 E N E R G Y & C A R B O N S U M M A R Y

    Summary at-a-glance

    Our annual Outlook for Energy incorporates recent                 Relative to our Outlook, a theoretical 2°C pathway          Our businesses are well positioned for the continuing
    developments in economic conditions, policy, and                  would generally lower the world’s demand for total          evolution of the energy system.
    technology.                                                       energy, oil, natural gas and coal, but increase nuclear,
                                                                                                                                  Near-term actions, consistent with society’s energy
                                                                      bioenergy, and non-bio renewables.
    The Outlook anticipates global energy needs will rise                                                                         requirements and environmental objectives, include:
    about 25 percent over the period to 2040, led by                  • Signposts in the energy system will provide important
                                                                                                                                  • Expanding the supply of cleaner-burning natural gas
    non-OECD countries. While the mix shifts toward lower-              indicators on whether society is moving toward a
                                                                                                                                  • Transitioning our manufacturing facilities to higher-
    carbon-intensive fuels, the world will need to pursue all           2°C pathway
                                                                                                                                    value distillates, lubricants, and chemical feedstock
    economic energy sources.                                          • Even under a 2°C pathway, significant investment will
                                                                                                                                  • Mitigating emissions from our own facilities through
    • Worldwide electricity from solar and wind will                    be required in oil and natural gas capacity, as well as
                                                                                                                                    energy efficiency and reduced flaring, venting, and
      increase about 400 percent                                        other energy sources
                                                                                                                                    fugitive emissions
    • Natural gas will expand its role, led by growth for             • Production from our proved reserves and investment
                                                                                                                                  • Developing consumer products that help others
      electricity generation                                            in our resources continue to be needed to meet
                                                                                                                                    reduce their emissions, such as premium lubricants,
                                                                        global requirements
    • Growth in oil demand will be driven by commercial
                                                                                                                                    lightweight plastics, and special tire liners
      transportation and the chemical industry, while
                                                                                                                                  • Engaging on climate policy to address the risks of
      more electric cars and efficiency improvements in
                                                                                                                                    climate change at the lowest cost to society
      conventional cars will likely lead to a peak in liquid
      fuels demand for the light-duty vehicle fleet
                                                                      Our company has a                                           Importantly, on a longer-term horizon, we are pursuing

    • Efficiency gains and growing use of less-carbon-                proven record of successfully                               technologies to enhance existing operations and develop
                                                                                                                                  alternative energies with a lower carbon intensity,
      intensive energy sources will contribute to a nearly
      45 percent decline in the carbon intensity
                                                                      responding to changes in                                    including:

      of global GDP                                                   society’s needs. With                                       • Researching breakthroughs that make CCS technology
                                                                                                                                    more economic for power generation and industrial
    This year’s Outlook also includes sensitivities to provide
    greater perspective on the energy landscape. For                  long-standing investments                                     applications

    example, greater penetration of electric vehicles (EV)
    and/or wind/solar deployment beyond our base Outlook
                                                                      in technology, we are well                                  • Developing process intensification technologies to
                                                                                                                                    reduce energy requirements of manufacturing facilities
    assumptions could slow the growth in oil and natural              positioned to meet the                                      • Progressing advanced biofuels for commercial
    gas demand, respectively.
                                                                      demands of an evolving                                        transportation and petrochemicals

                                                                      energy system.
2
Highlights from our Outlook for Energy

The Outlook for Energy is ExxonMobil’s global view of
energy demand and supply through 2040. Importantly,
                                                                          Energy efficiency improvements will help curb the
                                                                          growth in global energy demand to about 25 percent
                                                                                                                                                    The dual challenge is to
it provides an annual update to reflect recent energy                     over the period to 2040, roughly equivalent to adding                     provide affordable energy
trends and developments, notably in technology and                        another North America and Latin America to the
policy. We use the Outlook to help inform our long-                       world’s current energy demand. Emerging markets in                        to support prosperity
term business strategies and investment plans.                            non-OECD nations will account for essentially all energy
                                                                          demand growth, led by the expanding economies in the
                                                                                                                                                    while reducing
Energy supports rising prosperity
                                                                          Asia Pacific region, such as China and India.
                                                                                                                                                    environmental impacts.
A significant energy transition is under way, and many
                                                                          Providing reliable, affordable energy to support
factors will shape the world’s energy future. By 2040,
                                                                          prosperity and enhance living standards is coupled with                   mix will contribute to a nearly 45 percent decline in the
world population is expected to reach 9.2 billion people,
                                                                          the need to do so in ways that reduce potential impacts                   carbon intensity of global GDP. Progress on energy and
up from 7.4 billion today. Over that same period, global
                                                                          on the environment, including the risks of climate                        climate objectives requires practical approaches that will
GDP will likely double. Billions of people are expected to
                                                                          change. As the world’s economy nearly doubles by                          contribute to both while providing high economic value
join the global middle class.
                                                                          2040, energy efficiency gains and a shift in the energy                   for society.

Global efficiency limits demand growth                                    Oil and gas: Largest global energy sources in the future                  Energy mix shifts globally to lower-carbon fuels

  OECD (1)     China      India    Other Asia Pacific     Rest of world     2016     2040                                                           (percent of primary energy)
(quadrillion BTUs or Quads)        non-OECD                               (quadrillion BTUs or Quads)                                               100
1,200                                                                     250                                                                                                                   Other renewables
                                                                                                                                                                                                Wind/Solar
                          Demand without efficiency gains                          0.7%                         Average annual growth rate: 0.9%     80                                         Nuclear
1,000
                                                                          200

                                                            Energy                          1.3%
 800                                                        savings                                                                                                                             Natural gas
                                                                                                                                                     60
                                                                          150                           –0.1%            Hydro/geothermal 1.4%
 600
                                                                                                                         Wind/solar/biofuels 5.3%
                                                                                                                                                     40
                                                                          100
                                                                                                                                                                                                Oil
 400
                                                                                                                         Biomass 0.2%

                                                                           50                                                                        20
 200

                                                                                                                         Nuclear 2.3%                                                           Coal

   0                                                                        0                                                                         0
        2000           2010         2020           2030          2040              Oil       Gas        Coal    Non-fossil                                         2016                2040

                                                                                                                                                                                                                   3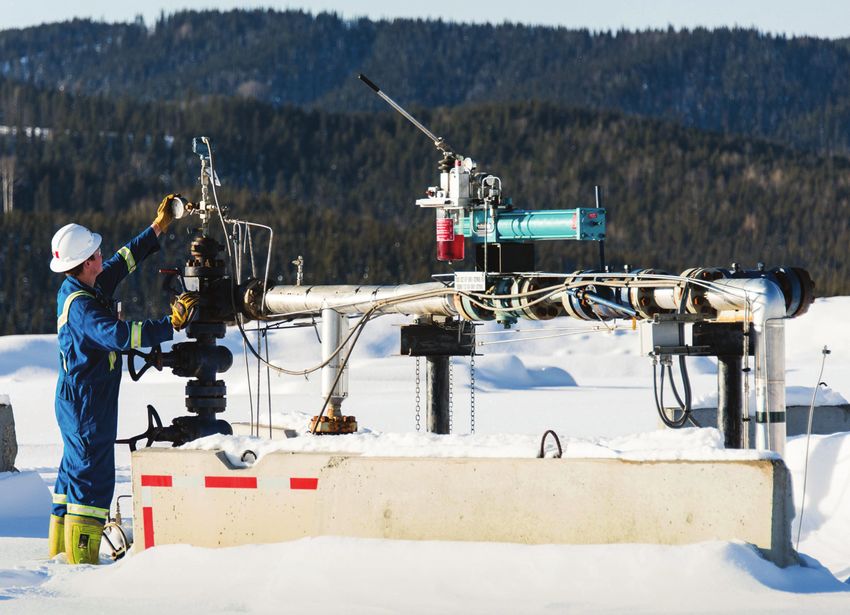
E X XO N M O B I L 2018 E N E R G Y & C A R B O N S U M M A R Y

    Highlights from our Outlook for Energy, continued

    Global energy mix is shifting
                                                                      Highlight: Outlook for Energy projections
    Electrification and gradual decarbonization continue

                                                                      25%
    as significant global trends. Renewables and nuclear
    see strong growth, contributing nearly 40 percent of                                        Global energy needs rise about 25 percent,
    incremental energy supplies to meet demand growth.
    Natural gas grows the most of any energy type, reaching
                                                                                                led by non-OECD nations (e.g., China, India)
                                                                      increase
                                                                                                Despite efficiency gains, global energy demand will likely increase nearly 25 percent
    a quarter of all demand. Oil will continue to play an
                                                                                                by 2040. Nearly all growth will occur in non-OECD countries as prosperity expands.
    important role in the world’s energy mix, as commercial
    transportation (e.g., trucking, aviation, marine) and
    chemicals sectors lead demand growth.
                                                                      Demand for electricity nearly
    Testing uncertainty                                               doubles in non-OECD nations
    Demand for liquid fuels is projected to grow by about             Natural gas use is likely to increase more than any
    20 percent through the Outlook period, even as liquids            other energy source, with about half of its growth
    demand from light-duty transportation peaks and                   attributed to electricity generation. Electricity from     Oil plays a leading role in
    declines during this period with more-efficient vehicles.         solar and wind increases about 400 percent.                mobility and modern products

                                                                                             x2
    Sensitivities help assess potential impacts to light-duty
                                                                                                                                 Oil will continue to play a leading role in the
    liquids demand using alternate assumptions around
                                                                                                                                 world’s energy mix, with growing demand driven
    electric vehicle penetration, changes in fuel efficiency,
                                                                                                                                 by commercial transportation and the chemical
    or broader mobility trends. As an example, for every
                                                                                                                                 industry.
    additional 100 million electric vehicles on the road
    in 2040, liquids demand could fall by approximately
    1.2 million barrels per day.                                      Energy efficiency gathers                                 Predicting the energy future is
    Investment needs
                                                                      momentum worldwide                                        challenging, given uncertainty on
    Significant investments will be needed to meet global             Since 2000, global energy                                 policies and technologies
    demand for oil and natural gas. The International                 intensity has improved
                                                                                                                                                  Meeting the dual challenge of
    Energy Agency, in its New Policies Scenario, estimates            by about 1 percent per year;
                                                                                                                                                  mitigating the risks of climate
    cumulative oil and natural gas investment may reach               from 2016 to 2040,
                                                                                                                                                  change while boosting standards
    approximately $21 trillion between 2017 and 2040.                 this rate will
                                                                                                                                                  of living will require additional
                                                                      approximately double.
                                                                                                                                                  technology advances.

4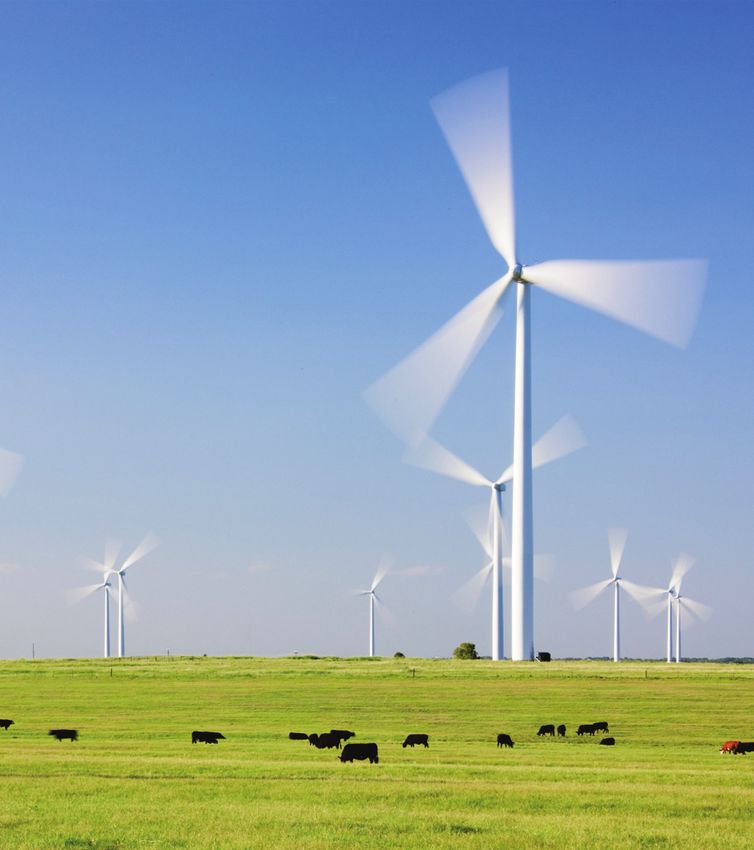
Sensitivities included in our Outlook projections

We use sensitivities to provide greater perspective on how changes to our base Outlook assumptions could affect the energy landscape. The charts below depict potential
impacts to demand related to fuel economy and EV penetration, full EV penetration in light-duty vehicles, and potential changes affecting natural gas demand for electricity
generation. Further discussion on sensitivities can be found in the Outlook for Energy.

Liquids – Light-duty demand sensitivities                                     Liquids – Full EV demand sensitivity                                    Natural gas – Electricity demand sensitivities

(million oil-equivalent barrels per day)                                      (million oil-equivalent barrels per day)                                (billion cubic feet per day)
                                                                                                                                                                                           Up to ~30% replacement
140                            Average new car fuel economy of ~45 mpg        120               Liquids demand sensitivity                            250
                                                                                                                                                                                           of nuclear or ~15%
                                     in 2040 (~50 mpg base assumption)                                                                                                                     replacement of coal
                                                                                                                                    Light-duty                                             with natural gas
120                                                                                                                                 transportation           Demand for
                                                                              100
                                                                                                                                                             natural gas                   Up to ~50% increase in
                                                                                                                                                      200
                                                                                                                                                            for electricity                wind/solar penetration
100                                                                                                                                                          generation
        Total liquids demand                 ~500 million electric vehicles
                                                                               80
                                           (~160 million base assumption)
                                                                                                                                    Commercial
                                                                                                                                                      150
 80                                                                                                                                 transportation
                                                                               60

 60
                                                                                                                                                      100
                               Average new car fuel economy of ~45 mpg         40
                                                                                                                                    Chemicals
 40                                  in 2040 (~50 mpg base assumption)
        Light-duty liquids demand                                                                                                                      50
                                                                                                                                    Other
                                                                               20
 20                                                                                                                                 industrial
                                             ~500 million electric vehicles                                                            Power
                                           (~160 million base assumption)                                                              generation/
  0                                                                             0                                                      residential/     0
      2000            2010            2020            2030            2040          2000        2010        2020         2030   2040 commercial                                 2040

• Shaded ranges are indicative of potential shifts                               • Sensitivity assumes the global light-duty vehicle                     • Accelerated deployment of solar and wind
  in global demand relative to base Outlook                                         fleet is 100-percent electric by 2040, requiring all                    globally due to swifter cost declines and/or
                                                                                    new light-duty vehicle sales to be electric by 2025                     more generous policies could reduce natural
• Liquids demand could fall about 1.2 million
                                                                                                                                                            gas demand relative to base Outlook
  barrels per day for every additional 100 million                               • Battery manufacturing capacity for electric cars
  electric vehicles on the road in 2040                                             would need to increase by more than 50 times                         • Stiffer public sentiment against nuclear or coal
                                                                                    from existing levels by 2025                                            and/or a shift toward more technology-neutral
• Trends in fuel economy gains lower than the
                                                                                                                                                            carbon abatement policies could increase
  Outlook basis could add more than 2 million                                    • Total liquids demand in 2040 could be similar to
                                                                                                                                                            natural gas demand for base load electricity
  barrels per day of liquids demand by 2040                                         levels seen in 2013

                                                                                                                                                                                                                    5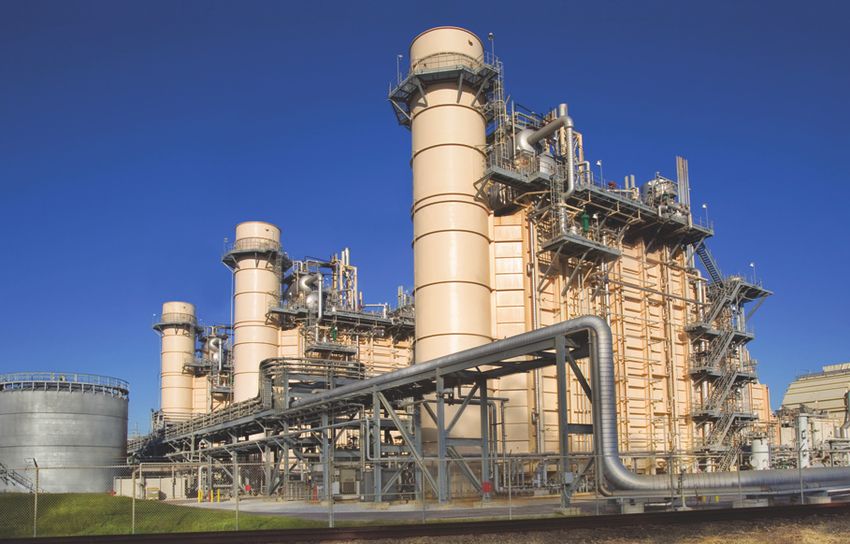
E X XO N M O B I L 2018 E N E R G Y & C A R B O N S U M M A R Y

    Considering 2°C scenarios

    The annual Outlook for Energy represents                          These nationally determined contributions (NDCs)(2)                          When considering the aim to achieve a 2°C future, it
    ExxonMobil’s updated view of the most likely                      provide important signals on government intentions                           should be recognized that due to the complexity and
    future for the global energy system and forms the                 related to the general direction and pace of policy                          scale of the world’s energy system and its interaction
    foundation of the company’s strategic decisions,                  initiatives to address climate risks. It is worth noting                     with societal aspirations, no single pathway to 2°C can
    business plans, and investments. However, many                    that the Paris Agreement indicates that “the estimated                       be reasonably predicted. However, it is generally
    uncertainties exist concerning the future of energy               aggregate greenhouse gas emission levels in 2025 and                         recognized that pathways to 2°C depend on multiple
    demand and supply, including potential actions that               2030 resulting from the intended nationally determined                       variables, the most impactful of which are:
    society may take to address the risks of climate                  contributions do not fall within the least-cost 2°C
                                                                                                                                                   • Population
    change. The following analysis is intended to provide             scenarios.” (3)
                                                                                                                                                   • Economic growth
    a perspective on hypothetical 2°C scenarios.
                                                                      While the current NDCs do not appear to achieve a                            • Energy intensity of the economy
                                                                      2°C scenario, the Paris Agreement is a positive step in                      • Greenhouse gas (GHG) intensity of the energy system
    Since 1992, when nations around the world established             addressing the risks of climate change.
    the United Nations Framework Convention on Climate
    Change, an international effort has been under way to
    understand and address the risks of climate change.                 World energy-related COƥ emissions related to energy intensity                                This chart shows global energy intensity
                                                                        and COƥ emissions intensity                                                                   (left axis) and CO2 emissions intensity
    After more than two decades of international effort,
                                                                                                                                                                      (bottom axis).
    in December 2015, nations convened in Paris and                     (kBTU of energy used per dollar of global GDP)
                                                                                   10                                                         1980                    From 1980 to 2015, there have been large
    drafted an agreement that for the first time signals that                                                                                 18 billion tonnes COƥ
                                                                        Improving                                                                                     gains in efficiency, though energy-related
    both developed and developing nations will strive to                  energy                                                                                      CO2 emissions rose from 18 billion to
                                                                         efficiency
    undertake action on climate change.                                 across the 8
                                                                                            2040 hypothetical 2°C
                                                                                                                                                                      33 billion tonnes. The blue circle shown
                                                                                            performance levels (4)
                                                                         economy                                                              2015                    for 2040 indicates these emissions are
    The ultimate aim of the Paris Agreement is to                                                                                             33 billion tonnes COƥ
                                                                                                                                                                      projected to be about 36 billion tonnes
    “strengthen the global response to the threat of climate                        6                                                   2018 Outlook for Energy
                                                                                                                                                                      even with significant gains in efficiency
    change… by: Holding the increase in global average                                                                                                                and CO2 emissions intensity.
                                                                                                                                              2040
    temperatures to well below 2°C above pre-industrial                                                                                       36 billion tonnes COƥ   To be on a 450 ppm, or hypothetical
                                                                                    4
    levels.” As part of the Paris Agreement, signatories have                                                                                                         2°C pathway, the performance in 2040
    committed to:                                                                                           Level                                                     likely needs to be significantly closer to
                                                                                    2                       exceeded                                                  the purple line, implying faster gains in
    • “prepare, communicate, and maintain successive                                                                                                                  efficiency and/or faster reductions in
      nationally determined contributions that it intends                                                                                                             CO2 emissions per unit of energy. This
                                                                                    0
      to achieve.”                                                                      0      10      20      30      40      50      60                             would increase the chance of reaching
                                                                                             (tonne COƥ per billion BTU of global energy)                             a 2°C pathway, with further gains
    • “communicate nationally determined contributions                                      Reducing COƥ emissions intensity of energy use                            required between 2040 and 2100.
      every five years.”

6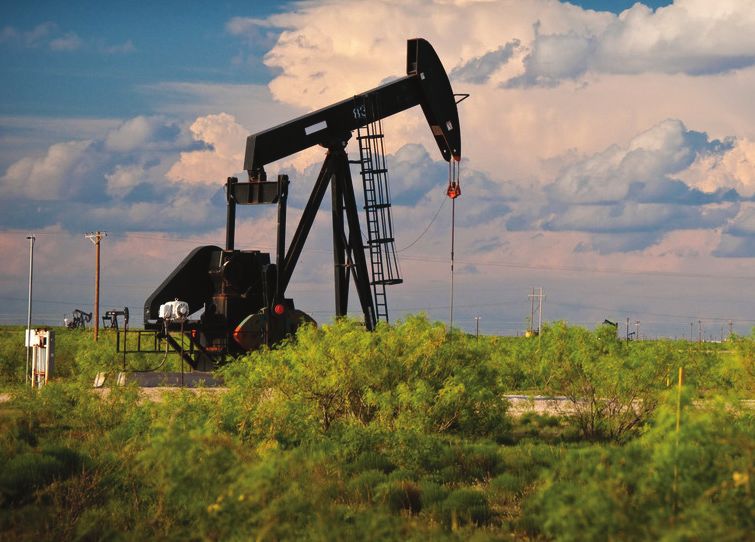
It is generally accepted that population and world                 of a global population that may have doubled, and a            The chart (below left) illustrates potential CO2 emission
economies will continue to grow and that measures                  world economy that may be five times as large.                 trajectories under EMF27 full-technology scenarios (8)
to address the risks of climate change should                                                                                     targeting a 2°C pathway (Assessed 2°C Scenarios)
                                                                   According to the International Energy Agency (IEA),
accommodate these factors. The levers that therefore                                                                              relative to our 2018 Outlook, and baseline pathways
                                                                   setting upon a “well below” 2°C pathway implies
remain for society are: (1) to reduce the energy intensity                                                                        (Assessed Baseline Scenarios) with essentially no policy
                                                                   adoption of “comprehensive, systematic, immediate,
of world economies via further efficiency, and (2) to                                                                             evolution beyond those that existed in 2010.
                                                                   and ubiquitous implementation of strict energy and
reduce the GHG (CO2 equivalent) emissions intensity
                                                                   material efficiency measures.” (5) Because there are           Our 2018 Outlook incorporates significant efficiency
of the world’s energy system.
                                                                   multiple potential options for energy efficiency and           gains and changes in the energy mix, resulting in
The chart on the previous page illustrates 2040                    decarbonization, there are also numerous theoretical           a projected CO2 emissions trajectory that resides
hypothetical “2°C performance levels.” This purple line            paths to a 2°C outcome. Given limited global resources         between the pathways illustrated by the baseline and
reflects hypothetical combinations of global energy                and the wide range of global societal priorities,(6) such as   2°C scenarios. The emissions trajectory of our Outlook
intensity and CO2 emission intensity levels that, if               poverty, education, health, security, affordable energy,       closely approximates in shape the intermediate RCP 4.5
reached in 2040, would likely indicate the world was on a          and climate change, approaches to address these issues         fossil fuel CO2 emissions profile of the IPCC through
2°C pathway. Transitioning towards a 2°C performance               will need to be as economically efficient as possible.         2040, but is slightly under it in magnitude. Although
level would imply that global emissions have peaked and            Inefficient approaches to address the risks of climate         our Outlook does not extend to 2100 and we do
are steadily declining to near 1980 levels by 2040, in spite       change can divert resources and detract from society’s         not estimate global temperatures under our Outlook
                                                                   ability to address other important priorities. Due to the      process, the IPCC projects its intermediate RCP 4.5
                                                                   unprecedented change that would be needed in the               emissions profile would result in an average global
Global energy-related COƥ emissions (9)                            global energy system to achieve a 2°C outcome, we              temperature increase of approximately 2.4°C by 2100
(billion tonnes)                                                   believe that only those scenarios that employ the full         from the pre-industrial age.(10)
                                                                   complement of technology options are likely to provide
125                                                                                                                               The Assessed 2°C Scenarios, as shown on the following
                                                                   the most economically efficient paths.
                                                                                                                                  page, produce a variety of views on the potential impacts
100
                                                   Assessed
                                                                   Considerable work has been done in the scientific              on global energy demand in total and by specific types
                                                   Baseline        community to explore energy transformation pathways.           of energy.
 75                                                Scenarios
                                                                   A recent multi-model study coordinated by the Energy
                                                                                                                                  The scenarios also show a range of possible growth rates
 50
                                                                   Modeling Forum 27 (EMF27)(7) at Stanford University
                                                                                                                                  for each type of energy. We have taken the average of the
                      2018 Outlook for Energy                      brought together many energy-economic models to
                                                                                                                                  Assessed 2°C Scenarios’ growth rates in order to consider
 25                                                                assess technology and policy pathways associated with
                                                                                                                                  potential impacts on energy demand for this report.(11)
                                                                   various climate stabilization targets (e.g., 450, 550 ppm
  0                                                                CO2 equivalent or CO2e), partially in support of the Fifth
                                                   Assessed
                                                   2°C Scenarios   Assessment Report of the Intergovernmental Panel
–25
      2005   2020   2040   2060     2080        2100               on Climate Change (IPCC).
                                                                                                                                                                                              7
E X XO N M O B I L 2018 E N E R G Y & C A R B O N S U M M A R Y

    Considering 2°C scenarios, continued

    Based on this scenario analysis, primary energy demand on
    a worldwide basis is projected to increase about 0.5 percent
                                                                               • The projected growth rates for renewable energies and
                                                                                  nuclear are generally quite strong averaging between
                                                                                                                                                  Oil and natural gas remain
    per year on average from 2010 to 2040. Expected changes                       4 and 4.5 percent per year for non-bioenergy (e.g., hydro,      important sources, even in
    in demand vary by model and energy type (lower charts):                       wind, solar) and bioenergy, and about 3 percent per year
                                                                                  for nuclear                                                     models with the lowest level
    • Oil demand is projected on average to decline by
      about 0.4 percent per year                                               All energy sources remain important across all the                 of energy demand.
                                                                               Assessed 2°C Scenarios, though the mix of energy
    • Natural gas demand is expected on average
                                                                               and technology shifts over time. Oil and natural
      to increase about 0.9 percent per year
                                                                               gas remain important sources, even in models with                  Low-side energy growth rates for the Assessed 2°C
    • The outlook for coal is the most negative, with                          the lowest level of energy demand. Oil demand is                   Scenarios were also considered. The low-side for each
      diverse projections showing an average decline of                        projected to decline modestly on average, and much                 energy source sees oil dropping 1.7 percent per year,
      about 2.4 percent per year, or about a 50 percent                        more slowly than its natural rate of decline from                  natural gas dropping 0.8 percent per year, and coal
      decline by 2040                                                          existing producing fields. Natural gas demand grows                dropping 10.2 percent per year through 2040. This is
                                                                               on average due to its many advantages, including                   compared with high-side growth rates for bioenergy,
                                                                               lower greenhouse gas emissions.                                    nuclear, and non-bio renewables of 14.1, 4.8, and
                                                                                                                                                  6.3 percent per year, respectively.

    2040 global demand by energy type by model in the Assessed 2°C Scenarios                                                                      Ranges of predicted changes in global demand
                                                                                                                                                  in Assessed 2°C Scenarios
      Oil               Oil   Gas            Gas       Coal           Coal   Nuclear        Bioenergy    Bioenergy     Non-bio renewables
      with CCS                with CCS                 with CCS                             with CCS
                                                                                                                                                    13 models       Average

              AIM                                                                                                                                 (average annual growth rate in percent, 2010–2040)

              BET                                                                                                                                  15

    ENV-Linkages
           GCAM                                                                                                                                    10

         IMACLIM
                                                                                                                                                    5
           IMAGE
          MERGE
                                                                                                                                                    0
       MESSAGE
          Phoenix
                                                                                                                                                   –5
         REMIND
           WITCH
                                                                                                                                                  –10
           POLES
             TIAM
                                                                                                                                                  –15
                    0              100              200               300        400               500           600           700          800         Primary   Oil     Natural   Coal     Non-bio   Bio-    Nuclear
                                                                              (exajoules)                                                               energy             gas             renewables energy

8
Signposts for the evolving energy landscape
Up close: Indicators for a 2°C pathway
Changes in the relative cost of new technology when
compared against existing or alternative energy sources The continued evolution of the energy system will provide important indicators on whether society is moving
may indicate shifts in the global energy mix. Utilizing toward a 2°C scenario. The following would demonstrate progress toward that objective by 2040 compared to 2010:
Company and external sources, we monitor a variety of Renewables, nuclear, and fossil fuels with CCS rise Low-carbon power generation (including CCS)
from 10% to 40% of primary energy demand (12) grows from 33% to 80% of total supply (15)
indicators that may serve as signposts for potential shifts in
the energy landscape, such as:
1/3 4/5
• New NDCs and significant policy initiatives, such as
2010 1 out of 10
carbon pricing
• Increased electrification of energy system
• Increasing penetration of renewables with technology 2040 4 out of 10
developments that reduce costs and increase reliability
2010 2040
of energy storage Total electrification Oil demand falls (14)
of energy demand (13)
Global electricity generation shifts (16)
• Development of scalable alternative energies such as
biofuels that don’t compete with fresh water or food,
10%
Non-bioenergy CCS
leading to displacement of gasoline and distillate in the ~20% ~30% renewables
increases from
utilization
increases
fuels market less than 20% to ~20%
to ~35%
• Advances in CCS technology to lower cost
2010 to 2040 Bioenergy Nuclear
• Announcements for planned capacity expansion of increases increases
Down 20% to 5% from ~15%
multiple technologies, as well as the associated financing 2010 2040 2016 to 2040 to ~20%
that support these expansions
Summary of demand growth rates Average of the
Assessed ExxonMobil 2018 2010-2016
• Energy efficiency gains exceeding historical trends Mean annual demand growth rate 2010-2040 2°C Scenarios (17) Outlook for Energy Actual
Energy demand ▲ 0.5% ▲ 0.9% ▲ 1.2%
• Consumer acceptance and preferences
Oil ▼ (0.4)% ▲ 0.8% ▲ 1.3%
Natural gas ▲ 0.9% ▲ 1.4% ▲ 1.6%
Further details and discussion of Assessed 2°C Scenarios Coal ▼ (2.4)% 0.0% ▲ 0.1%
can be found in the special section of the Outlook for Nuclear ▲ 3.0% ▲ 1.6% ▼ (1.0)%
Energy – “Pursuing a 2°C pathway.”
Bioenergy ▲ 4.3% ▲ 0.7% ▲ 1.9%
Non-bio renewables ▲ 4.5% ▲ 3.7% ▲ 5.8%
9E X XO N M O B I L 2018 E N E R G Y & C A R B O N S U M M A R Y
Potential proved reserves and resources impacts considering 2°C scenarios
Over the coming decades, oil and natural gas will
continue to play a critical role in meeting the world’s Up close: Significant investment still needed in 2°C scenarios
energy demand, even considering the Assessed 2°C Considering the 2°C Scenarios Average, global oil demand would be projected to decline from 95 million barrels
Scenarios discussed in the previous section. The per day in 2016 to about 78 million barrels per day in 2040. Using the lowest oil demand growth rate among the
Assessed 2°C Scenarios, oil demand would still be 53 million barrels per day in 2040, as seen in the chart below.(22)
following analysis is intended to address the potential
However, absent future investment, world oil production to meet demand would be expected to decrease from
impacts to the company’s proved reserves (18) and
95 million barrels per day in 2016 to about 17 million barrels per day in 2040. This decrease would result from
resources (19) through 2040 and beyond, considering natural field decline as oil is produced. This natural field decline rate is forecasted to greatly exceed the decline rate
the average of the Assessed 2°C Scenarios’ oil and in global oil demand even under the 2°C Scenarios Average.
natural gas growth rates (2°C Scenarios Average).(20) With the potential 2040 imbalance (absent future investment) the more than 90 percent of our proved reserves that
are projected to be produced by 2040 are clearly supported by ample demand, and therefore face little risk related
Proved Reserves and Producing Assets to the 2°C Scenarios Average.
At the end of 2016, ExxonMobil’s proved reserves Natural gas reserves face even less risk, as demand in 2040 is expected to increase under the 2°C Scenarios
totaled about 20 billion oil-equivalent barrels, of which Average, versus 2016 demand levels.
approximately 53 percent were oil and 47 percent were Considering the IEA’s Sustainable Development Scenario (a 2°C scenario), the IEA estimates that almost $14 trillion
natural gas. These proved reserves, which represent a of investment will be needed for oil and natural gas supply between 2017 and 2040.(23)
diverse portfolio, are assessed annually and reported in
our annual report on Form 10-K. A recent study concluded Global liquids supply estimates Global natural gas supply estimates
that the main driver of intrinsic value of an integrated oil
(million oil-equivalent barrels per day) (billion cubic feet per day)
company’s upstream operations is its proved reserves.(21)
120 700
Based on currently anticipated production schedules,
Existing Highest
we estimate that by 2040, over 90 percent of our Highest 600 demand based
100 supplies demand based
year-end 2016 proved reserves will have been produced. on Assessed
95 on Assessed 2°C Scenarios
2°C Scenarios 500
Considering that the 2°C Scenarios Average implies
80 Demand
significant use of oil and natural gas through the middle 78 Demand
based on Existing 445
400 based on
Estimate 2°C Scenarios supplies 2°C Scenarios
of the century, we believe these reserves face little risk. of natural Average
60 370 Average
decline
in absence Lowest 300
For the less than 10 percent of our year-end 2016 proved of further demand based Lowest
40 investment on Assessed demand based
reserves that are projected to be produced beyond 2°C Scenarios 200 on Assessed
2040, the reserves are generally associated with assets 2°C Scenarios
20
where the majority of development costs have been 100
incurred before 2040. While these proved reserves
0 0
may be subject to more stringent climate policies in 2016 2040 2016 2040
the future, we believe that investments could mitigate Excludes biofuels
10Considering the 2°C Resources
At the end of 2016, ExxonMobil’s non-proved resources
2°C Scenarios Average, ExxonMobil still would need to
replenish approximately 35 billion oil-equivalent barrels of
Scenarios Average, we believe totaled about 71 billion oil-equivalent barrels. The size proved reserves by 2040, assuming the company retains
and diversity of ExxonMobil’s undeveloped resource its current share of global production over that time
our reserves face little risk. base provide us with considerable flexibility to profitably period.(24)
develop new supplies to meet future energy demand
Considering the multiple factors that will influence
and replenish our proved reserves. We also continue
decisions to commercialize undeveloped resources,
production-related emissions and associated costs. In to increase the quality of our resources through
it is not possible to identify which specific assets ultimately
addition, these assets have generally lower risk given the successful exploration drilling, acquisitions, and ongoing
will be commercialized and produced. As we consider
subsurface and operational knowledge that accumulates development planning and appraisal activities.
the implied oil and natural gas demand to 2040 under the
over many decades of production. Accordingly, we
The underlying economics of commercializing and 2°C Scenarios Average, it is possible that some higher-
believe the production of these reserves will likely remain
producing resources are dependent on a number of cost assets, which could be impacted by many factors
economic even under the 2°C Scenarios Average.
factors that are assessed using a dynamic resource including future climate policy, may not be developed.
For producing assets that do not currently meet the SEC’s development process, as highlighted further in the box We are confident however, that the size, diversity, and
definition of proved reserves, we expect to continue on the following page. We seek to advance the best continued upgrading of our undeveloped resources,
producing these assets through the end of their economic resource opportunities and monetize or exit lower along with technology developments, will enable the
lives. We continue to enhance the long-term viability of potential assets. As indicated, the world will continue ongoing replenishment of our proved reserves under
these assets through increased efficiency, cost reductions, to require significant investment in hydrocarbons, even a range of potential future demand scenarios for
and the deployment of new technologies and processes. considering the Assessed 2°C Scenarios. Under the decades to come.
Up close: Reducing costs using technology to compete
Trillions of dollars of investment in oil and natural gas will be needed, even considering a 2°C scenario.
By leveraging high-impact technologies from our world-class research organization, we can reduce costs
and environmental impacts. This positions our Upstream portfolio to successfully compete.
Recent examples showcasing our technical strength:
• Record-setting extended-reach wells in Sakhalin to significantly reduce drilling costs and
environmental footprint
• Full-physics modeling and next-generation completion designs for unconventional developments
to reduce drilling and improve recovery
• Advanced technologies to enhance our oil sands portfolio, such as use of specialty solvents
to reduce the energy intensity of the development
11E X XO N M O B I L 2018 E N E R G Y & C A R B O N S U M M A R Y
Potential reser ves and resources impacts considering 2°C scenarios, continued
We test our investments over a wide range of
commodity price assumptions and market conditions. Up close: Dynamic resource development planning
As we consider a third-party’s estimate of future prices This process considers a wide range of variables over time, including as appropriate: the extent and density of
under its 2°C pathway, we note that these fall within the the resource, development concepts, fiscal terms, regulatory requirements, proximity to existing infrastructure,
market conditions, enabling technologies, and policy developments, including climate policy.
range we use to test our investments.(25) Additionally,
over our long history we have successfully competed We optimize our resource development plans in line with these variables and prioritize developments that are
in periods where supply exceeds demand. In such a competitively advantaged in delivering long-term shareholder value. Decisions can range from developing the
business environment, the lowest cost of supply will resource (which eventually moves to proved reserves), monetizing the resource by selling to others, or exiting
the acreage.
be advantaged. ExxonMobil’s long-standing focus on
efficiency and continuous improvement will help ensure With a very large resource base, this process can take decades as technologies are discovered, market conditions
we compete successfully. change, and competition evolves. Two recent examples illustrate this:
Hebron • The Hebron project in Eastern Canada was commissioned and produced its first oil in December
Lastly, a portion of our resources represent unconventional
2017. However, the field was originally discovered in 1980.
liquids assets in the United States. These assets have
East Natuna • In contrast, we relinquished East Natuna in Indonesia, which was originally awarded in 1980.
shorter development cycles than other capital-intensive
In this case, the global growth of more competitive sources of supply offsets advances in technology, resulting
resources, which we believe make this class of assets
in less attractive returns.
resilient under the 2°C Scenarios Average. Natural
gas assets form another portion of our resources.
The 2°C Scenarios Average anticipates abundant
demand growth of this cleaner-burning fuel in the future, Dynamic resource development planning
making these assets resilient under the 2°C Scenarios Monetize
Average. Our remaining undeveloped liquids resources, Value maximization
in some cases, may not be attractive investments
considering the 2°C Scenarios Average, assuming no Resource Development planning Development decision Develop
advances in technology, processes, or designs. However,
the carrying value of these undeveloped liquids resources
is less than 5 percent of ExxonMobil’s total carrying Reoptimize Exit acreage
value of property, plant and equipment as of
September 30, 2017.(26)
Resource definition Fiscal terms Environmental impact analysis Market development
Development concept and cost Regulatory requirements Infrastructure availability Enabling technology
12Positioning for a lower-carbon energy future
The global energy system has continued to evolve
throughout ExxonMobil’s history due to growing
Taking near-term action
As demonstrated by the Paris Agreement, governments
ExxonMobil has considerable
demand and developments in technology and policy. have signaled an aspiration to move towards a lower- flexibility and optionality
While the future is difficult to predict, we are well carbon energy system. We have already observed the
positioned to respond to a range of future outcomes, beginnings of a shift, and are taking action to position for a wide range of future
which will be driven largely by society’s needs. ourselves to help meet future global energy needs.
For example, we are:
energy scenarios.
Our annual Outlook for Energy process is a vital Expanding supply of cleaner-burning natural gas •
tool for understanding energy markets. It provides This will enable greater substitution of coal with
Transitioning our manufacturing facilities • We are
valuable insights on energy supply and demand trends, natural gas in power generation. Natural gas can be
retooling our refining capacity to shift from fuel oils and
advancements in technology, and developments in up to 60-percent less carbon intensive than coal for
light-duty vehicle gasoline to higher-value distillates
policy. It also provides a forum to monitor lower-carbon power generation and is a significant component of
(e.g., diesel, jet fuel), lubricants, and chemical feedstock.
signposts that could signal shifts in efficiency and ExxonMobil’s portfolio and investment activities.
This reflects projected trends in consumer products
decarbonization trends toward 2°C pathways.
and policy, such as growing EV penetration, increasing
With the ongoing changes in the energy system, requirements for heavy-duty transportation fuels, higher
ExxonMobil has continuously evolved its portfolio, ExxonMobil cogeneration performance lubricants, and increasing demand for
chemical products that provide sustainability benefits.
capabilities, and flexibility to respond. This flexibility is
capacity is enough to power
2.5 million
due in large part to our:
Mitigating emissions from our own facilities/
• Portfolio diversity, including integrated upstream, operations • Our prime focus is on energy efficiency
downstream and chemicals businesses and reducing flaring, venting, and fugitive emissions.
• Long-standing research and development program homes in the United States ExxonMobil also extensively employs cogeneration in
assessing a wide spectrum of energy alternatives its operations to increase energy efficiency and reduce
• Disciplined operating and investment capabilities net emissions while reducing the need to import power.
• Financial strength and access to capital Currently, our global gross capacity for cogeneration
is 5.3 gigawatts, enough to meet the annual electricity
As we look to the future, we remain confident that these
needs of 2.5 million U.S. homes.
proven capabilities will enable our businesses to adjust
to society’s needs, including those that may result from
evolving technology and policy.
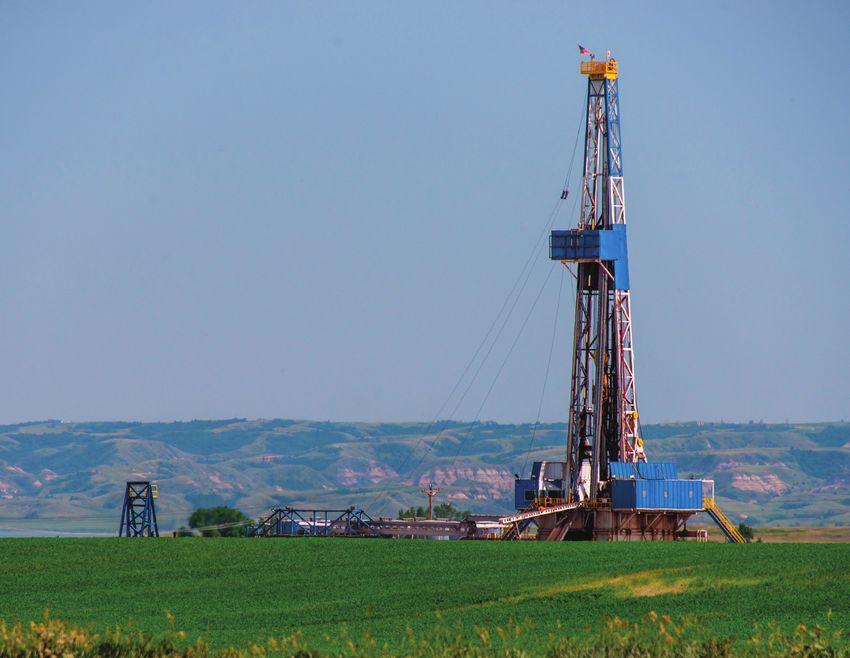
Our cogeneration plant at our Beaumont, Texas,
refinery can produce about 500 megawatts of
electricity, which not only powers refining operations,
but also supplements the local power grid.
13E X XO N M O B I L 2018 E N E R G Y & C A R B O N S U M M A R Y
Positioning for a lower-carbon energy future, continued
Developing consumer products that help others
reduce their emissions • ExxonMobil has one of the
largest chemical companies in the world. Leveraging
proprietary technologies, we produce an array of
materials that bring both energy efficiency and
sustainability benefits to consumers.
Engaging on climate policy • We continue to
encourage policy that addresses the risks of climate
change at the lowest cost to society.
We are actively engaged in evaluating potential
renewable alternatives, including solar, bioenergy, and
wind. Our focus is on contributing in areas where we
can help make a difference in line with our technical
capabilities. Our research and development program
includes opportunities that could make renewable
technologies more competitive. We also support the
deployment of renewables as a supplier of synthetic
lubricants to wind turbines around the world. The
natural gas that we produce can also serve as an energy
backstop to address intermittency issues associated
with these energy sources. We continue to actively
monitor developments in this area through our research
activities and our annual Outlook process, advancing
opportunities that appear to hold promise.
Preparing for the long term
We believe society will continue moving towards a
lower-carbon energy system, and we are committed
to longer-term solutions through our ongoing research
and development program. We have collaborations with
more than 80 academic institutions around the globe to
The Shute Creek Gas Plant in Wyoming. CCS will be an important long-term technology to reduce emissions.
progress an array of technologies that have the potential
14Our research and development reduce energy requirements of manufacturing facilities
80+ academic
by fundamentally changing processes that require
program includes opportunities significant heat and pressure.
institutions
that could make renewable Commercial transportation • Large-scale commercial collaborate with ExxonMobil
transportation requirements by road, sea, and air will on research
technologies more competitive. continue to require fuels with high energy density.
Advanced biofuels offer potential to meet these energy
requirements while reducing emissions and minimizing In many regards, a lower-carbon scenario may just
to be scalable, reliable, and commercially viable. We are the impact on land, fresh water, and food supplies. Our accelerate the trend of the past two decades.
focused on fundamental research to discover or enhance research programs are focused on algae and conversion ExxonMobil’s Downstream business is well positioned
energy solutions for the future. of agricultural waste to liquid fuels. These technologies to compete in this environment as one of the lowest-
could provide renewable, lower-emission fuels that cost producers, as illustrated in the chart below.
Power generation • One of the attributes of a lower-
utilize existing refining processes and infrastructure.
carbon future is the increased electrification of society. With our diverse portfolio and demonstrated
We have several areas of research that support capabilities, ExxonMobil can be successful in a
this trend, including greater utilization of CCS and Preparing for the potential of shifting demand wide range of future energy scenarios.
developments in energy storage technology. ExxonMobil We also recognize that society’s choices on lower-
is a leader in existing CCS, participating in more than carbon energies may impact demand for some products
ExxonMobil Downstream’s competitive advantage
one-fifth of the world’s CCS capacity. we produce. For those sectors of our business that might
Refinery unit cash operating expenses (27)(28)(29)
see a decrease in demand, rationalization of industry
Industrial/Petrochemicals • As economic development (indexed)
capacity could occur. Capacity rationalization has been a
progresses, energy demand for industry and the need 150
key dimension of our industry for decades. For example,
for petrochemicals will continue to grow. Here again,
over the past twenty years, the global refining sector has Industry average (30)
we expect CCS will be an important technology to
been overbuilt, leading to industry rationalization. During 140
reduce emissions. Biofuels, as an alternative source of
this period, our Downstream business has strengthened
energy or as feedstock, is another significant opportunity
its competitive position by divesting smaller, less- 130
being investigated. We are also researching ways to
competitive facilities and redeploying resources and
ExxonMobil (31)
capital to our larger, more efficient sites that are
120
integrated with chemical and lubricant manufacturing.
~22%
of the world’s CCS This constant highgrading of our portfolio has positioned
110
capacity involves ExxonMobil’s Downstream to be one of the most cost-
ExxonMobil competitive in industry, and positioned to address a wide
100
variety of future scenarios. 2006 2008 2010 2012 2014 2016
15E X XO N M O B I L 2018 E N E R G Y & C A R B O N S U M M A R Y
ExxonMobil is Mitigating emissions in our operations
part of the solution
We are committed to providing affordable As we seek to produce oil and natural gas to meet In the near term, we are working to increase energy
energy to support human progress while growing global energy demand, we are committed efficiency while reducing flaring, venting, and fugitive
advancing effective solutions to address the risks to mitigating greenhouse gas emissions within emissions in our operations. We are also deploying
of climate change. That’s why we are working to our operations. proven technologies such as cogeneration and CCS,
be part of the solution. Our climate change risk where technically and economically feasible. Longer
management strategy consists of four pillars: term, we are conducting and supporting research to
ExxonMobil has a robust set of processes to improve
develop breakthrough technologies.
efficiency and mitigate emissions. These processes
• Mitigating emissions in our operations
include, where appropriate, setting tailored objectives
ExxonMobil remains a leader in CCS technology. Our
• Developing scalable technology solutions at the business, site, and equipment levels, and then
capacity is among the industry’s largest, with a working
• Providing solutions for our customers stewarding progress toward meeting those objectives.
interest in more than one-fifth of the world’s CCS
We believe this rigorous bottom-up approach is
• Engaging on climate change policy capacity. In 2016, we captured 6.3 million tonnes of CO2
the most-effective approach to drive efficiency
for storage, equivalent to switching electricity generated
improvements and reduce greenhouse gas emissions.
for about 500,000 U.S. homes to solar from coal.
Continuing to use this approach will yield further
improvements in all sectors of our business.
Up close: Investments in lower-emission
energy solutions
Greenhouse gas emissions avoided
Since 2000, ExxonMobil has spent more than
(net equity, COƥ-equivalent emissions, $8 billion to develop and deploy higher-efficiency
cumulative since 2011, millions of metric tons) and lower-emission energy solutions across our
Mitigating emissions Developing scalable 0 operations, many of which generate an economic
in our operations technology solutions Energy efficiency return. These include:
and cogeneration
10
• $4 billion at our Upstream facilities on emission
Flare/vent reduction
reduction efforts, including energy efficiency and
20
flare mitigation
30 • $2 billion at our refining and chemical facilities
COƥ captured that reduce greenhouse gas emissions
Providing solutions Engaging on 40 for storage
for our customers climate change policy • $2 billion in support of Upstream and
50
Downstream cogeneration facilities to more
efficiently produce electricity and reduce
60 greenhouse gas emissions
2011 2012 2013 2014 2015 2016
16Up close: Taking actions to reduce methane emissions
ExxonMobil and its subsidiary XTO have established Planned events such
a methane management program that exceeds as liquid unloading
applicable regulations. The program prioritizes actions will be managed to
at the highest-volume production and midstream sites reduce the release of
and includes efforts to develop and deploy new, more- methane emissions to
efficient technologies to detect and reduce facility the atmosphere. Liquid
emissions. Most aspects of the program are voluntary. unloading removes liquid
that has collected in
Reporting • Our efforts are discussed in ExxonMobil’s
equipment tubing and
annual Corporate Citizenship Report, as well as other
prevents natural gas
materials available on our website, where the company
from flowing up through
reports 10 years of performance data on overall
the well. As part of our
ExxonMobil methane emissions. In the United States
program, field personnel
in 2016, XTO reported 205,000 tonnes (5.1 million
monitor and remain in close
tonnes CO2e) of methane emissions. Specifically for
proximity during the manual
upstream operations, XTO-operated production
unloading process to close
emissions equate to about 410 methane tonnes
all wellhead vents to the atmosphere. participated in studies conducted by the University of
per million barrels of oil-equivalent production, an
Texas and the Environmental Defense Fund. This study
emissions rate of 0.36 percent. XTO accounts for more Training • ExxonMobil is currently developing an
quantified methane leakage rates in the United States
than two-thirds of ExxonMobil’s methane emissions. enhanced training program to complement these
from upstream gas production activities at 0.4 percent
efforts.
High-bleed pneumatic phase-out • Over the next of the total gas produced.
three years, we are voluntarily switching out more Improved facility designs • We continue evaluating
ExxonMobil remains active in ongoing methane
than 1,000 high-bleed pneumatic devices for lower- opportunities to upgrade facilities to reduce emissions.
research, including participation in a methane
or no-bleed devices that can significantly reduce This includes research in collaboration with equipment
measurement reconciliation study with the
emissions. manufacturers to develop state-of-the-art, low-cost,
Department of Energy’s National Renewable Energy
minimum-emissions equipment.
Leak detection and repair • We have implemented Laboratory, and in supporting research currently
an enhanced leak detection and repair program Research • As part of the company’s efforts to better under way at Harvard University, the University
that prioritizes our largest-volume sites and greatest understand the magnitude and characteristics of oil and of Texas at Austin Energy Institute, and Stanford
NEED XTO
opportunities for emission reductions. gas industry-related methane emissions, ExxonMobil
IMAGE
University’s Natural Gas Initiative.
17E X XO N M O B I L 2018 E N E R G Y & C A R B O N S U M M A R Y
Developing scalable technology solutions
As society pursues policies to lower greenhouse Recognizing the challenges associated with most potential to be economically feasible and scalable.
gas emissions, technological advancements will be existing low-GHG emissions energy technologies, ExxonMobil is pioneering scientific research to
instrumental in providing the global economy with particularly in delivering the necessary economy, scale, discover innovative approaches to enhance existing
the energy it needs. and reliability, we are conducting fundamental research – and develop next-generation – energy sources.
aimed at developing energy solutions that have the
Up close: Advanced biofuels and CCS
Advanced, or second-generation, Our broad portfolio of advanced We are conducting proprietary, Carbonate fuel cell technology could
biofuels offer the possibility of achieving biofuels research also includes biofuels fundamental research to develop make CCS more affordable, easier
significant GHG reductions while also derived from cellulosic biomass, which breakthrough CCS technologies, with to operate, and scalable for power
minimizing the impact on land, fresh do not compete with food and fresh an aim to reduce the complexity and plants which, according to the U.S.
water, and food supplies compared with water. cost of this important technology, while Environmental Protection Agency, are the
first-generation biofuels. increasing its efficiency. single largest source of GHG emissions.
ExxonMobil and Renewable Energy
ExxonMobil and Synthetic Genomics Group (REG) recently announced that We are working with research institutes In 2016, FuelCell Energy, Inc. and
recently announced a breakthrough in by utilizing REG’s patented fermentation like the Energy Research Centre of the ExxonMobil signed a joint agreement
joint research into advanced biofuels technology, the companies’ joint Netherlands and leading universities that will allow scientists from both
involving the modification of an algae research program has demonstrated like University of California, Berkeley companies to work collaboratively and
strain that doubled its oil content the ability to convert sugars from a to develop materials and process further develop this emissions-saving
without significantly inhibiting the variety of non-edible biomass sources configurations for scalable, affordable technology. We are progressing this
strain’s growth. into biodiesel. carbon capture solutions. technology from the lab to a pilot plant.
18You can also read