ENVIRONMENTAL REPORT 2020 - Updated environmental report for the Linz, Steyrling and Traisen locations - voestalpine
←
→
Page content transcription
If your browser does not render page correctly, please read the page content below
ENVIRONMENTAL REPORT
2020
Updated environmental report
for the Linz, Steyrling and Traisen locations

www.voestalpine.com
The content of the updated Environmental Statement 2020 complies with the requirements of EMAS III Regulation
No. 1221/2009 as amended in 2018/2026 and refer to the validated locations in Linz, Steyrling and Traisen and the
respective companies voestalpine Stahl GmbH, voestalpine Grobblech GmbH, voestalpine Giesserei Linz GmbH,
voestalpine Giesserei Traisen GmbH, voestalpine Camtec GmbH, voestalpine Steel & Service Center GmbH,
voestalpine Standortservice GmbH, Logistik Service GmbH, Cargo Service GmbH and voestalpine Automotive
Components Linz GmbH. This document is a translation of the validated German document.

2
CONTENT
Climate protection measures.......................................................................................... 04
Measures implemented in the 2019/20 environmental program.........................06
Measures being implemented in the 2020/21 environmental program............08
New measures introduced in the 2020/21 environmental program...................09
Production and energy figures........................................................................................10
Core indicators at the Linz location...............................................................................11
Core indicators at the Steyrling location......................................................................14
Core indicators at the Traisen location.........................................................................16
Circular economy by voestalpine...................................................................................18
   Environmental focus on air...........................................................................................22
   Environmental focus on energy..................................................................................28
   Environmental focus on water.....................................................................................30
   Environmental focus on waste.................................................................................... 34
   Environmental focus on transports............................................................................36
Safety takes highest priority: Seveso production systems......................................38
Additional environmental impact.................................................................................. 44
Legal management of environmental aspects..........................................................45
Information, contact and About Us.............................................................................. 46

                                                                                                                             3
CLIMATE PROTECTION
MEASURES
Climate protection and decarbonization present a major challenge in process and product development

in energy-intensive industries such as the steel industry. voestalpine has been working intensively on

research and development projects in an effort to implement technologies that allow the CO2-lean

production of consistently high-quality products.

voestalpine is committed to the objectives of the Paris        cal assessment and would reduce CO2 emissions in steel-
Climate Protection Agreement in order to reduce green-         making at the Linz and Donawitz sites by approximately
house gas emissions by more than 80% by the middle of          one third after the year 2030. The technological challenge
this century and is pursuing a consistent and long-term de-    is ensuring consistently high product quality. The additional
carbonization strategy to achieve this goal.                   demand for renewable electricity for this technology would
                                                               be up to three terawatt hours, which would also require ex-
Extensive research and development programs such               pansion of the grid infrastructure.
as H2FUTURE, which is an EU flagship project, for the
production of green hydrogen on an industrial scale.           In addition to hot metal, pig iron and scrap as demanding
H2FUTURE was successfully commissioned in 2019 and             prematerials, the hybrid design also uses the hot-briquet-
will run through 2021, enabling a switch in the long term      ted iron (HBI) produced by voestalpine using natural gas
from coal- to hydrogen-based steelmaking.                      in the direct-reduction plant in Texas. This raw material mix
                                                               with an increased portion of HBI is the most important fac-
However, concrete intermediate steps are also being tak-       tor in this innovative production route. The objective in the
en. A hybrid designed to make the gradual switch from a        long term is to produce the same high-quality steel grades
coal-based blast furnace route to a green electricity-based    of today by replacing natural gas with hydrogen and utili-
electric steel route is currently under economic and techni-   zing green HBI and scrap.

DECARBONIZATION OF THE STEELMAKING PROCESS

Traditional blast furnace route

4
HYBRID STEELMAKING PLANT THROUGH 2030/35

HBI as a high-quality prematerial (CO2 emissions reduced by more than 30%)

The primary prerequisite for this transition is the availability             term development of breakthrough hydrogen metallurgy,
and affordability of renewable electrical energy. Ultimately                 which is currently still in the developmental phase, voest-
it will be crucial to competitively operate these CO2-lean                   alpine is carrying out research and development projects
technologies on a global scale. The political framework,                     that focus on the hydrogen-based reduction of ores and
however, has not yet been established, and economic fea-                     the production of crude steel using hydrogen plasma.
sibility has not yet been proven. In addition to the long-

BREAKTHROUGH TECHNOLOGY

Reduction of CO2 emissions by more than 80% through 2050

In addition, voestalpine is working intensively on cross-sec-                separation of carbon dioxide and its conversion into raw
tor projects that focus on the economic and technological                    materials in the chemical and petrochemical industries.
feasibility of carbon capture and usage (CCU), which is the

                                                                                                                                       5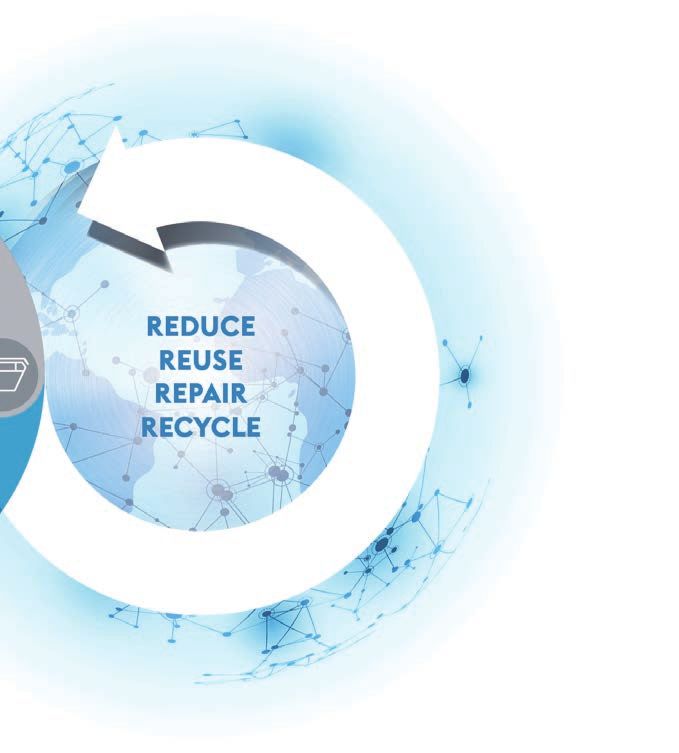
2019/20 ENVIRONMENTAL
PROGRAM
IMPLEMENTED MEASURES
Excerpt of environmental measures implemented in the 2019/20 fiscal year
Essential environmental measures that have made a significant contribution to environmental performance are integral
constituents of the environmental programs of companies included in the scope. The following tables document measures
implemented in previous programs as well as objectives newly defined in the 2020/2021 environmental program. Further
individual measures have been developed and implemented in the respective companies.

Company                           Target                          Task                                       Figure                               Deadline
voestalpine Stahl GmbH            Diffuse dust emissions      Construction of a dust extraction and          Target: Reduction of approxi-
                                  reduced in the coke loading dedusting system for dust collection at        mately 500 kg of dust per year       12/31/2020
                                  and unloading facility      transfer points and conveyor belts             Current status: Target of 500 kg
                                                                                                             achieved per year
voestalpine Stahl GmbH            Energy efficiency increased     Installation of an automatic coke breeze   Target: Reduction of approxi-
                                  by optimizing process           sampling system in the mixing plant to     mately 1,500 tons/year of solid
                                  control with regard to fuel     determine grain sizes and to optimize      fuel (coke breeze) = approxi-
                                  consumption in the sintering    the grain size                             mately 12,000 MWh/year
                                  plant                                                                      Current status: Reduction of    6/30/2019
                                                                                                             approximately 1,500 tons/year
                                                                                                             of solid fuel (coke breeze) =
                                                                                                             approximately 12,000 MWh/year
                                                                                                             achieved
voestalpine Stahl GmbH            Reducing agent savings in       Partial substitution of foreign coke by    Target: Reduction of roughly
                                  8-meter blast furnaces          increasing the quality of our own coke     15,000 tons/year of external
                                                                                                             coke or roughly                      12/31/2019
                                                                                                             49,000 tons/year of CO2
                                                                                                             Current status: Target 100%
                                                                                                             achieved
voestalpine Stahl GmbH            Conservation of resources       Development of a new coating thickness Target: Reduction of coating
                                  through optimized paint         measuring method for more accurate     requirements in C6 coatings
                                  application in Continuous       determination of coating thicknesses   by approximately 20%
                                  Annealing Line 2                                                       Current status: Development and          3/31/2020
                                                                                                         testing have been completed,
                                                                                                         but implementation has been
                                                                                                         put on hold in the longer term
voestalpine Stahl GmbH            Increased energy efficiency     Reduction and control of the condenser     Target: Blast furnace
                                  through optimization of         cooling water quantity by adapting the     gas reduced by roughly
                                  exhaust steam pressure in       exhaust steam pressure from 0.09 to        6,600 MWh/year and
                                  the two turbines of the blast   0.12 bars                                  roughly 8.8 million m3/year
                                  centers                                                                    of process water                     3/31/2020
                                                                                                             Current status: Reduction of
                                                                                                             blast furnace top gas by roughly
                                                                                                             42,000 MWh achieved Service
                                                                                                             water was reduced by
                                                                                                             5.5 million m3/year
voestalpine Stahl GmbH            Reduction of the use of         Gas system optimization and increased      Target: A reduction of
                                  natural gas in Mixed Gas        purchasing of external electric power      natural gas by roughly
                                  Station 1                                                                  130,000 MWh/year and an
                                                                                                             increase in the purchase of
                                                                                                             external power resulted in a         3/31/2020
                                                                                                             reduction of roughly
                                                                                                             15,000 tons of CO2 per year.
                                                                                                             Current status: Savings were
                                                                                                             achieved
Steyrling location                Reduction of electric power Reduction of power consumption result-         Target: Reduced by roughly
                                  consumption in the produc- ing from lower furnace pressure                 940 MWh/year
                                  tion of quicklime                                                          Current status: Reduction was        3/31/2020
                                                                                                             achieved of approximately
                                                                                                             1,000 MWh per year
voestalpine Giesserei Linz GmbH   Assessment of filter dust       Discussions and test series                Target: 20 tons of filter dust
                                  recycling in effort to reduce   with partner companies                     recycled per year
                                  landfill quantities                                                        Current status: A one-off effect
                                                                                                             amounting to 17,325 tons was         3/31/2020
                                                                                                             achieved in the 2019 FY. It was
                                                                                                             not possible to find a sustainable
                                                                                                             supplier

6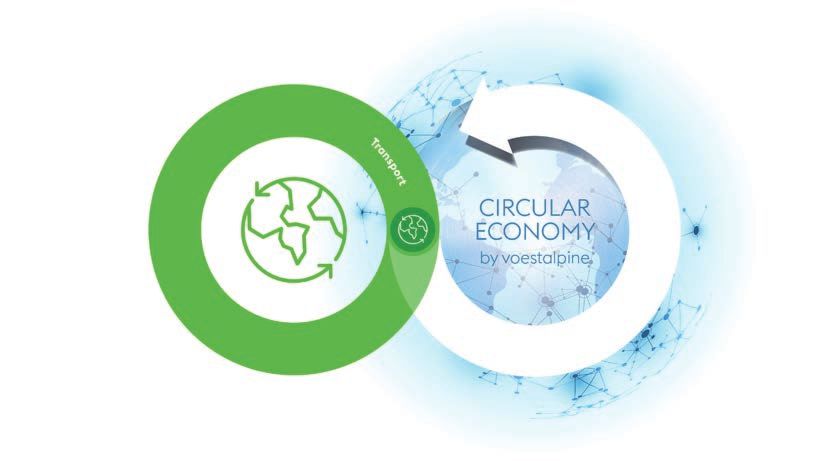
Company                                   Target                       Task                                          Figure                                 Deadline
voestalpine Giesserei Linz GmbH           Reduction of emissions in    Optimization of the use of scrap in melt-     Target: Reduction of dust
                                          scrap processing             ing operations (reduced pre-shredding         emissions by approximately
                                                                       activity, shorter operating times for scrap   7.2 kg per year                        3/31/2020
                                                                       cutting)                                      Current status: Dust emissions
                                                                                                                     reduced by 7.2 kg per year
voestalpine Giesserei Traisen GmbH        Reduction of chemical        Installation of a new automatic sand    Target: Reduction of roughly
                                          consumption                  mixer and introduction of a sand lab    20 tons of binding agents
                                                                       with automatic dosing of binding agents per year                                     3/31/2020
                                                                                                               Current status: Reduction of
                                                                                                               binding agents by 115 tons
voestalpine Camtec GmbH                   Reduction of packaging       Reuse of wooden crates at a customer          Target: Reduction of packaging
                                          material                     (pilot, other customers possible)             materials by 5 to 10%
                                                                                                                     Current status: Savings of ap-         3/31/2020
                                                                                                                     proximately 1,000 kg of wooden
                                                                                                                     packaging
voestalpine Steel & Service Center GmbH   Reduction of gas consump- Increased energy efficiency through              Target: Consumption of natural
                                          tion in the shape cutting purchase of a new annealing furnace              gas reduced by roughly 60 MWh
                                          facility                  with better insulation and annealing             per year
                                                                    dimensions                                       Current status: Technologically        3/31/2020
                                                                                                                     mature project postponed indef-
                                                                                                                     initely due to economic viability
                                                                                                                     (< 1 year)
Logistik Service GmbH                     Reduced consumption of       Procurement of two new diesel locomo- Target: Diesel savings of roughly
                                          diesel fuel on the works     tives with start-stop technology (1004.03 5,225 liters per year per loco-
                                          railway                      and .04 series)                           motive = total savings of roughly 10/31/2019
                                                                                                                 10,450 liters year
                                                                                                                 Current status: Diesel fuel savings
                                                                                                                 achieved of 10,450 liters/year
Cargo Service GmbH                        Reduction of diesel fuel     Conversion from diesel to electric loco-      Target: Reduction of roughly
                                                                       motive on the Steyrling-Kirchdorf route       9,250 liters of diesel fuel per year
                                                                       for 100% of journeys completed in the         Current status: Liters of diesel       3/31/2020
                                                                       2019/2020 fiscal year                         fuel reduced by roughly 7,250
                                                                                                                     per year
voestalpine Automotive Components Linz Reduction of packaging          Redesign of Jeep Compass packaging in Target: Packaging film reduced
                                       material                        order to reduce material consumption  by roughly 5,600 m2 per year                    6/1/2019
                                                                                                             Current status: Packaging film
                                                                                                             reduced by roughly 4,200 m2
voestalpine Standort Service GmbH         Reduced pollutant            Continuous replacement of vehicles used       Target: Conversion to EURO 6
                                          emissions from vehicles      by works fire department, plant security      (4 cars) or EURO 5 (1 truck)
                                                                       and vocational health center with higher      Current status: Target implement- 3/30/2020
                                                                       emission standards                            ed and achieved

Measures not implemented in the environmental program of the 2019/20 fiscal year
Company                                   Target                       Task                                          Figure                                 Deadline
voestalpine Stahl GmbH                    Reduction of cooling water   Exchange of three water-cooled steel          Target: Cooling water reduced
                                                                       rolls in hot-dip galvanizing line No.1 to     by roughly 150,000 m3 per
                                                                       non-cooled, full-ceramic rolls, thus elimi-   year (roughly 4% of the annual
                                                                       nating energy loss to the cooling water       discharge volume in Hot-dip
                                                                                                                     Galvanizing Line No. 1)          12/31/2019
                                                                                                                     Current status: Target was not
                                                                                                                     achieved because there has been
                                                                                                                     no solution to date for problems
                                                                                                                     with the full-ceramic rolls.

                                                                                                                                                                        7
2020/21 ENVIRONMENTAL
PROGRAM
MEASURES BEING
IMPLEMENTED

Company                      Target                       Task                                        Figure                              Deadline
voestalpine Stahl GmbH       Coking plant: Soil vapour    Remediation of Linz coking plant 076 in Reduction of BTEX in
                             extraction: Reduction of     Linz, stage 1: Extraction of BTEX from the contaminated soil to                 12/31/2022
                             BTEX content in future       contaminated underground air phase in below 50 mg/m3
                             excavated material           the unsaturated zone (soil extraction)
voestalpine Stahl GmbH       Reduction of fugitive dust   Optimization of the coke cake guide         Reduction of approximately
                             emissions during coke        carriages and improved dust collection      6 tons of dust per year             3/31/2022
                             pressing process             in the coke transfer machines
voestalpine Stahl GmbH       Reduced consumption of       Optimized utilization of the temperature    Result in final report on cooling
                             cooling water at the Linz    range between the Danube water inlet        water reduction in m3 per year
                             location during the summer   and the cooling water outlet in selected                                        12/31/2021
                             months as part of an         water lines
                             experimental program
voestalpine Grobblech GmbH   Reduced energy               Investment in a chamber furnace and         Target: Natural gas
                             consumption in               optimization of the operation modes of      consumption reduced by               Extended
                             heating units                the pusher-type furnaces (relocation of     roughly 4,600 MWh/year                until 31
                                                          thick plating units to chamber furnace      and coking gas consumption          March 2021
                                                          and thus optimizing the operation mode      by roughly 4,900 MWh/year
                                                          in pusher-type furnaces 1 and 2)
voestalpine Grobblech GmbH   Reduced energy               Increased energy efficiency through         Natural gas consumption
                             consumption in               investment in a second chamber furnace      reduced by roughly
                             heating units                and optimization of the operation modes     4,600 MWh/year and                   Extended
                                                          of the pusher-type furnaces (relocation     coking gas consumption by             until 31
                                                          of thick plating units to chamber furnace   roughly 4,900 MWh/year              March 2021
                                                          and thus optimizing the operation mode
                                                          in pusher-type furnaces 1 and 2)

8
2020/21 ENVIRONMENTAL
PROGRAM
NEW MEASURES
Company                                   Target                          Task                                        Figure                             Deadline
voestalpine Stahl GmbH                    Improved quantification         Recurring emission measurements in          Presentation of measurement
                                          of emissions in the coking      addition to those prescribed by law         reports                            3/31/2021
                                          plant
voestalpine Stahl GmbH                    Reduction of fuel input in      Replacement of old annealing hoods          Burner gas consumption reduced 12/31/2022
                                          annealing                       with new ones                               by 600 MWh per year
voestalpine Stahl GmbH                    Reduction of energy input       Savings in ignition gas volume              Target: Reduction of coke-oven
                                          during charging of mixed        (coke-oven gas) by optimizing               gas by roughly 60 scm/h =          3/31/2021
                                          materials in the sintering      mixture                                     roughly 2,500 MWh per year
                                          plant
voestalpine Stahl GmbH                    Reduction of precipitation Beta 3 project: Throughout the project,          Installation of an
                                          discharge into sewage      roof water is no longer discharged into          infiltration system
                                          system and increase in     the sewer system, but into the subsoil.
                                          underground water quantity                                                                                     3/31/2022
                                          by 10,100 m³ per year
                                          (introduced into natural
                                          water cycle)
voestalpine Stahl GmbH                    Reduction of purge gas          Reduction of top gas purging quantities     Reduced by roughly
                                          losses in blast furnace gas     for flares 5 and 6 through additional       3,900 MWh/year                     3/31/2021
                                          flares 5 and 6                  measures that prevent backfiring
voestalpine Stahl GmbH                    Increased energy efficiency Increased mixed blast temperature by            CO2 reduced by roughly
                                          in blast furnaces 5 and 6   5 °C in blast furnaces 5 and 6 through          1,372 tons per year
                                                                      structural changes in combustion air                                               12/31/2020
                                                                      ducts and changes in combustion
                                                                      parameters
voestalpine Stahl GmbH                    Reduction of filter cart-   Installation of cleaning system                 Filter tube consumption reduced
                                          ridges in wastewater treat- with flow rate measurement                      by roughly 270 units per year      3/30/2021
                                          ment in hot-dip galvanizing
                                          and annealing lines
Steyrling location                        Reduction of dust emissions Dust emissions are significantly reduced Dust emissions reduced in grit
                                          arising from the transport of by lowering the height of discharge, elim- transport by approximately 30%
                                          grit in the steelworks        inating a conveyor belt and by altering                                          3/31/2021
                                                                        the course by means of a reactivated
                                                                        bunker
voestalpine Giesserei Linz GmbH           Reduction of pollutants         Coke oven gas heating methods               CO2 reduced by roughly
                                          such as CO2, and NOx            replaced by infrared radiation              5,000 Nm³ per year, and
                                                                                                                                                         3/31/2021
                                                                                                                      NOx reduced by roughly
                                                                                                                      500 Nm³ per year
voestalpine Giesserei Traisen GmbH        Increased efficiency of in-     Development of a planning tool              Reduction of truck
                                          house-controlled transport                                                  transport runs by 10               3/31/2021
                                          vehicles for inbound and
                                          outbound deliveries
voestalpine Camtec GmbH                   Reduction of packaging          Reuse of wooden boxes at our                Packaging materials reduced
                                          material                        customers (being extended to                by roughly 5–10%                   3/31/2021
                                                                          other large customers)
voestalpine Steel & Service Center GmbH   Reduction of gas consump- Reduction of the annealing                        Consumption of propane
                                          tion in the shape-cutting temperature from 100 to 60 °C                     gas reduced by roughly             3/31/2021
                                          facility                                                                    40 MWh per year
voestalpine Standort Service GmbH         Conversion from fluorine-       Continuous replacement of fluorine-         Conversion from fluorine-
                                          containing foaming agent        containing foam concentrate used by         containing to fluorine-free
                                          to a fluorine-free one at the   the works fire department in emergency      foaming agent                      3/30/2021
                                          works fire department           vehicles or stored in the warehouse
                                                                          (roughly 1,900 liters)
Logistik Service GmbH                     Reduced consumption of          Acquisition of an electronic shunting       Target: Savings of approximately
                                          diesel fuel on the works        module (iSi robot as replacement for        43,500 liters of diesel per year   3/31/2021
                                          railway                         diesel locomotive)
Cargo Service GmbH                        Reduction of energy             Replacement of 6-axle railcars with         Reduction in traction current
                                          consumption                     modern 4-axle railcars (TansANT) for ore    of 180 kWh x 500 trains =          3/31/2021
                                                                          transport between Eisenerz and Linz         90,000 kWh per year
voestalpine Automotive Components Linz Replacement of air-condi-          Air-conditioning system in production       Elimination of 444 kg R22
                                       tioning systems Elimination        line 1 upgraded to the latest genera-       coolant per year, reduction of
                                       of old anti-freeze                 tion (chilled water unit). Savings of R22   R410a coolant to 160 kg per         9/1/2020
                                                                          coolant. Better design efficiency. No       year in chilled water unit
                                                                          losses through leakage.

                                                                                                                                                                     9
PRODUCTION AND
ENERGY FIGURES
The following production figures show the relevant environmental parameters for the companies included in this
Environmental Report:

Linz location
Production volume                                                                 Unit                           2017 CY                             2018 CY                        2019 CY
Crude steel (CS)                                                          Million tons                                5.75                                4.62                         5.25

Products                                                                          Unit                           2017 CY                             2018 CY                        2019 CY
Hot-rolled strip (non-slit)                                                                                             1.1                                1.0                          1.0
Cold-rolled strip and electrical steel                                                                               1.054                              0.908                         0.961
Galvanized strip                                                                                                     2.212                                 2.1                          2.1
                                                                          Million tons
Organic-coated strip                                                                                                 0.196                              0.183                           0.2
Heavy plate                                                                                                             0.8                                0.6                          0.5
Blast furnace slag                                                                                                      1.3                                1.3                          1.4
Castings in Linz                                                                                                     6,214                              5,912                         5,212
Camtec castings                                                                   tons                                 110                                114                           80
Laser-welded blanks                                                                                               153,903                            152,461                        155,165
Products processed by SSC                                                 Million tons                                  1.8                                1.7                          1.7

Energy                                                                            Unit                           2017 CY                             2018 CY                        2019 CY
Natural gas 1)                                                                    TWh                                 3.37                                3.86                         3.57
Electric power (outside source)                                                   TWh                                0.482                              0.589                         0.461

Steyrling location
Products                                                                          Unit                           2017 CY                             2018 CY                        2019 CY
Burned lime (BL)                                                                                                     0.359                              0.287                         0.315
Armor stones                                                              Million tons                               0.002                              0.002                         0.002
Fines (unburned)                                                                                                     0.512                              0.513                         0.618

Energy                                                                            Unit                           2017 CY                             2018 CY                        2019 CY
Natural gas                                                                                                            342                                282                          308
                                                                                 GWh
Electric power                                                                                                          15                                  11                          12

Traisen location
Production volume                                                                 Unit                           2017 CY                             2018 CY                        2019 CY
Cast parts                                                                        tons                             8,014 2)                           8,361 2)                        6,539
Cast parts                                                                        units                            22,528                              25,790                        23,659

                   1)
                        Calculation was standardized in compliance with reporting obligations pertaining to energy monitoring (upper calorific value).
                   2)
                        Value was updated (reduced by 2 tons). This results in minor changes in the specific key figures (with reference to tons of castings) on pages 16 and 17.
10
CORE INDICATORS
LINZ LOCATION
The core indicators refer to total annual crude steel production. In the 2019 calendar year, the
value was 5.25 million tons. In 2017 it was 5.75 million tons. In 2018 it was 4.62 million tons.
MATERIAL EFFICIENCY 2017 2018 2019
Absolute volume
7.70 7.34
6.24
1.46 1.79 1.76 1.76
1.24 1.33
0.309 0.266 0.290 0.363 0.347 0.440 0.431 0.214 0.385
Ore Scrap Burned lime Limestone fines Coal Purchased coke
[million tons] [million tons] [million tons] [million tons] [million tons] [million tons]
Specific volume
1.34 1.35 1.40
0.382 0.335
0.253 0.268 0.253 0.311
0.054 0.057 0.055 0.063 0.075 0.084 0.075 0.046 0.073
Ore Scrap Burned lime Limestone fines Coal Purchased coke
[t/t CS] [t/t CS] [t/t CS] [t/t CS] [t/t CS] [t/t CS]
ENERGY EFFICIENCY
Absolute volume Specific volume
27.72 4.78 4.85 4.93
25.85
23.51
0.260 0.346 0.263 0.045 0.075 0.050
Total energy consumption Portion of renewable energy 1) Total energy consumption Portion of renewable energy 1)
[TWh] [TWh] [MWh/t CS] [MWh/t CS]
1)
Increased proportion of renewable energies with respect to electricity labeling from purchased third-party electricity. This reflects the following for the 2019 calendar year:
water power (37.52%), solid biomass (3.16%), liquid biomass (0.01%), biogas (1.04%), wind energy (11.24%), photovoltaic power (2.28%), waste containing a high percent-
age of biogenic materials (1.88%), landfill gas (0.02%), sewage gas (0.01%) and geothermal energy (less than 0.01%). 11CORE INDICATORS
LINZ LOCATION
WATER 2017 2018 2019
Absolute volume Specific volume
616.3 118.5
584.7 107.2
530.1 547.6 557.5 106.1
519.3
31.5 28.2 27.2
0.082 0.083 0.078
Danube water Ground water Potable water Total Total
[million m³] [million m³] [million m³] [million m³] [m³/t CS]
EMISSIONS
Absolute volume Specific volume
77,691 9.22 14.790 1.691 1.678
73,679 8.81 13.943 1.603
64,458 7.82 12.813
CO CO2 1) CO CO2 1)
[t] [million tons] [kg/t CS] [t/t CS]
3,742 0.517 0.682 0.665
3,495 0.492 0.651
3,154 0.435
2,499 2,392 2,583
NOx as NO2 SO2 NOx as NO2 SO2
[t] [t] [kg/t CS] [kg/t CS]
218 0.043 0.035
201 0.038 0.031
178 178 0.034
162 0.027
143
Dust PM10 Dust PM10
[t] [t] [kg/t CS] [kg/t CS]
Other greenhouse gases such as methane and fluorochlorohydrocarbons (FCHC) are emitted
in only small amounts (roughly 59 tons of methane and 40 kg of FCHC).
1)
From Emission Certificate Act (ECA) monitoring
12WASTE 2017 2018 2019
Absolute volume
741,205
614,125
601,252
566,847
439,997
398,249
166,055 139,529
136,320 60,432 49,128 57,203 37,137
38,310 22,746
1,774 2,079 1,958 1,549 1,245 1,156
Non-hazardous Commercial waste Residues Hazardous waste Dump sites Material Recovery of
waste treated materials similar to [t] treated off site (in-house) re-utilization off-site materials in
off site household waste [t] [t] in the production the production of
[t] [t] of crude steel crude steel
[t] [t]
Specific volume
141.11
132.85
104.56 98.57
86.15 83.76
28.88 29.49 26.56
10.51 8.29 9.35 9.95 4.92 7.07
0.31 0.45 0.37 0.27 0.27 0.22
Non-hazardous Commercial waste Residues Hazardous waste Dump sites Material Recovery of
waste treated materials similar to [kg/t CS] treated off site (in-house) re-utilization off-site materials in
off site household waste [kg/t CS] [kg/t CS] in the production the production of
[kg/t CS] [kg/t CS] of crude steel crude steel
[kg/t CS] [kg/t CS]
BIOLOGICAL DIVERSITY 2)
Absolute volume
5,102,707 5,102,707
2,330,852 2,435,904 2,315,011 2,204,057
456,844 462,746
0 0
Total surface coverage Total sealed land Total near-natural Other areas Total near-natural
of the site [m2] surface area on site (e.g. water, storage) surface area off site
[m2] [m2] [m2] [m2]
2)
Core biological diversity indicator refers to the surface area of the works premises at the Linz location as registered in the land registry in December 2019.
13CORE INDICATORS
STEYRLING LOCATION
The core indicators refer to total annual burned lime production. MATERIAL EFFICIENCY 2017 2018 2019
In the 2019 calendar year, the value was 0.32 million tons. In
Absolute volume Specific volume
2017 it was 0.36 million tons. In 2018 it was 0.29 million tons.
0.639 1.78 1.78 1.78
0.562
0.511
Limestone for the Limestone for the
production of burned lime production of burned lime
[million tons] [t/t BL]
ENERGY EFFICIENCY
Absolute volume Specific volume
0.357 0.994 1.022 1.015
0.320
0.293
0.008 0.007 0.007 0.022 0.024 0.022
Total energy consumption Portion of renewable energy 1) Total energy consumption Portion of renewable energy 1)
[TWh] [TWh] [MWh/t BL] [MWh/t BL]
EMISSIONS
Absolute volume
54.9 56.6 0.346
48.5 0.304
0.274
16.90 16.60
13.70
2.01 3.81 2.30
Dust 2)
NOx as NO2 3) Diffuse dust emissions PM10 CO2 4)
[t] [t] [t] [million tons]
Specific volume
0.053 48 48 48 0.964 0.957 0.962
0.047 0.048
0.013
0.006 0.007
Dust 2) NOx as NO2 3) Diffuse dust emissions PM10 CO2 4)
[kg/t BL] [kg/t BL] [g/t LS] [t/t BL]
1)
Increased proportion of renewable energies with respect to electricity labeling from purchased third-party electricity This reflects the following for the 2019
calendar year: water power (37.52%), solid biomass (3.16%), liquid biomass (0.01%), biogas (1.04%), wind energy (11.24%), photovoltaic power (2.28%),
14 waste containing a high percentage of biogenic materials (1.88%), landfill gas (0.02%), sewage gas (0.01%) and geothermal energy (< 0.01%).
2)
Conversion to total dust (collected dust sources; retroactive over the past 3 years)
3)
Emissions from lime furnaces
4)
From Emission Certificate Act (ECA) monitoringWASTE 2017 2018 2019
Absolute volume
567
140
75
30.6 8.7
3.0 2.0 4.2 4.5
Non-hazardous waste Hazardous waste Material re-utilization in the
treated off site treated off site production of crude steel 5)
[t] [t] [t]
Specific volume
1.975
0.444
0.208
0.107 0.030
0.008 0.006 0.012 0.014
Non-hazardous waste Hazardous waste Material re-utilization in the
treated off site treated off site production of crude steel 5)
[kg/t BL] [kg/t BL] [kg/t BL]
BIOLOGICAL DIVERSITY 6)
Absolute volume
98.70 98.70
40.30 40.30
11.40 11.40
4.10 4.10
Total surface coverage Total sealed land Total near-natural surface Total near-natural surface
of the site [ha] area at the site area off site
[ha] [ha] [ha]
5)
Material recycling at the Linz location
6)
The core biological diversity indicator refers to the surface of the works premises at the Steyrling location as registered in the land registry in May 2019.
15CORE INDICATORS
TRAISEN LOCATION
The core indicators refer to total annual casting production. MATERIAL EFFICIENCY 2017 2018 2019
In the 2019 calendar year, the volume was 6,539 tons.
Absolute volume Specific volume
In 2017 it was 8,014 tons. In 2018 it was 8,361 tons.
5,803 0.755
5,308 0.662 0.694
4,939
Recycling scrap Recycling scrap
[t] [t/t castings]
ENERGY EFFICIENCY
Absolute volume
31.67
30.01 29.56
17.92 18.99
16.49 16.27
14.11 13.22 12.67
9.35 10.00
3.81 2.72 3.27
Total electric consumption Power generation Purchased electric power Portion of renewable Gas consumption
[GWh] [GWh] [GWh] energies 1) [GWh]
[GWh]
Specific volume
4.521
3.952
3.589
2.521
2.236 2.272
1.946 2.021
1.760 1.581 1.529
1.118
0.476 0.325 0.500
Total electric consumption Power generation Purchased electric power Portion of renewable Gas consumption
[MWh/t casting] [MWh/t casting] [MWh/t casting] energies 1) [MWh/t casting]
[MWh/t casting]
WATER
Absolute volume Specific volume
0.924 0.896 134.69
0.881
115.29
107.15
Total water consumption Total water consumption
[million m3] [m3/ton casting]
1)
Determination of share of renewable energies based on official disclosure arising from purchased external electric power and electricity generated by the two hydro-power
plants. During the 2019 calendar year, externally supplied electricity was generated by water power (26.94%), wind energy (8.51%), solid biomass (3.3%), photovoltaics
16 (1.02%), other eco-energies (0.97%), natural gas (3.74%) and other sources (3.28%).EMISSIONS 2017 2018 2019
Absolute volume Specific volume
14.35 1.717 1.674
10.94
4.89 0.585 0.626
4.09 3.88 0.465 0.476
3.11
Dust 2) 3) NOx as NO2 2) Corg 3) Dust 2) 3) NOx as NO2 2) Corg 4)
[t] [t] [t] [kg/t castings] [kg/t castings] [kg/t castings]
WASTE
Absolute volume Specific volume
6,913 7,122 951.85
6,224 862.56 851.78
165.0 150.0 148.1 20.58 17.94 22.65
Non-hazardous waste Hazardous waste Non-hazardous waste Hazardous waste
treated off site treated off site treated off site treated off site
[t] [t] [kg/t castings] [kg/t castings]
BIOLOGICAL DIVERSITY 5)
Absolute volume
78,217 78,217
72,196 72,196
6,021 6,021
0
Total surface coverage Total sealed land Total near-natural surface Total near-natural surface
of the site [m2] area at the site area off site
[m2] [m2] [m2]
2)
Emissions from production systems
3)
Value adjustment: The previous year’s figure amounted to 9.03 tons and was subsequently reduced by the retirement of two plants in 2016.
This results in an improvement of absolute and specific dust content. 17
4)
From annealing furnace/bogie hearth furnace
5)
The core biological diversity indicator refers to the surface area of the works premises at the Traisen location as registered in the land registry in February 2019.CIRCULAR ECONOMY
BY voestalpine
Versatile, durable and environmentally friendly, steel is the material of the future.
∞
Steel is durable, easy to repair and can always be recycled STEEL MEETS ALL THE
into new steel products. The unique properties of steel, such as
REQUIREMENTS OF A FUTURE
product weight reduction, durability and processability, make
it the number-one material of the future and indispensable in CIRCULAR ECONOMY.
a wide variety of industries.
18Reduce. Product weight and the amount of material used Repair. Because to their manufacturing properties, steel
can be reduced by using modern steel grades. products can be remanufactured or repaired for different
purposes using various manufacturing techniques.
Reuse. The longevity and durability of steel allows con-
tinuous reuse of products. Recycle. Steel products can be recycled in a closed loop
over and over again into new steel products.
19The circular economy has long been implemented in many areas at voestalpine
and is being further developed on a continual basis.
At the political level, the term stands for an ambitious pack- materials used in products (reduce), steel products can
age of measures and legislation adapted and published be reused because of their durability and longevity (reuse)
by the European Union Commission in 2015 to take into and can be repaired using a variety of different manufac-
account the growing importance of this approach in our turing techniques (repair/re-manufacture). Steel products
society as well as in the European and global economies. can always be recycled in a closed loop to make new steel
products.
This includes all phases of value creation (the entire
lifecycle) from production, use and consumption to end of In a circular economy, a fundamental aspect of product
life (waste management and loop closure) and the creation assessment is a holistic view that takes into account eco-
and further development of markets for secondary raw logical, social and economic factors throughout the entire
materials. All these measures are intended to foster devel- lifecycle of the product.
opment in Europe toward a circular economy, strengthen
global competitiveness and promote sustainable econom- Product sustainability encompasses all three pillars of sus-
ic growth. tainability along the entire supply and value chain. At pre
sent, the focus is on environmental aspects.
The concept of a circular economy aims at developing and
closing material cycles and value chains: Life cycle assessment (LCA) is the method used to sys
tematically assess the environmental impacts of products
»» Maintain added value of the products throughout their entire lifecycle. Several impact categories
by using them for as long as possible are considered, including carbon footprint (CO2), acidifi-
»» Keep substances and materials available in the overall cation potential (SO2, NOx), primary energy demand and
system by closing the loop and making them available much more.
again as secondary raw materials in order to preserve
their value This holistic view within the system boundaries is necessary
in order to transparently and objectively identify burden
This minimizes waste (towards ZERO WASTE) and increases shifting in the environmental impact between lifecycle
resource and energy efficiency. phases or between different impact categories.
Steel products contribute to the progress our circular econ- Environmental product declarations (EPDs) are an impor
omy because modern steels can reduce the amount of tant tool for providing transparent and neutral information
20on the environmental impact of products based on a life alpine. Waste and circulating materials from steel produc-
cycle assessment. voestalpine has developed and pub- tion as well as waste and secondary raw materials from
lished EPDs for various products such as colofer®, hot-dip external production processes are used in the production
galvanized steel strip, heavy plate, roll-bonded clad plates processes at the Linz site. Additionally, material cycles
and rails. (product and secondary raw materials) in the supply chain
are established and promoted.
EPDs are based on the EN15804 and ISO14025 standards,
are third-party verified by independent auditors and are The establishment and expansion of so-called industrial
published as part of the declaration program of the Institut symbioses, for example the use of by-products from steel-
Bauen und Umwelt (IBU) in Berlin. making processes as secondary raw materials for the pro-
duction of products in other industrial sectors, contribute
voestalpine also assesses the water footprint for the Linz to the further development of the circular economy. These
site based on holistic methods. industrial symbioses include, for example, the use of gran-
ulated blast furnace slag as an additive in cement produc-
Material cycles can only be developed and the loop tion, the use of coal by-products from the coking process in
closed if the products do not contain substances that in- the chemical industry and regeneration products such as
hibit or counteract the closure of a loop. A corresponding iron oxide for the production of components in electronics
legal framework governs the handling of such substances and electrical applications.
as well as the reporting obligations and verifying.
Circular economy is not a theoretical approach at voest-
These include REACH (Registration, Evaluation, Autho alpine. The steel products made by voestalpine are ver-
rization and Restriction of Chemicals), RoHS (Restriction of satile, durable and sustainable, and the production pro-
Hazardous Substances) and the directive on end-of-life ve- cesses at the Linz site are optimized on a continual ba-
hicles. The products of the voestalpine Steel Division meet sis to further increase resource and energy efficiency.
all pertinent requirements (material compliance). voestalpine is an integral part of the circular economy
along the entire value chain.
The circular economy concept with development and ma-
terial loop closure as well as material and value creation
cycles to increase resource and energy efficiency is imple-
mented in the Linz-site manufacturing processes of voest-
21ENVIRONMENTAL FOCUS ON
AIR
The reduction of emissions is an essential target. The results are very favorable.
-95%
A savings of 95% dust per ton of crude steel is only one of Reduce. Process-integra- Repair. Coal grinding and
the many values that voestalpine substantially improved. ted measures such as new drying plant with post-
The reduction of specific emissions at the Linz location is burner technologies combustion, filter bag ex-
impressive. Since the mid 1980s, SO2 and NOx have also change, regular cleaning
been reduced by 75%, and CO2 by roughly 20%. Reuse. Circulation in dust of DeNOx heat plate ex-
management, such as zinc changers, end-of-pipe
in the LD3 steelmaking technologies
plant, or of activated car-
bon and sodium bicarbon Recycle. Reuse of the cast-
ate in the sintering plant ing hall dust in the sinter-
ing plant
22Implementing state-of-the-art technologies takes a high The voestalpine foundry at the Traisen location takes effec-
priority at the Linz location in order to avoid or reduce tive air pollution control measures to sustainably improve
emissions. the air quality, meet legal obligations and pursue its own
More than 70% of the emissions are continuously mea- interests. Best available technologies are implemented to
sured and are transmitted online to the local environ- achieve the best results.
mental authorities. The remaining emissions are assessed
in compliance with official requirements in prescribed in- Specific air emissions
tervals. Continual further development of production processes
and the implementation of numerous air-pollution-control
The emissions from lime extraction at the Steyrling location measures have led to a significant reduction in emissions.
during the 2019 reporting year were minimal as compared
to the previous year. Activities involving particularly large
amounts of dust, such as blasting, while taking weather
conditions into account.
EMISSION REDUCTIONS AT THE LINZ LOCATION
per ton of crude steel since the middle of the 1980s
2.04
1.678 1)
1.48
1.38
1.10
0.665
0.492
0.034
90 91 92 93 94 95 96 97 98 99 00 01 02 03 04 05 06 07 08 09 10 11 12 13 14 15 16 17 18 19
Specific volume of SO2 per year in kg/t CS
Specific volume of NOX as NO2 per year in kg/t CS
Specific dust volume per year in kg/t CS
Specific volume of CO2 per year in kg/t CS 1)
1)
Pursuant to the Emissions Certificate Act 2011, as amended
23Continuous emission measurements at the Linz location
NOx as NO2 Production line Half-hour average value (mg/scm) Measured annual average value (mg/scm)
Limit value 2017 CY 2018 CY 2019 CY
Power station Block 06 100 77 66 80
Block 03 100 48 46 42
Block 04 100 38 46 51
Block 05 100 45 42 49
Block 07 100 38 42 50
Gas and steam turbine 33 27 25 28
Blast furnace blower station Central blower station 2, boiler 1 100 3 7 1
Central blower station 2, boiler 2 100 6 5 3
Hot-rolling mill Pusher-type furnace 06 430 274 270 292
Pusher-type furnace 07 430 191 199 209
Walking-beam furnace 1 1)
86 115 114
Sintering plant Sinter belt 5 150 2) 88 85 86
Cold-rolling mill Hot-dip galvanizing line III 250 141 148 88
Hot-dip galvanizing line IV 250 102 94 101
Hot-dip galvanizing line V 250 140 153 155
Heavy plate Pusher-type furnace 1 500 331 370 398
Pusher-type furnace 2 300 3) 163 167 172
SO2 Production line Half-hour average value (mg/scm) Measured annual average value (mg/scm)
Limit value 2017 CY 2018 CY 2019 CY
Power station Block 06 200 61 63 71
Block 03 200 81 89 96
Block 04 200 88 89 111
Block 05 200 78 91 97
Block 07 200 85 94 99
Gas and steam turbine 67 31 29 32
Blast furnace Casting bay dedusting (BF A) 350 93 88 80
LD steelmaking plant Secondary dedusting 1 101.5 4) 18 21 22
Hot-rolling mill Pusher-type furnace 06 200 113 114 125
Pusher-type furnace 07 200 47 49 53
Sulfuric acid and
Coking plant 1,000 5) 370 393 372
gas purification plant
Sintering plant Sinter belt 5 350 289 269 296
Heavy plate Pusher-type furnace 1 200 103 111 120
All emission sources are continuously monitored. The data refer to the respective calendar year.
1)
The limit value is defined in the course of the acceptance test.
2)
Sinter Belt No. 5: additional limitation of daily mean values for NOx of 100 mg/scm.
24 3)
Sinter Belt No. 2: additional limitation of daily mean values for NOx of 200 mg/scm.
4)
SO2 limit values in kg/h.
5)
There is also a fraction limit value of 150 kg SO2/day under normal operating conditions.CO Production line Half-hour average value (mg/scm) Measured annual average value (mg/scm)
Limit value 2017 CY 2018 CY 2019 CY
Power station Block 03 100 0.7 5.9 6.6
Block 04 80 3.9 5.6 13.3
Block 05 80 2.4 7.1 10.6
Block 07 80 0.8 9.1 8.8
Gas and steam turbine 33 2.0 2.8 3.8
Blast furnace Central blower station 2, boiler 1 80 0.6 1.3 3.7
Central blower station 2, boiler 2 80Emission measurements at the Steyrling location
NOx as NO2 Production line Limit value (mg/scm) Measured value (mg/scm)
2017 CY 2018 CY 2019 CY
Steyrling Lime Plant Furnace 4 300 12.6 16.5 Stand by
Furnace 5 300 12.5 16.0 15.7
Furnace 6 300 27.3 1)
23.7
Furnace 7 300 19.8 24.3 22.0
CO Production line Limit value (mg/scm) Measured value (mg/scm)
2017 CY 2018 CY 2019 CY
Steyrling Lime Plant Furnace 4 150 4.1 9.2 Stand by
Furnace 5 150 14.1 9.1 8.0
Furnace 6 150 5.4 1)
12.7
Furnace 7 150 12.5 12.8 10.3
SO2 Production line Limit value (mg/scm) Measured value (mg/scm)
2017 CY 2018 CY 2019 CY
Steyrling Lime Plant Furnace 4 100 1.7 < NWG 3) Stand by
Furnace 5 100 3.1 < NWG 3) < NWG 3)
Furnace 6 100 1.6 1.6 < NWG 3)
Furnace 7 100 < NWG 3) < NWG 3) < NWG 3)
Dust Production line Limit value (mg/scm) Measured value (mg/scm)
2017 CY 2018 CY 2019 CY
Steyrling Lime Plant Furnace 4 10 2.9 6.2 Stand by
Furnace 5 10 1.1 8.2 0.9
Furnace 6 10 1.9 1)
1.4
Furnace 7 10 1.7 2.9 0.3
Furnace discharge 4 10 2) 2)
Stand by
Furnace discharge 5 10 2) 2)
0.8
Furnace discharge 6 10 2) 2)
1.3
Furnace discharge 7 10 2) 2)
1.2
Lime extraction 10 2) 2)
7.8
Lime loading 10 2) 2)
0.5
1)
Standstill for conversion of lime furnace 6 to a circular shaft furnace, no measurements taken
2)
Measuring interval every 3 years, next measurement in the 2022 CY
26 3)
Below the detection limit for pollutantsEmission measurements at the Traisen location
Dust Production line Limit value (mg/scm) Measured value (mg/scm)
Most recent measurement in the 2018 CY 1)
2018 CY
voestalpine Giesserei Traisen GmbH Dedusting in the melting plant 10ENVIRONMENTAL
FOCUS ON ENERGY
Sustainable management of energy resources
is an essential principle at voestalpine.
>15%
By optimizing production processes and cascading the Reduce. Optimization of Repair. Energy recovery
energy used, specific energy consumption at the Linz steam generation and through blast furnace gas
location has been reduced by more than 15% over the past thermal processes as well expansion turbine
20 years. as reduced loss of com-
pressed air Recycle. Injection of used
At the Linz location, 75% of the electrical energy is gene- plastics as a substitute for
rated by the company itself. Reuse. Energetic utilization fossil fuels
of co-products (gases gen
erated during steel pro-
duction)
28In our efficient use of energy, we also focus on optimization of process gas utilization and energy recovery. Consistent
energy monitoring and continuous plant system optimization for increased overall energy efficiency
The voestalpine foundry in Traisen ensures that materials and energy are used in an environmentally friendly and re-
source-conserving manner in all production cycles. We continually surmount new challenges and implement new stan-
dards in order to live up to our social responsibility.
SPECIFIC NET ENERGY CONSUMPTION
per ton of crude steel
20.2
17.7
99 00 01 02 03 04 05 06 07 08 09 10 11 12 13 14 15 16 17 18 19
Specific net energy consumption in GJ/ton of crude steel
Specific energy consumption was substantially reduced The active contributions of each employee to environmen-
over the past twenty years. Approximately 75% of the elec- tal protection and energy savings are of great value. Many
tric power consumed at the Linz location is generated on projects, large and small, are continually being planned
site. and implemented.
The energy required in steelmaking is derived primarily The spectrum ranges from small projects to larger-scale,
from coal, coke, natural gas and electricity. Process gases overreaching measures such as optimization of converter
(coke-oven gas, blast-furnace gas and converter gas) gen- gas storage in the converter gas holder and optimization
erated in the making of steel are used as energy-transfer of boiler heat retention in Central Blower Station 2. These
media either directly or by efficiently converting the gases and many other measures saved more than 83,000 MWh
into heat or electrical energy in individual process steps. during the 2019 calendar year.
29ENVIRONMENTAL
FOCUS ON WATER
In tune with nature.
90%
Total water consumption at the Linz location amounted in Reduce. Cooling process Repair. Seepage pits at
2019 to roughly 558 million cubic meters, of which 89.6% optimization the Linz location
– a total of 499 million cubic meters – was used as cooling
water and returned to the Danube and Traun rivers without Reuse. Cooling towers, Recycle. Reuse of cooling
any pollution. 95% circulation; LD3 wa- water in the recycling cen-
ter treatment ter, wet granulation
30Water is one of the most important operating supplies. It is The amount of water used has increased when compared
needed to cool plant systems and to create steam in iron with the previous year. This is due to the relining of Blast
and steel production. Furnace A at the Linz location and the associated long-
term interruptions to operations in the year 2018.
A total of 558 million cubic meters of water were pumped
from the Danube in the 2019 calendar year at the Linz The impact of production systems at the Linz location on
location. This cooling water is channeled back into the local water systems is relatively small and does not lead
Danube in compliance with the defined temperature lim- to an increase in water scarcity in the region. This conclu-
it values. Depending on the wastewater constituents, was sion was reached during a Water Scarcity Footprint study
either cleaned before returning it to the Danube or was conducted in 2018, which, in addition to the Linz location,
piped to the municipal waste water treatment plant in also included an analysis of all operations and the Group’s
Asten for biological treatment. entire value chain (cradle to gate).
The sustainable management of water resources, partic-
ularly in compliance with local conditions, is an essential
priority of voestalpine.
Functional water circulation is the foundation for an op-
erational system. This is why voestalpine Giesserei Traisen CAREFUL TREATMENT OF
strives to achieve sustainable resource management by WATER AS A NATURAL
linking water management with energy and environmental
services under the premise of preserving flora and fauna.
RESOURCE IS REGARDED
AS A FUNDAMENTAL
The direct net fresh water consumption of voestalpine at
PRIORITY AT voestalpine.
the Linz location in the 2019 calendar year amounted to
7.7 million m³ or 1.46 m³/ton of crude steel.
Ground water
from wells
Preliminary Precleaned
purification Chemical- wastewater in
and Production physical communal
treatment cleaning biological
clarifying plants
Surface water Cooling water Cleaned Cleaned
from the Danube in Danube/Traun wastewater wastewater
in Danube in Danube
RIVER
31Trends in discharged waste water volumes
In the 2019 calendar year, the amount of discharged water amounted to 103 m3 per ton of crude steel.
WATER DISCHARGE VOLUMES
per year
557.5
479
136 103
97 98 99 00 01 02 03 04 05 06 07 08 09 10 11 12 13 14 15 16 17 18 19
Discharged waste water volume per year in millions of m³
Specific discharged waste water volumes per year in m3 per ton of crude steel produced
SPECIFIC DISCHARGE INTO DANUBE DISCHARGE INTO MUNICIPAL
WASTEWATER TREATMENT PLANT
per year per year
46
39
0.5
0.4 0.3
0.5
2011 2012 2013 2014 2015 2016 2017 2018 2019 2011 2012 2013 2014 2015 2016 2017 2018 2019
Total heavy metals (Pb + Zn + Cr + Ni) in g/t of crude steel 1) CSB in g/t crude steel
Total heavy metals (Pb + Zn + Cr + Ni) in g/t crude steel
Water footprint at the Linz location –
a lifecycle assessment
Pursuant to ISO 14046, voestalpine takes a holistic WATER SCARCITY FOOTPRINT
view of the water systems across all production sites
and implements the lifecycle assessment.
4.2%
Direct
Calculation of the water scarcity footprint is car-
ried out to assess the detailed contribution to water 95.8%
scarcity in the region. The assessment takes into ac- Indirect
count the hydro-geological properties at the pro-
duction site. This lifecycle analysis showed that only
roughly 4% of the water scarcity indicator surveyed
was within the sphere of influence of the Linz loca-
tion. Almost 96% is determined by upstream pro-
cesses (primarily raw material supply).
1)
minus initial load from Danube
3233
ENVIRONMENTAL
FOCUS ON WASTE
The objective is to reduce and reuse waste.

90%
Material recycling and the portion of re-used waste mate-       Reduce. Reduced external     Repair. Use of waste oils
rials in total amount to a resource reutilization of 90% with   disposal of sludge from      as a substitute reducing
respect to all waste processed off site and on site.            water treatment systems      agent
                                                                based on recovery of iron-
                                                                rich fraction by flotation   Recycle. Zinc recycling
                                                                                             from steel mill dusts
                                                                Reuse. n. a.

34
Numerous waste and circulating materials are incurred during steelmaking and are returned to the production processes.
This conserves natural raw materials. Waste and secondary raw materials are utilized in both in-house and external pro-
duction process. Examples of this are scrap, end-of-life oils and waste greases. The following graphic provides an overview
of utilized resources in the form of waste and recycled materials at the Linz location (not including scrap).
RESOURCE EFFICIENCY
In the 2019 calendar year, roughly 32% of the recycled
Recyclable and waste materials incurred at the Linz location
materials and waste incurred at the Linz location were
re-utilized, thus increasing resource efficiency in produc-
6% tion processes. (This value is increased to 54% when in-
4%
house scrap recycling is taken into account.)
Material recycling and the portion of re-used waste ma-
58%
terials in total amount to a resource reutilization of 90%
with respect to all waste processed off site and on site.
Resource reutilization: 90%
Sustainable policies to conserve natural resources play
an essential role at the Traisen location. The aim of ma-
terial management is to use the materials taken from
Offsite disposal
nature as intensively as possible and to return them to
Dumping (on site)
32%
production cycles.
Offsite recovery
Recirculation and material reutilization
in the production of crude steel
Recycled materials
or wastes
[%]
WASTE 2017 2018 2019
Waste treated off site
166,055 741,205
136,320 139,529 601,252 614,125
Hazardous waste Non-hazardous waste
treated off site treated off site
[t] [t]
35ENVIRONMENTAL FOCUS
ON TRANSPORTS
More rail, less road.
58%
58.5% of the products are delivered by rail. In the case of Reduce. Reduction of Repair. Shifting of trans-
raw materials, the figure is as high as 71% by rail, 29% by emissions through the ports from road to rail or
ship and less than 0.1% by truck (Linz location, 2019). use of sustainable and ship
climate-friendly means
of transport Recycle. n. a.
Reuse. Closed-loop pro-
duct, production scrap in
the automotive industry:
Use of free railway car ca-
pacities
36Material supply and product delivery are by railway, waterway or truck. It is important to us that our transports are as
ecological as possible. Logistik Service GmbH and Cargo Service GmbH combine their transport possibilities, e.g. mobile
systems, in order to avoid empty hauls and rely heavily on continual improvements in logistics systems, in technologies, im-
plementation, methods, environmentally compatible driving techniques. Where possible, as many transports as possible
are transferred from the roadway to the more environmentally compatible railway.
The figures for distribution of raw materials transported within Europe and distribution of product deliveries to the individ-
ual means of transport are as follows in the 2019 calendar year:
LOGSERV + CARGOSERV RAW MATERIAL TRANSPORTS AT THE LINZ AND STEYRLING SITES 2017 2018 2019
Means of raw material transport
7,100,500 69.3 71.3
6,019,800 62.0
5,636,439
38.0
30.7 28.7
< 0.1 < 0.1 < 0.1
Transport of raw materials 1) Transport by rail Transport by ship 2) Transport by truck
[1,000 t km] [%] [%] [%]
Means of transportation for product delivery
5,001,000 4,897,900 57.7 59.9 58.5
4,469,372
30.2 32.2 32.4
12.1
7.8 9.1
Products dispatched 3) Transport by rail Transport by ship Transport by truck
[tons/year] [%] [%] [%]
The definition of emissions is difficult to impossible because of the large number of transport routes in use by the various
means of transport (railway, ship, truck) with a wide variety of engine and vehicle technologies.
For this reason, no direct emission assessment is made for the transport of raw materials and for the delivery of products
to voestalpine at the Linz location. Only the modal split is used as evaluation criteria for the assessment according to the
respective transport routes.
Customers throughout the world are supplied by voestalpine Giesserei Traisen GmbH. In collaboration with a dynamic net-
work of suppliers and customers, the challenge is to achieve sustainable development in each process stage of the supply
chain. The geographical location and the infrastructure of the Traisen location provide only few possibilities for loading
and unloading. Strategic decisions must yet be made with respect to the selection of suppliers, delivery windows and the
efficient use of transport vehicles based on product and market requirements.
1)
Raw material deliveries in ton kilometers of ore, coal, scrap, lime, coke and coke breeze
2)
Raw material transport by inland waterway
3)
Products supplied from the Linz location by Logistik Service GmbH and Cargo Service GmbH 37SAFETY TAKES HIGHEST
PRIORITY
SEVESO PRODUCTION SYSTEMS
External emergency plan
Detailed information on the alarms and measures outside the works premises can be found in the external emer-
gency plan issued by the fire department of the city of Linz. Required measures in the event of Danger Level III are
contained in the internal emergency plan. The safety report complies with Section 84f of the Trade and Industrial
Code dated 1994 and is available for review in the Environment Department of voestalpine Stahl GmbH.
Information to the public on safety measures and correct behavior in the event of industrial
accidents pursuant to Section 14 of the Industrial Accident Act.
At the Linz production site, voestalpine Stahl GmbH op- »» Coke oven batteries, including coking gas recovery,
erates plant systems that are subject to Section 8a of the conveyor system and gasometer
Trade and Industrial Code of 1994 and the Industrial Acci- »» Tar extraction and crude benzene plant,
dent Act and provides the following information on safety including storage tank
measures and proper behavior in the event of industrial »» Blast furnaces, including gas cleaning,
accidents. Not every plant system failure is an industri- conveyor system and gasometer
al accident, which is defined as an event in which certain »» Converter operations, including converter
hazardous substances are released that pose a danger to gas cleaning, conveyor system and gasometer
humans or to the environment. »» Unloading of fuel oil and distribution into piping
and storage tanks
The precautions to be taken to prevent and limit industrial »» Storage and distribution lines for calcium carbide
accidents are set forth in the Industrial Accident Act. Be- in the steelmaking plant
cause of the comprehensive safety measures that have
been taken for many years in production, the probability Steam reformers A and B and air disintegration units 8
of you as a neighbor being affected by an industrial ac- through 10 are operated by Linde Gas GmbH according to
cident is very low. An industrial accident can only occur in the Linde low-pressure technology and are safety-relevant
the event that all the precautionary technical and organi- systems installed on the works premises in Linz.
zational measures simultaneously fail. In the unlikely event
that an industrial accident occurs in spite of all the safety The substances contained in the systems of voestalpine
measures that have been implemented, the following in- Stahl GmbH and Linde Gas GmbH are subject to the pro-
formation provides advise on steps to take. visions set forth in Section 8a of the Trade and Industrial
Code dated 1994.
There are six relevant plant areas in the integrated metal-
lurgical facility that could have an effect beyond the works
premises in the unlikely event of an industrial accident:
38You can also read