Recent Developments in Ozone Sensor Technology for Medical Applications - MDPI
←
→
Page content transcription
If your browser does not render page correctly, please read the page content below
micromachines

Review
Recent Developments in Ozone Sensor Technology
for Medical Applications
Lisa Petani * , Liane Koker , Janina Herrmann, Veit Hagenmeyer, Ulrich Gengenbach
and Christian Pylatiuk
 Institute for Automation and Applied Informatics, Karlsruhe Institute of Technology, 76344 Karlsruhe, Germany;
 liane.koker@kit.edu (L.K.); urgwh@student.kit.edu (J.H.); veit.hagenmeyer@kit.edu (V.H.);
 ulrich.gengenbach@kit.edu (U.G.); pylatiuk@kit.edu (C.P.)
 * Correspondence: lisa.petani@kit.edu; Tel.: +49-721-608-25761

 Received: 24 April 2020; Accepted: 24 June 2020; Published: 26 June 2020

 Abstract: There is increasing interest in the utilisation of medical gases, such as ozone, for the
 treatment of herniated disks, peripheral artery diseases, and chronic wounds, and for dentistry.
 Currently, the in situ measurement of the dissolved ozone concentration during the medical
 procedures in human bodily liquids and tissues is not possible. Further research is necessary to enable
 the integration of ozone sensors in medical and bioanalytical devices. In the present review, we report
 selected recent developments in ozone sensor technology (2016–2020). The sensors are subdivided
 into ozone gas sensors and dissolved ozone sensors. The focus thereby lies upon amperometric and
 impedimetric as well as optical measurement methods. The progress made in various areas—such
 as measurement temperature, measurement range, response time, and recovery time—is presented.
 As inkjet-printing is a new promising technology for embedding sensors in medical and bioanalytical
 devices, the present review includes a brief overview of the current approaches of inkjet-printed
 ozone sensors.

 Keywords: ozone sensors; medical applications; dissolved ozone; ozone gas; electrochemical sensors;
 optical sensors; inkjet-printing

1. Introduction
      Nowadays, treatment of chronic pain—such as low back pain, coronary artery disease,
osteoarthritis, and peripheral artery disease—is a burden for society and the economy, and therefore
highly relevant [1–3]. Gaskin et al. [4] estimate that the national cost of chronic pain treatment ranges in
the United States from 560 to 635 billion dollars. Further research is necessary to successfully prevent
and treat chronic pain [4].
      Conventional treatment of pain caused by a herniated disk or osteoarthritis of the joints consists
of repeated injections of anti-inflammatory drugs—such as corticosteroids, immunosuppressive drugs,
and antibiotics [5,6]. These drugs are only partially and transiently effective. Furthermore, there are
potential side effects—and in some cases they do not even relieve the pain.
      This problem has led to novel and different treatment methods for pain therapy and related
indications. Some of them are already well-established in clinical routine. For example, subcutaneous
carbon dioxide is utilised to relieve muscle pain and nitrous oxide is applied as an anaesthetic
in obstetrics and during prostrate examinations [7,8]. Furthermore, there are other gases with
therapeutical potential, such as ozone [5,9–14] and xenon [15]. However, for xenon further research in
clinical studies is necessary to prove its therapeutic effectiveness [15].
      In contrast to this, ozone gas is already widely utilised for different treatments and health
issues [5,9–14]. Exemplary scenarios are shown in Figure 1. Ozone is highly unstable and decays

Micromachines 2020, 11, 624; doi:10.3390/mi11060624                         www.mdpi.com/journal/micromachines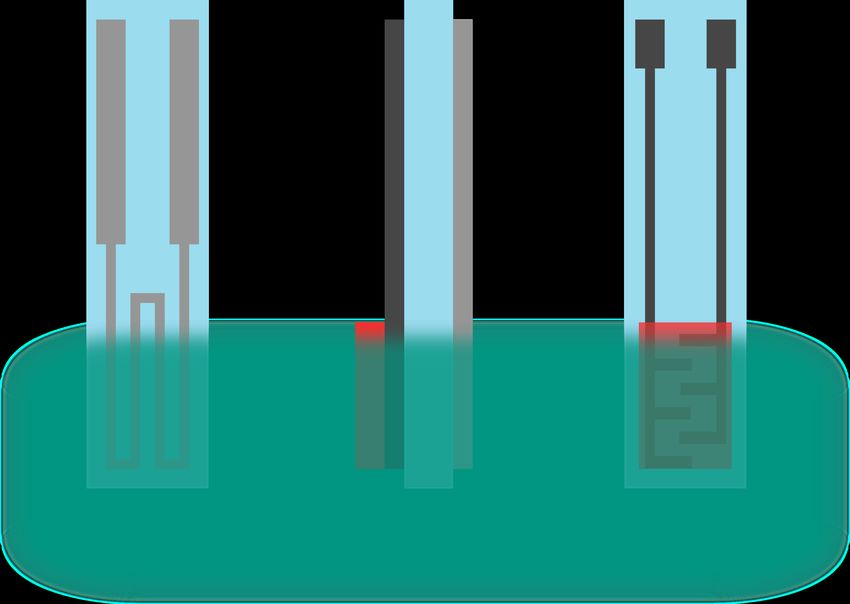
Micromachines 2020, 11, 624                                                                                2 of 28

quickly into oxygen. Therefore, it has to be generated directly before the treatment. During the
generation of ozone for medical applications, ultra-pure medical oxygen is utilised as input for
the ozone generator. This leads to an output of an oxygen–ozone mixture for further utilisation.
As ultra-pure medical oxygen instead of air is used as input for the ozone generator, humidity
interference is not considered in detail when measuring ozone gas for medical applications.
     One application of ozone is its utilisation as an effective alternative to pharmaceutical or
surgical treatment of herniated disks [5,9]. Thereby, medical oxygen–ozone is applied with computer
tomography (CT) guidance through an injection needle. This leads to chemonucleolysis of the
intervertebral disk, and the inner part of the disk, the nucleus pulposus, reduces its volume
progressively [9]. As a result, the pressure on the spinal nerve and the corresponding pain
are released. For the treatment of knee osteoarthritis, oxygen–ozone is injected intra-articularly,
which leads to long-term analgesic effects and increased mobility [14]. Furthermore, ozone has
an anti-inflammatory effect, which is significant in both cases of intradiscal and intra-articular
injections [14]. Another medical treatment, where ozone is applied, is the extracorporeal blood
oxygenation and ozonation (EBOO) therapy. EBOO is a possible treatment for peripheral artery
disease, coronary artery disease, dyslipidemia, madelung disease, and cholesterol embolism [10,11].
During the procedure, venous blood is taken from the patient and is enriched with oxygen–ozone.
Afterwards, the blood is re-infused to the patient. In addition, ozone is applied in dentistry. One
approach with good evidence is to utilise oxygen–ozone before the placement of dental sealants [12].
Another application is the utilisation of ozonated water for the treatment of avulsed teeth [13].

                                                Coronary artery
                                                     disease

                              Disk herniation
                                                                     Osteoarthritis

                                                Madelung disease
                              Dyslipidemia
                              Cholesterol embolism
                                                                          Dentistry

                                                     Peripheral artery
                                                       disease

      Figure 1. Schematic of possible applications for ozone treatment in healthcare. The applications reach
      from disk herniation and osteoarthritis, to coronary and peripheral artery disease, madelung disease,
      dyslipidemia, cholesterol embolism, and dentistry.

     Thus, there is a wide variety of treatment procedures, for which it is essential that the ozone
concentration can be monitored. Up to now, it has not been possible to measure the dissolved ozone
concentration intracorporeal in human body liquids and tissues directly before and during treatment.
For example, during EBOO procedures, the direct measurement of the ozone concentration is only
possible before the ozonation process or by using indirect measurement through markers that are
dependent to the ozone concentration [11]. Furthermore, there is no possibility of precise dosing
and adjustment. This is particularly relevant for the treatment of herniated disks, because only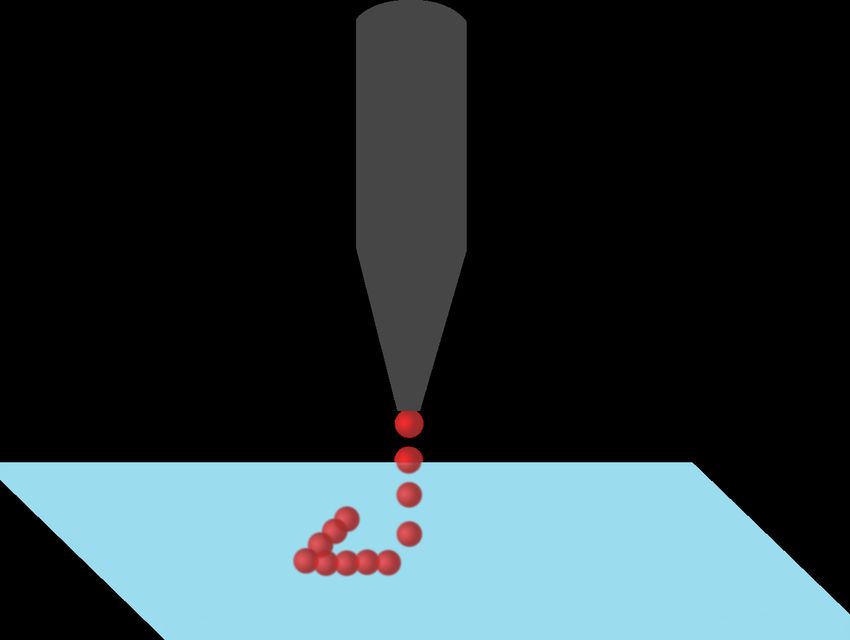
Micromachines 2020, 11, 624                                                                                           3 of 28

relatively small amounts of oxygen–ozone (3–7 mL [9]) are required. Without monitoring the ozone
concentration, health critical quantities might be applied, and contrariwise, too low a concentration
of ozone can be ineffective. Therefore, it is important to integrate ozone sensors into medical and
bioanalytical devices for the different treatment methods [16]. This enables automatic deactivation to
avoid exceeding health critical limits. Furthermore, monitoring with a sensor allows one to get closer
to the limit, which increases the therapeutic effect, without exceeding the limit value.
      There are special requirements for a medical ozone sensor, which depend on the specific
application. A fast response and recovery time is highly significant because of the half life of ozone in
body liquids and tissues. Human tissues, apart from bones, typically have a high fraction of water. At a
temperature of 40 ◦ C, a pH value of 7, and an agitation speed of 100 rpm, ozone decomposes into water
in about 25 min [17]. In comparison, ozone dissolves into blood within a few minutes [18]. The half
life of ozone in body liquids and tissues is smaller than in water because biological organisms are
well protected from strong oxidants, such as ozone, by antioxidant systems. Thereby, the antioxidants
neutralise ozone and the radicals, which are formed by the reaction of ozone with body liquids and
tissues. The implications of ozone on body liquids and tissues can also be analysed by considering
the damage to deoxyribonucleic acid (DNA), amino acids, and lipids by ozone using measurements
reported by Hepel et al. [19]. Therefore, sensors with a response time of several minutes cannot be
utilised. For injection of oxygen–ozone in cases of herniated disks, the sensor response time has to
be below 10–15 s, which is the duration of the treatment [9]. In addition, sensors that are in direct
contact with blood should not be heated above 40 ◦ C to avoid tissue damage. Since there are medical
applications for ozone sensors without direct contact to body liquids and tissues, sensors with higher
measurement temperatures are also included in this review. One example is the ozone therapy to treat
a herniated disc. Here, a gas sensor can be utilised to monitor the concentration inside the injection
needle during treatment. In addition, a medical application does not automatically imply that the
sensor must be implanted in a human body. For example, medical temperature sensors typically
measure body temperature outside the body. Furthermore, the sensor size has to be sufficiently
small, in order to integrate the sensor into the injection needle. Moreover, performance of sensing
elements is affected by bio-thiols, such as glutathione, which are in high concentration in body liquids
and tissues. In blood, the concentration is in the range of 1–10 mM [20]. For electrochemical ozone
sensors, the binding of exogenous bio-thiols to metal electrodes and several compound semiconductor
electrodes is important because through the strong binding the surface of the electrodes is modified
and reaction of ozone with the electrodes is limited. Stobiecka et al. [21] investigate the adsorption of
bio-thiols on a gold surface and ligand replacement from a gold surface by glutathione.
      As shown in Figure 2, there has been an increase of the number of publications during the last
nine years (2011–2019) that are devoted to ozone sensors. While Figure 2 shows the overall trend,
the following chapters cover the recent developments between 2016 and 2020.
 Publications featuring

                          150
    ozone sensors

                          100

                          50

                                2011    2012     2013     2014     2015     2016     2017    2018     2019
                                                                   Year

                   Figure 2. Number of publications featuring ozone sensors. Source: Scopus. Data extracted on 12 March
                   2020. All documents containing ozone and sensor were considered in the query and these documents
                   were subdivided into the respective years.
Micromachines 2020, 11, 624 4 of 28
The present review covers select recent works in ozone sensor technology in the period between
2016 and 2020. The sensors are subdivided into ozone gas and dissolved ozone sensors.
2. Measurement Principles for Ozone Sensing
There are multiple measurement methods and sensing materials for sensor development.
The basic sensor structure and materials utilised for the sensor setup are shown in Figure 3. The most
important criterion for sensor development is the specific application with the corresponding
requirements, which determines the sensor principle and the materials employed. The principles and
materials are chosen to ensure the integration into medical and bioanalytical devices. In general,
the sensing material is applied on a substrate. For a metal-oxide sensor, the sensitive area is,
for example, based on an indium oxide thin film on a silicon substrate. In case of an amperometric
sensor, the electrodes are, for example, printed with gold and silver nanoparticle inks. Furthermore,
a membrane ensures selectivity; i.e., only substances that do not interfere with the desired measurement
can get in contact with the sensing material. For sensors that are in contact with human body liquids
and tissues, an encapsulation is needed to provide the sensors’ biocompatibility. It is essential that the
measurement principle is not affected by the encapsulation. The encapsulation acts like a membrane
and it is necessary to ensure that the substance intended for measurement can permeate through
the encapsulation.
Sensor setup
PTFE, PDMS, Nafion,
Membrane
Al2 O3 , ZrO2 , PVB, ...
Material selection
Sensing material for integration into
In2 O3 , ZnO, electrodes
(Au, Ag, Pt), WO3 , ... medical and
Substrate
bioanalytical devices
PET, glass, cork, Encapsulation
Kapton, PTFE, PEN, ...
PDMS, TiO2 , parylene,
ZrO2 , Al2 O3 , ...
Signal processing
Figure 3. Schematic of a basic sensor structure, which consists of a membrane, sensing material,
substrate, and encapsulation. The materials are employed in regard to integrate the sensor in medical
and bioanalytical devices.
In the present review, the measurement methods are divided in electrochemical, optical,
and volumetric. For electrochemical methods, amperometry and impedimetry are investigated.
For optical methods, optical absorption, photoluminescence, and colorimetry are examined.
Titration-based measurement methods are included in the category volumetric. In Table 1, an overview
of the different measurement methods is given. The most important parameter for medical applications
is the response time, as outlined in Section 1. A fast response time is highly significant because of
the half life of ozone in water, body liquids, and tissues. Amperometric sensors have a response time
between 15 s and 3 min. In contrast, the summarised impedimetric sensors provide a response time
between 4 s and 15.5 min. Impedimetric sensors, which are based on carbon nanotubes as sensing
material, have a high response time (15.5 min). Impedimetric metal-oxide sensors can only achieve a
fast response time with light activation or high measurement temperatures. With a light activation the
response time is in the range between 13 s and 12.9 min. Heated metal-oxide sensors can reach response
times between 4 s and 10 min. Optical absorption sensors support, in many cases, real-time response.
Reported photoluminescence sensors have response times between 10 and 20 min. The response time
for colorimetric measurement methods is 2.5 min and for titration-based methods it is not reported.Micromachines 2020, 11, 624 5 of 28
Table 1. Overview of the measurement methods for ozone sensing. Information about the ranges for several criteria, such as measurement temperature and response
time, for the different measurement methods is provided.
Measurement Method Sensing Unit Ozone (Dissolved/Gas) TMeasurement [◦ C] tResponse Range of Typical Wavelengths
electrodes gas –30 to 90 15 s to 3 min NA
amperometric
electrodes dissolved –5 to 50 15 s to 3 min NA
metal-oxide gas 0 to 350 4 s to 10 min NA
impedimetric metal-oxide gas 25 to 26 13 s to 12.9 min light activation a
nanotubes gas 25 to 75 15.5 min NA
optical photosensor gas TRoom real-time 190 to 800 nm
absorption photosensor dissolved 5 to 40 real-time 190 to 900 nm
photoluminescence photosensor gas 25 10 to 20 min 500 to 800 nm
colorimetric detection reagent and photosensor dissolved TRoom 2.5 min NR
titration titrant dissolved TRoom NR NA
a
NR: not reported; NA: not applicable. In case of an impedimetric metal-oxide sensor, the light activation of the sensor surface allows a significant reduction of the response time at low
measurement temperatures.Micromachines 2020, 11, 624 6 of 28
Amperometric and optical absorption methods can be applied for dissolved ozone and ozone
gas sensors. Impedimetric and photoluminescence methods can be employed for ozone gas sensors
and titration and colorimetric methods for dissolved ozone measurements. Gas sensors can also be
implemented for dissolved ozone measurement if a hydrophobic membrane is included. Furthermore,
the gas stripping method can be used as a preprocessing step to transfer the measurement of dissolved
ozone into a gas measurement.
2.1. Preprocessing Methods
2.1.1. Gas Stripping
During gas stripping, the measurement of dissolved ozone is transferred into a gas
measurement [22]. Therefore, ozone gas is separated from a liquid solution through mass transfer.
A gas stream is guided over a liquid stream. The mass transfer between the surrounding gas and liquid
solution depends on the relative concentration and the temperature of the liquid and is caused by the
concentration difference between the gas and liquid solution. Afterwards, the gas concentration is
measured by a gas sensor, for example, a photosensor or heated metal-oxide sensor, and the dissolved
concentration of the liquid solution is calculated accordingly [23]. Advantageous for measurement in
the gas phase compared to measurement of dissolved ozone is the absence of interference from particles
and organic substances [22,23]. Therefore, sensors with an included gas stripping preprocessing step
can also be used for non-pure water.
2.2. Electrochemical Measurement Methods
2.2.1. Amperometry
Amperometry is an electrochemical measurement method [24,25]. The basic sensor structure
is shown in Figure 4 and consists of a working, counter, and reference electrode, electrolyte,
and membrane. The sensor is surrounded by the measurement substance, which consists of a gas or
liquid solution. Furthermore, the sensor is encapsulated by the combination of membrane material
and the outer surface of the chamber around the electrolyte. A constant voltage between working
and reference electrode is applied over time. Ozone permeates through the membrane and leads to a
reduction reaction at the working electrode. The resulting current is measured at the working electrode.
From the measured current value, the concentration is calculated.
As described in Table 2, a key parameter for amperometric sensing is the sensing material or unit,
resulting in different measurement ranges, response times, and recovery times.
A
V
Counter electrode Working electrode
Electrolyte
Membrane
Reference electrode Measurement substance
(gas or liquid)
Figure 4. Schematic of an amperometric sensor. Between the working and reference electrode,
a constant voltage is applied. The current, measured at the working electrode, changes when ozone is
present in the measurement substance.Micromachines 2020, 11, 624 7 of 28
2.2.2. Impedimetry
Impedimetry, as amperometry, is an electrochemical measurement method [25]. Impedimetric
sensors, as shown in Figure 5, consist of sensing material, substrate, electrodes, and a heat or light
activation. They often include a heater which maintains a certain temperature of the sensing material.
There are also sensors without a heater, which have a light activation that enables room temperature
sensing. The light activation allows a decrease of the measurement temperature while maintaining a
fast response time [26]. The sensor is surrounded by the measurement substance, which consists of
gas. If a part of the electrodes that is not covered with the sensing material, can also get in contact with
the measurement substance, this part has to be coated with a dielectric material.
Impedimetric sensors include resistive sensors for direct currents and impedance sensors for
alternating currents. If the corresponding target substance is present, the value of the resistance
or impedance of the sensing material changes. This value is measured and the concentration is
calculated accordingly.
As reported in Table 2, key parameters for impedimetric sensing are the sensing material,
electrode material, measurement temperature or wavelength in case of light activation, resulting
in different measurement ranges, response times, and recovery times. For impedimetric sensors,
the measurement temperature corresponds to the temperature of the sensing material. At room
temperature TRoom , the sensing material is not heated and the temperature is the same as the
surrounding measurement substance.
Ω
Bottom view Side view Top view
Electrode
Heater
Substrate
Sensing
material
Measurement
substance
(gas)
(a) (b)
Figure 5. Schematic of an impedimetric sensor. (a) The bottom, side, and top views of the impedimetric
sensor. (b) An expanded view of the sensor. Resistance Ω of the sensing material changes when ozone
is present in the measurement substance.
2.3. Optical Measurement Methods
2.3.1. Optical Absorption
The operating principle of optical absorption sensors, shown in Figure 6, is based on measuring
the light absorption of a measurement substance sent out from a light source (for example light emitting
diodes (LEDs)) and received by a detector (for example photosensors). This allows the measurement
of characteristic absorption spectra for ozone gas or dissolved ozone. The absorption of ozone in the
measurement substance is measured and compared to the absorption without ozone. Thereby, it is
possible to calculate the concentration.
Key parameters are, as highlighted in Table 2, the sensing material or unit and measurement
wavelength, resulting in different measurement ranges, response times, and recovery times.Micromachines 2020, 11, 624 8 of 28
Light emitting diode
Measurement substance
(gas or liquid)
Photosensor
Figure 6. Schematic of an optical absorption sensor. The measurement method is based on measuring
the light absorption of the measurement substance that is sent out by emitting diodes and detected by
a photosensor.
Optical absorption sensors are mostly based on the Lambert-Beer law:
I(z) = I0 ∗ e–α∗z
Thereby, I0 represents the in-going and I(z) the out-going light, α the absorption coefficient and
z the length of the light path in the absorbing medium. The absorption coefficient depends on the
respective gas and the path length on the specific construction. Gengenbach and Sieber [27] present
design rules and outline the significant factors for optical absorption gas sensor design. To ensure
sensitivity, it is possible to either heat the absorption cell or increase the path length [27]. Furthermore,
the optical path can be increased by folding the path by means of multiple reflections in the measuring
chamber [27].
For optical absorption measurement of ozone, the most important variables are the absorption
peaks. Ozone has an absorption peak at 254 nm and a second smaller one at 603 nm [28]. As mentioned
in Section 1, an oxygen–ozone mixture is utilised for treatments with ozone. Therefore, the absorption
of oxygen is also important in order to avoid any interference. The absorption peaks for oxygen are at
150, 688, and 762 nm [29,30]. Due to the well separated absorption spectra of ozone and oxygen and a
respective selection of a suitable LED wavelength, interference of oxygen during ozone measurement
can be prevented.
2.3.2. Photoluminescence
Furthermore, there is the photoluminescence measurement method, based on optical methods,
which was reported by Ando et al. [31]. The method is characterised through materials that change
their optical properties, more specifically, the photoluminescence intensity, reversibly if ozone gas is
present. These materials are called photoluminescence quantum dots. Thin films of core shell quantum
dot particles are deposited on glass substrates and the photoluminescence intensity of the quantum
dots is measured to calculate the ozone concentration. Ando et al. [31] stated that quantum dots of
smaller size (and thus green-emitting) are more sensitive to ozone than quantum dots of larger size
(and thus red-emitting). The quantum dot luminescence is only quenched by absorbed ozone, but not
by pure oxygen, nitrogen, argon, and carbon dioxide. Thereby, selective measurement is enabled.
As described in Table 2, key parameters are the sensing material and measurement wavelength,
resulting in different measurement ranges, response times, and recovery times.
2.3.3. Colorimetry
Another optical measurement principle is the colorimetric measurement method. As the optical
absorption measurement principle, colorimetry is also based on the Lambert-Beer law, reported in
Section 2.3.1. Thereby, a detection reagent—such as N,N-diethyl-p-phenylenediamine (DPD) or
DPD with potassium iodide—is added to ozonated water [32], which leads to a colour change.
The absorption of the detection reagent in ozonated water is measured with the specific absorption
spectrum that depends on the detection reagent. Adding potassium iodide in excess causes a growth
of the sensor response [32].Micromachines 2020, 11, 624 9 of 28
As reported in Table 2, key parameters are the sensing material and wavelength of the photosensor,
resulting in different measurement ranges, response times, and recovery times. This measurement
principle cannot be applied for inline ozone measurements, but can for sensor calibration.
2.4. Volumetric Measurement Methods
2.4.1. Titration
The concentration is determined by the volume of the titrant, which is added to the measurement
substance until neutralisation occurs. Neutralisation means that the colour of the measurement
substance changes visibly from clear to yellow-brown [33]. The concentration is measured through the
volume of the titrant, for example, sodium thiosulfate, which is necessary for the neutralisation [33].
Key parameter is, as shown in Table 2, the titrant volume, represented by the category sensing
unit, resulting in different measurement ranges. This method cannot be utilised as inline measurement
principle. However, the method can be applied to calibrate ozone sensors.
2.5. Overview of the Key Parameters for the Ozone Measurement Methods
Table 2 shows an overview of the key parameters for amperometric, impedimetric, optical
absorption, photoluminescence, colorimetric, and titration-based measurement methods. The sensing
material or unit is a key parameter for all presented measurement methods, while the electrode
material and measurement temperature is only for impedimetry a key parameter. The wavelength is a
key parameter for impedimetry (in case of light activation), optical absorption, photoluminescence,
and colorimetric measurement methods. For all presented measurement methods (except
titration-based) the measurement range, response time, and recovery time are key parameters.
For titration-based measurement methods, only the sensing unit and measurement range are
key parameters.
Table 2. Overview of the key parameters for amperometric, impedimetric, optical absorption,
photoluminescence, colorimetric, and titration-based measurement methods.
Measurement Sensing Electrode Measurement
TMeasurement λ tResponse tRecovery
Method Material/Unit Material Range
amperometric X 7 7 7 X X X
impedimetric X X X X X X X
optical absorption X 7 7 X X X X
photoluminescence X 7 7 X X X X
colorimetric X 7 7 X X X X
titrtration X 7 7 7 X 7 7
In the following, sensor setups for the measurement of ozone in gases are described, followed by
dissolved ozone.
3. Sensors for Measurement of Ozone Concentration in Gases
Selected publications of the period 2016–2020 for amperometric, impedimetric, optical absorption,
and photoluminescence ozone gas sensors are listed in Table 3. Criteria distinguishing the
measurement methods of the sensors are: sensing material, substrate, electrode material, measurement
temperature, wavelength, measurement range, response time, recovery time, and commercial
availability. Furthermore, repeatability, short-term and long-term drift, life expectancy, and maximum
storage period are presented, if they are reported in the cited references. Additionally, influencing
measurement parameters such as humidity and flow rate are provided.Micromachines 2020, 11, 624 10 of 28
Table 3. A summary of important publications in the period between 2016 and 2020 focused on amperometric, impedimetric, optical absorption, and photoluminescence
ozone gas sensors. Information about highly significant criteria—such as sensing material, measurement temperature, and response time—is provided.
For impedimetric sensors, an entry of the wavelength shows that light activation of the sensor surface is present, which enhances the sensor response at low
temperatures. In cases of optical absorption and photoluminescence sensors, the wavelength is necessary for the optical measurement.
Measurement Sensing Substrate Electrode TMeasurement λ Measurement tResponse tRecovery Com. Year [Ref.]
Method Material Material [◦ C] [nm] Range [ppb]a (cOzone [ppb]) av.
WE: NR; RE: NR; CE: NR NR NA 20 - 20 to 250Micromachines 2020, 11, 624 11 of 28
Table 3. Cont.
Measurement Sensing Substrate Electrode TMeasurement λ Measurement tResponse tRecovery Com. Year [Ref.]
Method Material Material [◦ C] [nm] Range [ppb]a (cOzone [ppb]) av.
CH3 NH3 Pbl3–x Clx glass Pt TRoom - 5 to 2500 225 s (180) 40 to 60 s no 2018 [64]
TiO2 -In2 O3 Al Au 25 405 40 to 2000 40 s (2000) 280 s no 2018 [65]
V2 O5 /TiO2 SiO2 /Si Pt 300 - 90 to 1250 4.4 min (1250) 5 to 16 min no 2019 [66]
ZnO mod. Au BOPET Pt 26 370 30 to 570 13 s (30) 29 s no 2019 [26]
Ag-TiO2 glass Au TRoom UV, blue 100 NR NR no 2019 [67]
Zn0.95 Co0.05 O SiO2 /Si Pt 250 - 20 to 1040 40 s (260) 100 s no 2019 [68]
IGZO-dec. quartz ITO TRoom 254 NR NR NR no 2020 [69]
am.-Ga2 O3
rGO/WO3 quartz NR TRoom - 100 to 1000 NR NR no 2020 [70]
KI and α-CD glass NA 20 to 22 320 to 750 3 to 150 NR NR no 2017 [71]
optical ZnO or LiGaO2 NR NA NR 250 to 290 NR NR NR no 2017 [72]
absorption rGO/ZnO quartz NA TRoom 190 to 500 300 to 700 real-time real-time no 2018 [73]
methylene blue quartz NA 23 400 to 800 10 to 200 ppbv real-time real-time no 2019 [74]
photo- QD CdSe glass NA 25 500 to 800 100 to 5 × 10⁵ 10 to 20 min (NR) 1 day no 2016 [31]
luminescence
NR: not reported; NA: not applicable; a unless otherwise stated; BOPET: bi-axially oriented poly(ethylene terephthalate); NiPc: nickel phthalocyanine; CNT: carbon nanotubes;
mod.: modified by; IGZO: indium gallium zinc oxide; Ref.: references; NiAl-LDH: nickel aluminide layered double hydroxide; am.: amorphous; ITO: tin-doped indium oxide;
rGO: reduced graphene oxide; PANI: polyaniline nanostructures; KI: potassium iodide; dec.: decorated; dop.: doped with; func.: functionalised by; ODA: octadecylamine
groups; FR-4: glass-reinforced epoxy laminate material; QD CdSe: cadmium selenide based core-shell type quantum dots (CdSe/CdZnS, CdSe/ZnS, and CdSeTe/ZnS);
α-CD: α-cyclodextrin; APTMS: aminopropyl trimethoxysilane; PVA: polyvinyl alcohol; Com. av.: commercially available; WE: working electrode; RE: reference electrode; CE:
counter electrode.Micromachines 2020, 11, 624 12 of 28
3.1. Electrochemical Sensors
3.1.1. Amperometric Sensors
For amperometric sensors, gold, silver, and platinum electrodes are utilised for sensing.
Furthermore, polyethylene (PE), polyvinyl chloride (PVC), and polypropylene (PP) are commonly
encountered as substrates. The measurement temperature is in the area between –30 and 90 ◦ C.
Described measurement ranges are between 0.23 and 5 × 10⁴ parts per billion (ppb). The lowest
presented response and recovery time are 15 s and 180 s respectively. The majority of the presented
sensors are commercially available. The reported flow rates are in the range between 0.3 and
0.35 L min–1 and humidity is between 10 to 90% relative humidity. Stated values for the repeatability
are at zero ±7 ppb [35], at 40% of the range ±15% [35], for three independent sensor responses within
±1% of standard deviation [39], and ±0.4 ppb or 5% (the higher value of both) [41]. Short-term zero
drift below 5 ppb per 24 h [35], short-term span drift below 1% full scale per 24 h [35], long-term zero
drift below 10 ppb per month [35], long-term span drift below 2% full scale per month [35], and for
long-term testing the failure rate below 1.3 failures per million hours of operation [38] are reported.
Cited references in Table 3 present a life expectation of ten years [38], a life expectation of five to ten
years [41], and a maximum storage period of six months [42].
3.1.2. Impedimetric Sensors
The most common materials as sensing materials for impedimetric ozone gas sensors are zinc
oxide, indium oxide, tungsten trioxide, and carbon nanotubes. For the sensing layer morphology,
different nanostructures are utilised—such as nanocolumns [43], nanorods [26,45], platelets [46,48],
nanothin films [44,59,64,68–70], nanoparticles [51,54,58,60,66], nanoislands [52], nanosheets [61],
nanotubes [62,63], nanowires [66], and thick films [53]. As substrate, silicon dioxide/silicon, aluminium
oxide, glass, aluminium, and quartz and for electrodes platinum, gold, titanium, and copper
are commonly employed. The electrode thickness ranges between 100 [26,43,45,46,51,66,67] and
300 nm [61], while the distance between two opposing electrodes varies between 5 µm [64] and
50 mm [43,51,60]. The measurement temperature is between 0 and 350 ◦ C. Some of the sensors
utilise a light activation of the sensor surface that allows significant reduction of the response time
at low measurement temperatures, which can be derived from Table 3. The wavelength of the light
activation is mostly between 254 and 490 nm. Reported measurement ranges are between 0.5 and
1 × 10⁶ ppb. The lowest presented response and recovery time is 4 s respectively. The majority of the
presented sensors are not commercially available. The flow rates are between 0.1 and 1 L min–1 and
the reported humidity is in the range between 5 to 95% relative humidity. Investigated values for the
repeatability range from 0.5 to 5.7 at 100 ppb per sensor minute value [47], show a correlation that
is better than 0.7 [55], and is for sensor responses between ±10% of standard deviation [62]. For the
short-term drift over three days, values between 2 and 4.7 ppb are reported [47].
Korotcenkov et al. [75] investigated the materials indium oxide and tin dioxide and the overall
structural parameters that are essential for impedimetric ozone gas sensors. The authors state that the
response time at 200 ◦ C for a thin film thickness of 60 to 80 nm does not go beyond the value of 1 or 2 s.
In general, the authors report that the amplitude of the sensor response is greater with a smaller film
thickness and crystallize size and larger pore size.
An essential advantage of impedimetric ozone sensors is their high selectivity regarding ozone.
In general, there are no membranes utilised to filter substances that do interfere with the desired
measurement. Korotcenkov et al. [75] report on several significant factors that are necessary to achieve
a high selectivity and sensitivity, such as:
• Compared to tin dioxide ozone sensors, indium oxide shows better results regarding ozone
selectivity [76];
• Analysation of the sensor response by utilising a sensor array instead of a single sensor [77];
• Improvement of selectivity through surface modification or bulk doping [78].Micromachines 2020, 11, 624 13 of 28
3.2. Optical Sensors
3.2.1. Optical Absorption Sensors
For optical absorption, sensing materials such as zinc oxide or methylene blue are applied on
glass or quartz substrates. The measurement temperature complies with the room temperature.
The wavelength of the sensors is between 190 and 800 nm. The measurement range of the presented
sensors is between 3 and 700 ppb. Optical absorption sensors support mostly real-time sensing.
Presented sensors are not commercially available. The flow rates are in the range between 0.05 and
2 L min–1 and humidity is between 50% and 90% relative humidity.
3.2.2. Photoluminescence Sensors
For photoluminescence sensors, cadmium selenide-based core-shell type quantum dots can be
employed as sensing material on glass substrates [31]. Measurement temperature is about 25 ◦ C,
the wavelength between 500 and 800 nm, and the measurement range between 100 and 5 × 10⁵ ppb.
Furthermore, the response time is in the range between 10 to 20 min and the recovery time is one day.
The reported sensor is not commercially available. The reported flow rate is 0.1 L min–1 , while the
relative humidity is not provided.
4. Sensors for Measurement of Dissolved Ozone Concentration
Table 4 provides information about selected recent works in the period between 2016 and 2020
for dissolved ozone sensors. The measurement methods range from amperometric and optical
absorption to methods that are based on colour changes, such as colorimetric and titration-based
methods. Thereby, the sensors are distinguished by the sensing unit or material, measurement
temperature, wavelength, measurement range, response time, recovery time, and commercial
availability. In addition, repeatability and zero drift are reported, if they are presented in the cited
references. Furthermore, the flow rate is provided.Micromachines 2020, 11, 624 14 of 28
Table 4. An overview of dissolved ozone sensors in the period between 2016 and 2020. Highly significant criteria—such as sensing unit, measurement temperature,
and response time—are provided.
Measurement Sensing Unit/ TMeasurement λ Measurement tResponse tRecovery Commercially Year [Ref.]
Method Sensing Material [◦ C] [nm] Range Available
WE: BDD; RE: Pt; CE: Pt 25 - 0.185 to 740 μM NR NR no 2017 [79,80]
WE: Au; RE: Au; CE: NR 26.4 - 0 to 5 mg L–1 NR 1s yes 2020 [32,81]
WE: Au; RE: NR; CE: NR 26.4 - 0 to 3 mg L–1 30 s 1s yes 2020 [32,82]
WE: NR; RE: NR; CE: NR 0 to 45 - 0.05 to 20 mg L–1 15 s NR yes 2020 [83]
amperometric WE: Au; RE: NR; CE: Ag 0 to 45 - 0 to 20 mg L–1 50 s NR yes 2020 [84]
WE: NR; RE: NR; CE: NR 0 to 50 - 0 to 200 ppb 60 s NR yes 2020 [85]
WE: Au; RE: Ag; CE: Ag –5 to 50 - 0 to 10 ppm 90 s NR yes 2020 [86]
WE: NR; RE: NR; CE: NR 5 to 50 - 0 to 5 mg L–1 30 s NR yes 2020 [87]
WE: NR; RE: NR; CE: NR 0 to 40 - 0 to 5 mg L–1 3 min NR yes 2020 [88]
photometer 25 190 to 900 0.05 to 9 mg L–1 real-time real-time yes 2016 [89]
fluorometer 15 excitation: 213 to 335 0 to 5 mg L–1 real-time real-time yes 2017 [90]
optical emission: 310 to 450
absorption photometer 5 to 40 NR 0 to 150 mg L–1 2s NR yes 2020 [91]
photometer (preprocessing: NR 254 0 to 890 ppb 10 s NR no 2016 [23]
gas stripping)
photometer (preprocessing: 26.4 254 0 to 100 mg L–1 20 s 10 s yes 2020 [22,32]
gas stripping)
colorimetric DPD or DPD with KI 26.4 NR 0 to 5 mg L–1 2.5 min NR yes 2020 [32]
titration Na2 S2 O3 TRoom - 30 to 192 ppm NR NR no 2019 [33]
NR: not reported; WE: working electrode; RE: reference electrode; CE: counter electrode; BDD: boron-doped diamond electrode; DPD: N,N-diethyl-p-phenylenediamine; KI:
potassium iodide.Micromachines 2020, 11, 624 15 of 28
4.1. Electrochemical Sensors
4.1.1. Amperometric Sensors
Reported amperometric sensors utilise gold, silver, platinum, and boron-doped diamond
electrodes for sensing. Furthermore, measurement temperatures are between –5 and 50 ◦ C and
measurement ranges between 0.05 and 20 mg L–1 . For response and recovery times, the lowest
presented values are 15 s and 1 s respectively. Most of the reported sensors are commercially
available. The flow rate ranges between 3.8 and 30 L h–1 . Values for the repeatability are ±2%
at a constant measurement temperature [82], below 1% repeatability and –1% stability per month
without calibration [84], and 0.3% of the selected range or 0.01 parts per million (ppm) (the higher
value of both) [85]. The reported zero drift is below 0.01 ppm per month [85].
In general, amperometric sensors include a membrane that filters other interfering substances.
In case of ozonated water, oxygen needs to be filtered, as it is also an oxidizing substance that reacts
at the working electrode. The main issue of membranes is that ozone needs to diffuse trough the
membrane which increases the sensor’s response time. There are different possibilities for materials
that can be utilised as a membrane which results in various ozone transfer rates and thereby response
times. Jahnknecht et al. [92] report about ozone transfer rates for different membrane materials.
The results are:
• For ceramic membranes made of aluminium oxide a transfer rate of 0.35 g m–2 h;
• For zirconium oxide 10 g m–2 h;
• For porous polytetrafluoroethylene (PTFE) 4 g m–2 h.
Zoumpouli et al. [93] stated that polydimethylsiloxane (PDMS), PTFE, and polyvinylidene
difluoride (PVDF) have ozone mass transfer coefficients that are in the same order of magnitude.
Furthermore, the authors suggest that an issue for other membranes, such as polyethersulfone (PES)
and polyetherimide (PEI), is that they react with ozone, which leads to the decomposition of the
membrane. Shanbhag et al. [94] point out that the permeability of ozone through PDMS is four times
higher than the permeability of oxygen. Zhang et al. [95] compare the permeability of several gases
through PDMS. The authors report that the permeability of oxygen is approximately twice as great
as that of nitrogen. More details about the permeability of the PDMS membrane as a function of
significant factors, such as thickness and area of the membrane, are also reported by Zhang et al. [95].
Investigated PDMS membranes by Shangbhag et al. [94] vary between 165 and 419 µm thickness and a
permeation area between 6900 and 29900 mm2 .
Ishii et al. [80] and Einaga et al. [79] also report about membrane-free amperometric sensors with
boron-doped diamond (BDD) material as the working electrode. The BDD film is deposited on silicon
wafers and tungsten needles to fabricate microelectrodes, whereby the needles have a diameter of
20 µm [80]. BDD working electrodes are insensitive for reduction reactions with oxygen [80]. Therefore,
selectivity can be achieved without using a membrane. For the counter electrode, platinum, and for the
reference electrode, silver/silver chloride, were utilised. Thereby, neither electrolyte nor diaphragm is
necessary because of the low background current, which decreases the voltage drop.
4.2. Optical Sensors
4.2.1. Optical Absorption Sensors
For optical absorption sensors, photometers and fluorometers are utilised as sensing unit for
dissolved ozone sensors. In general, the measurement temperature is between 5 and 40 ◦ C. Applied
wavelengths for the photometer are between 190 and 900 nm. For the fluorometer, the excitation
spectra are between 213 and 335 nm and the emission spectra between 310 and 450 nm. Resulting
measurement ranges are between 0.05 and 150 mg L–1 . For optical absorption sensors, mostly real-time
measurement is supported. Presented sensors are commercially available. Reported flow rates are up
to 150 std L min–1 [91].Micromachines 2020, 11, 624 16 of 28
The most significant factors for measuring the ozone concentration with optical absorption
methods are the absorption peaks. There are several options to utilise the peaks for measurement.
Levine et al. [96] measure the ozone concentration in ozonated water with yellow and blue LEDs.
These had wavelengths of approximately 584 (yellow) and 300 nm (blue), thereby taking into account
that the LEDs bandwidths matching the ozone absorption peaks.
Furthermore, it is possible to measure the ozone concentration in blood plasma by using markers.
Paolo et al. [11] suggest the utilisation of total antioxidant status (TAS), protein thiol groups (PTG),
or thiobarbituric acid reactants (TBAR). Only the marker TAS can be measured directly with optical
absorption methods and a photometer. The other two markers can be measured by colorimetric
measurement methods and are explained in Section 4.2.3. With increasing ozone concentration in
blood plasma, the TAS concentration decreases. Paolo et al. [11] investigated the optical absorption
measurement of TAS at 600 nm.
4.2.2. Optical Absorption with Gas Stripping Preprocessing Step
During the gas stripping process, ozone gas is separated from the liquid stream. Afterwards,
the ozone gas concentration is determined. For the reported sensors, a photometer is applied as sensing
unit to measure the ozone gas concentration. Alternatively, a heated metal-oxide sensor or other ozone
gas sensor can be applied. The measurement temperature is 26.4 ◦ C. For the utilisation of a photometer,
the applied wavelength is 254 nm. Described measurement ranges are up to 100 mg L–1 and the lowest
presented response and recovery times are 10 s respectively. Reported flow rates are approximately
0.3 L min–1 . Reproducibility of these sensors is stated with 0.05 ppm or 1% of the reading (the higher
value of both), while the zero drift is below 0.05 ppm per month [22].
4.2.3. Colorimetric Sensors
The investigated colorimetric sensors are based on DPD or DPD and potassium iodide as the
sensing unit for the detection reagent. The measurement temperature is 26.4 ◦ C. Measurement ranges
are ensured up to 5 mg L–1 . The response time is about 2.5 min and the recovery time is not reported.
The presented sensor is commercially available as a sensor unit.
As mentioned in Section 4.2.1, Paolo et al. [11] suggested the utilisation of makers to determine the
ozone concentration in blood plasma. While only one of the markers can be determined directly with
optical absorption methods, all of them, TAS, PTG, and TBAR, are measurable through colorimetric
methods. With increasing ozone concentration in blood plasma, the TAS and PTG concentration
decreases and TBAR increases. For colorimetric measurement, a detection reagent is added to the
solution. After reaction of the ozone and blood plasma with the detection reagent, the marker
concentration is measured quantitatively by observing the visible colour change with a photometer.
Paolo et al. [11] investigate colorimetric measurement of the PTG concentration at 412 nm. Furthermore,
Erel [97] reports colorimetric measurement of TAS at 660 nm. In addition, Kampa et al. [98] present
colorimetric measurement of the TAS concentration at 450 nm.
4.3. Volumetric Sensors
4.3.1. Titration-Based Sensors
For titration-based sensors, one applicable titrant is sodium thiosulfate as the sensing reagent.
As reported in Section 2.4.1, the concentration is determined through the volume of titrant that is
added to the measurement substance until neutralisation, which is indicated by a colour change.
The measurement temperature complies with the room temperature, while measurement ranges
between 30 and 192 ppm are stated. Response and recovery times are not reported. Presented sensors
are not commercially available as complete sensor units.Micromachines 2020, 11, 624 17 of 28
5. Fabrication Methods
Currently, the ozone sensors reported in Sections 3 and 4 are manufactured by conventional
fabrication methods, as presented in Table 5. The corresponding fabrication method and maximum
process temperature are provided. The maximum process temperature is highly significant, because it
restricts the utilisation of flexible substrates, as these can be damaged by high temperatures.
Illustrations of typical fabrication methods are shown in Figure 7. Figure 7a–e shows conventional
manufacturing methods of ozone sensors and Figure 7f a schematic of the inkjet-printing process.
(a) (b)
Squeegee UV light Mask
Mesh Frame
(c) (d)
Gas input
Solution Spray nozzle
Nozzle
(e) (f)
Figure 7. Schematic of typical fabrication methods for ozone sensors. The substrate is shown in blue
and the applied ink or thin film material in red. (a) The spin-coating process. (b) A schematic of
dip-coating/immersion. (c) The screen-printing process. (d) The UV photolithography process. (e) The
spray-coating/spray pyrolysis process. (f) The inkjet-printing process.
Guth et al. [99] outline that for pH sensors—which have so far mainly been fabricated by precision
engineering—thick film, thin film, and printing technologies on rigid planar substrates are technology
routes for miniaturisation. These fabrication methods are also applied for the ozone sensors reported in
Sections 3 and 4 and summarised in Table 5. They are suitable for fabricating miniaturised structures,
at elevated temperatures, however, on rigid substrates, such as aluminium oxide or silicon wafers.
Sensing structure definition in these processes relies on masks, stencils, or lithography processes
which require substrate planarity. Integration of a sensing element into a medical or bioanalytical
device is an important requirement for increased application of ozone therapy, as outlined in Section 2.
As this might require conformality to the instrument shape, the above fabrication technologies are
not applicable.Micromachines 2020, 11, 624 18 of 28
Table 5. Overview of fabrication methods for ozone sensors. Information about the measurement method, sensing material, fabrication method, and maximum
process temperature is provided.
Measurement Method Sensing Material Fabrication Method TProcess,max [◦ C] Year [Ref.]
WE: NR; RE: NR; CE: NR screen-printing NR 2017 [37,38]
amperometric (gas)
KI-PANI electropolymerisation 100 2017 [39]
amperometric (dissolved) WE: BDD; RE: Pt; CE: Pt MPCVD NR 2017 [79,80]
ZnO microwave-assisted hydrothermal synthesis 120 2016 [43]
Cox Zn1–x O polymeric precursor spin-coating 500 2016 [44]
ZnO mod. NiPc hydrothermal synthesis and dipping 95 2016 [45]
NiCo2 O4 urea-assisted chemical co-precipitation [100] 450 2016 [46]
NiAl-LDH hydrothermal synthesis and dip-coating 100 2017 [48]
ZnOS nO2 hydrothermal synthesis 200 2017 [51]
Au and Ag immersion, dipping, or spin-coating 160 2017 [52]
In2 O3 dop. WO3 screen-printing 600 2017 [53]
ZnO magnetron sputtering and spin-coating 80 2017 [54]
WO3 liquid precursor flame spraying 200 2017 [58]
am.-IGZO RF sputtering 100 2018 [59]
impedimetric (gas) CuWO4 sono-chemical route 500 2018 [60]
ZnO electron beam evaporation and hydrothermal synthesis 100 2018 [61]
CNT func. ODA spray-coating and screen-printing 100 2018 [62]
CNT spray-coating NR 2018 [63]
CH3 NH3 Pbl3–x Clx spin-coating 100 2018 [64]
TiO2 -In2 O3 dip-coating 400 2018 [65]
V2 O5 /TiO2 hydrothermal synthesis 500 2019 [66]
ZnO mod. Au photolithography, hydrothermal synthesis, and thermal evaporation (gold deposition in vacuum) 95 2019 [26]
Zn0.95 Co0.05 O spray pyrolysis 300 2019 [68]
IGZO-dec. UV photolithography and TRoom 2020 [69]
am.-Ga2 O3 RF magnetron sputtering
rGo/WO3 hydrothermal synthesis and dip-coating 180 2020 [70]
KI and α-CD immersion NR 2017 [71]
rGO/ZnO ultra-sonic assisted solution process and immersion 400 2018 [73]
optical absorption (gas)
methylene blue dip-coating 450 2019 [74]
Ag-TiO2 RF magnetron sputtering 250 2019 [67]
photoluminescence (gas) QD CdSe cast deposition NR 2016 [31]
Ref.: references; NR: not reported; mod.: modified by; NiPc: nickel phthalocyanine; NiAl-LDH: nickel aluminide layered double hydroxide; dop.: doped with; PANI:
polyaniline nanostructures; KI: potassium iodide; am.: amorphous; CNT: carbon nanotubes; IGZO: indium gallium zinc oxide; rGO: reduced graphene oxide; dec.: decorated;
RF: radio frequency; func.: functionalised by; ODA: octadecylamine groups; QD CdSe: cadmium selenide based core-shell type quantum dots (CdSe/CdZnS, CdSe/ZnS,
and CdSeTe/ZnS); α-CD: α-cyclodextrin; MPCVD: microwave plasma-assisted chemical vapour deposition process; WE: working electrode; RE: reference electrode; CE:
counter electrode; BDD: boron-doped diamond electrode.Micromachines 2020, 11, 624 19 of 28
Inkjet-printing, however, is a promising technology to fabricate miniaturised, conformal,
and disposable sensors that can be integrated in medical and bioanalytical devices [101]. Inkjet-printing
allows deposition of novel nanomaterials down to 50 µm structural resolution or below on polymer
substrates. In order to exploit these benefits, materials (ink and substrate), printed structure design,
printing process, printing system, and postprocessing must be carefully matched. For polymer
substrates with low thermal stability, low temperature postprocessing routes, such as photonic
sintering, have to be favoured. Gengenbach et al. [102] present a method for systematic development
and verification of inkjet-printed multi-layer electronic circuits that are manufactured by applying
a fully automated workflow from design to final printed system. In case flexibility of the printed
structure is demanded by the application, adhesion between printed layer and substrate and layer
morphology must be optimised [103].
In the following, inkjet-printed approaches for other electronic components that might be
transferable to ozone sensors are reported. Thereby, the inkjet-printing technologies and methods are
adaptable to realise an inkjet-printed ozone sensor. To the best of our knowledge, there are currently no
inkjet-printed ozone sensors. So far, inkjet-printed ozone sensors have not been fabricated, because for
the applications of the ozone sensors presented in this review, flexible substrates and conformal sensors
are not necessary. In addition, the sensors can be fabricated in large quantities utilising established
thick film and thin film processes. Inkjet-printing is promising for exploring new medical sensor
applications, which are discussed in Section 1. For that purpose, fabrication of conformal medical
sensors on flexible substrates is absolutely fundamental.
The ozone sensors presented in Sections 3 and 4 are based on amperometric, impedimetric, optical
absorption, photoluminescence, colorimetric, and titration-based measurement methods. Furthermore,
gas stripping can be used as a preprocessing step.
Current approaches for inkjet-printed amperometric membrane-based oxygen or pH sensors
can be modified, for example, through employing a membrane, and afterwards transferred for the
utilisation as ozone sensor. They consist, for example, of inkjet-printed gold electrode arrays or
working and counter electrodes made of gold nanoparticle ink and reference electrodes based on silver
nanoparticle ink. Hu et al. [24] report an oxygen gas sensor based on gold electrode arrays that are
inkjet-printed on a porous cellulose membrane. Furthermore, Xu et al. [104] present an inkjet-printed
dissolved oxygen and pH sensor on a Kapton film, consisting of a three-electrode system. Another
approach for an inkjet-printed dissolved oxygen sensor, investigated by Moya et al. [105], composes
printed electrodes on a paper-based substrate (thickness: 65 μm and porosity: 80%). In addition,
Moya et al. [106] report a stable fully inkjet-printed solid-state silver/silver chloride reference electrode,
printed with four different materials—silver, SU-8, sodium hypochlorite, and polyvinyl butyral—on a
polyethylene terephthalate (PET) substrate. In Section 4.1.1, PDMS is suggested as membrane material.
Wu et al. [107] conceptualise inkjet-printed silver nanoparticles as microelectrodes on PDMS for
microfluidic sensing. As outlined in Section 4.1.1, membrane-free approaches for amperometric sensors
can be implemented with BDD working electrodes. Therefore, an impedimetric gas sensor, proposed
by Laposa et al. [108], might be transferred. The authors report a sensor based on nanodiamond
powder ink using the microwave linear antenna plasma enhanced chemical vapour deposition
(MW-LA-PECVD) method for diamond growth. The sensor is fabricated by combining inkjet-printing,
which was utilised for selective deposition of the ink on the electrodes, and the MW-LA-PECVD process.
However, further research is still necessary to enable the boron-doping of the nanodiamond structure.
There are several approaches for inkjet-printed metal-oxide nanomaterials that can be adapted as
impedimetric ozone sensors. Rieu et al. [109] and Kassem et al. [110] investigated inkjet-printed
gas sensors, made of tin dioxide. Thereby, Rieu et al. [109] provided a fully inkjet-printed gas
sensor on a polymer substrate to measure the carbon monoxide and nitrogen dioxide concentration.
Furthermore, Kassem et al. [110] present a carbon monoxide gas sensor on polyimide foil that is
sintered at 350 ◦ C. In addition, Spinella et al. [111] conceptualised zinc-oxide-stacked multilayer gas
sensors. Other approaches with inkjet-printed indium oxide semiconductor layers were describedMicromachines 2020, 11, 624 20 of 28
by Leppäniemi et al. [112], Hassan et al. [113], and Hong et al. [114]. Thereby, Leppäniemi et al. [112]
optimised the inkjet-printing process of precursor solutions with indium oxide for thin film transistors,
which are annealed at low temperatures (150 to 200 ◦ C) and with application of UV exposure (160 nm).
Furthermore, Hassan et al. [113] proposed the fabrication of a thin film transistor, also based on indium
oxide nanoparticle ink, using laser ablation and inkjet-printing. Through laser ablation, the conductive
ink channel resolution is improved, which results in smaller channel length. Hong et al. [114]
investigated the humidity-sensing performance of a field effect transistor. The approaches for
inkjet-printed metal-oxide precursor solution can be adapted for an inkjet-printed impedimetric
ozone sensor. Another option for impedimetric ozone sensors is the carbon nanotube. Kim et al. [115]
presented inkjet-printed single-walled carbon nanotubes (SWCNT) for thin film transistors.
Optical absorption sensors are based on the combination of light activation and photosensors.
Tran et al. [116] investigated an all-inkjet-printed zinc oxide photosensor on Kapton substrate utilised
as a wearable sensor at 370 nm with a response time of 0.3 s. Kaufhold et al. [117] reported an
all-inkjet-printed photosensor that is based on silver electrode material and zinc oxide semiconductor
material. The wavelength of the sensor is in the range between 310 and 395 nm, and the sensor is
printed on a flexible polymer substrate. Furthermore, Nahlik et al. [118] presented an inkjet-printed
photosensor based on zinc oxide and diamond precursor ink with the highest photoresponsivity at
365 nm. The authors state that the response time for a zinc oxide nanodiamond sensor is more than
ten times higher than for a zinc oxide single-layered photosensor [118]. This supports the findings of
Korotcenkov et al. [75], also reported in Section 3.1.2, which state that a sensor response optimisation
can be achieved by adapting the sensing layer morphology. Another photosensor, published by
Figueira et al. [119], comprises a fully printed photosensor with peak sensitivity at 302 nm on a cork
sheet using zinc oxide/ethylcellulose ink. Additional inkjet-printed photosensors are described in a
review by Zhan et al. [120]. Furthermore, the authors summarised in the review inkjet-printed LEDs
and thus show possible solutions for optical absorption sensors.
For inkjet-printing of photoluminescence quantum dots, Han et al. [121] synthesised
water-dispersible quantum dots and applied them to manufacture inkjet-printed photoluminescence
images that can be read under UV light. Furthermore, the process was optimised by Pan et al. [122].
The authors inhibited the coffee-ring effect through employment of ethylene glycol with a high boiling
point as solvent to disperse the quantum dots.
As colorimetric and titration-based sensors are not capable of inline measurements, the present
review did not include inkjet-printed sensor approaches. However, in case of a colorimetric sensor,
a detection reagent solved in the measurement substance can be measured with an optical absorption
sensor. Thus, an inkjet-printed colorimetric sensor approach might be combined with a detection
reagent that is applied through inkjet-printing, and an inkjet-printed optical absorption sensor.
Inkjet-printing approaches with a gas stripping preprocessing step can be combined through a
device that separates the ozone gas from the liquid stream and an inkjet-printed gas sensor—such as
amperometric, impedimetric, or optical absorption gas sensors.
6. Conclusions and Future Perspectives
In the present review, we have given an overview of selected recent developments in ozone sensor
technology (2016–2020). Thereby, the reviews of David et al. [123,124] in 2015 about ozone gas sensors
based on optical methods and Moya et al. [125] about inkjet-printed electrochemical sensors between
2015 and 2017 are supplemented and updated.
The focus in the present review is on gas and dissolved ozone sensors based on amperometric,
impedimetric, and optical measurement methods. For the utilisation as a medical sensor, several
requirements that depend on the specific applications are highly significant—such as measurement
temperature, light activation, and response time. For example, sensors with high measurement
temperatures and response times are often unsuitable for medical applications because they are
in direct contact with body liquids and tissues, and the actual treatment can sometimes take onlyYou can also read