Got Mylk? The Emerging Role of Australian Plant-Based Milk Alternatives as A Cow's Milk Substitute - MDPI
←
→
Page content transcription
If your browser does not render page correctly, please read the page content below
nutrients
Article
Got Mylk? The Emerging Role of Australian
Plant-Based Milk Alternatives as A Cow’s
Milk Substitute
Yianna Y. Zhang 1,2 , Jaimee Hughes 3              and Sara Grafenauer 3,4, *
 1   School of Agriculture and Food, Faculty of Veterinary and Agricultural Sciences,
     The University of Melbourne, Parkville, VIC 3052, Australia; yianna.zhang@csiro.au
 2   CSIRO Agriculture & Food, 671 Sneydes Road, Werribee, VIC 3030, Australia
 3   Grains & Legumes Nutrition Council, Mount Street, North Sydney, NSW 2060, Australia;
     j.hughes@glnc.org.au
 4   School of Medicine, University of Wollongong, Northfields Avenue, Wollongong, NSW 2522, Australia
 *   Correspondence: sarag@glnc.org.au; Tel.: +61-2-9394-8662

 Received: 18 March 2020; Accepted: 26 April 2020; Published: 28 April 2020

 Abstract: Growing ethical, environmental and health concerns have encouraged demand for novel
 plant-based milk alternatives, yet it remains nebulous whether these products are nutritionally
 adequate as cow’s milk replacements. The aim of this study was to conduct a cross-sectional survey
 of plant-based milk alternatives available in major Australian supermarkets and selected niche food
 retailers from November 2019 to January 2020 and assess two dietary scenarios (adolescents and
 older women) where dairy serves were substituted for plant-based alternatives against Australian
 Estimated Average Requirements (EAR). We collected compositional data from nutrition panels in
 juxtaposition with derivatives from the Australian Food Composition database, with a total of 115
 products, including tree nuts and seeds (n = 48), legumes (n = 27), coconut (n = 10), grains (n = 19)
 and mixed sources (n = 10). Just over 50% of products were fortified, but only 1/3 contained similar
 calcium content to cow’s milk. Indiscriminate substitutions might reduce intakes of protein and
 micronutrients, particularly vitamin A, B2, B12, iodine and zinc, and lead to reductions >50% of the
 EARs for protein, zinc and calcium in the chosen dietary scenarios. To avoid unintended dietary
 outcomes, it is vital that consumers make pragmatic decisions regarding dietary replacements for
 cow’s milk.

 Keywords: plant-based alternatives; milk; milk alternatives; nutrient composition; vegetarian;
 fortification

1. Introduction
     The consumption of cow’s milk can be traced back to the 7th century BC, with a definitive role in
food production and cultures worldwide [1,2]. Against a backdrop of ethical, environmental and health
concerns, there has been a surge of consumer interest in milk alternative beverages (also termed ‘mylk’),
derived from aqueous extracts of plant ingredients, including nuts, legumes and grains [3]. Australia is
witnessing significant growth in the plant-based milk alternatives market, with products accounting for
~7% of all milk consumed and estimated value of $230 million [4]. By virtue of their positive perception
and high sensory acceptance [5,6], plant-based milk alternatives broaden avenues for serving the needs
of diverse populations that harbour concerns associated with dairy. Its consumption coheres with the
growing prevalence of health conditions, including milk protein allergy and lactose intolerance [7,8],
consumer demand for vegan/vegetarian foods [9,10] and concerns with animal welfare [11]. Moreover,
the resource and waste-intensive nature of industrial dairy production are indisputable [12,13], leading

Nutrients 2020, 12, 1254; doi:10.3390/nu12051254                                www.mdpi.com/journal/nutrients
Nutrients 2020, 12, 1254                                                                             2 of 18

many consumers to perceive plant-based milk alternatives as being expedient over cow’s milk in
environmental sustainability [14,15]. There have been multiple comparative life cycle assessments
(LCAs) suggesting substantially fewer greenhouse gas emissions, eutrophication, water and land use
during production [16–18], although some plant-based milks can have a higher ecological impact based
on per kg of protein produced (e.g. almond [17]).
     Besides environmental quandaries, nutritional adequacy is also an important dimension of
sustainable diets worldwide [19,20]. Cow’s milk is an economical yet nutrient-dense source of
energy, containing highly bioavailable proteins with essential vitamins and minerals, as well as
bioactive compounds, such as peptides and lipids [21]. An irrefutable diet staple, the average
Australian reportedly consumes approximately 100 litres annually, constituting 62% of the total dairy
intake [22,23]. The latest representative Australian nutrition survey (National Nutrition and Physical
Activity Survey, 2011−12) demonstrated that milk ingestion constituted for ~20% of total calcium,
8.7% of phosphorous, 17.3% of iodine, 5.2% of vitamin A, 4.6% of B6 and 17.5% of B12 intake in
the general population [24], a finding also replicated in a Canadian cohort [25]. Observational and
dietary modelling studies have shown cow’s milk consumption to be a reliable indicator of dietary
quality across multiple age groups, with consumers more likely to meet their requirements of protein,
essential minerals and vitamins A, B2, B6 and B12 [26–31]. An ideal alternative would provide
comparable levels of these nutrients, without the need to elicit major changes in dietary patterns to
meet requirements. However, there appears to be a general consumer mistrust of the food supply [32]
and public misconceptions over plant-based beverages and their nutrition credentials as ‘healthier’
alternatives [4].
     Cow’s milk is commonly featured in dietary guidelines as a multifaceted contributor to nutrients,
promoting bone health (e.g. in the USA [33] and Canada [25]). It offers a valuable supply of highly
metabolisable calcium, protein and zinc, which are synergistic contributors to bone tissue and collagen
synthesis [34,35]. The physiological requirements for these nutrients are at a pinnacle during critical
stages of life. This includes children and adolescents, where 40% of an individual’s total bone mass
begins to progressively accrue until peak mass is reached later in life [36]. Another is the expanding
aging population, where diminishing bone density becomes common in individuals reaching 40,
leading to elevated risks of osteoporosis and subsequent fractures [37,38]. Menopausal women, in
particular, experience hormone-related changes that accelerate bone loss, such as in estrogen and
Follicle Stimulating Hormone [39,40]. Eschewing cow’s milk for alternative plant-based sources are
thus particularly relevant for these age groups to help ensure sufficient nutrient intakes. However,
current Food Standards Australia and New Zealand (FSANZ) legislations only require a mandatory
advisory warning on plant-based beverages as a milk substitution for children aged 5 and under [41].
     Despite possessing functional properties in their own right, the composition inventories in the
scientific literature highlight the inadequacies of unfortified plant-based milk alternatives in comparison
to cow’s milk [42–45]. Milk alternatives occupy compositional flexibility, the formulation of which are
governed under legislations distinct to cow’s milk [46,47]. Food legislations possess a country-level
dependence, indicating that data generalisation across geographical locations may not be prudent,
with differences in the ingredients and fortificants permitted. Little has been reported in relation to the
state of Australian products, despite FSANZ making further approvals for voluntary fortification in
plant-based milks in recent years [48]. The market availability of food products is a compelling driver
underpinning consumer access and consumption [49,50]. Beyond a direct beverage, cow’s milk is an
important culinary constituent, with 14% of its total ingestion in Australia originating from café style
coffee [24]. The juxtaposition of these factors necessitates an evaluation of products available from
supermarkets, cafés and health food stores.
     The aim of this study was to conduct a cross-sectional survey of plant-based milk alternatives
available in Australian major supermarkets and selected niche food retailers (café’s and health food
stores) from November 2019 to January 2020, collecting compositional data from nutrition panels
in comparison to cow’s milk. This study helped to identify potential nutritional ramifications of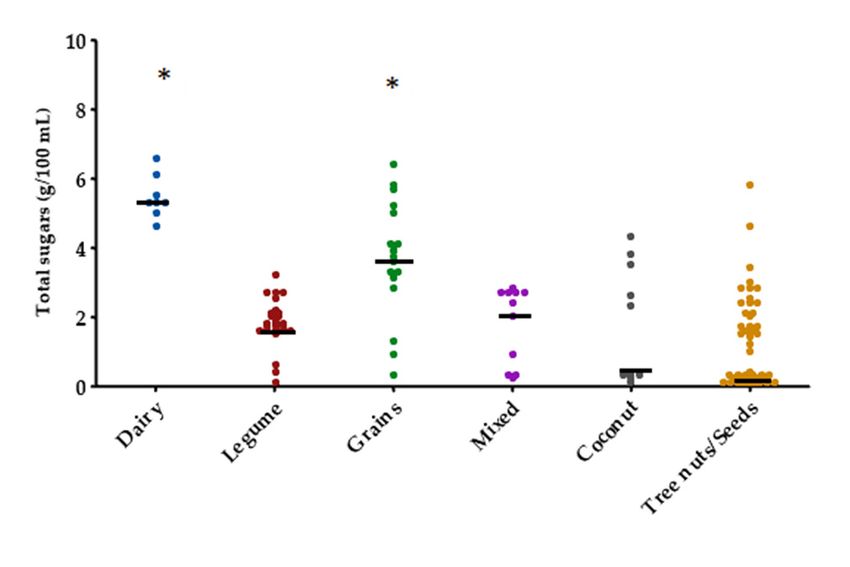
Nutrients 2020, 12, 1254                                                                            3 of 18

replacing cow’s milk with plant-based milk alternatives through dietary modelling in adolescents
(aged 12–18 years of age) and older women (aged 51+ years), in line with the Nutrient Reference
Values [51]. Strategies to mitigate the nutritional gaps identified during our analyses were discussed
with reference to some health-promoting constituents of cow’s milk.

2. Materials and Methods
      A cross-sectional survey of plant-based milk alternatives was conducted between November
2019 and January 2020 in Metropolitan areas of Melbourne and Sydney. The data collection process
replicated a previously recognised procedure [10,52]; however, the examination included three market
categories: retail supermarkets, health food stores and local independent cafes with non-dairy milk
offerings. The following major supermarkets were surveyed: Woolworths Group, Coles, Aldi and
Independent Grocers of Australia (IGA), which collectively constitute 80.1% of the Australian grocery
market share [53]. For each supermarket, a minimum of three stores within 30 km of each city’s Central
Business District (CBD) were visited. A total of six independent health food stores, three from each city,
and ten local café retailers, five from each city were also visited within the CBD. With permission from
store managers, smartphones were used to collect on-pack nutrition information, including nutrition
information panels (NIP) and ingredient lists. Plant-based milk alternatives from both refrigerated and
long-life sections were included in the audit, where their intended use and quantity were reasonably
presumed to be similar to cow’s milk (i.e. the product is displayed in juxtaposition to cow’s milk and
can be directly consumed as a beverage). Products excluded from the auditing process included tinned
coconut milks that were clearly intended for culinary use, and coconut water, a beverage composed of
coconut liquid endosperm. Flavoured plant-based milk alternative products were also excluded, as
their dairy-based counterparts are considered discretionary [54]. Data collected from all stores were
screened to avoid product duplication. Collected nutritional information was validated using online
data provided by the retailer or manufacturer’s website.
      To capture nutrition composition data for individual plant-based milk alternative products,
three sources of nutrition information were referenced to. Where available, values were directly
obtained from the NIP during the auditing process, as provided by the manufacturer of each product.
Where insufficient data was available from the NIP, such as for some micronutrients in non-fortified
products, values were factorially derived based on a percentage of the characterising ingredient, using
composition data from the FSANZ Food Composition Database [55]. The latter option was made
feasible by legal requirements of FSANZ Act 1991 that the characterising ingredient must be declared
on products as a percentage of the final food product [56]. This percentage was then used to compute
nutritional values per 100 grams. For example, a product containing 3% almonds, without additional
fortificants, was considered to be nutritionally equivalent to 3 grams of unprocessed almonds per
100 mL of beverage. A list of the ingredient accession numbers used for calculations are provided in
Appendix A. For vitamin A, retinol equivalents were used for standard comparison between sources,
as milk is a source of both preformed vitamin A and carotenoids [57]. Nutrient values for dairy
products were obtained from the Food Composition Database as controls (See Appendix A for accession
numbers).
      Data entries were transcribed from photographs, collated into a Microsoft Excel spreadsheet
(Redmond, WA, USA) as Pivot tables and categorised by botanical source (Table 1). The data
transfer process was cross-validated by a separate researcher. For each group, the total solids content
was approximated by adding the macro- and micro-nutritional constituents per 100 mL, after unit
adjustments. The products were also categorised based on whether they were sweetened or fortified
(Table 2).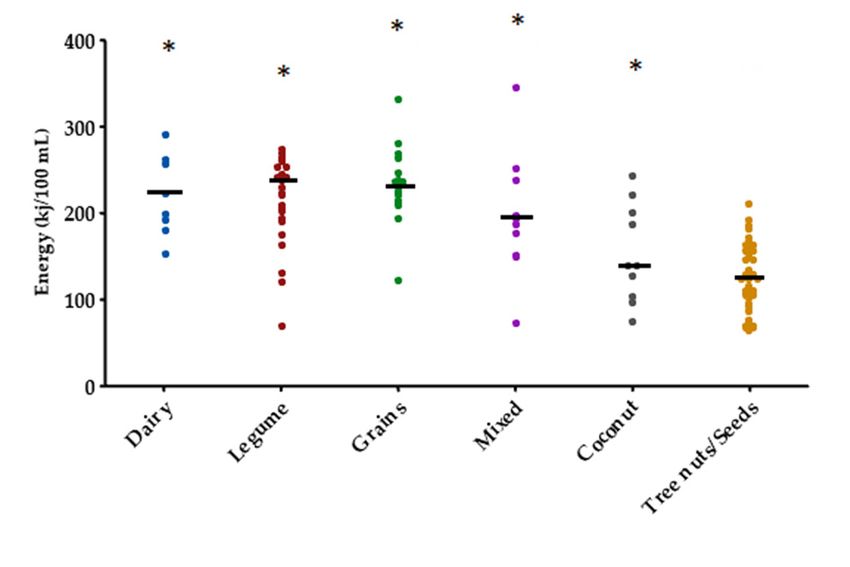
Nutrients 2020, 12, 1254                                                                                             4 of 18

                    Table 1. Classifications of plant-based milk alternatives in the current study.

                 Group                                             Ingredients Included
          Tree nuts and seeds                    Almond, Cashew, Macadamia, Hazelnut, Hemp
                Legume                                            Soybean, pea
                Coconut                                       Coconut Milk/Cream
                 Grains                                        Rice, Oat, Quinoa
                Mixed 1                 Almond, Hazelnut, Coconut Cream, Oat, Cashew, Faba, Pea, Rice, Chia
                                 1   A combination of two or more of the ingredients listed.

                                 Table 2. Definitions used within the current study.

                  Term                                                  Definition
                                      Total sugars present in the product per 100 mL. Includes both free and
                 Sugars
                                              intrinsic hexose monosaccharides and disaccharides. 1
                                        A product, containing one of the following ingredients: cane sugar,
               Sweetened
                                                   brown rice syrup, agave or tapioca syrup. 2
                                      A product, containing micronutrients in addition to those intrinsically
                                         present in the original material, which are permitted for voluntary
                Fortified               addition into plant-based beverages by FSANZ. Includes vitamin A,
                                      riboflavin (B2), cobalamin (B12), vitamin D, calcium, phosphorous and
                                         iodine. Added protein isolates were excluded from this definition.
      1Reference: FSANZ [58], 2 Grain milks, whose high carbohydrate and sugar content is usually subject to enzymatic
      hydrolysis during production, were excluded from this definition.

2.1. Modelling of Dietary Scenarios
     The nutritional ramifications of replacing present national recommendations of dairy intake with
plant-based alternatives, in milk equivalents (1 serve being equal to 250 mL), were examined for two
population groups—adolescents aged 12 to 18 and older women above the age of 50. These age groups
have special physiological demands that are duly served by dairy food ingestion, including changes
in dietary energy, and for nutrients important for bone health (protein, calcium, zinc). Nutrients
derived from milks were computed as a fraction of the individual’s daily dietary requirements, in
accordance with the Nutrient Reference Values (NRVs) in Australia. The NRV provides Estimated
Energy Requirements (EER) and Estimated Average Requirement (EAR) for protein, calcium and zinc,
which differs amongst age groups, gender and physical activity [51].
     The adolescent scenario was based on modelling of the 3.5 serves of dairy foods recommended
for both males and females aged 12–18, with the corresponding EAR computed for both genders at
moderate physical activity level (PAL, 1.8). The older women scenario was projected based on 4 dairy
food serves advised for females aged 51, with an average height of 1.6 meters [59], and light PAL (1.6) in
agreement with previous reports for Australians of older age, including women [60,61]. The medians
for each plant-based or cow’s milk group was utilised to compute values as a fraction of the EAR.

2.2. Statistical Analysis
     The nutrients subjected to statistical analyses included energy, macronutrients (protein, sugars,
total and saturated fats, dietary fibre) and micronutrients (vitamin A, riboflavin, cobalamin, zinc,
sodium and iodine). All statistical analyses were performed using MATLAB (Version 9.7.0.1190202,
R2019b, The MathWorks Inc., Natick, MA, USA). Normality within each nutrient category was examined
using the Kolmogorov–Smirnov method. Comparisons amongst categories were applied using the
non-parametric Kruskal–Wallis test due to uneven sample size, with α < 0.05. The Dunn–Sidak
approach was used for multiple comparisons against the control group (dairy/cow’s milk).
Nutrients 2020, 12, 1254 5 of 18
3. Results
Following exclusion of product duplicates, a total of 115 independent products were examined,
including 48 milks derived from tree nuts and seeds, 27 legume milks, 19 grain milks, 10 coconut milks
and 112020,
Nutrients milks
12,with
x FORmixed ingredients (including almond and coconut and almond and cashew 5milks).
PEER REVIEW of 19
The percentage of characterising ingredient in plant-based milk alternatives ranged from 2%–11% in
11%
treein treeand
nuts nuts and seeds,
seeds, 3.5%–16%3.5%–16% in legumes,
in legumes, 7.5%–20%7.5%–20% in coconut,
in coconut, 7%−16%7%−16%
in grainsinand
grains and 3.5%–
3.5%–15% from
15%
mixedfrom mixedRecommended
sources. sources. Recommended
serving sizesserving sizes for products,
for plant-milk plant-milk in products,
accordanceinwith
accordance with
the nutritional
the nutritional
panel, panel,200
ranged from ranged
to 250from 200 to 250
mL, similar mL,
to the 250similar to the
mL found for250 mLmilk.
cow’s found forapproximate
The cow’s milk. solids
The
approximate
content ranged solids
fromcontent ranged
2.14 to 12.87 per from
100 mL, 2.14 to 12.87to per
compared 9.46 100 mL,incompared
to 13.34 dairy food to 9.46 to
equivalents.
13.34 in dairy
Product food equivalents.
ingredient lists revealedProduct ingredient
that, overall, 50% oflists
therevealed that,milk
plant-based overall, 50% of the
alternatives wereplant-based
sweetened,
milk
and alternatives were sweetened,
57% were fortified and 57% (Figure
with micronutrients were fortified
1), but with micronutrients
only 1/3 (Figure
contained similar 1), butcontent
calcium only
1/3 contained
to cow’s milk. similar calcium content to cow’s milk.
100%
89%
90%
% of products within category
78%
80%
70% 63% 64%
60% 52%
50% 46%
40% 40%
40%
27%
30%
20%
10%
0%
0%
Tree Nuts/Seeds Legume (n=27) Coconut (n=10) Grains (n=19) Mixed (n=11)
(n=48)
Sweetened Fortified
Figure 1. The proportion of products within each category that added sweeteners or fortificants in
accordance
Figure 1. Thewith the ingredients
proportion list. within each category that added sweeteners or fortificants in
of products
accordance with the ingredients list.
3.1. Nutrient Composition
3.1. Nutrient
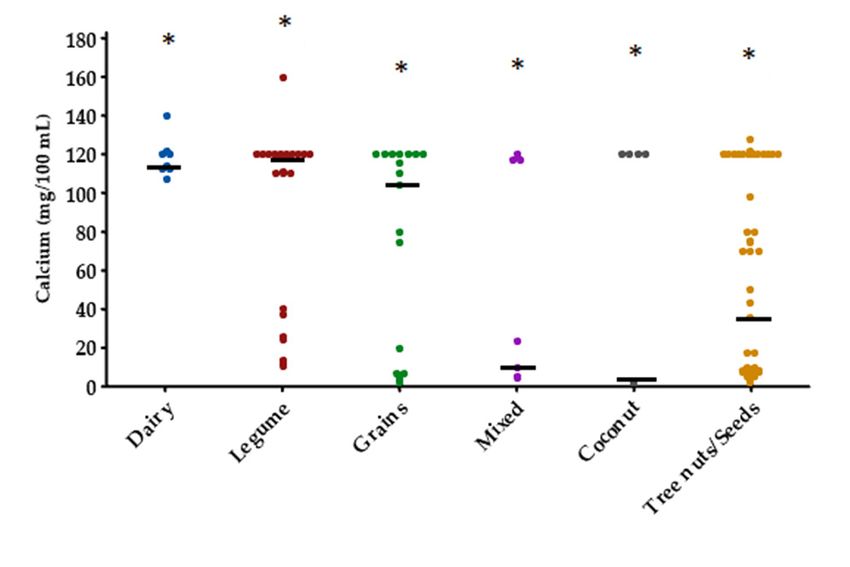
The key Composition
constituents within milk, the distribution of energy, protein, total sugars and calcium
content per constituents
The key 100 mL are withinillustrated
milk,inthe
Figure 2. Theofoverall
distribution energy, energy content
protein, of plant-based
total sugars and calciummilk
alternatives ranged from 63–346 kJ/100 mL contrasted to 152–290 kJ/100 mL
content per 100 mL are illustrated in Figure 2. The overall energy content of plant-based milk in cow’s milk. Tree nuts
was the only
alternatives groupfrom
ranged to demonstrate
63–346 kJ/100 significantly (p < 0.01)
mL contrasted lower kJ/100
to 152–290 energy,mLwithin acow’s
median
milk.of Tree
123 versus
nuts
was the only group to demonstrate significantly (p < 0.01) lower energy, with a median of 123g/100
210 kJ/100 mL in cow’s milk. The protein content of milk alternatives ranged from 0 to 4.2 mL
versus
versus
210 kJ/1003.2mLto in
4.7cow’s
g/100milk.
mL Thefromprotein
cow’s content
milk, with median
of milk values of
alternatives 0.9 g from
ranged (grains), 0.9 g/100
0 to 4.2 g (mixed),
mL
0.2 g (coconut), 0.6 g (tree nuts/seeds) and 3.1 g (legume) per 100 mL. All plant-based
versus 3.2 to 4.7 g/100 mL from cow’s milk, with median values of 0.9 g (grains), 0.9 g (mixed), 0.2 g groups apart
from legumes
(coconut), 0.6 g were
(tree significantly
nuts/seeds) and (p
legumes were significantly (p < 0.01) inferior protein sources compared to cow’s milk (median: 3.6in
0.05) with cow’s milk
total mL).
g/100 sugars (median:
While 3.7 versus
the grains group5.3exhibited
g/100 mL), nothe legume, mixed,
significant coconut
difference and tree
(p > 0.05) nuts/seed
with cow’s milkgroups
in
were comparatively lower in sugars, with median values ranging from 1.1–2.4
total sugars (median: 3.7 versus 5.3 g/100 mL), the legume, mixed, coconut and tree nuts/seed groupsg/100 mL.
were comparatively lower in sugars, with median values ranging from 1.1–2.4 g/100 mL.
No significant differences were found in the calcium concentrations of various plant milks when
compared to cow’s milk counterparts (Figure 2). This coincided with a high prevalence of calcium
fortification amongst all milk alternatives (42.6% of products examined) in the form of mineral salts,
including calcium carbonate, phosphates, chloride and hydroxide, as per the ingredients list on the
packaging.Nutrients 2020,12,
Nutrients2020, 12, 1254
x FOR PEER REVIEW 6 of 19 6 of 18
(a) (b)
(c) (d)
Figure 2. Energy
Figure 2. andnutrient
Energy and nutrientcontents
contentsof of Australian
Australian plant-based
plant-based milkmilk alternative
alternative products
products across across
categories: (a) Energy; (b) Total sugars; (c) Calcium; (d) Protein. Median values are outlined
categories: (a) Energy; (b) Total sugars; (c) Calcium; (d) Protein. Median values are outlined in black. in black.
Datawere
Data were analysed
analysed using
usingKruskal–Wallis
Kruskal–Wallis andandDunn–Sidak’s
Dunn–Sidak’s multiple comparison
multiple tests; tests;
comparison groupsgroups
not not
labelledwith
labelled withananasterisk
asterisk(*)
(*)are
aresignificantly
significantly different (pNutrients 2020, 12, 1254 7 of 18
Table 3. Selected macro- and micronutrient values of plant-based milk alternatives per 100 mL.
Cow’s Milk Tree Nuts/Seeds Legumes Coconut Grains Mixed Sources
Median Range Median Range Median Range Median Range Median Range Median Range
Total fat (g) 1.4 0–3.5 1.9 0.8–3.1 2.8 0–3.5 2.2 1.8–3.7 1.2 0–3.4 2.9 1.5–6.6
Saturated fat (g) 0.85 0–2.3 0.2 * 0–0.4 0.3 0–0.8 2.1 1.4–3.4 0.17 0–0.5 0.5 0–4.8
Dietary fibre (g) 0 0–0.1 0 0–1.9 0 0–1.4 0 0–0.9 0 0–1.3 0 0–1
Zinc (mg) 0.39 0.12–0.48 0.11 * 0.03–0.69 0.19 0.14–0.66 0.02 * 0.02–0.06 0.22 0.07–0.37 0.25 0.09–0.26
Sodium (mg) 40.5 36–47 44 22–140 57 16–93 44.5 20–100 58 37–110 46 9–110
Phosphorous (mg) 94.5 85–119 17.05 * 5–115.5 87.75 31.04–108 3* 2–8 30 * 16–87 73 26.1–103
Retinol equivalents (µg) 18.5 0–54 0* 0–110 0.64 0–82 0* 0 0* 0 0* 0
Riboflavin/Vitamin B2 (µg) 0.21 0.16–0.23 0.0024 * 0–0.17 0.04 0.004–0.42 0* 0 0.001 * 0–0.002 0.007 0.003–0.17
Cobalamin/Vitamin B12 (µg) 0.6 0.5–0.8 0* 0–0.4 0* 0–0.9 0* 0 0* 0 0.4 0–0.4
Iodine (µg) 24.9 18.7–29.1 0* 0 0* 0–1.4 0.15 * 0.1–0.4 5.2 0–11.8 0* 0–5.6
An asterisk (*) indicates statistically different values from the cow’s milk control (p < 0.01), as analysed by Kruskal–Wallis and Dunn–Sidak’s multiple comparison tests.Nutrients 2020, 12, 1254 8 of 18
Despite the fortification of some products, plant-based milk alternatives were found to be
poor sources of some micronutrients. Milks derived from tree nuts/seeds, coconut and grains
showed significantly lower levels of retinol equivalents compared to cow’s milk (median: 0 versus
18.5 µg/100 mL). All groups contained little to no vitamin B12, except for mixed sources (median:
0.4 µg/100 mL). In relation to zinc, tree nuts/seeds and coconut milks were substandard sources versus
cow’s milk (medians: 0.02–0.109 versus 0.39 mg/100 mL). Grain milks were the only source with iodine
levels statistically comparable to cow’s milk, although a reduction was still observed (median 5.2
versus 24.85 µg/100 mL). None of the products examined was fortified with zinc or iodine, although
one legume-based product contained kelp, a rich source of iodine.
Comparisons with Cow’s Milk Under Australian Legislations
In accordance with FSANZ regulations, plant-based beverages that contain lower levels of protein
than milk (≤3%) are unsuitable as a complete replacement for children under five years of age, while
beverages with adequate protein but comparatively lower fat than cow’s milk (≤3.2%) are deemed
inappropriate for children under the age of two [56]. Of the plant-based alternatives examined, only 27
(23.48% of total) contained the minimum protein concentration, 25 of which originated from legumes.
Only 14 (12.17%) products contained fat concentrations equivalent to cow’s milk, and nine products
(7.8%) met the criteria for both protein and fat concentrations.
3.2. Projected Dietary Scenarios
Tables 4 and 5 present the changes in energy, protein, sugars, calcium and zinc intake associated
with substituting cow’s milk with plant-based sources in the context of the overall diet, assuming
the recommended intakes for cow’s milk are met. Our modelling suggested that cow’s milk was a
significant source of protein, calcium and zinc in adolescents and older women, providing 50% or over
of the daily recommended intake in both population groups.
Table 4. Projected dietary scenarios of cow’s and plant-based milk consumption, based on current
Australian guidelines of 3.5 dairy food serves for adolescents (both male and female, aged 12−18). One
serving is equivalent to 250 mL.
Energy Protein Sugars % Calcium Zinc
% EER 1 % EAR % EAR % EAR
(kJ) (g) (g) Energy (mg) (mg)
Cow’s milk 1838 13–17 32 64–90 46 0.3–7 1024 98 3.5 31–58
Tree
1076 8–10 5.3 11–15 9.6 0.1–2 407 39 1 9–16
nuts/Seeds
Legumes 2004 14–18 27 55–78 16 0.1–2 1033 98 1.7 15–28
Grains 2021 14–19 7.9 16–23 32 0.2–5 910 87 1.9 18–32
Coconut 1216 9–11 1.8 4–5 11 0.1–2 5.3 0.5 0.2 2–3
Mixed 1689 12–15 7.9 16–23 21 0.2–3 82 8 2 20–36
1 EER = Estimated Energy Requirements, EAR = Estimated Average Requirements.
Table 5. Projected dietary scenarios of cow’s and plant-based milk consumption, based on current
Australian guidelines of 4 dairy food serves for older women (aged 51 and above). One serving is
equivalent to 250 mL.
Energy Protein Sugars % Calcium Zinc
% EER 1 % EAR % EAR % EAR
(kJ) (g) (g) Energy (mg) (mg)
Cow’s milk 2100 27 36 97 53 11 1170 106 3.95 61
Tree
1230 16 6 16 11 2 465 42 1.09 17
nuts/Seeds
Legumes 2290 29 31 84 18 4 1180 107 1.9 29
Grains 2310 29 9 24 37 8 1040 95 2.2 34
Coconut 1390 18 2 5 13 3 6 0.6 0.2 3
Mixed 1930 24 9 24 24 5 94 9 2.5 38
1 EER = Estimated Energy Requirements, EAR = Estimated Average Requirements.Nutrients 2020, 12, 1254 9 of 18
In adolescents, the replacement of plant-based milk alternatives from legume, grains and mixed
sources provided similar energy compared to cow’s milk (range: 12%−19% versus 13%−17% of
EER), while tree nuts/seeds and coconut milks delivered less (range: 8%−11% of EER). Cow’s milk
consumption provided 64%−90% of the protein EAR in this age group, which was similar to that from
legumes (range: 55%−78%) but considerably higher than other plant sources (4%−23%). The same
trend was observed for calcium, where legumes were the only comparable source to cow’s milk (98%
EAR for both). Legume, grain and mixed milks provided slightly lesser zinc compared to cow’s milk
(range: 15−36 versus 31%−58%), while milks derived from tree nuts/seeds and coconut were inadequate
sources (2%−16% EAR). Regardless of the source, the sugars associated with milk ingestion constituted
less than 5% of total energy in adolescents. This was well within the World Health Organization
(WHO) guidelines ofNutrients 2020, 12, 1254 10 of 18
Dairy food consumption during childhood and adolescence has been linked to increased bone
density in adulthood [80], while effectively helping to decrease bone loss in pre- and post-menopausal
women [40]. Results of our dietary modelling highlighted that by substituting cow’s milk with some
plant-based beverages in these age groups, the intake of some bone-health promoting nutrients,
including protein, calcium and zinc, could be reduced. This is a disconcerting discovery, as consumers
reportedly perceive plant-based milk alternatives to be mineral-rich and good for bones [5,6,81].
The benefits derived from cow’s milk are likely attributable to the complex interactions between
nutrients that synergistically promote bone and muscle anabolism, rather than solely as a source
of essential minerals in bone formation itself [82], for example, calcium and Vitamin D. During
stages of growth, the accrual of bone density is closely correlated with muscle mass [83], and muscle
contraction is involved in maintaining bone density throughout life. Inadequate consumption of
protein, calcium, zinc and possibly other nutrients, when substituting plant-derived products, maybe
concerning in relation to both muscle and bone mass accrual in vulnerable age groups. Given that
Australians currently obtain 7.1% of their protein intake from dairy foods [84], substitution with
plant-derived proteins, even at the same quantity, may impact anabolic effects compared to those
derived from animal sources [85,86]; however, these dietary components may be made up from
other foods provided within the whole diet. Furthermore, plant-based milk alternatives may be
limited in certain amino acids compared to bovine milk, which has a high biological value. In older
women, where musculoskeletal aging is characterised by progressive, elevated obligatory losses in
muscle and bone density [39,87], reduced calcium absorption efficiency may be more problematic [88].
Insufficient dietary intake to meet increased physiological demands can thus pose significant risks to
the development of osteosarcopenia (co-occurrence of osteoporosis and sarcopenia), a chronic geriatric
syndrome associated with increased mortality and morbidity [89,90], particularly as overall energy
needs are lower at this stage of life. As specific health-promoting features of cow’s milk begin to
unravel, they can be applied to plant milk matrices in the design of more nutritionally comparable
substitutes for these consumers. Examples include the prospective role of cholecalciferol (vitamin D),
medium-chain fatty acids and branched-chain amino acids in muscle anabolism [91–93].
Plant-based milk alternatives have long been designed to meet the needs of specialised populations,
such as consumers avoiding lactose, saturated fats and cholesterol [94,95]. However, it is critical that
consumers with pre-existing health conditions are made aware of the limitations associated with
substitution. For example, nut-based beverages have minimal protein but are a source of phosphorous
due to the natural occurrence in addition to as a food additive. The presence of highly bioavailable
phosphate additives, as well as the high phosphorous-to-protein ratio, may not be ideal in the diets
of individuals with chronic renal disease [96,97], a condition affecting 1.7 million Australians [98].
While grain-based milks, such as from rice, have been demonstrated to have a high glycaemic index
due to enzymatic hydrolysis during production [99], making these products potentially unsuitable
for diabetics. In previous studies, the lower energy and fat content relative to cow’s milk have been
found to be triggers for plant milk consumption [6,81]. Indeed, we found some beverages to have
low approximate solids content, which likely translated to lower energy, but potentially at the cost
of reduced satiety relative to cow’s milk. This could lead to unwarranted energy compensation with
discretionary foods [100], a finding previously observed in Australian young adults with poor calcium
intake [101].
Fortification appears to be a promising strategy to mitigate the limitations in the micronutrient
composition of plant-based milks, which we have in this range of products. However, food matrix
interactions should be systematically studied to augment the concentrations of these nutrients, notably
to levels present in cow’s milk. In cow’s milk, many micronutrients are present in a delivery matrix
that is bioavailable during human digestion [21,102], in contrast to plant-derived matrices [103].
For example, the plant-based milk alternatives in our study predominantly contained comparable
concentrations of calcium to cow’s milk, but the bioavailability of this calcium is not well understood.
Minerals, such as calcium, possess a maximum concentration in which it stays soluble in a liquidNutrients 2020, 12, 1254 11 of 18
medium, which is important for intestinal absorption as the excess tends to form non-bioaccessible
precipitates. However, calcium concentrations in cow’s milk can exceed its maximum solubility due to
their sequestration in casein phosphopeptides, a micellar protein absent in non-dairy products [104].
The high concentrations of calcium from milk can thus remain soluble during digestion for uptake,
being progressively released for absorption as the casein slowly hydrolyses [105]. Plant-based milks,
which provide varying food matrices, may not provide this advantage. Nascent investigations in vitro
have displayed broad disparity in the levels of bioaccessible calcium found in fortified plant-based
milks from rice, cashew, almond, peanut, coconut, oat and soy, likely due to the various types of
fortificants used and the presence of inhibitory compounds [106–108]. Early isotope human studies
demonstrated that soy milk fortified with calcium carbonate led to similar absorption levels from
cow’s milk, although this was lower when tricalcium phosphate was used [109]. This demonstrates
that bioavailability is likely dependent on both the food matrix and the type of fortificants used.
Although no other human studies have been conducted on plant-based milk matrices, to the best of
our knowledge, a recent rodent study showed that supplementation with bovine or soy milk led to
positive effects on bone health, while consumption of an almond beverage led to detrimental effects
despite containing the equivalence of calcium [110]. These preliminary findings highlight the need for
further evaluations of different plant matrices that, in combination with suitable fortificants, provide
efficient, bioavailable delivery of key nutrients.
A series of approaches can be exploited by food technologists to compensate for some nutritional
limitations identified in our study. This is particularly vital for milks, such as coconut, in our study,
which was the least nutritionally adequate plant-based milk alternative, containing significantly
less zinc, phosphorous, vitamin A, B2, B12 and iodine compared with cow’s milk. In addition to
fortification, microbial synthesis of plant-based milks can effectively acquire selected B-group vitamins
and, principally, in the chemically unbound form where high bioavailability is anticipated [111,112].
As examples, fermentation of soy by Rhizopus spp. and wheat by Lactococcus spp. has been shown to
produce a minimum two-fold increase in riboflavin [113,114]; while many strains of genus Lactobacilli
have been identified as cobalamin producers [115]. To address low levels of lipophilic nutrients, such as
vitamin A, encapsulation using lipid-based nano-emulsions has been demonstrated to be bioavailable
delivery systems [116,117]. Such an approach allows retinols and carotenoids to be solubilised in the
same manner as they occur in the dairy lipid fraction [57]. Proteins are generally lower in plant-based
milks, with crude nuts, seeds, grains and legumes, and possess limiting amino acid profiles, as well as
restricted digestibility [118,119]. This can be ameliorated by complementing plant protein varieties to
achieve a balanced amino acid profile [120], attempts of which we observed in the ‘mixed’ category of
our study.
Our cross-sectional evaluation was the first to be exclusively conducted on plant-based milk
alternatives in Australia, a growing segment of the market with rising positive perception over their
putative health and ecological benefits. Although we attempted to capture the litany of products
available to Australian consumers, including those found in cafes, it would be worthwhile monitoring
this product segment for new products or line extensions as it might have implications for the
way such products are named and regulated. This study was limited by the use of predominantly
manufacturer-supplied information and modelling, the accuracy of which could be validated in future
by independent laboratory analyses. It is also likely that values of phosphorous were underestimated
by modelling due to its frequent presence as a food additive (e.g. as dipotassium phosphate,
pyrophosphates and phosphoric acid).
5. Conclusions
This cross-sectional survey of plant-based milk alternatives found substantial variability in the
nutritional content of plant-based milk alternatives compared with cow’s milk, supporting previous
works from other geographical locations. Based on the nutrients we examined, legume-based (pea
and soy) milks were the most nutritionally sound when compared to other varieties. In the absence ofNutrients 2020, 12, 1254 12 of 18
mandatory fortification, prudent consumer selection of appropriately formulated products, regardless
of the ingredient categories, is vital to avoid potential issues with reduced nutrient intake associated
with substitution of cow’s milk. This includes not only nutritional inadequacies commensurate to
lower intake and/or bioavailability but also the casual consequences linked to displacement of dietary
energy. Due to the high proportion of consumers selecting plant-based milk alternatives for non-dietary
reasons, it is recommended that current legislations implement further advisory labelling, particularly
for older women and adolescents. Additional formulations should target these age groups, taking
into account protein content and quality, among adequate quantities of micronutrients, such as zinc
and calcium. Nonetheless, in an age of plant substitution over animal products, prospective gaps
in the nutritional value of plant-based milk alternatives must not be overlooked, particularly where
bioavailability remains equivocal.
Author Contributions: Conceptualization and methodology, Y.Y.Z and S.G.; data collection and validation, Y.Y.Z.
and J.H.; formal analysis, Y.Y.Z; writing—original draft preparation, Y.Y.Z.; writing—review and editing, S.G. and
J.H. All authors have read and agreed to the published version of the manuscript.
Funding: This research received no external funding but was supported by the Grains and Legumes Nutrition
Council, a non-profit charity. Y.Y.Z. is a recipient of CSIRO Postgraduate Scholarship and Melbourne Research
Scholarship at the University of Melbourne.
Conflicts of Interest: S.G. and J.H. are employed by the Grains and Legumes Nutrition Council, a
not-for-profit charity.
Appendix A
Table A1. List of ingredients’ accession numbers used for modelling from the Australian Food
Composition Database.
Ingredient Number
F006081 Nut, almond, with skin, raw, unsalted
F006088 Nut, cashew, raw, unsalted
F006099 Nut, macadamia, raw, unsalted
F006098 Nut, hazelnut, raw, unsalted
F004002 Flour, soya
F002982 Coconut, cream, regular fat
F002991 Coconut, milk, canned, regular fat
F003998 Flour, rice
F006136 Oats, hulled, uncooked
F007598 Quinoa, uncooked
F008209 Seed, chia, dried
F005638 Milk, cow, fluid, skim (0.15% fat), added milk solids
F005637 Milk, cow, fluid, skim (0.15% fat)
F005598 Milk, cow, fluid, lactose-free, reduced-fat (1% fat)
F005614 Milk, cow, fluid, reduced-fat (1% fat)
F005621 Milk, cow, fluid, reduced-fat (1.5% fat), added omega 3 polyunsaturates
F005599 Milk, cow, fluid, lactose-free, regular fat (3.5% fat)
F005634 Milk, cow, fluid, regular fat (3.5% fat)
12012 1 Seeds, hemp seed, hulled
1 Values for hemp were derived from the USDA Food database due to lack of availability.
References
1. Evershed, R.P.; Payne, S.; Sherratt, A.G.; Copley, M.S.; Coolidge, J.; Urem-Kotsu, D.; Kotsakis, K.; Özdoğan, M.;
Özdoğan, A.E.; Nieuwenhuyse, O.; et al. Earliest date for milk use in the Near East and southeastern Europe
linked to cattle herding. Nature 2008, 455, 528–531. [CrossRef]
2. Muehlhoff, E.; Bennett, A.; McMahon, D. Milk and Dairy Products in Human Nutrition; Food and Agriculture
Organization of the United Nations (FAO): Rome, Italy, 2013.
3. Mylan, J.; Morris, C.; Beech, E.; Geels, F.W. Rage against the regime: Niche-regime interactions in the societal
embedding of plant-based milk. Environ. Innov. Soc. Transit. 2019, 31, 233–247. [CrossRef]Nutrients 2020, 12, 1254 13 of 18
4. IBISWorld. Soy and Almond Milk Production in Australia—Market Research Report; IBISWorld Pty Ltd.: Canberra,
Australia, 2020.
5. McCarthy, K.S.; Parker, M.; Ameerally, A.; Drake, S.L.; Drake, M.A. Drivers of choice for fluid milk versus
plant-based alternatives: What are consumer perceptions of fluid milk? J. Dairy Sci. 2017, 100, 6125–6138.
[CrossRef] [PubMed]
6. Haas, R.; Schnepps, A.; Pichler, A.; Meixner, O. Cow Milk versus Plant-Based Milk Substitutes: A Comparison
of Product Image and Motivational Structure of Consumption. Sustainability 2019, 11, 5046. [CrossRef]
7. Abbring, S.; Hols, G.; Garssen, J.; van Esch, B.C.A.M. Raw cow’s milk consumption and allergic diseases—The
potential role of bioactive whey proteins. Eur. J. Pharmacol. 2019, 843, 55–65. [CrossRef] [PubMed]
8. Hodges, J.K.; Cao, S.; Cladis, D.P.; Weaver, C.M. Lactose intolerance and bone health: The challenge of
ensuring adequate calcium intake. Nutrients 2019, 11, 718. [CrossRef] [PubMed]
9. Rizzo, G.; Laganà, S.A.; Rapisarda, M.A.; La Ferrera, M.G.; Buscema, M.; Rossetti, P.; Nigro, A.; Muscia, V.;
Valenti, G.; Sapia, F.; et al. Vitamin B12 among Vegetarians: Status, Assessment and Supplementation.
Nutrients 2016, 8, 767. [CrossRef] [PubMed]
10. Curtain, F.; Grafenauer, S. Plant-Based Meat Substitutes in the Flexitarian Age: An Audit of Products on
Supermarket Shelves. Nutrients 2019, 11, 2603. [CrossRef]
11. Tsakiridou, E.; Tsakiridou, H.; Mattas, K.; Arvaniti, E. Effects of animal welfare standards on consumers’
food choices. Acta Agric. Scand. Sect. C Food Econ. 2010, 7, 234–244. [CrossRef]
12. Holden, L.A. Understanding the environmental impact of global dairy production. J. Anim. Sci. 2020, 98.
[CrossRef]
13. Ritchie, H.; Reay, D.S.; Higgins, P. The impact of global dietary guidelines on climate change. Glob. Environ.
Chang. 2018, 49, 46–55. [CrossRef]
14. National Dairy Council. Consumer Perceptions of Dairy milk and Plant-Based Milk Alternatives; Vermont General
Assembly: Montpelier, Vermont, 2018.
15. McClements, D.J.; Newman, E.; McClements, I.F. Plant-based Milks: A Review of the Science Underpinning
Their Design, Fabrication, and Performance. Compr. Rev. Food Sci. Food Saf. 2019, 18, 2047–2067. [CrossRef]
16. Poore, J.; Nemecek, T. Reducing food’s environmental impacts through producers and consumers. Science
2018, 360, 987–992. [CrossRef] [PubMed]
17. Grant, C.A.; Hicks, A.L. Comparative Life Cycle Assessment of Milk and Plant-Based Alternatives. Environ.
Eng. Sci. 2018, 35, 1235–1247. [CrossRef]
18. Wenzel, P.; Jungbluth, N. The Environmental Impact of Vegan Drinks Compared to Whole Milk; ESU-Services Ltd.:
Schaffhausen, Switzerland, 2017.
19. Gazan, R.; Brouzes, C.M.C.; Vieux, F.; Maillot, M.; Lluch, A.; Darmon, N. Mathematical Optimization to
Explore Tomorrow’s Sustainable Diets: A Narrative Review. Adv. Nutr. 2018, 9, 602–616. [CrossRef]
20. Perignon, M.; Sinfort, C.; El Ati, J.; Traissac, P.; Drogué, S.; Darmon, N.; Amiot, M.-J.; Amiot, M.J.; Achir, N.;
Alouane, L.; et al. How to meet nutritional recommendations and reduce diet environmental impact in the
Mediterranean region? An optimization study to identify more sustainable diets in Tunisia. Glob. Food Secur.
2019, 23, 227–235. [CrossRef]
21. Shingfield, K.J.; Chilliard, Y.; Toivonen, V.; Kairenius, P.; Givens, D.I. Trans fatty acids and bioactive lipids in
ruminant milk. In Bioactive Components of Milk; Springer: New York, NY, USA, 2008; pp. 3–65.
22. Australian Bureau of Statistics. 4364.0.55.007-National Nutrition and Physical Activity Survey, 2011–2012.
Available online: https://www.abs.gov.au/ausstats/abs@.nsf/Lookup/by%20Subject/4364.0.55.012~{}2011-12~
{}Main%20Features~{}Key%20Findings~{}1 (accessed on 5 January 2020).
23. Dairy Australia. Consumption Summary. Available online: https://www.dairyaustralia.com.au/industry/
production-and-sales/consumption-summary (accessed on 22 February 2020).
24. Bureau of Statistics. 4364.0.55.008-Australian Health Survey: Usual Nutrient Intakes, 2011–2012. Available
online: https://www.abs.gov.au/ausstats/abs@.nsf/mf/4364.0.55.008 (accessed on 6 November 2019).
25. Auclair, O.; Han, Y.; Burgos, S.A. Consumption of Milk and Alternatives and Their Contribution to Nutrient
Intakes among Canadian Adults: Evidence from the 2015 Canadian Community Health Survey—Nutrition.
Nutrients 2019, 11, 1948. [CrossRef]
26. Saito, A.; Okada, E.; Tarui, I.; Matsumoto, M.; Takimoto, H. The Association between Milk and Dairy Products
Consumption and Nutrient Intake Adequacy among Japanese Adults: Analysis of the 2016 National Health
and Nutrition Survey. Nutrients 2019, 11, 2361. [CrossRef]Nutrients 2020, 12, 1254 14 of 18
27. Murphy, M.M.; Douglass, J.S.; Johnson, R.K.; Spence, L.A. Drinking flavored or plain milk is positively
associated with nutrient intake and is not associated with adverse effects on weight status in US children
and adolescents. J. Am. Diet. Assoc. 2008, 108, 631–639. [CrossRef]
28. Fayet, F.; Ridges, L.A.; Wright, J.K.; Petocz, P. Australian children who drink milk (plain or flavored) have
higher milk and micronutrient intakes but similar body mass index to those who do not drink milk. Nutr.
Res. 2013, 33, 95–102. [CrossRef]
29. Cifelli, C.J.; Houchins, J.A.; Demmer, E.; Fulgoni, V.L. Increasing plant based foods or dairy foods differentially
affects nutrient intakes: Dietary scenarios using NHANES 2007–2010. Nutrients 2016, 8, 422. [CrossRef]
[PubMed]
30. Parker, C.E.; Vivian, W.J.; Oddy, W.H.; Beilin, L.J.; Mori, T.A.; O’Sullivan, T.A. Changes in dairy food and
nutrient intakes in Australian adolescents. Nutrients 2012, 4, 1794–1811. [CrossRef] [PubMed]
31. Rangan, A.M.; Flood, V.M.; Denyer, G.; Webb, K.; Marks, G.B.; Gill, T.P. Dairy consumption and diet quality
in a sample of Australian children. J. Am. Coll. Nutr. 2012, 31, 185–193. [CrossRef] [PubMed]
32. Meyer, S.B.; Coveney, J.; Henderson, J.; Ward, P.R.; Taylor, A.W. Reconnecting Australian consumers and
producers: Identifying problems of distrust. Food Policy 2012, 37, 634–640. [CrossRef]
33. Jacobs, E.T.; Foote, J.A.; Kohler, L.N.; Skiba, M.B.; Thomson, C.A. Re-examination of dairy as a single
commodity in US dietary guidance. Nutr. Rev. 2020, 78, 225–234. [CrossRef]
34. Seo, H.-J.; Cho, Y.-E.; Kim, T.; Shin, H.-I.; Kwun, I.-S. Zinc may increase bone formation through stimulating
cell proliferation, alkaline phosphatase activity and collagen synthesis in osteoblastic MC3T3-E1 cells. Nutr.
Res. Pract. 2010, 4, 356–361. [CrossRef]
35. Allgrove, J. Physiology of calcium, phosphate, magnesium and vitamin D. In Calcium and Bone Disorders in
Children and Adolescents; Karger Publishers: Basel, Switzerland, 2015; Volume 28, pp. 7–32.
36. Baroncelli, G.I.; Bertelloni, S.; Sodini, F.; Saggese, G. Osteoporosis in Children and Adolescents. Pediatric
Drugs 2005, 7, 295–323. [CrossRef]
37. Unni, J.; Garg, R.; Pawar, R. Bone mineral density in women above 40 years. J. Midlife Health 2010, 1, 19–22.
[CrossRef]
38. Demontiero, O.; Vidal, C.; Duque, G. Aging and bone loss: New insights for the clinician. Ther. Adv.
Musculoskelet Dis. 2012, 4, 61–76. [CrossRef]
39. Rizzoli, R.; Bischoff-Ferrari, H.; Dawson-Hughes, B.; Weaver, C. Nutrition and bone health in women after
the menopause. Women’s Health 2014, 10, 599–608. [CrossRef]
40. Ji, M.-X.; Yu, Q. Primary osteoporosis in postmenopausal women. Chronic Dis. Transl. Med. 2015, 1, 9–13.
[CrossRef]
41. Food Standards Australia New Zealand. Plant-based Milk Alternatives. Available online: https://www.
foodstandards.gov.au/consumer/nutrition/milkaltern/Pages/default.aspx (accessed on 20 February 2020).
42. Scholz-Ahrens, K.E.; Ahrens, F.; Barth, C.A. Nutritional and health attributes of milk and milk imitations.
Eur. J. Nutr. 2019, 59, 1–16. [CrossRef] [PubMed]
43. Chalupa-Krebzdak, S.; Long, C.J.; Bohrer, B.M. Nutrient density and nutritional value of milk and plant-based
milk alternatives. Int. Dairy J. 2018, 87, 84–92. [CrossRef]
44. Singhal, S.; Baker, R.D.; Baker, S.S. A Comparison of the Nutritional Value of Cow’s Milk and Nondairy
Beverages. J. Pediatric Gastroenterol. Nutr. 2017, 64, 799–805. [CrossRef] [PubMed]
45. Paul, A.A.; Kumar, S.; Kumar, V.; Sharma, R. Milk Analog: Plant based alternatives to conventional milk,
production, potential and health concerns. Crit. Rev. Food Sci. Nutr. 2019, 16, 1–19. [CrossRef] [PubMed]
46. Sethi, S.; Tyagi, S.K.; Anurag, R.K. Plant-based milk alternatives an emerging segment of functional beverages:
A review. J. Food Sci. Technol. 2016, 53, 3408–3423. [CrossRef]
47. Jeske, S.; Zannini, E.; Arendt, E.K. Past, present and future: The strength of plant-based dairy substitutes
based on gluten-free raw materials. Food Res. Int. 2018, 110, 42–51. [CrossRef]
48. Food Standards Australia New Zealand. Voluntary Addition of Vitamins & Minerals to Nut-and
Seed-Based Beverages. Available online: https://www.foodstandards.gov.au/code/applications/Pages/A1104-
VitsMinsNutSeedBevs.aspx (accessed on 6 January 2020).
49. Banwell, C.; Broom, D.; Davies, A.; Dixon, J. How Convenience Is Shaping Australian Diets: The Disappearing
Dessert. In Weight of Modernity: An Intergenerational Study of the Rise of Obesity; Springer: Dordrecht, The
Netherlands, 2012; pp. 41–58. [CrossRef]Nutrients 2020, 12, 1254 15 of 18
50. Shaw, M.; Nugent, A.P.; McNulty, B.A.; Walton, J.; McHugh, M.; Kane, A.; Heslin, A.M.; Morrissey, E.;
Mullan, K.; Woodside, J.V. What is the availability of iodised salt in supermarkets on the Island of Ireland?
Eur. J. Clin. Nutr. 2019, 73, 1636–1638. [CrossRef]
51. National Health and Medical Research Council, New Zealand Ministry of Health. Nutrient Reference Values
for Australia and New Zealand; National Health and Medical Research Council: Canberra, Australia, 2017.
52. Curtain, F.; Grafenauer, S. Comprehensive nutrition review of grain-based muesli bars in Australia: An audit
of supermarket products. Foods 2019, 8, 370. [CrossRef]
53. Roy Morgan. Woolworths and Aldi Grow Grocery Market Share in 2018–2019. Available online: http:
//www.roymorgan.com/findings/7936-australian-grocery-market-december-2018-201904050426 (accessed on
2 February 2020).
54. Food Standards Australia New Zealand. Application of Discretionary Foods Flag. Available online: https://www.
foodstandards.gov.au/science/monitoringnutrients/australianhealthsurveyandaustraliandietaryguidelines/
applicationofdiscretionary/Pages/default.aspx (accessed on 2 February 2020).
55. Food Standards Australia New Zealand. Australian Food Composition Database. Available online: https:
//www.foodstandards.gov.au/science/monitoringnutrients/afcd/Pages/default.aspx (accessed on 2 February 2020).
56. Food Standards Australia New Zealand. User Guide to Standard 1.2.8—Nutrition Information Requirements.
Available online: https://www.foodstandards.gov.au/code/userguide/Documents/Userguide_Prescribed%
20Nutrition%20Information%20Nov%2013%20Dec%202013.pdf (accessed on 2 February 2020).
57. Baldi, A.; Pinotti, L. Lipophilic microconstituents of milk. In Bioactive Components of Milk; Springer: New
York, NY, USA, 2008; pp. 109–125.
58. Food Standards Australia New Zealand. Definitions used throughout the Code. In Standard 1.1.2, Food
Standards Code Australia New Zealand. Available online: https://www.legislation.gov.au/Details/F2015L00385/
Explanatory%20Statement/Text (accessed on 28 April 2020).
59. Burton, N.W.; Brown, W.; Dobson, A. Accuracy of body mass index estimated from self-reported height and
weight in mid-aged Australian women. Aust. N. Z. J. Public Health 2010, 34, 620–623. [CrossRef]
60. Boehm, J.; Franklin, R.C.; Newitt, R.; McFarlane, K.; Grant, T.; Kurkowski, B. Barriers and motivators to
exercise for older adults: A focus on those living in rural and remote areas of Australia. Aust. J. Rural Health
2013, 21, 141–149. [CrossRef] [PubMed]
61. Hill, R.L.; Brown, W.J. Older Australians and physical activity levels: Do we know how many are meeting
guidelines? Australas. J. Ageing 2012, 31, 208–217. [CrossRef] [PubMed]
62. Breda, J.; Jewell, J.; Keller, A. The importance of the World Health Organization sugar guidelines for dental
health and obesity prevention. Caries Res. 2019, 53, 149–152. [CrossRef] [PubMed]
63. Bernat, N.; Cháfer, M.; Chiralt, A.; González-Martinez, C. Vegetable milks and their fermented derivative
products. Int. J. Food Stud. 2014, 3, 93–124. [CrossRef]
64. Sousa, A.; Kopf-Bolanz, K. Nutritional implications of an increasing consumption of non-dairy plant-based
beverages instead of cow’s milk in Switzerland. J. Adv. Dairy Res. 2017, 5, 2. [CrossRef]
65. Vanga, S.K.; Raghavan, V. How well do plant based alternatives fare nutritionally compared to cow’s milk? J.
Food Sci. Technol. 2018, 55, 10–20. [CrossRef]
66. Pistollato, F.; Sumalla Cano, S.; Elio, I.; Masias Vergara, M.; Giampieri, F.; Battino, M. Plant-based and
plant-rich diet patterns during gestation: Beneficial effects and possible shortcomings. Adv. Nutr. 2015, 6,
581–591. [CrossRef]
67. Slagman, A.; Harriss, L.; Campbell, S.; Muller, R.; McDermott, R. Folic acid deficiency declined substantially
after introduction of the mandatory fortification programme in Queensland, Australia: A secondary health
data analysis. Public Health Nutr. 2019, 22, 3426–3434. [CrossRef]
68. Gallagher, C.M.; Black, L.J.; Oddy, W.H. Micronutrient intakes from food and supplements in Australian
adolescents. Nutrients 2014, 6, 342–354. [CrossRef]
69. Chiu, M.; Dillon, A.; Watson, S. Vitamin A deficiency and xerophthalmia in children of a developed country.
J. Paediatr. Child Health 2016, 52, 699–703. [CrossRef]
70. Gallegos, D.; Booth, S.; Kleve, S.; McKenchie, R.; Lindberg, R. Food insecurity in Australian households:
From charity to entitlement. In A Sociology of Food and Nutrition: The Social Appetite; Oxford University Press:
Oxford, UK, 2017; pp. 55–74.Nutrients 2020, 12, 1254 16 of 18
71. Gwynn, J.; Sim, K.; Searle, T.; Senior, A.; Lee, A.; Brimblecombe, J. Effect of nutrition interventions on
diet-related and health outcomes of Aboriginal and Torres Strait Islander Australians: A systematic review.
BMJ Open 2019, 9, e025291. [CrossRef] [PubMed]
72. Singh, G.R.; Davison, B.; Ma, G.Y.; Eastman, C.J.; Mackerras, D.E. Iodine status of Indigenous and
non-Indigenous young adults in the Top End, before and after mandatory fortification. Med J. Aust. 2019,
210, 121–125. [CrossRef] [PubMed]
73. Charlton, K.; Probst, Y.; Kiene, G. Dietary Iodine Intake of the Australian Population after Introduction of a
Mandatory Iodine Fortification Programme. Nutrients 2016, 8, 701. [CrossRef] [PubMed]
74. Gibson, R.; Heath, A.-L. Population groups at risk of zinc deficiency in Australia and New Zealand. Nutr.
Diet. 2011, 68, 97–108. [CrossRef]
75. Rosado, J.; Caamano, M.; Montoya, Y.; de Lourdes Solano, M.; Santos, J.; Long, K. Interaction of zinc or
vitamin A supplementation and specific parasite infections on Mexican infants’ growth: A randomized
clinical trial. Eur. J. Clin. Nutr. 2009, 63, 1176–1184. [CrossRef]
76. Grafenauer, S.; Curtain, F. An audit of Australian bread with a focus on loaf breads and whole grain. Nutrients
2018, 10, 1106. [CrossRef]
77. Bouga, M.; Lean, M.E.; Combet, E. Iodine and pregnancy—A qualitative study focusing on dietary guidance
and information. Nutrients 2018, 10, 408. [CrossRef]
78. Bath, S.C.; Hill, S.; Infante, H.G.; Elghul, S.; Nezianya, C.J.; Rayman, M.P. Iodine concentration of
milk-alternative drinks available in the UK in comparison with cows’ milk. Br. J. Nutr. 2017, 118,
525–532. [CrossRef]
79. Crawford, B.A.; Cowell, C.T.; Emder, P.J.; Learoyd, D.L.; Chua, E.L.; Sinn, J.; Jack, M.M. Iodine toxicity from
soy milk and seaweed ingestion is associated with serious thyroid dysfunction. Med. J. Aust. 2010, 193,
413–415. [CrossRef]
80. Kalkwarf, H.J.; Khoury, J.C.; Lanphear, B.P. Milk intake during childhood and adolescence, adult bone
density, and osteoporotic fractures in US women. Am. J. Clin. Nutr. 2003, 77, 257–265. [CrossRef]
81. Bus, A.; Worsley, A. Consumers’ sensory and nutritional perceptions of three types of milk. Public Health
Nutr. 2003, 6, 201–208. [CrossRef] [PubMed]
82. Burrow, K.; Young, W.; McConnell, M.; Carne, A.; Bekhit, A.E.-D. Do Dairy Minerals Have a Positive Effect
on Bone Health? Compr. Rev. Food Sci. Food Saf. 2018, 17, 989–1005. [CrossRef]
83. Dawson, A.; Dennison, E. Measuring the musculoskeletal aging phenotype. Maturitas 2016, 93, 13–17.
[CrossRef]
84. CSIRO. Protein Balance: New Concepts for Protein in Weight Management; Commonwealth Scientific and
Industrial Research Organisation: Canberra, Australia, 2018.
85. Berrazaga, I.; Micard, V.; Gueugneau, M.; Walrand, S. The Role of the Anabolic Properties of Plant- versus
Animal-Based Protein Sources in Supporting Muscle Mass Maintenance: A Critical Review. Nutrients 2019,
11, 1825. [CrossRef]
86. van Vliet, S.; Burd, N.A.; van Loon, L.J. The skeletal muscle anabolic response to plant-versus animal-based
protein consumption. J. Nutr. 2015, 145, 1981–1991. [CrossRef]
87. Nowson, C.; O’Connell, S. Protein requirements and recommendations for older people: A review. Nutrients
2015, 7, 6874–6899. [CrossRef] [PubMed]
88. Nordin, B.C.; Need, A.G.; Morris, H.A.; O’Loughlin, P.D.; Horowitz, M. Effect of age on calcium absorption
in postmenopausal women. Am. J. Clin. Nutr. 2004, 80, 998–1002. [CrossRef]
89. Sepúlveda-Loyola, W.; Phu, S.; Bani Hassan, E.; Brennan-Olsen, S.L.; Zanker, J.; Vogrin, S.; Conzade, R.;
Kirk, B.; Al Saedi, A.; Probst, V.; et al. The Joint Occurrence of Osteoporosis and Sarcopenia (Osteosarcopenia):
Definitions and Characteristics. J. Am. Med Dir. Assoc. 2020, 21, 220–225. [CrossRef]
90. Reginster, J.-Y.; Beaudart, C.; Buckinx, F.; Bruyère, O. Osteoporosis and sarcopenia: Two diseases or one?
Curr. Opin. Clin. Nutr. Metab. Care 2016, 19, 31–36. [CrossRef]
91. Abe, S.; Ezaki, O.; Suzuki, M. Medium-chain triglycerides (8: 0 and 10: 0) are promising nutrients for
sarcopenia: A randomized controlled trial. Am. J. Clin. Nutr. 2019, 110, 652–665. [CrossRef]
92. Abe, S.; Ezaki, O.; Suzuki, M. Medium-Chain Triglycerides in Combination with Leucine and Vitamin D
Increase Muscle Strength and Function in Frail Elderly Adults in a Randomized Controlled Trial. The J. Nutr.
2016, 146, 1017–1026. [CrossRef] [PubMed]You can also read