Farmer Field Schools (FFSs): A Tool Empowering Sustainability and Food Security in Peasant Farming Systems in the Nicaraguan Highlands - MDPI
←
→
Page content transcription
If your browser does not render page correctly, please read the page content below
Article

Farmer Field Schools (FFSs): A Tool Empowering
Sustainability and Food Security in Peasant Farming
Systems in the Nicaraguan Highlands
Esperanza Arnés 1,*, Carlos G. H. Díaz-Ambrona 1, Omar Marín-González 1 and Marta Astier 2
 1 Dpto. Producción Agraria, Centro de Estudios e Investigación para la Gestión de Riesgos Agrarios y
   Medioambientales, Universidad Politécnica de Madrid, 28040 Madrid, Spain;
   carlosgregorio.hernandez@upm.es (C.G.H.D.-A.); o.marin.gon@gmail.com (O.M.-G.)
 2 Centro de Investigaciones de Geografía Ambiental, Universidad Nacional Autónoma de México, Campus

   Morelia, Morelia 581910, Mexico; mastier@ciga.unam.mx
 * Correspondence: esperanza.arnes@gmail.com or esperanza.arnes@upm.es;
   Tel.: +34-687-021-339; Fax: +34-915-449-983

 Received: 5 July 2018; accepted: 19 August 2018; published: 24 August 2018

 Abstract: Farmer field schools (FFSs) emerged in response to the gap left by the worldwide decline
 in agricultural extension services. With time, this methodology has been adapted to specific rural
 contexts to solve problems related to the sustainability of peasant-farming systems. In this study we
 draw upon empirical data regarding the peasant-farming system in the Nicaraguan highlands to
 evaluate whether FFSs have helped communities improve the sustainability of their systems and
 the food security of their residents using socioeconomic, environmental, and food and nutrition
 security (FNS) indicators. In order to appreciate the long-term impact, we studied three
 communities where FFSs were implemented eight, five, and three years ago, respectively, and we
 included participants and nonparticipants from each community. We found that FFSs have a
 gradual impact, as there are significant differences between participants and nonparticipants, and
 it is the community that first implemented FFSs that scores highest. The impact of FFSs is broad and
 long lasting for indicators related to participation, access to basic services, and conservation of
 natural resources. Finally, this paper provides evidence that FFSs have the potential to empower
 farmers; however, more attention needs to be paid to critical indicators like production costs and
 the use of external inputs in order to scale up their potential in the future.

 Keywords: peasant-farming systems; food and nutritional security; agricultural extension services;
 Central America; sustainability indicators

1. Introduction
     Globalization policies and structural adjustments in Latin America have led to cutbacks in
classical extension services and have steadily changed the agricultural landscape [1]. Rural
communities and nongovernmental organizations have taken over the roles formerly played by
researchers and extension specialists with respect to technology transfer and innovation [2]. This new
scenario called upon international cooperation programs to adopt radical and different
methodological approaches, which had to be adapted to local socioeconomic, cultural, and
agroecological conditions. The challenge in this new scenario was to achieve locally more effective
agricultural innovation by applying a new methodology that combined innovation based on
extension and training, and participatory learner-centered educational methods [3].
     Farmer field schools (FFSs) emerged in response to these training and innovation paradigms.
FFSs were a participatory means of generating methodological tools to improve decision-making
Sustainability 2018, 10, 3020; doi:10.3390/su10093020                         www.mdpi.com/journal/sustainability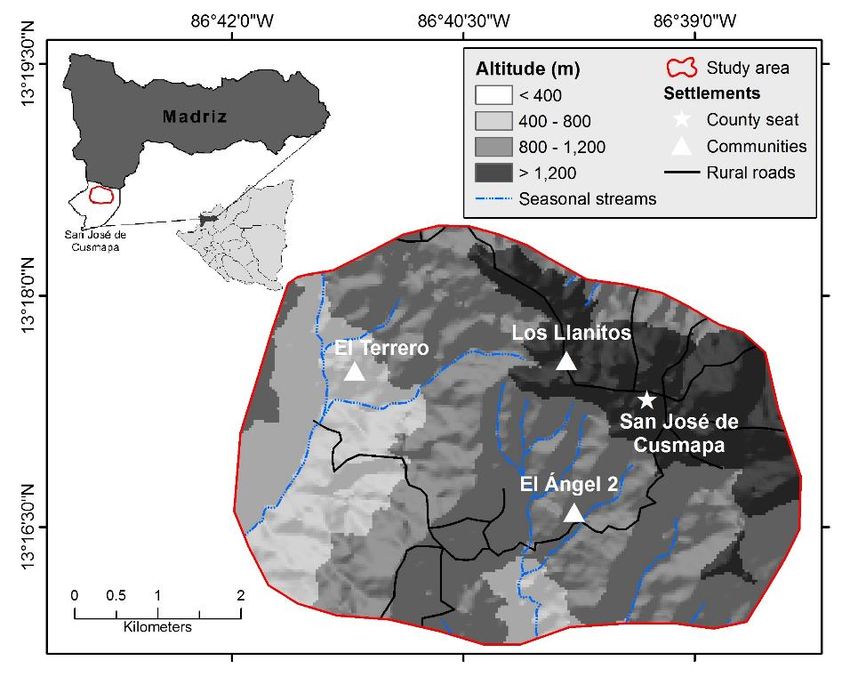
Sustainability 2018, 10, 3020                                                                      2 of 24

skills and promote local innovation for sustainable agriculture [4]. They were introduced by the Food
and Agriculture Organization (FAO) in Indonesia in 1989 but rapidly scaled up and were adopted
on all continents. Originally, their main purpose was to deal with specific problems related to pest
control and integrated pest management (i.e., planthopper infestation in irrigation rice), but they
were also a reaction to rather inefficient “top–down” models of extensionism [5]. Their working
methodology was adapted to specific local contexts and needs. This is why FFSs focused on crops
and agricultural practices in some regions [6,7], and were more socially oriented in others where they
addressed health problems, such as food security [8,9].
      Although several participatory extension and research models, like “farmer-to-farmer”
programs or local agricultural research committees (CIALS—Spanish acronym), were applied in
Latin America, FFSs did not start up until 1997 [10]. Four years later, the Integrated Pest Management
Program of Central America (PROMIPAC—Spanish acronym) and FAO introduced FFSs in
Nicaragua with the assistance of a number of NGOs, such as CARITAS, FIDER, ADDAC, UNAG,
and/or INSFOP-UNICAM [11,12]. In Nicaragua, 41.9% of the population lives in rural areas (classed
as municipalities with a population of less than 2500) [13], and the peasant and family economy
accounts for about 50% of the value of the country’s gross agricultural production [14]. From an
agroenvironmental viewpoint, this type of farming has a great impact on the conservation of natural
resources, sociocultural traditions, and food and nutrition security [15,16]. However, the forest area
has declined by 13% over the last 25 years [13], and over 16.6% of the country’s population still suffers
from hunger [17].
      According to the FAO [18], “food and nutrition security (FNS) exists when all people at all times
have physical, social, and economic access to food, which is safe and consumed in sufficient quantity
and quality to meet their dietary needs and food preferences, and is supported by an environment of
adequate sanitation, health services, and care, allowing for a healthy and active life”. To ensure FNS
and sustainable agricultural production, Nicaragua’s government passed the Food and Nutrition
Sovereignty and Security Law in 2009. This law set up an institutional framework for solving the
problem of hunger and led to the creation of municipal-level food-security committees. This was
conducive to the establishment of FFSs as the backbone of their sustainability and food-security
policy.
      FFSs were created as short-term tools; however, the effects of FFSs related to improvements in
the social, environmental, and economic livelihood of farmers are desirably sustainable. In this sense,
the FFSs approach is consistent with other food-assistance programs studied in other countries,
where it has been noted as a potential social-innovation tool for empowerment and transformation
[19].
      Therefore, FFSs mandate more sustained work on the adoption of the proposed technologies
and practices. As in any adoption process, FFSs require a good methodological framework together
with highly motivated participants and a professional facilitator team [20–22]. FFSs comprise three
methodological phases: (i) experiential learner-centered and field-based learning, (ii) observation,
experimentation, analysis, and assessment over a timespan to internalize the agroecological and
socioecological dynamics, (iii) group and individual decision-making and capacity-building [3].
      There is no agreement on how to assess the impact of FFSs. There have been some attempts,
mainly focused, however, on measuring farmers’ knowledge of pest management [7,22]. Many
authors who have been connected with FFS are concerned about the sustainability of FFS impacts;
they also agree on the need to assess the longer-term effects of FFSs [3,5,6].
      Such FNS-oriented FFSs were implemented by INFOP-UNICAM and the Universidad
Politécnica de Madrid (UPM) from 2005 to 2010 at San José de Cusmapa (Nicaragua). The main goals
of these FFSs were: (1) improve food and nutrition security; (2) promote techniques to conserve
natural resources; and (3) enhance socioeconomic welfare.
      Given these identified needs, the main objective of this paper is to evaluate long-term FFS
impacts on sustainability and food-security indicators in Nicaraguan mountain peasant
communities. Another related objective is to evaluate the technology adoption process in terms of
type of technology and time to adoption.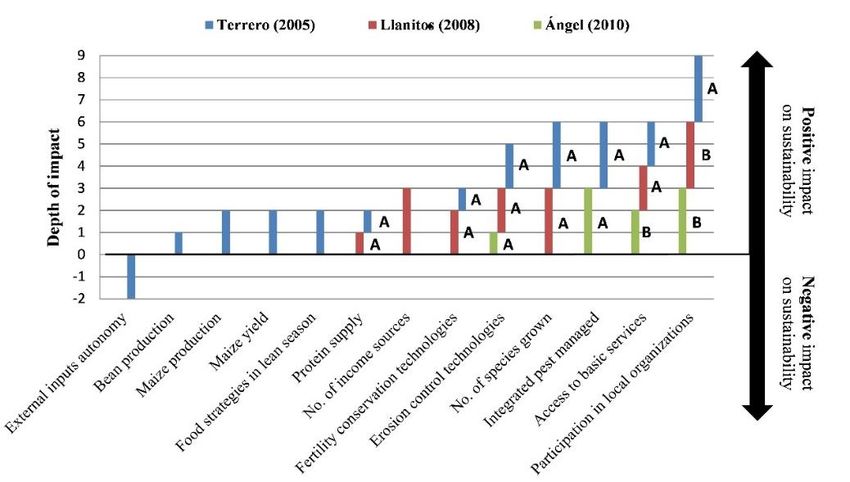
Sustainability 2018, 10, 3020                                                                     3 of 24

2. Material and Methods

2.1. Description of Study Area
      Three communities of San José de Cusmapa (Nicaragua) were selected in this study: Terrero,
Llanitos, and Ángel 2. They are surrounded by undulating topography with slopes ranging from 15%
to 20%. The climate is dry-tropical with an average annual rainfall ranging from 1200 to 1400 mm,
falling mainly from May to September (five months) and an annual mean temperature of 27 °C
(Figure 1).

                       Figure 1. Map of the study area located in Nicaragua (Central America).

     Agricultural soils should be used with care given that they are shallow (with a depth of less than
40 cm) [23]. Today, land in Nicaragua is mainly used for arable and cattle farming (86%), and the
remaining land area is occupied by forests (12.5%) and urban areas (0.5%). Poor agricultural practices
on sloping lands cause severe soil erosion and landslides [24].

2.2. Methodological Frameworks and Data Collection
      During the FFSs implementation, more or less all the family members of 20 to 25 households
participated in the program. Farmers attended FFSs for eight to nine months, after which local
institutions implemented a follow-up process. They met from two to four times a week on a learning
plot (temporarily loaned by one of the participants) in order to exchange experiences on crop
management based on integrated pest management (IPM), analyze the agroecological system, and
discuss soil- and water-conservation techniques. The FFS covers the entire cropping season for the
selected crops (mostly grains and vegetables), interspersed with cross-cutting sessions addressing
nutrition and hygiene, marketing, and leadership issues [25].
      There is no agreement on how to assess the impact of FFSs, not even when integrated pest
management is the key issue [3]. However, the complexity of farming-activity forces to the adoption
of a holistic approach to sustainability assessment [26]. There are tools that assess sustainability,
understood as the ability of a system to maintain and improve its essential functions over time [27,28].
In this study, we selected the Framework for Assessing the Sustainability of Natural Resource
Management Systems (MESMIS, the acronym in Spanish) [29] to evaluate the impact of FFSs on the
sustainability and FNS of mountain peasant-farming systems. According to MESMIS, the steps are:
(i) characterize communities, including their socioenvironmental context; (ii) identify and derive the
Sustainability 2018, 10, 3020 4 of 24
critical points and indicators according to FFS-promoted practices and technologies, considering the
environmental, socioeconomic, and food/nutrition areas of evaluation; and (iii) develop, measure,
and monitor the resulting indicators.
The MESMIS is a systemic framework that, unlike those used by other authors such as Allen
[28], highlights the bottom–up approach. In our study, the indicators were agreed with the specialist
team and with the farmers. All the indicators were selected through participatory methodologies
(Participatory Rural Appraisal (PRA) and community surveys) and were aligned with the objectives
of the FFSs. Nevertheless, although obtaining indicators was not the ultimate goal of the study, the
measurement and monitoring of these is a key factor in order to give recommendations to all the
agents involved [30].
According to this methodological design, three types of results can be analyzed and compared:
(a) results for the participants from the three communities, which included farmers that had
participated in FFSs in three different years; (b) results for the nonparticipants from these three
communities; and (c) results for the two groups—participants and nonparticipants—in each of these
communities.
2.2.1. Data Collection
Data were collected in 2013, and 67 semistructured household surveys were taken in each of the
three communities for participants and nonparticipants. Figure 2 specifies the year in which farmers
from the three communities attended FFSs, the time interval elapsed since they completed the FFSs,
and the year in which data were collected: Terrero (2005, 8 years), Llanitos (2008, 5 years), and Ángel
2 (2010, 3 years).
Figure 2. Dates of farmer field school (FFS) implementation and data collection.
We used nonprobability sampling, which requires previous knowledge of the population for
sample stratification. This sampling method does not use random selection, and relevant
characteristics (quotas) were used to segregate the sample to improve its representativeness.
Following Rodriguez Osuna [31], we selected geographical and functional quotas (i.e., FFSs
participants and nonparticipants). According to Morales Vallejo [32], the sample size had a
confidence level of 95% and a margin of error of 0.08. It contained 20 out of the 42 households (9
participant and 11 nonparticipant families) in Terrero; 24 out of the 64 households (15 participant and
9 nonparticipant families) in Llanitos, and 23 out of the 60 households (11 participant and 12
nonparticipant families) in Ángel 2. All indicators were calculated from information derived from
the survey, and these data were measured for each household.
2.2.2. Characterization of the Communities
Terrero, Llanitos, and Ángel 2 are three communities in San José de Cusmapa (Nicaragua) and
are representative of the mountain-farming systems in the region, where arable and livestock farming
are the main economic activities, have risk of soil erosion, and mainly use family labor [33] (Figure
3). The three communities have identical socioeconomic characteristics. Families are usually rather
large, with an average of 6.5 persons per household and 2.8 children under 15 years. Due to the
steepness of the area, the population is spread across the region (only 19% is concentrated in theSustainability 2018, 10, 3020 5 of 24
county seat), and farmers spend an average of 40 min walking from their house to their plot [34]. The
7662 inhabitants of San José de Cusmapa are considered Chorotegas, and they occupy a territory
officially and traditionally considered indigenous [35]. Although they have foregone some cultural
practices in their daily lives and land-management systems, the cultivation of landraces of beans and
sorghum, and community resources management are still distinctive of the region [36]. The farmers
in this region are peasants that commonly hold diversified and small-scale farms employing family
labor and mostly producing subsistence products like maize, beans, and sorghum using
intercropping practices [37]. All families work their own land (5.3 ha), but some households rent an
average of 0.34 ha.
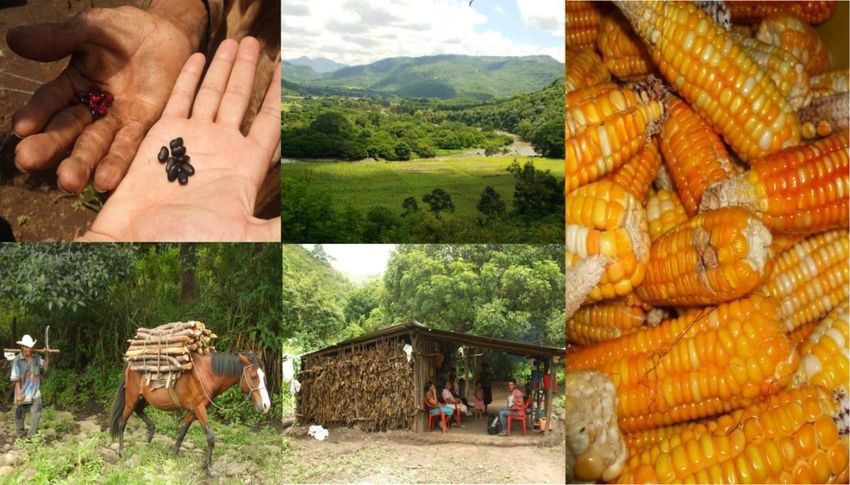
Figure 3. Landscape, crops, and livelihood of mountain peasants in Nicaragua.
There are two growing seasons: the primera season is the first and extends roughly from May to
July, and the postrera season runs from August to November. Maize is only grown in the primera
season and is sown between May and June using an espeque (a hand-piece built with a metal tip
attached to a wooden stick that is used to make the hole). Depending on the community’s altitude,
maize might be sown in dry soil (hot places) or after the third consecutive rain. Many farmers
consider the moon’s phases to ensure a better crop-root hold. Beans are grown twice a year. During
the primera season, beans are sown together with sorghum, and several days after the maize is sown.
The maize stems are bent when the first season of beans is harvested manually at the end of August.
The second season of beans is sown in September after the heat wave period (canícula). Maize is
harvested manually in November. Postrera beans are harvested in December, and sorghum is
harvested in February (seven to eight months after establishment) (Appendix A). Weeding is
performed before sowing either with synthetic agrochemicals (glyphosate) or manually. Around 50%
of farmers fertilize by applying from 65 to 130 kg ha−1 of 18:46:00, 15:15:15, 20:20:20 or urea and from
390 to 520 kg ha−1 of compost. Some farmers apply vermicompost, but it is usually sold. From 17% to
50% of farmers conduct pest management by applying from 60 to 500 cc ha−1 of cypermethrin or
pyrethroids.
All families raise poultry in their backyards but only 25% raise larger animals (Figure 3). Most
households (83.6%) depend on seasonal migration (working as coffee harvesters in Honduras for one
or two months) as a source of income. This extra income is spent on buying food that they cannot
produce, such as salt, sugar, milk, and cloth and agricultural inputs. As a result, any coffee-related
external driver (e.g., price fluctuation and rust epidemic) has an impact on these systems by varying
the demand for hired labor and therefore the source of supplementary income for many of the
households.Sustainability 2018, 10, 3020 6 of 24
2.2.3. Derivation of Indicators According to FFS Implementation
The derivation of indicators is part of the evaluation process, and their development is therefore
based on the identification of critical points, while always maintaining a direct relationship with the
general attributes of sustainability [29]. According to MESMIS, sustainability is defined by seven
general attributes: productivity, stability, reliability, resilience, adaptability, equity, and self-reliance.
Sustainability attributes are translated into diagnostic criteria that, at the same time, connect
indicators with identified critical point of the system (Table 1). As the critical points were identified
before the FFS projects were implemented, this study focuses exclusively on the identification,
measurement, and monitoring of specific indicators so as to understand the impact of the FFS in each
community over time [25,38]. The FFSs implemented in our three communities had three main
objectives: (1) improve all three dimensions (availability, access, and utilization) of food and nutrition
security; (2) promote techniques of natural-resources conservation in order to increase the
environmental capital, and (3) enhance socioeconomic welfare. All three objectives are shown in the
area of evaluation shown in Table 1. Some 28 indicators were developed and classified by area of
evaluation: 13 food-and-nutrition, seven environmental, and 11 socioeconomic indicators. FNS
should be considered as a key and holistic issue for peasant-farming-system sustainability, whereas
the socioeconomic, institutional, and environmental context are outcomes and drivers that feed the
whole system [39].
Table 1. General attributes considered to derive the sustainability indicators in a highland peasant-
farming system in San José de Cusmapa (Nicaragua).
General Diagnostic Area of
Critical Point Indicators
Attributes Criteria Evaluation *
Maize production FNS
Low productivity Bean production FNS
Sorghum production FNS
Productivity Productivity and
Maize yield En
efficiency
Bean yield En
Low efficiency
Sorghum yield En
Benefit-to-cost ratio E
No. of species grown En, FNS
Stability Low agrodiversity
No. of animal species bred E, FNS
Resilience Diversity
Limited economic
Reliability No. of income sources E, FNS
diversity
Protein supply FNS
Critical food
Energy supply FNS
strategies
Food strategies in lean season FNS
Erosion control technologies En
Fertility conservation
Capacity of Limited technology En
Adaptability technologies
change adoption (adaptation
Integrated pest management
mechanism) En
(IPM)
Level of theoretical knowledge S
Alternative Off-farm income
E
economic activities representativeness
Engel coefficient (proportion of
Low food equity FNS
income spent on food)
Inappropriate soil
Forest cover En
use
Equity Equity
High production
Production costs E
costs
Limited access to Female participation S
basic services Access to basic services S
Organizational Irregular food self- Maize self-sufficiency FNS
Self-reliance
autonomy and sufficiency Bean self-sufficiency FNSSustainability 2018, 10, 3020 7 of 24
decision-making Sorghum self-sufficiency FNS
power Poor external input
External input autonomy E
autonomy
Participation in local
Low collectiveness S
organization
* FSN: Food and Nutritional Security; En: Environmental; E: Economic; S: Social.
I. Productivity
Seven indicators were chosen to evaluate the productivity and efficiency of the systems as
follows: (i) maize, (ii) bean, and (iii) sorghum production, all expressed as kg person−1year−1. These
indicators are also measures of food availability, because availability is mostly equivalent to
production in subsistence farming systems. We also measured: (iv) maize, (v) bean, and (vi) sorghum
yield, all expressed as Mg ha−1, and (vii) benefit-to-cost ratio (only maize and bean) that establishes
the ratio of production cost and opportunity costs (family labor and seed price) to income received
from the sale of staple grains at market price. First, the benefit-to-cost ratios of maize and bean were
calculated separately. Second, each value was multiplied by the proportion of land used to cultivate
each crop in order to yield the overall ratio.
II. Resilience, stability and reliability
Numerous studies document that agrodiversity is linked with the resilience, stability, and
reliability of agroecosystems when abrupt and structural changes occur [28,40,41]. According to FAO,
[42], resilience is defined as “the ability of a system, community, or society exposed to hazards to
resist, absorb, accommodate to, and recover from the effects of a hazard in a timely and efficient
manner, including through the preservation and restoration of its essential basic structures and
functions”. In peasant-farming systems, resilience is maintained through the conservation of base
resources and agrodiversity [43–45]. Biological and economic diversification is considered a key
strategy for overcoming many of the food emergencies faced by developing countries and rural
contexts [46]. Three indicators were selected as follows: (viii) number of agricultural species in
cultivation, (ix) number of animal species bred, and (x) number of income sources. As regards the
latter indicator, the sale of staple grains is only taken into account when farmers state that this activity
is a regular source of income because crops are sold as an option and not as a need.
III. Adaptability
Adaptability is an attribute of sustainability related to the capacity of change in a system.
Adaptability is reinforced through the learning processes that give to the communities the ability to
innovate and empower themselves [43–45]. Such capacity of change could be generated by the actual
system as a mechanism or strategy of adaptation, or could be induced by external agents through one
or more technologies in order to address a particular problem.
On this basis, eight indicators were chosen as follows: (xi) Protein supply is expressed as g
protein caput−1day−1, and (xii) energy supply as Kcal caput−1day−1. Both were calculated as the sum of
protein supply or energy supply from daily food intake (maize, bean, sorghum, coffee, rice, and meat)
and divided by the number of people living in each household (counting adults and children). (xiii)
Food strategies in lean season are expressed as a coefficient ranging from 0 to 1 and are calculated
according to farmer survey responses as a qualitative variable (Table 2). Households often adopt
several food strategies; the value of the indicator was calculated as the average in these cases.Sustainability 2018, 10, 3020 8 of 24
Table 2. Standardized scale according to farmers’ responses w.r.t. quantitative indicators.
Quantitative Indicators Variable Status Standardized Scale
Food strategies in lean season
1: Do not experience lean season 1
0.75: Eat a food substitute 0.75
0.5: Reduce food intake 0.5
0.25: Stop eating a foodstuff 0.25
0: Fast for part of the day 0
IPM
At least 2 IPM with no chemical treatment 1
At least 2 IPM with chemical treatment 0.75
One IPM with no chemical treatment 0.5
One IPM with chemical treatment 0.25
Only chemical treatment 0
No IPM and no chemical treatment --
Access to basic services
Tap 1
Water system Well 0.5
River 0
Yes 1
Electricity system
No 0
Latrine 1
Sanitary system Septic tank 0.5
No 0
(xiv) Erosion control technologies were calculated as the sum of the techniques adopted by
farmers in order to improve soil retention and conservation. In the surveys, we considered five types
of techniques: live barriers (trees or vegetation), dead barriers (stones or wood fences), terraces, dikes,
and stubble maintenance (mulch). (xv) Fertility-conservation technologies were calculated as the sum
of the techniques adopted in order to improve soil fertility. A total of six techniques were considered:
intercropping, rotation, organic manure, stubble incorporation, biofertilizer, and not burn. (xvi) IPM
is expressed as a coefficient ranging from 0 to 1 and is calculated according to farmer survey
responses (Table 2). We considered five pest-control techniques: traps, natural pesticides or
insecticides, intercropping, trap crops, and postharvest care. All the participants took a test on their
field knowledge before and after FFS implementation.
Farmers should have put most of the issues into practice over years, so the test was repeated in
2013 to reassess their knowledge level. This was measured by the indicator: (xvii) level of theoretical
knowledge expressed as a score ranging from 0 to 10 and calculated using the corrected test. There
were 20 questions each with three possible choices. Finally, (xviii) off-farm income representativeness
is expressed as a percentage and calculated as the proportion of off-farm income over total perceived
income.
IV. Equity
Regarding the measure of equity, five indicators were taken into consideration. (xix) The Engel
coefficient is expressed as a percentage and indicates the proportion of income spent on food. It was
calculated as the price of the standard food basket in Nicaragua divided by the per capita GDP [47]
Forest cover is expressed as a percentage and calculated considering the forest area (i.e., coniferous
forest and perennial crops (coffee and fruit trees)) with respect to the total land area per household.
(xxi) Production costs are expressed as NIO ha−1 including hired labor, land rental, and input costs.
(xxii) Female participation is expressed as a percentage and calculated as the proportion of women
participating in every FFS. (xxiii) Access to basic services is expressed as a coefficient ranging from 0
to 1 and is calculated according to farmer survey responses (Table 2). It accounts for three types of
basic services (water, electricity, and sanitation systems), and the value of the indicator is calculated
as the average.Sustainability 2018, 10, 3020 9 of 24
V. Self-reliance
Non-self-reliance in a peasant-farming system could cause economic problems if there is no
social capital in order to set up control measures or offset the risks faced by farmers who are more
dependent on external inputs. The indicators explaining this situation are: (xxiv) maize self-
sufficiency, (xxv) bean self-sufficiency, and (xxvi) sorghum self-sufficiency, all expressed as a
percentage and calculated as kg crop−1 produced divided by kg crop−1 eaten. (xxvii) External input
autonomy is expressed as NIO ha−1 and accounts for external agrochemical products (fertilizer,
herbicides, and pesticides), as well as improved maize and bean seeds. (xxviii) Participation in local
organization is expressed as the number of projects or local associations in which any member of the
family is involved.
The impact of FFSs is measured using the indicators listed in Table 1. The list includes direct and
indirect indicators. Direct indicators measure the impact based on their real value (i.e., production,
protein supply, or participation). Indirect indicators measure the impact according to the level of
adoption of management technologies (i.e., erosion, fertility, IPM) or nutrition strategies (i.e., food
strategies in lean season, or number of animals). In the same way, there are qualitative and
quantitative indicators; therefore, Table 3 shows how the optimal values of each of them has been
considered.Sustainability 2018, 10, 3020 10 of 24
Table 3. Optimal values for the 28 sustainability indicators according to the source literature and survey responses for three communities in San José de Cusmapa
(Nicaragua)
Indicators Units Optimum Based on Source
Maize production kg caput−1 274.00 Maize consumption in subsistence systems References [40,48]
Bean production kg caput−1 36.00 National bean consumption in rural areas Reference [49]
Maximum production of sorghum harvested
Sorghum production kg caput−1 209.37 Survey
across communities
Maize yield Mg ha−1 1.30 Average maize yield in Nicaragua Reference [50]
Bean yield Mg ha−1 0.65 Average bean yield in Nicaragua Reference [50]
Sorghum yield Mg ha−1 1.30 Maximum yield achieved across communities Survey
Benefit-to-cost ratio coefficient 2.50 Farmer and other similar surveys Reference [40]
No. of species grown number 12.00 Farmers PRA
No. of animal species bred number 2.50 Farmers PRA
No. of income sources number 5.00 Farmers Survey
Protein supply g caput−1day−1 52.00–70.00 Nicaragua’s average dietary protein supply [51,52]
Energy supply kcal caput−1day−1 1900–2249 Nicaragua’s average dietary energy supply [53]
Food strategies in lean season * 1.00 Specialist team and researchers Table 2
Erosion-control techniques no. of adopted techniques 5.00 Specialist team Survey
Fertility-conservation techniques no. of adopted techniques 6.00 Specialist team Survey
Integrated pest management * 1.00 Specialist team Table 2
Level of theoretical knowledge score 10.00 Specialist team Test
Off-farm income representativeness % 50.00 Farmers Survey
Proportion of income spent on food % ≤35.20 Nicaragua’s Engel coefficient [54]
Forest cover % 96.00 % of land suitable for forest in SJC [55]
Production costs NIOα ha−1 813.98 Minimum value reported in communities Survey
Female participation % of women 50.00 Farmers and specialist team PRA
Access to basic services * 1.00 Researchers Table 2
Maize self-sufficiency % 100.00 Maximum reported value Survey
Bean self-sufficiency % 100.00 Maximum reported value Survey
Sorghum self-sufficiency % 100.00 Maximum reported value Survey
External input autonomy NIO ha−1 437.93 Minimum reported value across communities Survey
Participation in local organizations no. of organizations 3.00 Farmers Survey
(*) See Table 2 for further explanation of units; PRA: Participatory Rural Appraisal. SJC: San José de Cusmapa. (α) ISO code for the currency of Nicaragua. 1 NIO ≈
0.03328 EUR.Sustainability 2018, 10, 3020 11 of 24
2.2.4. Standardization of Indicators
A range of factors governs the inherent sustainability of any community and any household. On
this ground, it is difficult to determine many of these factors and agree upon their optimum ranges
[56]. In order to compare the impact of the FFS in each community using sustainability indicators and
facilitate the assessment of the three areas of evaluation, the variables were standardized by
transforming each indicator to a relative scale of 0–100, where 100% is the highest and 0% is the lowest
sustainability value. By adjusting values expressed in different units to a common scale, indicators of
different types or complexity can be integrated. Subsequently, the indicators are compared to a
likewise standardized optimal value. Baseline values were taken from the source literature and/or
agreed on by the evaluation team and farmers (Table 3).
2.2.5. Statistical Analysis
Three statistical comparison analyses were conducted (Statgraphics CENTURION vers. XVI).
The first two were: (1) among participants from all three communities, and (2) among nonparticipants
from all three communities. In both cases, data were subjected to analysis of variance (ANOVA) and
means were compared using an LSD test. For the third analysis, we applied a t-test to test for the
significance of the difference between means for two independent samples (participants and
nonparticipants in each of these communities).
3. Results and Discussion
FFSs have had an indisputable impact in the community of Terrero. The values of most of the
indicators (25 out of the 28 indicators) are better for Terrero participants than for the participants
from the other communities; the improvement is statistically significant for 13 indicators (Table 4).
This confirms the hypothesis that the sustainability and FNS of peasant-farming systems should
steadily improve after participation in FFSs, which is the objective of such programs.
On the whole, FFS implementation has, little by little, led to a significant increase in most of the
indicators related to peasant-farming-system productivity and efficiency. There has also been a
steady and significant, albeit less pronounced, increase in economic diversification. We find that the
Terrero participants, who graduated from the FFSs eight years ago, have significantly larger sources
of income than Llanitos participants, who graduated five years ago, and Angel 2 participants, who
graduated three years ago. More economically diversified households depend less on income from
external labor. This shows that livelihood-diversification strategies are correlated with labor-market
changes, and increased diversification helps to boost household adaptability [57].
There is a gradual but significant drop in off-farm representativeness. The sources of almost all
cash income in the communities of both Ángel 2 and Llanitos are external, 90% and 77%, respectively.
There has been a quantum leap in Terrero, however, where over 60% of income comes from the sale
of on-farm production. The increase in family purchasing power through on-farm productive
resources is confirmation of the FFS-mediated shift from subsistence farming to transitional
agriculture, as has already been witnessed in other regions of Latin America and the Caribbean (LAC)
[58,59]. The level of theoretical knowledge and access to basic services also undergo a steady and
significant improvement (Table 4).Sustainability 2018, 10, 3020 12 of 24
Table 4. Mean of the 28 indicators for FFS participants and nonparticipants for three mountain peasant-farming communities in Nicaragua.
Terrero (8 Years) Llanitos (5 Years) Ángel 2 (3 Years)
Indicators
FFS Participants Nonparticipants FFS Participants Nonparticipants FFS Participants Nonparticipants
Maize production (kg caput−1) 236.63 A ** 133.29 a ** 90.11 B 104.52 a 119.72 B 85.26 a
Bean production (kg caput−1 458.14 A* 141.56 a* 113.12 B 122.41 a 130.05 B 83.00 a
Sorghum production (kg caput−1) 183.54 A 209.37 a 76.76 B 35.57 b 142.44 AB 139.23 a
Maize yield (Mg ha−1) 1.40 A ** 0.89 a ** 0.69 B 0.89 a 0.66 B 0.57 a
Bean yield (Mg ha−1) 1.07 A 0.84 a 0.57 B 0.67 a 0.73 B 0.54 a
Sorghum yield (Mg ha−1) 1.21 A 1.30 a 0.97 A 0.86 a 0.80 A 0.90 a
Benefit–cost ratio 1.67 A 1.57 a 1.02 B 1.13 ab 0.85 B 0.89 b
No. of species grown 12.56 A *** 5.82 b *** 11.47 A *** 6.89 b *** 12.00 A 10.83 a
No. of animal species bred 1.55 1.27 1.39 1.21 0.82 0.95
No. of income sources 5.11 A 3.91 a 4.47 AB *** 2.22 b *** 3.09 B 2.58 ab
Protein supply (g protein caput−1day−1) 73.82 A* 56.74 a* 69.76 A* 53.82 a* 71.78 A 62.46 a
Energy supply (kcal caput−1day−1) 2012.17 A 1670.33 a 1927.94 A 1552.16 a 1937.57 A 1604.77 a
Food strategies in lean season * 0.67 A ** 0.46 a ** 0.52 A 0.46 a 0.60 A 0.50 a
Erosion control (no. of techniques) 3.22 A ** 2.09 a ** 3.40 A ** 2.22 a ** 2.64 A* 1.75 a*
Fertility conservation (no. of techniques) 3.00 A* 1.73 a* 3.27 A ** 2.11 a ** 2.55 A 1.92 a
Integrated pest management * 0.47 A *** 0.03 a *** 0.32 A 0.16 a 0.58 A *** 0.19 a ***
Level of theoretical knowledge (score) 6.87 A -- 5.48 AB -- 5.40 B --
Off-farm income representativeness (%) 44.00 A 53.00 a 77.00 B 87.00 b 90.00 B 84.00 b
Proportion of income spent on food (%) 46.00 A 61.00 a 66.00 A 56.00 a 57.00 A 46.00 a
Forest cover (%) 53.00 A 53.00 a 54.00 A 47.00 a 47.00 A 49.00 a
Production costs (NIO ha−1) 2691.73 B 2099.42 a 1220.46 A 813.98 a 1399.87 A 1165.03 a
Female participation (% of women) 32.00 -- 32.26 -- 50.00 --
Access to basic services * 0.96 A ** 0.73 a ** 0.90 A* 0.80 a* 0.73 B ** 0.49 b **
Corn self-sufficiency (%) 95.00 A 92.00 a 85.00 A 82.00 a 87.00 A 84.00 a
Bean self-sufficiency (%) 100.00 A 89.00 a 97.00 A 100.00 a 90.00 A 79.00 a
Sorghum self-sufficiency (%) 89.00 A 91.00 a 57.00 B 75.00 a 100.00 A 90.00 a
External input autonomy (NIO ha−1) 1749.79 B ** 692.86 a ** 892.69 A 437.93 a 567.41 A 656.02 a
Participation in local organizations (no. of
3.00 A *** 0.91 a *** 1.93 B *** 0.78 a *** 1.91 B *** 0.58 a ***
organizations)
N (number of households) 9 11 15 9 11 12
Capital letters: Significant differences between participants from different communities. Small letters: Significant differences between nonparticipants from different
communities. (*) Significant difference at p < 0.1 between participants and nonparticipants within the same community. (**) Significant difference at p < 0.05 between
participants and nonparticipants within the same community. (***) Significant difference at p < 0.01 between participants and nonparticipants within the same
community.Sustainability 2018, 10, 3020 13 of 24
3.1. The Effect of FFSs over Time
Although FFSs did not affect all indicators equally (not all beneficiaries were equally affected
either, but, as we are using means, we consider the performance of each community as a whole), the
results provide evidence that the promoted management technologies were successfully and steadily
adopted. This means that the FFSs were well-designed and adapted to the context, were manned by
a competent team of facilitators and had motivated and willing participants [3,21,22].
There are indicators that show signs of improvement sooner than others, which makes the
impact of the FFSs easier to measure. The analysis of variance of the participants and nonparticipants
in each of the three communities reveals that there are significant differences for 12 out of the 25
analyzed indicators in the community where the FFSs were first-implemented (Terrero) (Table 4,
Figure 4). Significant differences were found for seven out of the 25 indicators in the community
where the FFSs were implemented next (Llanitos), whereas they were observed for only four
indicators in Ángel 2 (Table 4, Figure 4).
Figure 4. Impact of FFSs in three Nicaraguan mountain peasant-farming communities over time
(Legend Figure 4: A and/or B: Significant difference between participants from different communities
for each indicator).
Figure 4 plots the 13 indicators that show significant differences between the participants and
nonparticipants from the three analyzed communities against depth of impact. For each indicator,
the impact is cumulative if it expresses significant differences in two or all three communities. We
have calculated the depth of impact of each indicator as the sum of the level of statistical significance,
allocating three units when p < 0.01 (***), two units when p < 0.05 (**), and one unit when p < 0.1 (*).
Impact significance can be interpreted taking into account several criteria: (i) breadth, (ii)
longevity, and (iii) depth. Breadth is related to the number of communities that exhibit significant
differences for a specific indicator. The breadth is high for the participation in local organizations,
access to basic services and erosion-control-technologies indicators as there are significant differences
in all three communities (Figure 4). Breadth is less for the number of species grown, protein supply,
and fertility-conservation-technologies indicators, as there only appears to have been an impact in
the communities where the FFSs were implemented longer ago (Terrero and Llanitos). Breadth is
very low for the external input autonomy, maize production, corn yield, bean production, and food
strategies in lean-season indicators, as no significant differences were found until five years after
implementation.Sustainability 2018, 10, 3020 14 of 24
Longevity refers to continued significance after a time has elapsed since FFS implementation.
This is a potentially cloudy issue, as it is based on ruling out any transfer process within the
community. This goes against the aim of FFSs which is to spread their influence as far as possible
among participants and nonparticipants. However, allowing for possible bias, the most long-lived
indicators are: integrated pest management (it is long-lived in Terrero, not so long-lived in Llanitos,
and then long-lived again in Ángel 2), and number of income sources (which is not so enduring in
Terrero). We cannot measure longevity of indicators with low breadth.
Finally, the depth is determined by a summation of significance. The indicators with the deepest
impact were: participation in local organizations, integrated pest management, number of species
grown, and number of income sources as their difference is very significant (***). Depth is moderate
for the indicators that express a significant difference of two units (**) like maize production or food
strategies in lean season, and the depth of impact is considered too low when there is a one-unit
significant difference (*), as is the case of protein supply or bean production.
3.2. Controversies Surrounding FFS Impact
Despite these signs of overall improvement, the results for two indicators, namely, production
costs and external input autonomy, are worse among participants than nonparticipants. There are
also significant differences for external input autonomy between Terrero and the other two
communities. This indicator is plotted inversely in Figure 4 because it has a negative impact on
sustainability.
Analyzing these two indicators, we find that Terrero participants (2005) have 2.2 and 1.9 times
more production costs than Llanitos (2008) and Ángel 2 (2010) participants, respectively.
Nonetheless, these same farmers produce 3 and 2.25 times more staple grains than their counterparts
in the other communities. This reveals that, generally speaking, higher production could be linked to
higher costs, highlighting that the adoption of technologies for sustainable farming systems
sometimes means making trade-offs [60]. Additionally, the trend for the external input autonomy
indicator is the same as for production costs (Table 4). However, this trend does not hold in relative
terms (ratio of production costs to external inputs). Terrero participants allocate 65% of their
production costs to external inputs (mostly fertilizers, herbicides, and pesticides), compared to 73%
for Llanitos and 40.5% for Ángel 2. The fact that the Llanitos community allocates more production
costs to external inputs can be explained by its proximity to the county seat (0.5 km instead of 7.6 km
for Terrero and 4.4 km for Angel 2) where these products are easier to acquire.
Looking at the significance of the data, however, we can single out two behaviors: one related
to labor and the other related to resources. On one hand, we can assume that FFSs cause community
labor to be substituted with external inputs, as is the case in Terrero. This may be prompted by a
shortage of available labor or a high opportunity cost caused by there being other better-paid sources
of temporary employment, as occurs in other peasant-farming regions of Central America [43,61,62].
On the other hand, it is often necessary to resort to external fertilizers, as the addition of on-farm
stubble or vermicompost is not sufficient to achieve acceptable yields for systems with limited
resources (soil, slope, climate) [50]. In this respect, as in other LAC regions, the industrial agriculture
that is pursued in the region demands manure and organic materials, thereby creating a market.
Smallholders take advantage of this market to sell some of their manure, thereby reducing the sources
of nitrogen of the mountain agroecosystem [63].
This is a potential weakness of FFSs considering that one of their objectives is to increase
productivity through the use of local resources without increasing the use of external inputs [60].
Taking into account the positive results for the indicators related to management practices (erosion-
control technologies, fertility-conservation technologies, and integrated pest management) among
FFS participants, however, we can conclude that the peasant-farming strategy combines the use of
local and external resources. In this respect, it is not unusual to find opposing peasant-farming
strategies in operation side by side: The same smallholder, region, locality, or household applies
communal vs. private access, agricultural systems with low vs. high industrial inputs, or
monocultures vs. highly diverse polycultures [64]. This idea is consistent with the findings of otherSustainability 2018, 10, 3020 15 of 24
studies that clearly point out that changes in management practices call for trade-offs. It also
constitutes further evidence of the complexity of peasant agroecosystems and how hard it is to
develop alternative management strategies to improve the overall sustainability of a system [65]. This
finding is of utmost importance as it highlights that no ‘cure-all’ management option exists [43].
Apart from the conflicting peasant-farming scenarios, note also the heterogeneity and
differences across households and production systems as other recent studios show [66]. For
example, three of the farmers from Terrero could be classed as having embraced the agroecological
model in terms of their nutrient-reusing capacity, their soil conservation, and integrated pest-
management knowledge, and, consequently, their relative independence from external inputs and
activities.
3.3. The Impact of FFSs on Sustainability as a Whole
Figure 5 shows three radar charts, each of which corresponds to one of the areas of evaluation:
food security, socioeconomic, and environmental (Figure 5 Appendix B). Each chart plots the results
for all indicators; each indicator value is compared against the optimal value previously established
in Table 2. All indicator values were calculated considering the average indicator value for FFS
participants and nonparticipants in each of the three analyzed communities.
From the viewpoint of food and nutrition security, sustainability is represented by 12 indicators
(Figure 5, top). Although FNS has three mainstays (availability, access, and utilization), most of the
indicators in this field refer to availability, as, in subsistence agriculture, FNS primarily depends on
local production [67]. Availability includes the production, self-sufficiency, and diversity indicators.
The access component is determined by the food strategies in lean-season and Engel-coefficient
indicators. Availability is also evaluated by means of energy supply and protein supply. Terrero
(2005) achieves optimal values for more or less six indicators and outperforms the other two
communities on five indicators (Figure 5). The staple grains that supply more carbohydrates per unit
of consumption are, in decreasing order, maize, sorghum, and rice (3410, 3290, and 3160 kcal kg −1).
Unlike rice, all of which is bought, all the communities grow maize and sorghum. Maize self-
sufficiency is almost 100% in Terrero, which explains why it has a higher energy supply than Llanitos
and Ángel 2. Sorghum is a different matter, as it is a substitute food for maize. The fact that Ángel 2
is 100% self-sufficient in sorghum production is positive from the nutritional viewpoint; however, it
leads us to think that it is also the community with the biggest maize shortage. This limits food
choices or preferences related to the access to certain foods [68,69].
Ángel 2 is the community where the FFSs were implemented most recently. It is near optimal
with respect to agroecological diversity where it outperforms Llanitos and Terrero (8.8 and 9.7 crop
species, respectively). Although far from optimal (35.2%), the proportion of total income spent on
food (measured by the Engel coefficient) in Ángel 2 is 51.23%, less than for Terrero (54.06%) and
Llanitos (62.71%). This coefficient is usually calculated at national level and assumes that as a nation
gets richer, consumers spend more on food, albeit proportionally less than the increase in their
income [70]. One consequence of Engel’s law is that agriculture’s share in the GDP falls as a country
becomes wealthier because the demand for food does not grow at the same rate as national revenue
[71].
Bean production is optimal for all three communities; although, in quantitative terms, Terrero
produces 2.4 and 2.7 times more than Llanitos and Ángel 2, respectively. In peasant-farming contexts,
beans are a key source of protein; they account for 21.8% of total protein intake, whereas only 4% to
6% of protein consumed comes from meat. There are no protein deficiencies in any of the
communities, but significant differences were observed between participants and nonparticipants in
Terrero and Llanitos (Table 4, Figure 4). This confirms that the FFS action has promoted the adoption
of healthier eating habits.Sustainability 2018, 10, 3020 16 of 24
FNS INDICATORS
Maize production
100%
Sorghum self-sufficiency Bean production
80%
60%
Bean self-sufficiency Sorghum production
40%
20%
Maize self-sufficiency 0% No. of species grown
Engel Coef. (% of income
No. of animals bred
spent on food)
Food strategies in lean
Protein supply
season
Energy supply
Benefit-to-cost SOCIOECONOMIC
ratio
100%
INDICATORS
Participation in
No. of animals
local 80% bred
organizations
60%
40%
External inputs No. of income
autonomy sources
20%
0%
Level of
Access to basic
theoretical
services
knowledge
Off farm income
Female
representativenes
participation
s
Production costs
ENVIRONMENTAL
Corn yield
100%
INDICATOTORS
80%
Forest cover Bean Yield
60%
40%
20%
Integrated pest 0% Sorghum yield
management
Fertility
No. of species
conservation
grown
technologies
Erosion control
technologies
Optimum Los Llanitos El Ángel 2 El Terrero
Figure 5. Sustainability levels of the three communities in the Nicaraguan highlands assessed using
28 indicators and divided by areas of evaluation defined according to FFS objectives.
From an environmental viewpoint, sustainability is represented by eight indicators (Figure 5,
below). This chart again features the number of species-grown indicator, as agrodiversity has an
impact not only on food diversification but also on agroecosystem diversity; this may have a moreSustainability 2018, 10, 3020 17 of 24
important effects in the long term. The other indicators are associated with staple grain yields and
the adoption of technologies related to environmental conservation. Terrero achieves near optimal
maize, bean, and sorghum yields (86%, 100%, and 96%). However, the values of the other indicators
are quite consistent across communities and well below the optimal levels. This is linked to the
significant differences between FFS participants and nonparticipants for indicators associated with
the adoption of technologies for natural resources conservation, such as erosion control, soil fertility
conservation and integrated pest management (Table 4). We found that FFS participants are quick to
adopt these types of technologies but there is no technology transfer to the other farmers in any of
these communities. For example, the values for the adoption of integrated pest management among
nonparticipants are, predictably, very low: Terrero (3%), Llanitos (16%), and Ángel 2 (19%).
From the socioeconomic viewpoint, sustainability is represented by 10 indicators (Figure 5,
center). The values of the economic indicators are better for the Terrero community. Although
production costs for Terrero are greater than for Llanitos and Ángel 2 and farmers in this community
are more dependent on external inputs, it has a higher agricultural benefit-to-cost ratio (1.61). This is
quite a moderate production-efficiency value taking into account that the optimum for such systems
is around 2.5 [40]; however, it is much higher than the ratio for Llanitos (1.06) and the inefficiency of
Ángel 2 (0.87).
The communities differ most as to the social indicators. Again, Terrero is the community that
scores highest for all social indicators, except female participation in FFSs, where women account for
32% of all participants against the 50%, and thus optimal, female participation in Angel 2. Terrero
residents have access to a greater number of basic services (identical to the population of Llanitos).
And it is they that also proved to have more theoretical knowledge in the theory test on what they
had learned at the FFSs, even though Terrero was the first community to participate. This higher test
score confirms continued practical implementation of much of what they had learned at the FFS.
The indicator related to participation in local organizations shows how, as time goes by, the
breadth, depth, and longevity of participation by FFS participants steadily increases. This is not an
isolated phenomenon, as there is a tradition of cooperativism in Nicaraguan communities promoted
by the establishment of rural community associations and organizations, such as radiophonic schools
for popular education. In this respect, the FFSs have not only encouraged their participants to
participate in external programs but also empowered participants to take an active role in their
development and lead their own initiatives. The significant difference between FFS participants and
nonparticipants for this indicator begs the question of whether FFSs are having an impact on most
nonparticipant households or, contrariwise, are indirectly promoting inequity within communities.
Do participant families have greater decision-making power within local organizations leading to
other families being excluded from participation?
FFSs are an extremely valuable tool provided that they are carried out by partners who expertly
contextualize the regional problems, know how to align the political directives and their own
strategies for the good of the people for whom they are working. A holistic approach, which takes on
board social education, is the key to the success of any more technical action. It is important, however,
not to neglect to analyze any resulting inequities together with the identified trade-offs.
4. Conclusions
Over the last decades, sustainability and food and nutritional security have been the subjects of
considerable academic interest and debate in both conceptual and methodological terms. The
persistence of high levels of environmental degradation and food insecurity in many regions has led
to new initiatives aiming to revitalize peasant agriculture and to renewed discussions on the role of
sustainability as an engine of development, environmental conservation, and poverty alleviation.
This paper has evaluated the performance of a renew extension service called Farmer Field
School in three rural communities of the Nicaraguan highlands that emerged out of NGO efforts.
Thanks to the steps marked by the MESMIS framework, which led to the identification of 28
indicators, the analysis has shown that FFSs are valuable tools that promote the sustainability and
food security of farm households over time.Sustainability 2018, 10, 3020 18 of 24
The results for many of the evaluated sustainability indicators improved as time elapsed since
FFS implementation. The comparison between the nonparticipants from all three communities
showed that some technology transfer has taken place. This finding highlights that FFSs, like other
participatory models of extension and research such as farmer-to-farmer programs, are achieving
their objective with regard to technology dissemination and transfer among peasants.
This study demonstrates the potential of FFSs, but more attention will have to be paid to critical
indicators in order to scale up their potential in the future. We observed a direct relationship between
the increase in agricultural production and the use of external inputs, which is a critical point for
sustainable ideals. Production efficiency would also need to be improved (benefit-to-cost ratio values
are very low) by boosting the use of fertility-improvement and soil-erosion technologies. Maize
production is still at critical levels in communities where the FFSs were more recently implemented;
however, this does not translate to deficient energy intakes, as residents consume other substitute
products like sorghum or rice on which they spend part of their income.
Ultimately, the real success of FFSs is as social transformers by empowering the participants to
promote their own development. Farmers will invest in and implement sustainable technologies and
farm practices if they expect the investment to be profitable, if they have the right education,
information, and motivation, and if government policies set clear goals related to other common
goods. We cannot ignore the fact, however, that farmers who attend FFSs are not a product of a
random phenomenon but the cause of self-selection based on their pre-existing conditions and
motivation. Future studies might monitor the evolution of these and other mountain communities to
check whether the effect of the FFSs is sustained over time and whether their positive effects, mainly
FNS transfer and improvement, can be accelerated and extrapolated. This would confirm the fact that
these methodologies facilitate the shift from subsistence farming to sustainable family farming.
Author Contributions: E.A. and C.G. H.D.–A. developed the concept. E.A. designed and performed
experiments, analyzed data and prepared the manuscript. M.A reinforced the manuscript. E.A. and O. M-G.
tested the research strategy and conducted questionnaire interviews. M.A and C.G. H.D.–A. supervised the
research.
Funding: This research was supported by the Universidad Politécnica de Madrid under the program
“Comunidades Rurales del Mileno”.
Acknowledgments: We are very grateful to all of the Nicaraguan families who participated in this work for their
technical knowledge and human values. Thanks to the INSFOP-UNICM team, especially to Ángela Centeno,
who provided us with an excellent logistical operation in the field and with essential feedback. We also thank
Ángel David Flores Domínguez (CIGA) for technical support.
Conflicts of Interest: The authors declare no conflict of interest. The funders had no role in the design of the
study; in the collection, analyses, or interpretation of data; in the writing of the manuscript, and in the decision
to publish the results.You can also read