Budget 2021 Wellbeing and the Measurement of Broader Living Standards in Ireland
←
→
Page content transcription
If your browser does not render page correctly, please read the page content below
Budget 2021
Wellbeing and the
Measurement of Broader
Living Standards in
Ireland

            0
Table of Contents1
Section 1: Introduction ..................................................................................................................... 3
Section 2: Moving from GDP to Wellbeing .................................................................................. 5
    2.1 Defining Wellbeing ...................................................................................................................... 6
Section 3: International Wellbeing Initiatives ............................................................................. 8
    3.1 OECD ............................................................................................................................................ 8
    3.2 National Examples .................................................................................................................... 11
       3.2.1 New Zealand .................................................................................................................................................... 11

       3.2.2 United Kingdom .............................................................................................................................................. 13

       3.2.3 The Netherlands.............................................................................................................................................. 14

       3.2.4 Canada .............................................................................................................................................................. 16

Section 4: Irish Development of Wellbeing Measurement .................................................... 18
    4.1 CSO Wellbeing of the Nation ................................................................................................... 18
    4.2 CSO Survey Modules on Subjective Wellbeing ..................................................................... 20
    4.4 Government Initiatives ............................................................................................................. 21
Section 5: Options for Wellbeing Measurement in Ireland ................................................... 22
    5.1 Dashboard ................................................................................................................................. 22
    5.2 Survey ........................................................................................................................................ 23
    5.3 Composite Indicator ................................................................................................................. 24
Section 6: Conclusion..................................................................................................................... 26
Appendix 1: Summary Table of International Wellbeing Measures.................................... 30
Appendix 2: Summary of Ireland’s Performance on OECD Wellbeing Dashboard ........ 32
Appendix 3: NESC Wellbeing Report 2009 ...................................................................... 33
Appendix 4: Draft Dashboard as per OECD Wellbeing Framework ............................... 35

1The data and analysis set out in this document are compiled by Department of Finance staff. Every effort is made to ensure
accuracy and completeness. When errors are discovered, corrections and revisions are incorporated into the digital edition
available on the Department’s website. Any substantive change is detailed in the online version.

                                                                                        1
Executive Summary
This paper examines the development of wellbeing measures internationally and investigates
the options for introducing a national wellbeing measurement in Ireland. In recent years, the
limitations of economic statistics alone to accurately reflect the wellbeing of a population have
become apparent. Macroeconomic metrics fail to account inter alia for distributional
outcomes, for the preservation of the environment and our natural resources, and for more
subjective outcomes such as a population’s life satisfaction.

As a result of these limitations, many countries have recently developed wellbeing indicators
for use in tandem with macroeconomic statistics in evaluating performance. The OECD’s
biennial How’s Life publication analyses the performance of OECD countries against a
wellbeing dashboard of indicators, under which Ireland receives mixed results.

A spectrum of wellbeing measures in other countries are investigated to determine
international best practise, focusing on New Zealand, the United Kingdom, the Netherlands,
and Canada. These measures all tend to select a wide range of wellbeing variables reflecting
aggregate, distributional, subjective, and objective dimensions of society, similar to the OECD
framework. The means by which those indicators and areas are then summarised, presented,
and tracked through time diverge amongst wellbeing frameworks.

There have been some earlier advances towards wellbeing measurement in Ireland. The
CSO created a dashboard of wellbeing indicators for their Wellbeing of the Nation 2017
publication. They have also conducted survey modules on subjective wellbeing in household
surveys in 2013, 2018, and 2020. This work can be leveraged but may not have the frequency
of data and expansiveness of coverage observed in international best practice.

The options considered here for Ireland to measure and monitor wellbeing are a dashboard
of indicators, a survey, or a composite indicator of wellbeing. These options and their relative
advantages are discussed, with a dashboard the most common international choice.
Ultimately selection will involve the trade-off between the parsimony of the measure and its
accuracy, as well as the resources available for data collection.

This paper contributes to the commitment in the Programme for Government 2020 to develop
new measures of wellbeing. The Department of the Taoiseach will convene a group of experts
from across the public and private sectors to further this development.

                                               2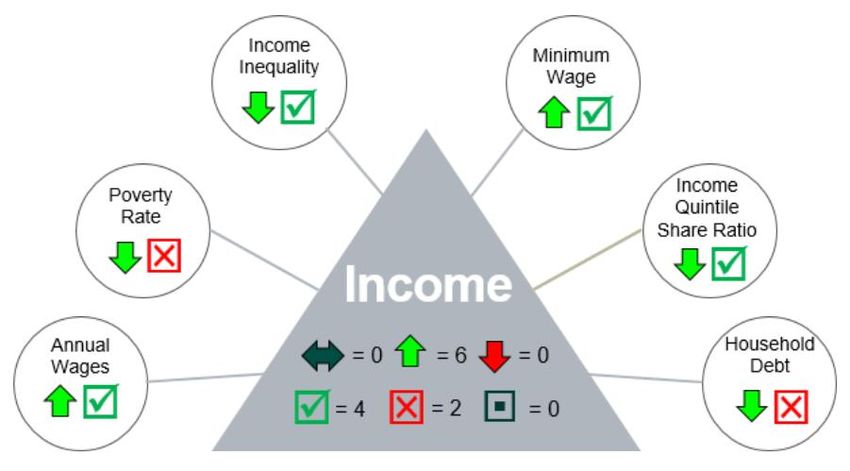
Section 1: Introduction2
In recent years, a growing international consensus has emerged that traditional economic indicators
used to measure a country’s performance, most commonly Gross Domestic Product (GDP), are
insufficient to the task. There is mounting evidence for the need to measure a country’s economic
performance using multidimensional indicators which relate not only to the narrower economic situation,
but to the overall living standards and wellbeing of a country’s population (Stiglitz, et al., 2009; OECD,
2019). This encompasses more than simply income and material living standards, also including, for
example, health, environmental and social wellbeing. 3

The Organisation for Economic Co-operation and Development (OECD) has been a global leader in
bringing wellbeing into the economic and political mainstream. In 2011, it established a framework for
measuring a country’s level of wellbeing, identifying 11 key dimensions through which to analyse
wellbeing on a national scale (OECD, 2013). The OECD has since produced biennial reports on their
member countries’ wellbeing and how they compare to one another across the spectrum of wellbeing
dimensions.4 Likewise, a large number of OECD countries have developed their own internal measures
of wellbeing for use alongside more traditional economic variables. In 2019, New Zealand became the
first government to launch a wellbeing budget (Government of New Zealand, 2019). Several countries
have also linked their measures of wellbeing to their commitment to the United Nations’ Sustainable
Development Goals (SDGs).5

The Government strives to improve living standards in Ireland, and promoting this improvement is one
of the Department of Finance’s objectives. To achieve this, it is necessary to accurately measure living
standards to begin with. This issue is particularly salient in Ireland, where standard indicators of
economic progress (e.g. GDP, GNP, GNI) are distorted by globalisation and increasingly disconnected
from effective trends in living standards.6 Wellbeing has the advantage of encapsulating both economic
and social progress, as well as environmental and health outcomes, and overall quality of life. Its
accurate measurement is therefore crucial to the effective monitoring of policy outcomes beyond
aggregate economic statistics or limited policy-specific targets.

The 2020 Programme for Government has announced the intention to create a set of wellbeing
indicators for use in driving policy and evaluating outcomes.7 The Programme notes the potential of the
Covid-19 crisis to increase inequality and poverty and highlights wellbeing measurement as a

2 This paper was produced by Clíona McDonnell and Ruth Lennon, economists in the Department of Finance and members of
the Irish Government Economic and Evaluation Service (“IGEES”). Unless explicitly referenced by Government decision,
any proposal contained in this document does not represent Government policy and should not be represented as such. The
analysis and views set out in this paper do not necessarily reflect the views of the Minister for Finance. The authors would
particularly like to thank Egle Gusciute for earlier contributions to the paper. The authors would also like to thank Brendan
O’Connor, Noel Howard and the Performance Budgeting Unit of the Department of Public Expenditure and Reform for helpful
comments.
3 For the purposes of this paper, the terms wellbeing and living standards will be used interchangeably to refer to the same

concept.
4 See http://www.oecdbetterlifeindex.org/
5 For example, Scotland, Iceland, Wales.
6 See https://assets.gov.ie/4910/181218123252-71a2c297f26b419fa3696d7349e3e788.pdf
7 See https://static.rasset.ie/documents/news/2020/06/draft-programme-for-govt.pdf

                                                             3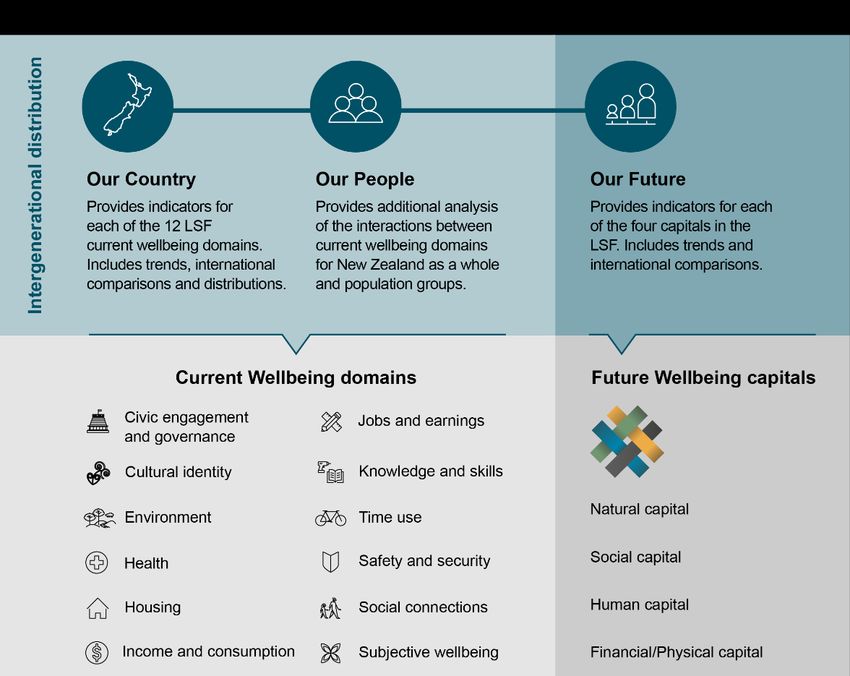
mechanism vital for ensuring a fair and balanced recovery from the crisis by capturing all dimensions
of the Covid impact and subsequent recovery.

In view of the Programme for Government, this scoping paper has two main objectives. Firstly, to review
international and domestic research and examples of wellbeing measurement, and to summarise the
methodologies and approaches currently in use therein for the measurement of wellbeing. Secondly, to
investigate within the Irish context possible methods of wellbeing measurement that would reflect a
broad range of economic, social, health, and environmental indicators.

The rest of the paper is structured as follows. Section 2 provides background information on the concept
of wellbeing and discusses its relevance in measuring overall living standards in a country. Section 3
constitutes a brief review of selected prominent international wellbeing frameworks. Section 4 provides
an overview of national progress to date towards the measurement of wellbeing in Ireland. Section 5
investigates a range of possible options for Ireland to create its own measure of national wellbeing.
Possible limitations and data gaps are also outlined in this section. Section 6 then provides some
concluding remarks and identifies the next steps to be undertaken.

                                                   4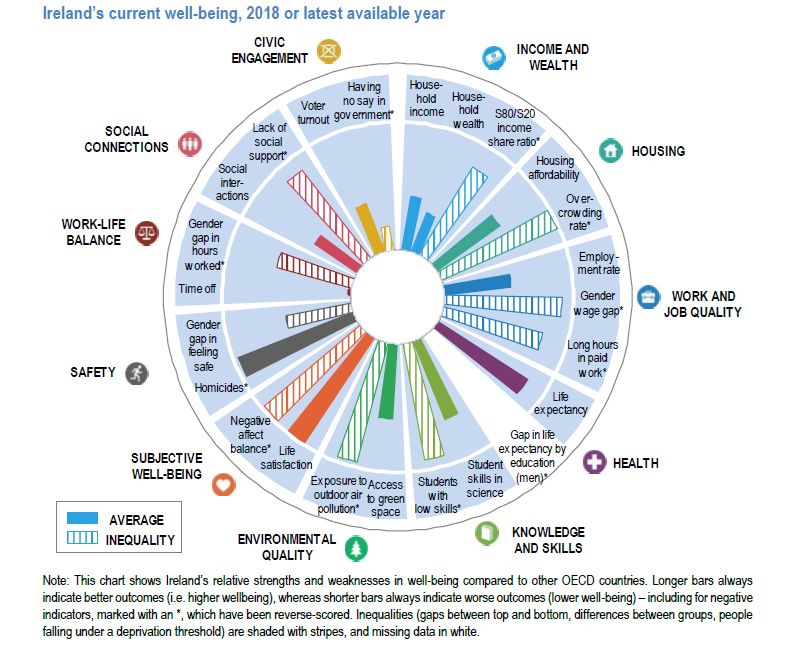
Section 2: Moving from GDP to Wellbeing

GDP is one of the most widely used and accepted indicators of economic progress and has often been
used as a proxy for overall wellbeing (Costanza et al., 2009; Stiglitz, et al., 2018a). 8 There is no question
that economic development benefits individual wellbeing; higher income is likely to lead to superior
living standards, improved educational opportunities, and better health outcomes. Higher income is
associated with higher levels of subjective wellbeing (Stevenson and Wolfers, 2008), although there is
some evidence that happiness does not grow as income grows over the long-term.9 However, there are
two issues here. One is that the use of GDP as the single and definitive measure of economic and
social progress is problematic. The second is that continued economic development may not always
lead to improved overall wellbeing (for example, because economic growth is associated with increased
greenhouse gas emissions). The focus here is on the former: moving beyond GDP as the primary
economic policy target.

The ‘beyond GDP’ agenda began with the Stiglitz-Sen-Fitoussi Commission established in 2008 by the
French Government to “identify the limits of GDP as an indicator of economic performance and social
progress, including the problems with its measurement” (Stiglitz, et al., 2009: 7). The key message in
the Commission’s report was the need for the “measurement system to shift emphasis from measuring
economic production to measuring people’s wellbeing”, particularly from a sustainability perspective
(Stiglitz, et al., 2009: 12).

Simon Kuznets, the developer of the System of National Accounts that gave birth to GDP, recognised
its limitations, stating that
         “The welfare of a nation can scarcely be inferred from a measurement of national income’”
         (Kuznets, 1934).

However, given a lack of alternative measures of living standards and the appealing simplicity of a
single, measurable indicator, GDP has become the de facto measure of welfare and living standards.
This is in spite of the fact that GDP fails to measure key non-economic dimensions of overall wellbeing.
To name but a few limitations specifically, GDP does not consider the distribution of outcomes, including
income, in a society, the depletion of natural resources, or the value of unpaid labour including
housework or volunteering. In addition, GDP treats expenditure positively without distinction between
welfare-contributing and welfare-reducing activity (Berik, 2018). It is possible that by ignoring these
important activities and resources, focusing on GDP could indeed drive activities which may have a
negative impact on wellbeing in the long-term, for example by increasing greenhouse gas emissions as
previously noted, or by increasing inequality if the distribution of income is ignored.

In the Irish context, the usefulness of GDP is further limited by the distortions caused by the large
multinational sector. While there are other macroeconomic statistics which adjust for the distorting
effects of globalisation (e.g. Modified Gross National Income, Modified Domestic Demand), and while
these do provide a more accurate picture of the economic situation for Irish citizens, they equally fail to

8 GDP methodologies were developed in the 1930s/1940s in the US and the UK, respectively during a period of economic and
social upheaval. In order to speed up economic progress post the Great Depression and WWII, GDP was adopted globally as
an indicator of economic progress and became the primary measure used by the IMF and the World Bank. See Coyle (2014).
9 This is known as the Easterlin paradox.

                                                           5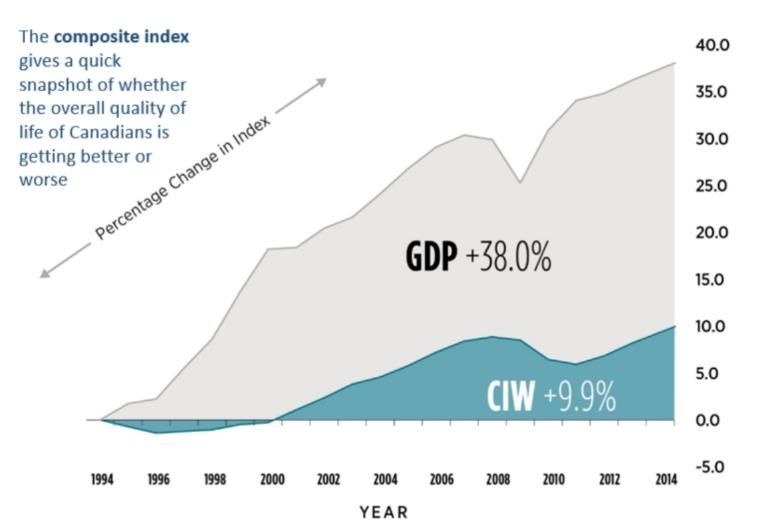
account for the broader concerns of wellbeing outlined here. The CSO will be producing new figures for
income, savings, and consumption by household income distribution later this year, which will partially
address this from an income point of view. If the growth of an economic output does not directly or
indirectly improve living standards and wellbeing; then an alternative measure is necessary to ensure
the drive for economic growth does not eclipse progress towards higher living standards for all.

2.1 Defining Wellbeing

Wellbeing is a multidimensional concept for which no single definition has emerged. At an individual
level, it relates to a person’s physical, social and mental state (National Economic and Social Council,
2009).10 At the societal level, the concept of wellbeing encompasses objective and subjective features
of current living conditions, including objective accounting of circumstances, such as income or life
expectancy, but also reflecting subjective aspects of quality of life, such as feeling content. The
components which make up wellbeing may also change over time, as society and the relative
importance of different aspects of life evolve. Figure 1 below illustrates how wellbeing includes a wide
range of dimensions.

Figure 1: A Multidimensional Understanding of Wellbeing

Source: Department of Finance and Deutsche Bank

Furthermore, the economy of wellbeing entails leveraging a balance between economic growth and
overall wellbeing (Llena-Nozal, et al., 2019). The OECD (Llena-Nozal, et al., 2019:21) define the
economy of wellbeing as an economy that:

     i.    Expands the opportunities available to people for upward social mobility and for improving their
           lives along the dimensions that matter most to them;
     ii.   Ensures that these opportunities translate into wellbeing outcomes for all segments of the
           population, including those at the bottom of the distribution;

10 Note that wellbeing is a broad concept and should not be conflated with measures of happiness or subjective (self-reported)
life satisfaction (O’Donnell, et al., 2014). In surveys both indicators are generally used to evaluate respondents’ level of
happiness and life satisfaction on a Likert-type scales. While both indicators are sub-dimensions of the overall wellbeing
measure, they are unidimensional and thus do not encompass the broader dimensions of the concept.

                                                              6
iii.   Reduces inequalities; and
 iv.     Fosters environmental and social sustainability.
The OECD’s model of wellbeing will be discussed further in Section 3 and it may be useful to adopt a
similar approach in Ireland to ensure international comparability.

Measures of wellbeing can be structured to include both macroeconomic indicators and many of the
elements for which aggregate economic statistics fail to account, including quality of life factors, and to
facilitate analysis of the distribution of living standards across societal groups. The OECD’s model of
wellbeing also encompasses indicators which have bearing on future wellbeing. This provides an
opportunity for scrutiny of whether risks and resources affecting the continuation of high living standards
in the future are being adequately managed, and traditionally includes indicators such as national debt
and environmental quality.

                                                    7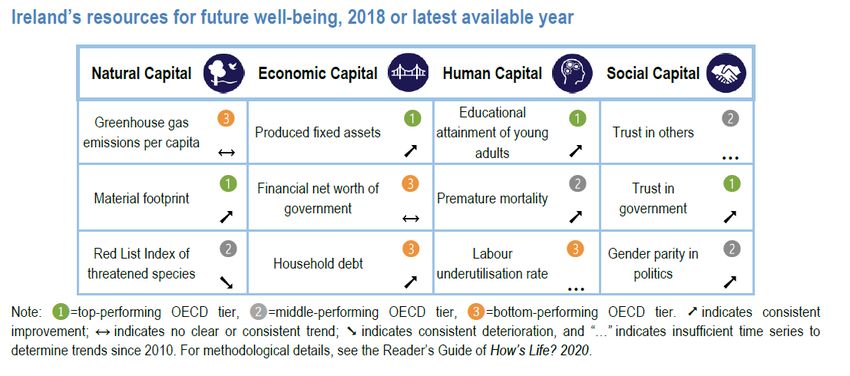
Section 3: International Wellbeing Initiatives

What initially began as an academic push for economists to move beyond focusing on GDP to measure
a country’s economic performance has found its way firmly into the policy-making sphere. The OECD
has taken the lead on using multidimensional indicators of wellbeing in recent years and a significant
number of OECD countries have begun to incorporate these into economic monitoring and policy
decisions. Australia, Canada, United Kingdom, Austria, Belgium, Finland, Germany, Italy, Netherlands,
Iceland, Scotland, Wales and New Zealand have all incorporated wellbeing measures in their national
statistics, with work towards a national measurement of wellbeing initiated in others.

3.1 OECD

In 2011, the Organisation for Economic Co-operation and Development (OECD) developed a
framework for measuring the wellbeing of a country, identifying 11 key dimensions through which to
analyse current wellbeing on a national scale, as well as 4 domains to analyse future wellbeing (OECD,
2013). Since then, the OECD has produced biennial How’s Life reports on indicators of wellbeing across
these categories and for individual member countries, showing their relative performance. This research
is of particular relevance to Ireland as it delivers the first comprehensive attempt at measuring Irish
wellbeing, providing an initial springboard for national research.

In 2020, the OECD’s How’s Life report included country-level data on over 80 indicators of wellbeing
across the spectrum of 11 dimensions and 4 domains. The 11 dimensions measuring current wellbeing,
as shown in Figure 2, comprise Income and Wealth, Work and Job Quality, Housing, Health, Knowledge
and Skills, Environmental Quality, Subjective Wellbeing, Safety, Work-Life Balance, Social
Connections, and Civil Engagement. A key strength of the framework is that many of the individual
indicators are also examined for inequalities between groups, both horizontal inequalities (differences
by gender, age, and level of educational attainment) and vertical inequalities (differences between the
top and bottom of the distribution of outcomes for that indicator).

The OECD also measures capacity for future wellbeing under 4 domains of capital: Economic (e.g.
produced fixed assets), Natural (e.g. greenhouse gas emissions), Human (e.g. obesity prevalence),
and Social (e.g. trust in others). The monitoring of these domains is key to the sustainability and
expansion of current living standards, and through the measurement of risks and resources therein the
four domains reflect the outlook of health for economic, natural and social systems.

                                                    8
Figure 2: OECD Wellbeing Framework (How’s Life 2020)

Source: OECD

Ireland’s performance relative to other OECD countries is mixed. Figure 3 shows a selection of
indicators for each domain. In 2018, Ireland was by and large performing relatively well in terms of life
satisfaction, knowledge and skills, and health, but underperforming relative to the OECD average in
terms of income and wealth, work-life balance and civic engagement. Table A2 in Appendix 2 discusses
Ireland’s performance on the 11 dimensions of wellbeing as per the OECD’s 2020 country report for
Ireland, How’s Life in Ireland.

                                                   9
Figure 3: OECD (2020) How’s Life in Ireland
Source: OECD. Note this chart shows only a selection of indicators from each dimension.
Even for those indicators in which Ireland is doing well when compared to the OECD mean, there often
remains room for improvement with regard to inequalities; for example, as with the income gap in those
reporting good health. It should additionally be noted that because OECD indicators were chosen for
their broad relevance across varied OECD countries, certain dimensions may be seen to lack indicators
specifically relevant to Irish wellbeing; for example housing does not include an indicator on
homelessness, which is a current policy concern in Ireland. Finally, it should be noted that while the
statistics above were drawn from the OECD’s 2020 How’s Life report, many of them are dated figures;
some of those for Ireland – such as the gender gap in hours worked – by as many as 15 years.
Moreover, a single year’s figure for any indicator does not reveal the existence or direction of a trend
over time. A proposed wellbeing dashboard for Ireland could include trends over time insofar as
possible.
10The four capital domains also indicate a mixed outlook for Ireland’s future wellbeing (see Figure 4).
Economic capital shows Ireland performing well in terms of the stock of assets and investment, but
poorly in terms of household debt and the financial net worth of government. Ireland’s natural capital is
above average in terms of naturally occurring resources – such as land cover – but below average in
terms of greenhouse gas emissions and progress into renewable energy. Human capital is close to the
mean across all indicators, barring a somewhat high labour underutilisation rate. Finally, Ireland’s social
capital is in a broadly strong position for future wellbeing, with high trust in others and government,
although government stakeholder engagement and gender parity in politics are lower than the OECD
average.
Figure 4: OECD (2020) How’s Life in Ireland: Capital Domains
Source: OECD
3.2 National Examples
A selection of national wellbeing frameworks are discussed below to inform a view on international best
practise. Table A1 in Appendix 1 provides a more comprehensive list of these. Many countries engaged
in extensive consultation processes before the construction of their wellbeing frameworks in order to
determine the aspects of wellbeing important to their own citizens.
3.2.1 New Zealand
New Zealand was the first government to launch a wellbeing-focused national budget in 2019 and has
charged its Treasury to produce a Wellbeing Report at least once every four years.11 New Zealand’s
accounting of wellbeing spans 3 sections that make up a Living Standards Framework (LSF): Our
Country, Our Future, and Our People. Our Country and Our Future correspond near exactly to the
OECD’s 11 dimensions of wellbeing and four capital domains respectively. They have also added a 12th
11 See https://treasury.govt.nz/information-and-services/nz-economy/higher-living-standards/measuring-well-being-lsf-
dashboard
11dimension, Cultural Identity, and added bespoke indicators to the OECD dimensions, such as measures
of domestic violence, ability to express oneself, and water quality. The extension to a 12 th dimension
demonstrates how the OECD’s framework can be tailored to a specific country. Our People is innovative
in analysing overall wellbeing across dimensions and the relationships between wellbeing dimensions
using extensive survey data from the biennial General Social Survey (GSS) conducted by Statistics
New Zealand.12 GSS questions are used to estimate individual wellbeing levels for different societal
groups within each indicator. These wellbeing estimates are also aggregated into a cross-dimension
summary wellbeing indicator. A key strength of the framework is the breakdown of indicators (both
macroeconomic and survey-based) by cohort to facilitate detailed distributional analysis.
Figure 5: New Zealand Living Standards Framework Dashboard
Source: New Zealand Treasury
New Zealand’s Treasury has a comprehensive online interactive dashboard of indicators from the LSF
which allows the user to examine indicators over time, by cohort (including by age, sex, ethnicity,
region), and compared to other countries. New Zealand’s development of a wellbeing measure is
particularly noteworthy given the advancements made towards the integration of the LSF into every-
day governance. The wellbeing budget saw the LSF inform each stage of the budgeting process, from
12 See https://lsfdashboard.treasury.govt.nz/well-being/#shiny-tab-op_subpop_select
12initial goal formation to the assessment of proposed initiatives.13 A new form of cost-benefit analysis
which takes account of wellbeing has been introduced for policy analysis by government agencies.
3.2.2 United Kingdom
In 2011, the UK Government introduced a national framework of wellbeing indicators to be produced
by the Office of National Statistics (ONS). The framework consists of 43 indicators across 10
dimensions: Personal Wellbeing, Our Relationships, Health, What We Do, Where We Live, Personal
Finance, Economy, Education and Skills, Governance, and Environment.14 Differing from the OECD
framework, the UK dashboard contains very little information relating to inequalities. The indicators are
published in an interactive online dashboard that is updated biannually, subject to data availability.
Change is assessed over the short-term (1 year) and the long-term (5 years). An international
comparison of the dashboard was also released in 2019, looking at UK outcomes relative to the EU and
the OECD.
The UK has taken other steps to integrate wellbeing in national policy-making, but these have been
more limited than in some countries. For example, the What Works Centre for Wellbeing was set up by
the UK Government in 2014 to advance wellbeing research, and in 2018 the Treasury Green Book
guidance on public sector evaluation was amended to include references to wellbeing. However, the
43 indicators of wellbeing are not explicitly in use for the formation and evaluation of policy.
13 See https://treasury.govt.nz/information-and-services/nz-economy/higher-living-standards/embedding-well-being-public-
sector
14See
https://www.ons.gov.uk/peoplepopulationandcommunity/wellbeing/articles/measuresofnationalwellbeingdashboard/2018-
04-25
13Figure 6: UK Measures of National Wellbeing Dashboard
Source: Office of National Statistics. The left hand side chart shows a summary of changes across all indicators.
3.2.3 The Netherlands
In 2018, Statistics Netherlands published the first of their annual publications monitoring wellbeing in
the Netherlands. Their methodology tracks wellbeing over time across 3 aspects of Broad Wellbeing
Trends (BWT): wellbeing of residents in the present day, the outlook for wellbeing of residents in the
future, and unusually, the effect of the Netherlands on wellbeing elsewhere in the world, particularly
regarding the environment and developing nations.
The BWT tracked for current wellbeing cover 20 indicators over 7 dimensions: Wellbeing and Material
Welfare, Health, Environment, Society, Security, Work and Education, Housing. 15 The smaller number
of indicators utilised mean the Netherlands has sacrificed greater coverage of the different elements of
a dimension for simplicity of output. The BWT tracked for the future are divided across the standard 4
capitals: Economic, Human, Social, and Natural. Finally, the BWT tracked for their effect elsewhere
span four dimensions: Trade and Aid, Raw Material Imports from LDCs, Raw Material Imports generally,
and Carbon Footprint.16
15 See https://www.cbs.nl/en-gb/news/2018/20/well-being-improving
16 Raw material imports are viewed as removing natural capital from other countries; the benefits in monetary terms to this
trade are captured in the total imports indicator which makes up part of the trade and aid dimension.
14Figure 7: Broad Wellbeing Trends in the Netherlands
Source: Statistics Netherlands
153.2.4 Canada
The Canadian Index of Wellbeing (CIW) was created in 2011 and is run by the University of Waterloo.17
The CIW is a single composite measure of wellbeing which can be compared directly to GDP (as seen
in Figure 8). The index is created from 64 indicators spread evenly across 8 dimensions: Healthy
Populations, Democratic Engagement, Community Vitality, Environment, Leisure and Culture, Time
Use, Education, and Living Standards. The CIW composite is created through an equal weighting of
the percentage change in all indicators relative to the base year (1994). While the CIW composite
indicator bears the obvious drawback of generalization, it can also be analysed by individual dimension
similar to a dashboard. The expansiveness of the Canadian dashboard is costly, however, as in 2019,
the full range of data to complete the CIW was only available up to 2014.
Figure 8: Growth in the Canadian Index of Wellbeing and GDP
Source: University of Waterloo, Faculty of Applied Health Sciences
17 See https://uwaterloo.ca/canadian-index-well-being/about-canadian-index-well-being
16Figure 9: Canadian Index of Wellbeing
Source: University of Waterloo, Faculty of Applied Health Sciences
17Section 4: Irish Development of Wellbeing Measurement
While comprehensive research on broader wellbeing has not yet been undertaken by Government
Departments, there are other Irish organisations who have researched wellbeing in Ireland, in particular
the CSO. The CSO’s work, outlined below, could be leveraged when building a national measure of
wellbeing, as could its aforementioned forthcoming work on the distribution of household income. In
addition, the CSO has also completed work on Ireland’s progress toward fulfilling the Sustainable
Development Goals. There have been 4 reports focussing on the first 4 SDGs individually and one
comprehensive report covering progress on all 17 SDGs released in 2017. 18 The National Economic
and Social Council (NESC) previously launched a wellbeing report in 2009 but this has not been
repeated (see Appendix 3 for further detail).
4.1 CSO Wellbeing of the Nation
The Central Statistics Office produced an initial look at Irish wellbeing in 2018, The Wellbeing of the
Nation 2017. The report follows various international examples in reporting on 8 dimensions composed
of a range of indicators tracked over time. These dimensions are: Economy, Work, Education, Housing
and Natural Environment, Government and Equality, Health, Public Safety, Time Use.19 Table 1 below
lists the full range of indicators which make up each of these dimensions .
The publication demonstrates how wellbeing measurement can be more accurately shaped to issues
of concern for Irish citizens, e.g. homelessness, commuting time, binge-drinking, financial inclusion.
The CSO does not summarise the data, show trends in dimensions, nor draw any conclusions from the
data. This means that there is no snapshot indication of how Ireland is doing in terms of wellbeing.
There are also some domains and indicators which are common in international measures and notably
missing here, e.g. subjective wellbeing, specific crime rates (e.g. violent crime or domestic abuse which
are particularly welfare reducing), wellbeing gaps between groups.20 In general, there is very little focus
on either the distribution of wellbeing among societal groups or resources for future wellbeing (the four
capitals). A Government initiative on wellbeing could address these issues and create a wellbeing
framework that serves the purposes of the wider public (and private) sector.
18 See https://www.cso.ie/en/statistics/unsustainabledevelopmentgoals/. It is worth noting that the UN SDGs are distinct from
the wellbeing agenda; the SDGs are a set of targets to promote global development and prosperity while the wellbeing agenda
is about adapting the methodology used to measure living standards. However, there is overlap between the two on indicators
of progress and they share a common vision of improving living standards.
19 See https://www.cso.ie/en/releasesandpublications/ep/p-wbn/thewell-beingofthenation2017/
20 For example, the measure of discrimination describes overall the number of people within a population experiencing
discrimination (18% in 2019) but the aggregate figure obfuscates how high discrimination levels are for particular groups, e.g.
33.2% for LGBTI+, although the CSO also publishes this:
https://www.cso.ie/en/releasesandpublications/er/ed/equalityanddiscrimination2019/
18Table 1: CSO dimensions and indicators of wellbeing in Ireland
Dimension Indicator 1 Indicator 2 Indicator 3 Indicator 4 Indicator Indicator 6
5
Average Total
Average Debt Consumer Price
Economy GNI* Earnings per
per Household Index
Individual
Employment
Long-Term % Working Long Enforced Discrimination
Unemployment Rate for those
Work Unemployment Hours (+48 per Job in the
Rate with
Rate Week) Instability21 Workplace
Disabilities
Educational Early School PISA Maths
Education Digital Skills
Attainment 22 Leavers Mean Score
Housing and Recovered
River Water
Natural Homelessness Air Quality23 Packaging
Quality
Environment Rates
Female
Government Income % Experiencing
Representation Poverty Rate
and Equality Inequality Discrimination
in the Dáil
Self-Perceived Healthy Life % Engaging in Deaths by
Health Obesity Rate
Health Years at Birth Binge-Drinking Suicide
Fear of Perception of
Self-Reported
Public Becoming a the Level of Road Traffic
Victimisation
Safety Victim of Seriousness Injuries/Fatalities
Rate
Crime of Crime
Expenditure
Participation in Commuting
Time Use Volunteering on
Sport Time
Sports/Leisure
Source: Department of Finance and CSO
Figure 10: CSO Wellbeing of the Nation (2017)
Source: CSO
21 Enforced Job Instability refers to the percentage of people changing job each year who were forced to do so by their
employer, it is inclusive of dismissals, redundancies, early retirements, or the closure of a business.
22 This is measured as the percentage of people aged 25 to 65 with third level education.
23 Note this is actually a measure of total CO2 emissions.
194.2 CSO Survey Modules on Subjective Wellbeing
The CSO has collected data on subjective wellbeing, i.e. how people perceive their own wellbeing,
through its Survey on Income and Living Conditions (SILC) in 2013 and 2018. Respondents were
questioned about their satisfaction with various aspects of their life, including:
- Satisfaction with life overall, financial situation, personal relationships, time use, and job
- Emotional wellbeing
- Access to material and non-material help
- Perceived social inclusion
- Trust in others
- How often one experiences a range of emotional states: happy, calm and peaceful, very
nervous, down in the dumps, downhearted and depressed, lonely.
This wellbeing module in SILC has several key advantages: it allows for a comparison of indicators in
Ireland over time and it facilitates comparison with other countries who have conducted similar surveys.
It allows for welfare gaps to reveal themselves through the division of results by demographic class or
societal grouping and it provides valuable data for wellbeing research. For example, in 2016 the
Economic and Social Research Institute (ESRI) published a paper using data from the SILC 2013
module on wellbeing to estimate a multidimensional level of quality of life deprivation in Ireland.24
The results of the SILC survey were broadly positive on the outlook for wellbeing in Ireland. The mean
score for overall life satisfaction (rated on a scale 1-10) increased from 7.5 in 2013 to 8.1 in 2018,
bringing Ireland level with Finland as the joint highest performing countries in the EU-27. 2018 also saw
Ireland record the highest rate in the EU-27 of individuals reporting being happy either most or all of the
time in the month preceding the survey. Satisfaction with all aspects of life bar personal relationships
(which held steady) rose from 2013. However, there were also some negative results. The percentage
of those feeling very nervous or downhearted/depressed at some point in the 4 weeks preceding the
survey saw significant increases over the period. In terms of distribution, for example, individuals not at
work due to a disability or permanent disease had significantly lower overall life satisfaction than the
rest of the population, while significantly fewer individuals at risk of poverty reported being happy all or
most of the time compared to those not at risk.
An additional survey on wellbeing was also conducted by the CSO in April 2020 in response to the
COVID-19 pandemic to assess the pandemic’s impact on wellbeing. Unsurprisingly, it has had a
significant negative effect on the majority of indicators. In addition to covering the wellbeing questions
previously asked in the SILC surveys, the April 2020 survey also investigated lifestyle changes in terms
of consumption (of alcohol, tobacco, junk food, and fresh fruit and vegetables), behaviour (exercise and
time spent), and levels of personal concern over certain issues provoked by the crisis (including health
of oneself and others, the effect of an interrupted education, and domestic violence). As there is no
consistent, systematic method of monitoring wellbeing, however, the effects of COVID-19 on wellbeing
24The paper was funded by the Department of Social Protection, see https://www.esri.ie/system/files/media/file-uploads/2016-
07/BKMNEXT310.pdf
20seen in the CSO survey – and likely more still not included – remain largely unobserved and so cannot
be fully accounted for in the decision-making process.
4.4 Government Initiatives
In recent years, the Irish Government has developed and implemented a number of initiatives designed
to advance aspects of wellbeing in Ireland. For example, Equality Budgeting has been introduced by
the Department of Public Expenditure and Reform (DPER), while a Framework for Sustainable
Development in Ireland was created under the remit of the Department of Communications, Climate
Action and the Environment.
While these schemes have aimed to improve wellbeing in specific areas, they are individual initiatives
that have been isolated from one another and from the broader picture of wellbeing. Coordination is
restricted and therefore goals are limited to resource-plausible achievements for the responsible
Department or organisation.
21Section 5: Options for Wellbeing Measurement in Ireland
There are three primary options that emerge in respect of the development of a national measure of
wellbeing in Ireland: a dashboard of indicators, a national survey, or a composite summary indicator.
One option or a combination of the three could be chosen, with trade-offs between simplicity and
breadth to consider. For example, a dashboard could be presented alongside a composite indicator, or
a series of composite indicators each reflecting one dimension of a dashboard might provide a clearer
set of wellbeing trends. A dashboard would put Ireland most in line with international approaches to
wellbeing. For all of the options, improvements in data collection and availability are likely to be required,
whether by the CSO or Government Departments. As in other countries, significant stakeholder
engagement will be important to ensure any measure of wellbeing reflects the interests of as broad a
range of Irish society as possible.
5.1 Dashboard
A dashboard or suite of indicators provides the most extensive overview of wellbeing; it is the mode of
wellbeing measurement most commonly seen at the national level and aligns with the OECD’s work. A
dashboard is created from a series of unidimensional wellbeing indicators (e.g. average household
disposable income, life expectancy) which are divided into different areas of wellbeing, typically referred
to as dimensions (e.g. income, health). A dashboard offers flexibility in how results are best presented.
It can be used to examine both how many indicators and how many dimensions are trending upwards
over time (and how many are stationary, and how many declining). Indicators can also be shown by
cohort to reveal inequalities across society for that indicator. A dashboard can also allow a comparison
against other countries, for example how Ireland compares to the EU or OECD average. 25 Table A4 in
Appendix 4 gives a work-in-progress summary of possible dashboard indicators for Ireland based on
the OECD wellbeing framework. Ireland’s wellbeing dashboard could leverage both the OECD and
CSO’s work but be tailored to Ireland-specific issues, e.g. data on the Irish Traveller group, or to
Government policy priorities, e.g. homelessness. Figure 11 below displays two basic sample graphics
of how a proposed income dimension could be displayed as part of a broader Irish measure of wellbeing.
A dashboard can also be complicated to analyse. Examining trends in dimensions can give an idea of
whether wellbeing tends to improve over time, but misses some of the nuance between dimensions.
For example, if the population’s health is falling while all other dimensions are improving, actual
wellbeing is likely to be low if people are not healthy enough to enjoy the benefits of rising incomes, an
improving environment, etc. However, this would present as a very positive shift in wellbeing when
viewed only as an aggregate of dimension trends. Similarly, a trend in a dimension could be misleading
if it is driven by trends in some indicators within it, but masks diverging trends in other indicators. This
danger can be guarded against by examining welfare outcomes by social group wherever possible, as
this is a common source of indicator divergences within a dimension. To enable an easier interpretation
of a dashboard, the simplest overview possible of wellbeing outcomes could be displayed, with analysis
of the deeper levels also available and outliers or exceptions explained as required. An interactive
25Where countries depart from the OECD’s framework and use bespoke indicators or domains, an international comparison
will be more difficult.
22dashboard that allows the user to choose the indicators or domains to focus on or the level of analysis
would facilitate this. Graphical presentation is also crucial to facilitate understanding and interpretation.
Figure 11: Sample Dimension Graphic
Source: Department of Finance
5.2 Survey
Another option is to develop an iterative, representative national survey on subjective wellbeing,
extending the CSO’s initial survey work. This option would serve best as a complement to other
statistical indicators. The survey could involve similar questions to the CSO SILC wellbeing module but
at an increased frequency, as the SILC module is currently repeated only once every 5 years. The
wellbeing measure could then be tracked over time or compared with international results. There are
very few countries using survey data alone to measure wellbeing, although many countries do include
survey data on subjective wellbeing within their indicators, e.g. New Zealand, the UK, Australia. New
23Zealand uses a particularly comprehensive survey to estimate wellbeing for most dimensions and also
build a composite indicator from this. The survey could be undertaken by the CSO or contracted to a
private survey operator on behalf of Government Departments. In addition to the CSO’s SILC surveys,
there are also a number of other surveys and studies in operation which could be leveraged, for
example, the European Social Survey, the Eurobarometer, the Healthy Ireland surveys, the Irish
Longitudinal Study on Ageing, and the Growing Up in Ireland study.
There are clear advantages to the measurement of wellbeing through a survey, including that it is simple
and directly represents the views of the people on their own wellbeing, which is difficult to proxy any
other way. Additionally beneficial is the ability to include social group memberships – relating to age,
gender, ethnicity, disability, sexual orientation, etc – within the survey and therefore guarantee that
individual wellbeing indicators can be broken down across such groups (as New Zealand have done).
A survey also provides a means of obtaining more accurate figures of indicators for which the aggregate
measures are viewed with scepticism; for example, sexual assault is widely acknowledged to be an
underreported crime.26
Conversely, we can also expect that survey results will see less objectivity in certain domains, e.g.
environment, health. For certain areas of wellbeing, such as greenhouse gas emissions, individuals
may simply lack information, while in others, such as the reporting of exercise taken or alcohol
consumed, there is risk of dishonesty. There is also a clear disconnect between certain real-world
variables and the perception of those variables, for example, the crime rate does not necessarily
correlate to the fear of crime.
5.3 Composite Indicator
A composite indicator is a single index summarising wellbeing derived from a range of individual
wellbeing indicators. This approach is less common, with Canada and Bhutan the most prominent
examples. Three possible methods by which such a composite statistic might be constructed are
outlined below:
1. Simple weighting composition: this would mean that each indicator selected is weighted either
equally or relative to its perceived importance for inclusion in the composite figure. Indicators
can provide an up or down trend in wellbeing terms, or they can be taken as the percentage
change from a base year, or on an annual change basis. Canada chose to weight each indicator
equally and calculate the composite figure as a percentage change from a base year. Bhutan
employs a more complex formula involving adding those who are categorised ‘happy’ (meeting
a minimum criteria across 2/3 of indicators) to a sum of those who are unhappy, multiplied by
a weighting (equal) of those categories in which ‘unhappy’ individuals have achieved the
minimum criteria.
2. Principal component analysis: this involves the employment of the econometric technique of
principal component analysis in order to estimate a broad wellbeing trend from a range of
related indicators.
26 See http://www.cosc.ie/en/COSC/Pages/WP08000146
243. Cross-domain wellbeing: this creates an overall wellbeing indicator based on the number of
domains in which a person has high or low wellbeing (an approach taken by New Zealand).
This would require survey data or panel data on the same individuals.
The key advantage of a composite indicator is that a single figure is clear and parsimonious, and easily
comparable to aggregate economic statistics such as GDP. However, it loses a great deal of detail and
severe deficiencies in one category can be obscured by unusually positive outcomes in another, and
vice versa. As the OECD noted in its How’s Life in 2020? publication:
“What is true on average is not always true for every member country - and even less so for different
population groups within those countries.”
Some wellbeing indicators are likely to have an inverse relationship, for example, greenhouse gas
emissions and income per capita. Striking a balance between such opposing forces in society is one of
the reasons it is important to measure wellbeing, but the result is that a composite indicator must be
constructed with extreme care. Some indicators of relevance may have to be excluded to ensure effects
do not cancel each other out.
25Section 6: Conclusion
The Programme for Government 2020 outlines the intention to develop new measures of wellbeing
instruments, including wellbeing indices and a balanced scorecard for different areas of public policy.
This development, to be guided by a group of experts from across the civil service, academia, NGOs,
and the private sector, will bring Ireland in line with other European and OECD countries. This paper
has sought to inform this process by outlining international progress on measuring wellbeing and the
key learnings for Ireland from this. A dashboard of indicators has been identified internationally as likely
the best way to achieve a well-rounded and informative wellbeing measure, however other options
could also be considered, including a comprehensive national survey and a composite wellbeing
indicator. There are some limitations, however, in particular regarding current data availability.
A national measurement of wellbeing has the potential to improve inter-Departmental co-operation and
cohesion, and to further the whole-of-Government agenda to improve living standards for Irish residents
and citizens. Wellbeing could become an entrenched consideration at all levels of public decision-
making, operating continuously both in and out of the public eye. It will improve the analytical capacity
of the Department of Finance by providing a more holistic view of Irish living standards and by adding
to the information content and quality available to inform the Department’s decision-making, in particular
by facilitating a shift away from a narrower focus on GDP.
26References
Anielski, M. and Soskolne, C. L. (2002), ‘Genuine Progress Indicator (GPI) Accounting: Relating
Ecological Integrity to Human Health and Wellbeing’ in Mille, P. and Westra, L. (eds.) Just
Ecological Integrity: The Ethics of Maintaining Planetary Life. Rowman & Littlefield Publishers
Inc.: Oxford, pp. 83-97.
Aitken, A. (2019), ‘Measuring Welfare beyond GDP’ National Institute Economic Review, Vol. 249 (1)
pp. 3-15.
Berik, G. (2018), ‘Toward More Inclusive Measures of Economic Wellbeing: Debates and Practices’.
ILO Future of Work Research Paper Series, No. 2. International Labor Organization.
Boarini, R. and D’Ercole, M.M. (2013), ‘Going beyond GDP: An OECD Perspective’. Fiscal Studies,
34(3), pp. 289-314.
Canadian Index of Wellbeing (2016), How are Canadians Really Doing? The 2016 CIW Report.
Canadian Index of Wellbeing and the University of Waterloo, accessible at
https://uwaterloo.ca/canadian-index-wellbeing/sites/ca.canadian-index-
wellbeing/files/uploads/files/ciw2016-howarecanadiansreallydoing-1994-2014-
22nov2016_3.pdf
Costanza, R., Hart, M., Posner, S. and Talberth, J. (2009), ‘Beyond GDP: The Need for New
Measures of Progress’. The Pardee Papers, No. 4, Pardee Center for the Study of the
Longer-Range Future: Boston University.
Coyle, D. (2014), GDP: A Brief but Affectionate History. Princeton University Press: Princeton.
CSO (2018), The Wellbeing of the Nation 2017, accessible at
https://www.cso.ie/en/releasesandpublications/ep/p-wbn/thewellbeingofthenation2017/
CSO (2020), SILC Module of Wellbeing 2018, accessible at
https://www.cso.ie/en/releasesandpublications/ep/p-smwb/silcmoduleonwell-being2018/
CSO (2020), Social Impact of COVID-19 Survey April 2020, accessible at
https://www.cso.ie/en/releasesandpublications/ep/p-sic19/socialimpactofcovid-
19surveyapril2020/
Dalziel, P., Saunders, C. and Saunders, J. (eds.) (2018), Wellbeing Economics. The Capabilities
Approach to Prosperity. Palgrave Macmillan, accessible at
https://link.springer.com/book/10.1007%2F978-3-319-93194-4
Department of Finance (2018a), GDP and Modified GNI – Explanatory Note. Economic Division,
Department of Finance: Dublin.
Department of Finance (2018b), Statement of Strategy 2017-2020, accessible at
https://www.gov.ie/en/publication/24836f-strategy/?referrer=/wp-
content/uploads/2017/07/dfin-statement-of-strategy-1619.pdf/.
Deutsche Bank Research (2006), Measures of well-being, September 8, Briefing Note.
27Durand, M., and Exton, C. (2019), ‘Adopting a Wellbeing Approach in Central Government: Policy
Mechanisms and Practical Tools’ in Global Happiness Council Global Happiness and
Wellbeing Policy Report 2019, pp. 140-162.
Exton, C. and Shinwell, M. (2018), Policy Use of Wellbeing Metrics: Describing Countries’
Experiences. OECD Statistics and Data Directorate Working Paper No. 94, accessible at
http://www.oecd.org/officialdocuments/publicdisplaydocumentpdf/?cote=SDD/DOC(2018)7&d
ocLanguage=En
Government of New Zealand (2018), Living Standards Framework: Introducing the Dashboard,
accessible at https://treasury.govt.nz/sites/default/files/2018-11/lsf-introducing-dashboard-
dec18.pdf
Government of New Zealand (2019), The Wellbeing Budget 2019, accessible at
https://treasury.govt.nz/publications/wellbeing-budget/wellbeing-budget-2019
Kuznets, S. (1934), ‘Beyond GDP: Measuring Progress, True Wealth and the Wellbeing of Nations’,
accessible at https://ec.europa.eu/environment/beyond_gdp/download/interesting_facts.pdf
Kuznets, S. (1962), ‘Beyond GDP: Measuring Progress, True Wealth and the Wellbeing of Nations’,
accessible at https://ec.europa.eu/environment/beyond_gdp/download/interesting_facts.pdf
Llena-Nozal, A., Martin, N. and Murtin, F. (2019), The Economy of Wellbeing: Creating Opportunities
for People’s Wellbeing and Economic Growth. OECD Statistics
NESC (2009), Wellbeing Matters: A Social Report for Ireland. Vol I. No. 119. NESC, accessible at
http://files.nesc.ie/nesc_reports/en/NESC_119_vol_I_2009.pdf
OECD (2011), How’s Life? 2011: Measuring Wellbeing. OECD Publishing, accessible at
https://dx.doi.org/10.1787/9789264121164-en
OECD (2013), How’s Life? 2013: Measuring Wellbeing. OECD Publishing, accessible at
https://doi.org/10.1787/9789264201392-en
OECD (2018), Opportunities for All: A Framework for Policy Action on Inclusive Growth. OECD
Publishing: Paris.
OECD (2019), Measuring Wellbeing and Progress: Wellbeing Research. Accessible at
https://www.oecd.org/statistics/measuring-wellbeing-and-progress.htm.
OECD (2020), How’s Life? 2020: Measuring Wellbeing. OECD Publishing, accessible at
https://www.oecd-ilibrary.org/economics/how-s-life/volume-/issue-_9870c393-en
OECD (2020), How’s Life in Ireland? Country Note. OECD Publishing, accessible at
https://www.oecd.org/statistics/Better-Life-Initiative-country-note-Ireland.pdf
O’Donnell, G. Deaton, A., Durand, M., Halpern, D. and Layard, R. (2014), Wellbeing and Policy.
Legatum Institute. Accessible at https://li.com/wp-content/uploads/2019/03/commission-on-
wellbeing-and-policy-report-march-2014-pdf.pdf
28Sacks, D.W., Stevenson, B. and Wolfers. J. (2010), ‘Subjective Wellbeing, Income, Economic
Development and Growth’. NBER Working Paper Series, 16441. National Bureau of
Economic Research, accessible at https://www.nber.org/papers/w16441
Smith, C. (2019), Living Standards Dashboard: Monitoring Intergenerational Wellbeing, accessible at
https://treasury.govt.nz/publications/commissioned-report/treasury-living-standards-
dashboard-monitoring-intergenerational-wellbeing
Stevenson, B. and Wolfers, J. (2008), ‘Economic Growth and Subjective Wellbeing. Reassessing the
Easterlin Paradox’. NBER Working Paper Series, 14282. National Bureau of Economic
Research, accessible at https://www.nber.org/papers/w14282
Stiglitz, J., Sen, A., and Fitoussi, J. (2009), Report by the Commission on the Measurement of
Economic and Social Progress. Accessible at
https://ec.europa.eu/eurostat/documents/118025/118123/Fitoussi+Commission+report
Stiglitz, J., Fitoussi, J. and Durand, M. (2018a), Beyond GDP: Measuring What Counts for Economic
and Social Performance. OECD Publishing: Paris.
Stiglitz, J., Fitoussi, J. and Durand, M. (2018b), For Good Measure: Advancing Research on
Wellbeing Metrics Beyond GDP. OECD Publishing: Paris.
Talberth, J., Cobb, C. and Slattery, N. (2007), The Genuine Progress Indicator 2006: A Tool for
Sustainable Development. Redefining Progress: Oakland, CA.
Watson, D., Maître, B., Whelan, C.T. and Russell, H. (2016), ‘Technical Paper on the Measurement of
Multidimensional Quality of Life in Ireland’. Social Inclusion Technical Paper No. 7. Dublin:
Department of Social Protection. Accessible at
https://www.esri.ie/system/files/media/file-uploads/2016-07/BKMNEXT310.pdf
29You can also read