Ifo WORKING PAPERS 325 2020 - ifo Institut
←
→
Page content transcription
If your browser does not render page correctly, please read the page content below
ifo                                        325
                                          2020
WORKING                                    May 2020

PAPERS
 Understanding Free Trade
 Attitudes: Evidence from Europe
 Martin T. Braml, Gabriel J. Felbermayr
Imprint:

ifo Working Papers
Publisher and distributor: ifo Institute – Leibniz Institute for Economic Research at the
University of Munich
Poschingerstr. 5, 81679 Munich, Germany
Telephone +49(0)89 9224 0, Telefax +49(0)89 985369, email ifo@ifo.de
www.ifo.de

An electronic version of the paper may be downloaded from the ifo website:
www.ifo.de
ifo Working Paper No. 325

  Understanding Free Trade Attitudes: Evidence from Europe*

                                            Abstract

Our paper shows that individual preferences for open-market policies are mainly
shaped by trust in institutions and not economic self-interest. On the basis of the
Eurobarometer, a comprehensive semiannual survey that monitors public opinion in
EU Member States, we exploit data on attitudes towards the Transatlantic Trade and
Investment Partnership (TTIP), free trade, protectionism, and globalization. We find
that preferences for open-market trade policies cannot be sufficiently explained by
variables that, according to classical trade theory, typically determine personal
advantages. Nevertheless, rational considerations follow expected patterns, in
particular when individuals express strong preferences. A spatial analysis at the
European NUTS-2 level shows that measures of regional trade exposure and other
macroeconomic determinants serve as well-suited predictors for the substantial
cross-regional variation in the support for globalization. Country specific narratives
are predominant drivers of individual open-market attitudes.

JEL code: F13, F53, F68
Keywords: International political economy, globalization, free trade attitudes

               Martin T. Braml                           Gabriel J. Felbermayr
    ifo Institute – Leibniz-Institute for                      Kiel Institute
            Economic Research                           for the World Economy,
        at the University of Munich                           Kiel University
              Poschingerstr.5                                   Kiellinie 66
          81679 Munich, Germany                           24105 Kiel, Germany
         Phone: +49-89 9224 1298                     gabriel.felbermayr@ifw-kiel.de
               braml@ifo.de

* We would like to thank Sascha O. Becker, Ernst Fehr, Martin Kocher, and Jens Wrona for valuable
comments and suggestions as well as participants of the following conferences and workshops: ETSG
2017, 2017 APCC, EGIT 2018, NASMES 2018, EEA 2018, and VfS Annual Meeting 2018. Martin T. Braml
gratefully acknowledges financial support received from SenatsausschussWettbewerb (SAW) under
grant no. SAW-2016-ifo-4.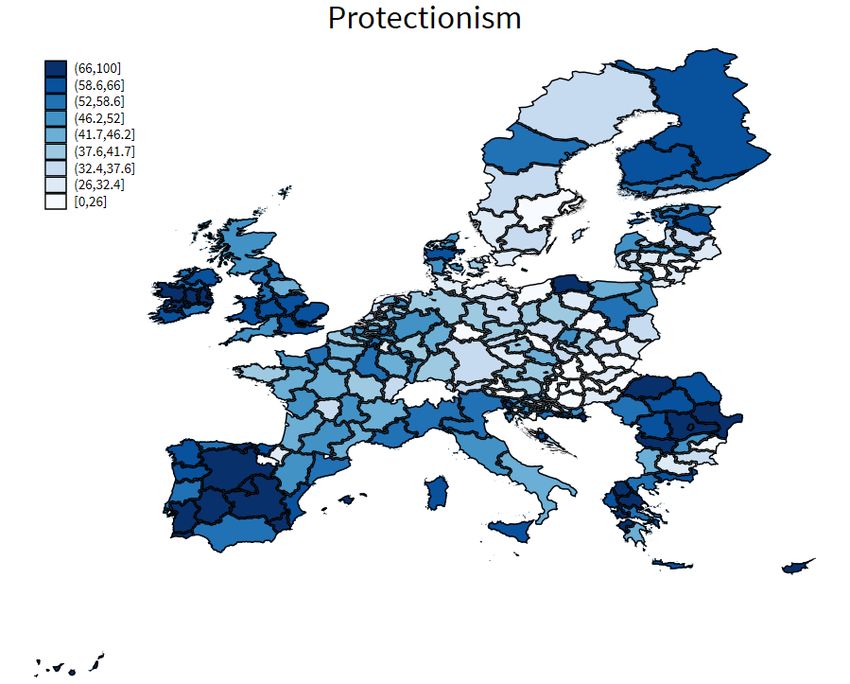
“At any rate, the lesson from history seems to be that continued globalization
cannot be taken for granted. If its consequences are not managed wisely and
creatively, a retreat from openness becomes a distinct possibility.”

                                                                                  ?

“I will argue that we are transitioning from an old world of trade to a new world of
trade where trade opening has become a very different game. This transformation
has major consequences which will likely - and hopefully - impact the international
trading system, be it in terms of principles, policies, and even mandates, as
illustrated, for instance, in the recent and turbulent beginning of the so-called
Transatlantic Trade and Investment Partnership (TTIP).”

                                                                                  ?

                                          1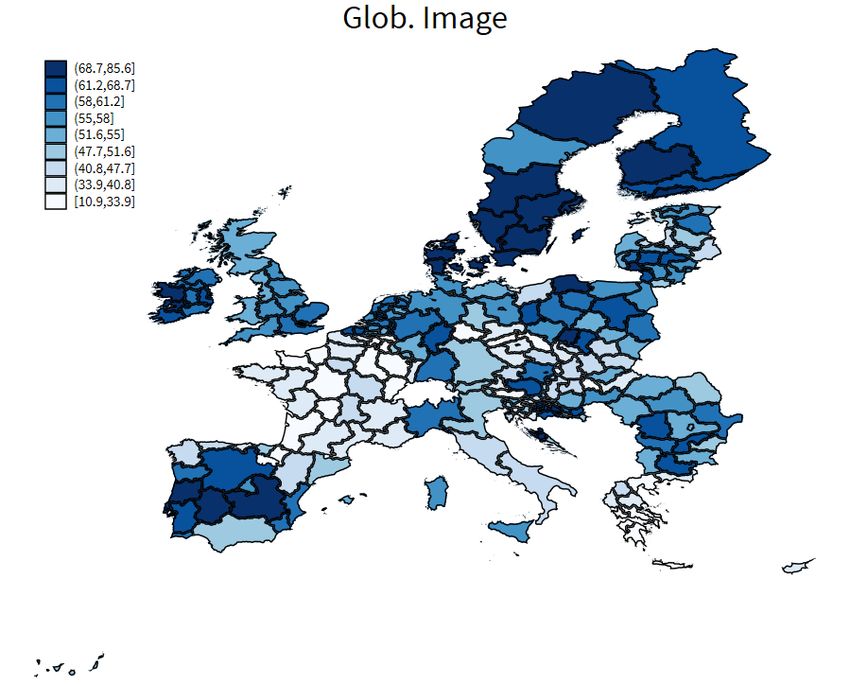
1       Background and Related Literature
Aggregate economic benefits of free trade are a well-established finding in both theoretical
and empirical research. However, a renewed strengthening of protectionist politics has
become increasingly popular in many industrialized economies. U.S. President Donald
Trump is on the verge of beginning serious trade wars, which would constitute a severe
threat to the rules-based global trading system, to support his domestic political agenda.
He thereby follows a distinct anti-globalization ideology which already became visible
during his election campaign. This is probably the most destructive form of a trend that
is certainly not unique to the U.S.: a process of rethinking global economic integration
in many advanced economies. The UK’s vote to leave the European Union in 2016 was,
after all, a plebiscite for national sovereignty at the cost of some degree of economic
prosperity. Prior to that, massive protests against the Transatlantic Trade and Investment
Partnership (TTIP) especially in German-speaking Europe has already demonstrated
that a growing number of people prefers regulatory independence to additional economic
gains from trade. Policy debates surrounding the mentioned events reflect a dramatic
divergence between public opinions and traditional academic perspectives which entail an
overemphasis of advantages of ever increasing international economic integration, thereby
neglecting the political economy of these processes.
     Dani Rodrik was one of the first to point out the political economy trade-off behind
globalization. He became known for what he calls “the political trilemma of the world
economy” (Rodrik, 1998).1 According to Rodrik, societies must choose two out of three ob-
jectives; the three objectives are:2 (1) the nation state in the sense of national sovereignty
and legislative autonomy, (2) mass politics in the sense of democratically legitimated de-
cision making3 , and (3) international economic integration. In a chronological manner,
Rodrik elaborates on how each of the possible choices has been implemented during the
past century: The first era of globalization, which came to an abrupt end with the be-
ginning of World War I, was characterized by independent nation states maintaining a
high degree of international economic integration under the gold standard (in Rodrik’s
terms “Golden Straitjacket”). The re-establishment of the gold standard after WWI failed
mainly due to the resulting high social cost (e.g. unemployment, deflation) which con-
flicted with the increasing political participation of the working class. This conflict could
only be dissolved by the “Bretton-Woods-Compromise” facilitating the coexistence of in-
dependent nation states and mass politics. However, this system limited the scope for
global economic integration as its functioning required capital controls, for instance.
     After its termination in 1973 and a period of weak income growth, a new era began
1
    Later, these ideas were published in ?.
2
    Note that in later versions, his terminologies have slightly changed.
3
    More precisely, he defines mass politics as politics based on an unrestricted franchise, a high degree of
    political mobilization, and political institutions that are responsive the mobilized groups.

                                                      2
shifting the political focus towards deep international economic integration. This, in turn,
required—given a consensus that mass politics, or better democracy, is non-negotiable—a
step by step reduction of national sovereignty. International organizations such as the
WTO were set up to administer this process by forming something that Rodrik calls
“Global Federalism”. The most ambitious project in this respect was the transformation
of the European Community into the European Union following the Maastricht Treaty
in 1992. The implementation of a currency union, the realization of the four freedoms
in the single market, and the legal supervision by a supra-national court will ultimately
lead to a dissolution of the EU’s Member States as nation states in a classical sense. The
initially mentioned political events reflect this trade-off between international economic
integration and the democratic nation state particularly well.
When it comes to EU trade politics, we observe precisely what Dani Rodrik describes:
opponents of Free Trade Agreements (FTAs) refer to the fact that deep and comprehen-
sive trade agreements limit the scope of legislative autonomy. Not every argument they
make is worth a closer look; many are exaggerated, or even utterly wrong. However,
the strong criticism of investor state dispute settlements highlights legitimate concerns
about a valid issue: the loss of legislative autonomy.4 By this means, the Globalization
Trilemma is triggered. The former EU Commissioner for Trade and Director General of
the WTO Pascal ? underlines similar thoughts by proclaiming a “New World of Trade”.
At the risk of simplification, this new world of trade can briefly be described as follows:
technical progress turned national production systems into regionally integrated or even
global supply networks (Grossman et al., 2006). Formerly, in order to prevent states
from manipulating production systems to their national advantage, quotas, tariffs, and
subsidies were subject to trade negotiations.
By contrast, recent obstacles to trade are the administration of precaution, including
but not limited to security, safety, health, and environmental sustainability. The pre-
dominant role of efforts to eliminate non-tariff barriers in recent free trade agreements
directly affects policy areas that are sensitive to the broader public. However, increasingly
comprehensive FTAs are not only a consequence of “efficiency-obsessed” free traders; the
reason for their existence is also related to lobby group interests5 as well as hidden pro-
tectionism6 . Paradoxically, the complexity of modern FTAs is to some extent due to their
opponents.
Pascal Lamy also points out that nowadays patterns of support and disapproval of
4
Clearly, proponents would not disagree but would rather stress that this loss of legislative autonomy is
desirable as it commits a government to a rule-based order. Hence, proponents and opponents differ in
their preferences for legislative autonomy but they share the view that national autonomy is at stake
when international investment protection treaties are closed.
5
For instance, in the EU Japan FTA animal welfare groups insisted making an improvement of animal
welfare an explicit goal of the FTA.
6
Labor unions, e.g. demand for high labor protection standards being part of FTA in order to prevent
trade partners from “unfair competition” related to what they call “dumping wages”.
3trade liberalization are diametrically opposed to traditional ones: in the past, consumers
favored tariff reductions in the hope of lower prices, while domestic producers often dis-
approved of them fearing increased competition and thereby losing their monopoly rents.
What Richard Baldwin (2016) calls “Globalization’s Third Unbundling” is in principle the
expansion of trade in services, which adds another facet to this “New World of Trade”.
At odds with the formerly observed pattern, producers are now in favor of regulatory
convergence because of cost saving while the opposition is formed by consumers, or more
precisely, by consumer organizations. Needless to say, as traces of the “Old World” still
exist the diverging lines are fluent and exemptions still prove the rule. However, the mere
existence of a public debate on recent trade deals, e.g. TTIP in the European, and TPP
and NAFTA in the U.S.-American debate, indicates that public interest in trade policy
has become increasingly important. Previously difficult to imagine, campaigns against
FTAs succeed to form a movement that mobilizes masses and creates influential waves of
protest.
In our opinion, a sound understanding of individual preferences for free trade and
globalization is of utmost importance in order to assess the democratic legitimacy of open-
market policies. This study thus fills the gap between international economics and political
economy. It sheds light on drivers, time trends, and correlations of attitudes towards open-
market policies in EU member states on the individual, regional, and national levels. For
the purpose of this study, we address the following questions:
First, what are the key characteristics that supporters and opponents of international
economic integration have in common? Preferences for and against open-markets are
shaped via two fundamentally different channels: economic self-interest and values. Ex-
ploring the former channel, we can employ observable socio-economic factors that are likely
to determine individual economic outcomes of free trade. According to the Heckscher–
Ohlin or the Specific Factors model, one would expect correlations between skill levels
and preferences for free trade. If, by contrast, individuals care about national identity,
independence, or autarky per se they are likely to express open-market attitudes that are
based on their values and ergo against their economic self-interest. Our aim is to separate
the effect of economic self-interest from value preferences.
Second, as our data allow to break down average attitudes towards globalization to
the regional level (NUTS2 or NUTS37 ) we are interested in explaining the large variation
in the support of open-market politics in the EU. Recent strands of the literature follow-
ing Autor et al. (2013) have emphasized heterogeneous regional effects of trade policy.
We examine region-specific fundamentals, e.g. macro variables, that may explain the ob-
served patterns. It stands out that macro variables such as unemployment, regional trade
7
The acronym NUTS denotes the "Nomenclature des unités territoriales statisques", a regional classifica-
tion used by Eurostat. The numbering indicates the respective level on descending order, e.g. NUTS3
has a higher resolution than NUTS2. For further information, click here.
4exposure, GDP level, and EU transfers can partly explain the cross-region variation.
Third, we have a closer look at inconsistent responses. For instance, we observe indi-
viduals who reject TTIP but are generally in favor of free trade (and vice versa). We can
also identify inconsistent group thinking phenomena. For instance, we observe a decline in
the support of free trade among older people. However, the support of protectionism de-
clines with age as well. As free trade and protectionism constitute antagonisms, response
patterns like these are puzzling and hence worth a closer examination. They could be the
result of ignorance, arbitrariness, a misunderstanding about the terms’ actual meaning,
or of a status-quo bias.
Our paper is closely related to Mayda and Rodrik (2005), who, based on survey data
from 23 countries in 1995, find that pro-trade preferences are correlated with individual
human capital and trade exposure to the individual sector of employment. They find that
high degrees of neighborhood attachment and nationalism is associated with protectionist
tendencies. We test their findings based on new data and show some differences indicating
that political economy of trade has changed.
Dutt and Mitra (2005) investigate the relation between government ideology and en-
dogenous trade policy; according to their findings, left-wing governments tend to adopt
more protectionist trade policies in capital-rich countries and more pro-trade policies
in labor-rich economies. Rho and Tomz (2017) challenge the underlying assumption of
international political economy of individual policy preferences that reflect economic self-
interest. According to them, economic ignorance ultimately causes voting behavior con-
tradicting rational considerations. Moreover, their experiments indicate that individuals
express more selfish interests once they learn how trade policies directly affect them. Addi-
tionally, the framing of information that is provided to participants substantially matters
for the outcome. This is in line with our finding which provides evidence that national
narratives of a certain open-market polices are relevant for their acceptance.
Going one step further, Caplan (2007) argues that not “economic ignorance” but
four biases (Anti-Market Bias, Anti-Foreign Bias, Make-Work Bias, and Pessimistic Bias)
shape individual preferences. Caplan claims that these biases all work against open-
market policies. In our setting, these biases may explain why some people favor protec-
tionism although it is in fact disadvantageous for them (e.g. unemployed persons, who do
not have a job that can be protected but who would face higher prices). Pitlik (2016) links
TTIP approval to distrust in multinational enterprises. According to TTIP opponents, it
is these enterprises that would gain the most from this FTA.
Grossman and Helpman (2018) argue theoretically that not only individual outcomes
of trade policies shape voters’ preferences; also group affiliation determines open-market
attitudes to the extent to which the status of the social group is affected by international
trade. For our regional analysis, we employ similar measures as Becker et al. (2017) who
used a rich set of district-level data in order to analyze Brexit vote outcomes. Dorn et al.
5(2016) use a measure for import competition to explain electoral outcomes in the U.S. and
find that districts, which are more exposed to import competition display a higher degree
of political polarization. In this paper, we also investigate whether import competition
directly affects trade attitudes.
We acknowledge the fact that certain endogeneity issues, such as omitted variable
and reverse causality problems, make it difficult to establish causation. Any assessment
of individual attitudes, mostly based on survey data, is inevitably disputable. However,
by exploiting a rich set of individual characteristics as well as fixed-effects, our data
allow controlling for many potential channels through which omitted variable biases could
interfere. In cases, in which we cannot exclude having identified correlations only, we state
this explicitly. Other well-established estimation approaches, for example applying time-
leads of explanatory variables, may resolve potential endogeneity issues, too. Nevertheless,
we believe that conditional correlations, which are a priori not obvious, can be insightful
and valuable for the understanding of international political economy. Moreover, our aim
is to identify groups of variables that can explain a substantial fraction of the variance of
the outcome variables.
The outline of the paper reads as follows: Section 2 provides an overview of our data
bases and provides some descriptive statistics in order to motivate our research question.
Section 3 derives some theoretical predictions and explains the empirical strategy, which is
used to test the aforementioned hypotheses. Subsequently, Section 4 discusses the results
at both the individual level (refer to Subsection 4.1) and the regional level (see Subsection
4.2). Section 5 summarizes the main results and concludes.
2 Data Description
The Standard Eurobarometer (EB) was established in 1974 in order to monitor opinions
of citizens across EU Member States and candidate countries. From the outset, the EB
had a strong focus on opinions about the common market, asking for attitudes towards
free trade and globalization in general but also addressing concrete policy topics, such
as the Transatlantic Trade and Investment Partnership. We exploit this rich data set to
better understand the political economy behind international economic integration. The
EB survey is one of the world’s largest survey based repeated cross-sections biannually
interviewing 1,000 participants in each EU Member State. The interviews take place in
each spring (March/April) and fall (October/November).
The question concerning TTIP was first included in the second semester of 2014 and
has repeatedly been posed in all waves since then.8 The corresponding variable is binary
(for vs. against) and, thus, does not need any further preparation. Additionally, we
evaluate so-called concept images which are included in the EB: after participants are
8
The latest available wave stems from 2017-1.
6confronted with simple terms or statements, they are asked to answer “whether the term
brings to mind something very positive, fairly positive, fairly negative, or very negative”.
These concept images are implemented, among others, for the terms Free Trade, Protec-
tionism, and Globalization. A further question asks whether globalization is considered
as an opportunity for economic growth; the set of potential answers again comprises 4
possibilities: totally agree, tend to agree, tend to disagree, and totally disagree. As long as
the concept images and the question concerning globalization as an opportunity serve as
dependent variables, they are re-coded into binary variables by combining the two positive
response options and the two negative response option, respectively. When we introduce
the concept of “strong preferences”, we focus only on those individuals choosing the an-
swers totally agree and totally disagree. All dependent variables take the value 1 if the
individual is in favor of TTIP, Free Trade, Protectionism, or Globalization, respectively.
For the sake of simplicity, the variable “globalization as opportunity for economic growth”
is called “Globalization Growth” while the concept image of globalization is referred to
as “Globalization Image”.
In total, we employ a data set including 166,000 observations. Thus, measurement
errors—as long as they are non-systematic—are not expected to bias our results in any
direction. The data cover 28 EU Member States plus two additional regions.9 At the sub-
national level, data for most countries are available at the NUTS-2 level.10 Due to a rich
set of of socio-economic control variables and other individual characteristics provided
by the survey, we are able to identify systematic patterns of correlations which shape
open-market attitudes.
In order to stress the strong regional and national heterogeneity observed in the inde-
pendent variables, Figure 1 shows regional average approval rates with respect to TTIP
and Free Trade. At the national level, the lowest TTIP approval rates are found in Aus-
tria (on average 27 percent), and the highest in Lithuania (91 percent)11 . The unweighted
European mean is 67.2 percent, the population weighted mean is 63.8 percent. The vari-
ation of attitudes towards free trade is remarkably lower, it ranges from only 59 to 91
percent. The correlation between the two variables is positive, the correlation coefficient
yields 0.62. It is striking that the public approval rate of TTIP exceeds the approval rate
of free trade in only 22 percent of the all regions. At the national level, this is the case in
Cyprus, Hungary, Lithuania, and Portugal. With respect to a few countries, a substantial
and steeply declining gap between TTIP approval rates and the free trade concept image
becomes visible: these countries are Austria, Germany, Luxembourg, and Slovenia. This
may be due to different reasons: a public perception that new and comprehensive trade
9
Germany is reported twice (Germany-East and Germany-West). The same applies for the United
Kingdom (Great Britain and Northern Island).
10
For the United Kingdom, Germany, and Italy only NUTS-1 regional data can be employed. For Croatia,
Estonia, Latvia, Lithuania and Ireland, higher resolution NUTS-3 level data are available.
11
unconditional mean.
7agreements differ from a conventional understanding of free trade, or general mistrust
in conducting free trade with the USA (i.e. anti-Americanism). Also, TTIP is a rather
recent treatise and respondents have to evaluate it in an anticipatory manner. Their
attitude towards free trade, on the other hand, can be affected by personal experience.
Figure 1: Regional attitudes towards TTIP and Free Trade
Source: Eurobarometer, 2017. Own illustration.
Note: The left/right figure illustrate the average support for TTIP/Free Trade in percent in the 247
NUTS regions in Europe. The same figures for the outcome variables globalization image, globalization
growth, and protectionism are shown in the Appendix.
Figure 2 illustrates the distribution of different open-market attitudes of European
citizens. It also includes non-responses. The following observations are noteworthy: first,
Europeans have a strong belief in the benefits of free trade. Roughly 69 percent of the
respondents assess free trade as either favorable or very favorable; more than 56 percent
believe that globalization is a chance for economic growth. Only 44.8 of the interviewed
people are favorable towards globalization. Due to a 14.1 percent share of non-responses,
this still constitutes the relative majority. Preferences for protectionism are relatively
balanced: for a weak relative majority of 40.7 percent, protectionism is not favorable,
while 37.8 percent approve of the idea of protectionism. This is contradictory to the
formerly observed response pattern of the free trade concept image. Interestingly, the
survey participants chose the answer “don’t know” most frequently in response to the
question on protectionism. This may indicate little knowledge on protectionism among
the respondents. The responses to the binary question concerning TTIP shows that a
vast majority of Europeans is in favor of this FTA. Figure 2 also demonstrates that most
individuals do not have what we call strong preferences as they seemingly tend to report
preferences for centered responses.
For a better understanding of the data, we want to show a simple variance decompo-
sition. In a panel consisting of n countries at t time observations, the outcome variable
8Figure 2: Distribution of Responses
Source: Eurobarometer, 2017. Own illustration.
Note: The figure illustrates the response distribution for the variables of interest over all conducted
surveys under investigation (2014-2 to 2017-1). Responses are population weighted (country-wise) for
the calculation of an European average.
(national mean of any attitude12 ) is obviously a linear combination of n country and t
time dummy variables. Table 1 disentangles to what extent open-market attitudes differ
across countries and within countries over time. It stands out that for all variables the
between variance is larger than 90 percent, while the within variance is 4 percent for TTIP
and equal or less than 1 percent for all other open-market attitudes.13
Table 1: Panel Variance Decomposition
TTIP Free Trade Protectionism Glob. Opportunity Glob. Image
Between 0.913 0.915 0.956 0.938 0.942
Within 0.039 0.010 0.001 0.009 0.007
Combined 0.952 0.923 0.957 0.947 0.948
Source: Eurobarometer, 2017. Own calculations.
Note: The table shows the panel variance decomposition for the five dependent
variables. The variance is decomposed by the comparison of R-Squares using country
vs. time fixed effects. The variance between reflects the variance across countries,
the variance within the time-variance within countries.
12
excluding missings.
13
Note that this is also driven by the fact that some questions were not asked in every survey wave.
9We can conclude that variation over time does not play an important role given the
short time span covered by our data (2014-2017). This does not come as a surprise as
structural changes related to globalization are long lasting processes and take longer time
periods to fully materialize. The decline of the Rustbelt in the U.S.—often considered as
one of the reasons for the outcome of the U.S. presidential election in 2016—did not take
place within a few years but stretched across decades. Hence, we focus on cross-country
and cross-regional variation. Figure 1 illustrates variation across regions and highlights
country fixed-effects. Table 2 shows the share of variation across regions which cannot
be explained by country fixed-effects.14 Country fixed-effects can explain the regional
TTIP attitudes best. In this way, only 20 percent remain unexplained. When it comes
to other open-market attitudes, country fixed-effects can account for less of the variation:
35 percent of the attitudes towards free trade are left unexplained. Protectionism is least
explained by nation-wide characteristics, while regional preferences for globalization de-
pend on regional variation by 27 and 35 percent, respectively.
Table 2: Variation Across Regions
TTIP Free Trade Protectionism Glob. Opportunity Glob. Image
Regional variation 0.199 0.348 0.384 0.268 0.354
Source: Eurobarometer, 2017. Own calculations.
Note: The table shows the variance across regions within countries for the five dependent
variables. The variance is 1 minus the R-Square statistics of a cross-sectional regression that
includes only country fixed-effects.
By construction, low numbers of observations and resulting drawbacks related to small-
sample regressions are detrimental to the quality of cross-country analysis. In order to
increase the number of observations, and to assess regional differences within countries, we
implement regional identifiers and calculate attitudes at the regional level. Unfortunately,
regional data at the same resolution are not available for all countries. As we do not want
to aggregate at the highest level (NUTS-1), we apply regional data at different NUTS
levels. For the sake of convenience, we use the term region synonymously for NUTS-1
regions in Germany and the UK, NUTS-3 regions in Croatia, Estonia, Ireland, Latvia,
and Lithuania and NUTS-2 regions in all other EU Member States. In total, we arrive
247 European regions.
The macroeconomic variables of interest are taken from Eurostat. We use data from
the year 2016 on median age of population, GDP level (in PPPs), unemployment rate, and
EU regional transfers. The latter data are made available by Becker et al. (2013)15 . Our
aim is to identify the variables that shape regional attitudes, which are typically formed
14
Note that we eliminate the time dimension in order to calculate regional means.
15
We are thankful to Sascha O. Becker, Peter Egger, and Maximilian von Ehrlich for sharing their data.
10over a long period of time and remain relatively stable. The aforementioned cross-sectional
observations fit this approach as they show only little time variation but large regional
variation. By contrast, economic performance measured by current GDP growth is too
noisy. Thus, we investigate the effect of GDP growth over the past decade on regional
attitudes. Aside from Eurobarometer and Eurostat data at the regional level, we employ
regional trade exposure data from Badinger and Reuter (2017)16 , who provide changes
in import and net-export exposure at the NUTS-3-level for the two time spans, namely
1991-2001 and 2001-2011; the regional exposure is calculated following the approach of
Autor et al. (2013) and takes the following form:
J p
Lir jt ∆Mijt
∆EiMr pt
X
= (1)
j=1 Lijt Lir t
The change in import exposure (∆E M ) is the change of total imports (M) over period
t in industry j per employed person (L) in country i´s region r coming from partner
country p. Change in imports is then assigned to country i‘s region r according to its
share in country i‘s total employment in industry j. Total import exposure (∆EiMr pt ) of
region ir from partner country p is then obtained by summing up the import changes in
industry j assigned to region ir over all industries.
Figure 1 shows the variation across European NUTS regions using the example of
TTIP and free trade approval rates. Both figures reveal substantial spatial variation that
is related to the geographic location displaying the following pattern: lower rates in the
core and higher rates in the periphery of the EU. In order to account for this effect, we
construct a measure “Distance to Brussels” which is the great-circle distance between
the center of a region to Brussels.17 This measure controls for any structural difference
between core and peripheral countries and captures institutional quality, cultural aspects,
as well as economic development.
3 Hypotheses and Empirical Strategy
3.1 Estimation
In order to identify the determinants of individual preferences for open markets, we begin
by applying ordinary least square estimates. Due to its linear structure, an interpretation
of the magnitude of the reported effects can easily be established. The estimated linear
16
We are thankful to Harald Badinger and Wolf Heinrich Reuter for sharing their data with us.
17
For the calculation, the harvesine formula is applied. This approach measures the shortest distance
between geographic locations, and is thus referred to as the crow flies.
11probability model takes the following structural form:
1i,j = αj + Xi β + ζt(i),j + ηr(i),j + i,j (2)
The indicator variable 1 takes the value one if individual i has a favorable opinion of
the binary dependent variable j, i.e. “pro free trade”, “pro TTIP”, “pro Protectionism”,
“pro Globalization”. It is a function of a constant α, a k-dimensional vector of explana-
tory variables Xi , time and region fixed-effects ζt(i) and ηr(i) , respectively, and an error
term denoted by i . The regression coefficients of interest are comprised in the vector β.
As robustness checks, we estimate the same model applying standard non-linear models
(Probit, Ordered Logit18 ).
As stated earlier, we also aim at identifying, among others, macroeconomic perfor-
mance variables that are able to explain the large variance across regions. Analogously
to our approach to individual attitudes, we distinguish between ideological and macroe-
conomic drivers. Without a national/regional utility function, a statement on rationality
can hardly be made. However, individual rationales (e.g. the effect of age) should also
be applicable to the analysis at the regional level; this follows by the aggregation of pref-
erences. Thus, we investigate which regional characteristics shape the average preference
at the regional level. For this purpose, we also examine region fixed-effects ηr(i) for all
variables of interest. This approach allows us to estimate conditional regional averages
after controlling for all individual characteristics. We estimate the model:
ηr(i),j = αj + Zr γ + ηc(r) + ur,j (3)
The conditional approval rate ηr(i) for policy j in region r is a function of some constant
α, a vector of regional characteristics Z, country fixed-effects denoted by η and an error
term u. We are interested in estimated coefficients of vector γ and their contribution to
overall fit of the model.
3.2 Hypotheses for Individual Preferences
A variety of characteristics shapes individual preferences for open-market policies. We
classify variables representing economic self-interest, if a direct link between a certain
policy and an individual economic outcome can be established. According to classical
trade theory, occupation variables are thought to explain individual gains from trade. As
the agricultural sector in the EU is highly protected, an opening of this market is likely to
result in losses. Of course, these direct job linkages outweigh indirect effects (price reduc-
tions, higher number of available varieties, general equilibrium effects); aggregate gains
from trade have to be taken into consideration and typically exceed losses. Whereas gains
18
Section 2 on our data explain that four of dependent variables are categorical.
12are widespread, individual losses (e.g. job loss) are much more concentrated. Asymmetry
in outcomes is one reason why promoting free trade is not straight-forward.
Another matter that is closely linked to occupation variables is human capital, i.e.
education. In general, higher education is linked to labor market success. A high endow-
ment with human capital would also lower costs from sector-reallocation in response to
trade liberalization. These trade adjustment costs result from, a.o., retraining, tempo-
rary unemployment, job search, or relocation. Considering them as fixed costs, younger
individuals should be more likely be in favor of open-market policies as the related costs
are distributed over longer life time cycle. Hence, we conjecture a decline for open-market
attitudes in age.
The above-stated hypotheses can be categorized as attitudes following economic self-
interest. However, as we show later, “soft determinants” play a more important role in
shaping individual preferences. The EB provides detailed information on the survey par-
ticipants’ ideology and beliefs. For instance, respondents are questioned concerning their
trust in different national and EU institutions. Without doubt, these soft determinants
function either way. However, there are good reasons why trust matters: if trade liberal-
ization is administered in a way that the winners compensate the losers, support for such
policies should increase in the reported level of trust. Moreover, trust in the EU which
exclusively responsible for the EU’s foreign trade and competition politics is essential for
individual preferences (Pitlik, 2016).
The available data allow for a classification of the participants on a standard political
left-right scale; one would expect that right-wing individuals to support trade liberal-
ization, free trade and TTIP. Following the Rodrik Trilemma, right-wing individuals are
more likely to favor sovereignty which, however, counteracts free trade. We expect left-
wing individuals to favor equality and thus to have lower preferences for open-market
policies as these typically involve increases in national inequality (Zhu and Trefler, 2005).
Grossman and Helpman (2018) theorize that belonging to a certain social group can
determine free trade attitudes beyond individual outcomes if the status of the social
group is affected by trade policies. The working class, which is threatened by import
competition relatively more than higher social classes, should show less support for open-
market politics. Personal well-being, measured in terms of life satisfaction, serves as a
control variable to factor in whether survey participants generally provide more positive
or negative answers.
3.3 Hypotheses for Regional Preferences
Dani Rodrik’s idea of social preferences for the three objectives (sovereignty, democracy,
economic integration) can be represented in its most simplistic way as depicted in Figure
8 in the Appendix. Assuming that democracy constitutes the preferred from of gover-
13nance in western societies, we reduce the Trilemma to a two-dimensional trade-off by
eliminating the democracy dimension. The abscissa of the diagram shows the degree of
international economic integration. The ordinate illustrates a utility/cost scale. Increas-
ing international economic integration leads to higher consumption possibilities but comes
at the cost of a loss in legislative autonomy. Optimality requires that marginal utility of
consumption equals marginal cost of giving up sovereignty. B realizes the optimal level of
international economic integration; any chosen form of integration to the left of B (think
of North Korea in extremis) is inferior and economic integration would generate net gains.
C reflects a situation of over-integration: eventually, Brexit supporters have located the
United Kingdom to the right of an optimal degree of integration. This brief exercise
demonstrates that GDP maximization does not sufficiently describe the optimal degree
of international integration. We conjecture that public support for open-market policies
is higher in poorer regions and countries.
Unemployment can affect public opinion about open-markets via two opposing chan-
nels: people from regions which experience high unemployment rates could blame this fact
on globalization; this is the case when attitudes are shaped by looking back. Consequently,
open-market policies are opposed. Contrarily, individuals from those regions could also
be in favor of trade liberalization if open markets are considered as a chance to catch up;
in this case, people’s attitudes are shaped by looking forward. Hence, the direction of
the effect is ex ante ambiguous. The effect of EU regional transfers, however, should be
unambiguous: the amount of EU structural funds should weaken negative trade adjust-
ment costs and thus increase support for open-market attitudes. As EU structural funds
are not assigned randomly but depend on the GDP level, a useful estimation requires
the inclusion of the GDP level. Recent research examines changes in import-exposure
measures in order to assess the impact of globalization on regions. We assume that higher
import-exposure materializes in less support for open-markets. Higher export-exposure,
by contrast, should have the opposite effect. All other variables included in the regional
preference regressions follow a similar pattern as the variables that are used to estimate
individual preferences.
144 Discussion of Results
The subsequent section presents our main findings with respect to the above-stated hy-
potheses. For the sake of clarity, we present the results for individual (Subsection 4.1),
and regional attitudes (Subsection 4.2) separately.
4.1 Individual Attitudes
Baseline
Explaining how individual attitudes towards open-market policies are shaped, we classify
four sets of explanatory variables. The first set includes variables informing about people’s
trust in certain institutions. The second set of variables provides information on individual
ideology and political stance; the third contains socio-economic characteristics that might
shape attitudes towards open-market policies, e.g. social class, age, gender, education
and occupation. These sets of variables are shown in descending order with respect to
their contribution in explaining individual attitudes. Our baseline specification in Table
3 also comprises an interaction of region and time fixed effects.
Table 3 shows the determinants of individual attitudes towards the 5 dependent vari-
ables. The first set, trust in institutions, reveals our first main finding: trust in institutions
is a very dominant driver of individual attitudes. In particular, “Trust in the EU” im-
pacts open-market attitudes between 12 and 19 percent; protectionism, a policy area for
which the EU is exclusively responsible is less affected. Certainly, a causal relation could
work in both direction, e.g. individuals who are in favor of closed economies may have
less trust in institutions which traditionally support international economic liberalization.
However, it is worth keeping in mind that the new anti-free trade movement is not an
isolated phenomenon but is associated to a more general trust crisis.
The second set of independent variables includes measures that account for individual
ideology and political stance. Being politically more informed cannot be clearly attributed
to more positive or negative open-market attitudes. The negative sign for TTIP, despite
a small magnitude (-0.5 percentage points), is consistent with our perception of a bi-
ased public debate about TTIP, i.e. an anti-TTIP campaign that became visible in some
countries.19 We discuss these country-specific campaigning effects below. For the inter-
pretation of the variables on political stance, please note that the group “center” is left out
due to multicollinearity. Hence, all coefficients need to be interpreted relative to centrist
preferences. In line with our priors, leftists are less likely to approve TTIP by around 9
percentage points. The effects on attitudes towards free trade and the globalization point
19
Interestingly and in line with Pascal Lamy’s proclamation of the new world of trade, these campaigns
focused mainly on precaution related issues and circumvent standard arguments for protectionism (job
losses in certain industries).
15in the same direction, even if the magnitudes become slightly smaller. Moving along
the political spectrum to the right, support for open-markets is u-shaped. It increases
to the center-right and declines for far right. This might be due to distinct preferences
for national autarky. The results for protectionism are particularly striking: leftists and
center-leftists tend to disapprove protectionism. This is at odds with our priors, as typi-
cally left-wing parties tend to favor protectionist measures. The effect of political stance
is shown graphically in Figure 3. Overall, ideological variables seem to follow expected
pattern.
Life satisfaction is positively correlated to all outcome variables. In the first place, a
clear economic relationship between life satisfaction and open-market attitudes may not
be obvious. However, from a behavioral perspective, happier individuals tend to give
more positive answers in general, no matter the which topic. To eliminate this bias, we
include the life satisfaction. It increases the likelihood of positive answers in our baseline
specification by 2.9 to 4.5 percentage points. Including a variable for education20 shows
negative effects on the outcome variables, two of which are statistically significant. Mean
education time is 19.4 years and its standard deviation yields 5.1 years; one standard
deviation increase in education decreases the support for TTIP, ceteris paribus, by 1
percentage point. High skilled individuals are typically considered to adjust more easily
to trade shocks, while low-skilled workers might suffer relatively more. The opposite
result is another indication that the political economy of trade has changed, and that
open-market attitudes cannot sufficiently be explained economically.
There is no gender specific deviation with respect to TTIP attitudes. However, male
and female respondents show different preferences for free trade and protectionism. Ex-
cept for their image of globalization, men’s support of open markets rates higher than
women’s. As for the effect of age on the outcome variables, we allow for non-linearity;
this is discussed in more detail later. Social class is categorical, has five realizations21
and increases in the status of the self-reported class. Accordingly, the difference in sup-
port between the highest and the lowest class equals five times the reported coefficient.
An increase in social class goes along with an increase in the probability of being in fa-
vor of open markets: TTIP increases by 0.8 percentage points at the margin, free trade
by 1.2, protectionism decreases by 1 percentage point (not statistically significant), and
globalization attitudes increase by 1.9 and 1.7 percentage points, respectively. Living in
rural regions has no effect on attitudes towards TTIP, protectionism, and the image of
globalization, but entails a slightly negative impact on the approval of free trade and
the globalization opportunity variable. According to our estimates, occupation is a poor
predictor for the support of to open-market policies. We can identify a negative effect
20
This variable provides information on the age of respondents when finishing their education. Thus, it
increases in the level of education.
21
Working class, lower middle class, middle class, upper middle class, and higher class.
16for farmers and fishermen on TTIP (-6.3 percentage points) and globalization as an op-
portunity for economic growth (-2.9 percentage points), no effect of being self-employed
on any of the variables, and a substantially higher support for protectionism among blue
collar workers (4.4 percentage points). White collar workers do not show any differences
in their preferences, and unemployed individuals show significantly lower approval rates
for free trade, and globalization as opportunity for economic growth. Note that the refer-
ence group consists of inactive individuals, i.e. students and retired persons). Similar to
the occupation variables, other variables that are available in the Eurobarometer survey
have no effect on the individual attitudes. These include, amongst others, information on
private wealth.
17Table 3: Individual Open-Market Attitudes
TTIP Free Trade Protectionism Glob. Opportunity Glob. Image
(1) (2) (3) (4) (5)
Trust European Union 14.76∗∗∗ (1.38) 12.04∗∗∗ (1.19) 5.33∗∗∗ (1.03) 18.94∗∗∗ (1.47) 18.20∗∗∗ (1.08)
Trust Political Parties 0.77 (1.11) 0.96 (0.64) 8.00∗∗∗ (1.58) 1.83∗∗∗ (0.56) 7.70∗∗∗ (0.98)
Trust Nat. Government 2.38∗ (1.25) 3.49∗∗∗ (0.70) 2.43∗ (1.37) 3.25∗∗∗ (0.72) 3.02∗∗∗ (1.00)
Trust Nat. Parliament 0.18 (0.85) 2.13∗∗∗ (0.57) 2.71∗∗ (1.14) 2.12∗∗∗ (0.56) 2.68∗∗∗ (0.82)
Political Interest -0.51∗ (0.29) 0.25 (0.30) -0.98∗ (0.48) 0.69∗∗ (0.26) 0.13 (0.33)
Left -9.30∗∗∗ (1.83) -8.17∗∗∗ (1.39) -2.75∗ (1.48) -4.87∗∗∗ (1.05) -3.56∗∗ (1.35)
Center-Left -5.10∗∗∗ (1.00) -3.65∗∗∗ (0.80) -4.64∗∗∗ (0.89) -2.55∗∗∗ (0.60) -3.40∗∗∗ (0.65)
Center-Right 2.43∗∗ (0.89) 1.59∗∗∗ (0.56) -1.36 (0.83) -0.86 (1.00) -1.09 (0.88)
Right 0.72 (1.52) -0.91 (0.93) 2.08 (1.26) -2.83∗∗ (1.32) -0.32 (1.36)
Life Satisfaction 2.90∗∗∗ (0.42) 3.88∗∗∗ (0.45) 2.19∗∗∗ (0.62) 4.41∗∗∗ (0.32) 4.46∗∗∗ (0.47)
Education (finish age) -0.17∗∗∗ (0.05) -0.06 (0.05) -0.52∗∗∗ (0.11) -0.00 (0.03) -0.09 (0.07)
Male 0.51 (0.72) 1.88∗∗∗ (0.34) -4.75∗∗∗ (0.91) 0.22 (0.49) -0.96∗ (0.49)
Age -0.19∗∗ (0.07) -0.28∗∗∗ (0.08) -1.06∗∗∗ (0.12) -0.40∗∗∗ (0.08) -0.92∗∗∗ (0.12)
Age squared x 100 0.14∗∗ (0.06) 0.20∗∗∗ (0.07) 0.79∗∗∗ (0.12) 0.25∗∗∗ (0.08) 0.69∗∗∗ (0.11)
Social Class 0.83∗∗ (0.33) 1.24∗∗∗ (0.38) -0.96 (0.73) 1.91∗∗∗ (0.40) 1.70∗∗∗ (0.38)
Rural 0.39 (0.74) -0.97 (0.66) -0.16 (0.81) -0.82 (0.52) -0.98 (0.72)
Farmer and Fisherman -6.33∗∗∗ (2.23) -2.46 (2.78) 0.79 (3.12) -2.87∗ (1.41) -1.85 (2.11)
Self-Employed -0.64 (0.65) 1.37 (0.99) -1.47 (1.18) -0.54 (0.85) 0.54 (0.81)
Blue Collar Worker 0.64 (0.59) -0.17 (0.40) 4.45∗∗∗ (1.11) 0.17 (0.56) 0.34 (0.67)
White Collar Worker 0.86 (0.51) 0.21 (0.87) -0.88 (0.82) 0.18 (0.56) 0.59 (0.74)
Unemployed -1.18 (0.72) -1.70∗∗ (0.69) -0.56 (1.17) -1.52∗ (0.75) -0.12 (0.75)
Observations 92664 64640 42009 92666 61745
R2 0.19 0.13 0.16 0.19 0.18
Source: Eurobarometer, 2017. Own calculations.
Note: Ordinary least square estimates, standard errors in parentheses. All specifications include region-time fixed-effects.
Standard errors are clustered at the country level. ***, ** and * indicate statistical significance levels for p-val. < 0.01,
p-val. < 0.05, and p-val.< 0.1.
18This correlation exercise exemplifies that determinants beyond economic self-interest
shape preferences for open-market policies. Thus, the data support Lamy’s (2015) and
Rodrik’s (1998) description of attitudes: if in the new world of trade, precaution—and not
protection—is for sale, it is not far-fetched that trust in the relevant institutions matters
much more than individual labor market outcomes. At the same time, higher education
and high-paid jobs do not strengthen open-market attitudes indicating that potential
winners in economic terms prefer non-economic objectives over additional income. Our
findings illustrate that the classical antagonism between left and right cannot consistently
explain attitudes towards open-markets at the individual level. Clearly, even the inclusion
of a very rich set of explanatory variables that covers various potential channels deter-
mining open-market sentiments cannot explain individual preferences comprehensively.
This is reflected by R-Square statistics below 20 percent. An explanation for the weak
performance of our model might be arbitrariness, or simply a misunderstanding of the
survey questions by the participants. Related literature shows that surveys participants
tend to favor center responses rather than extremes. This is often referred to as central
tendency bias.22 Accordingly, the next subsection focuses on strong preferences which
allows us make much better predictions concnerning individual attitudes.
Strong Preferences
For the sake of a clear notation, we consider individuals having strong preferences if they
are either very much in favor or very much against certain politics. Hence, we restrict
our analysis on a sub-sample of answers. In doing so, we lose the question on TTIP, which
is non-categorical. Results are shown in Table 4. The fit of the model increases quite
substantially up to more than 45 percent. Accordingly, most of the reported coefficients
increase in absolute values. It is striking that occupation variables do not carry much
weight here as well. Altogether, we don not find evidence that classical trade theory
provides a useful frame of reference for the political economy of trade.
22
For an overview on the effects of central tendency bias and related literature cf. Allred et al. (2016).
19Table 4: Individual Open-Market Attitudes – strong preferences
Free Trade Protectionism Glob. Opportunity Glob. Image
(1) (2) (3) (4)
Trust European Union 14.83∗∗∗ (2.17) 5.84∗∗∗ (1.54) 27.60∗∗∗ (3.36) 25.27∗∗∗ (2.40)
Trust Political Parties 1.38 (1.24) 11.68∗∗∗ (2.76) 1.38 (1.27) 9.76∗∗∗ (1.77)
Trust Nat. Government 4.45∗∗∗ (1.44) 2.67 (1.86) 4.20∗∗ (1.57) 6.54∗∗∗ (2.13)
Trust Nat. Parliament 2.19∗ (1.08) 3.13 (1.86) 3.95∗∗∗ (0.98) 3.76∗∗ (1.67)
Political Interest 0.86∗ (0.44) -0.62 (0.55) 1.05∗∗∗ (0.32) 0.45 (0.48)
Left -10.53∗∗∗ (2.47) -1.71 (1.98) -5.51∗∗∗ (1.40) -5.02∗∗∗ (1.63)
Center-Left -3.41∗∗∗ (1.12) -2.82∗ (1.40) -2.67∗∗∗ (0.94) -3.21∗∗ (1.42)
Center-Right 1.63∗ (0.80) -2.03 (1.28) -0.00 (1.57) -0.46 (1.65)
Right -2.58 (1.75) 1.73 (1.71) -2.45 (2.13) -0.39 (1.97)
Life Satisfaction 4.11∗∗∗ (0.75) 1.55∗ (0.83) 5.37∗∗∗ (0.58) 4.73∗∗∗ (0.98)
Education (finish age) -0.18∗ (0.09) -0.55∗∗∗ (0.14) 0.09∗ (0.05) -0.06 (0.12)
Male 1.56∗∗ (0.64) -5.58∗∗∗ (1.56) 1.49∗∗ (0.71) -0.84 (0.71)
Age -0.42∗∗∗ (0.12) -1.18∗∗∗ (0.25) -0.51∗∗∗ (0.14) -1.14∗∗∗ (0.17)
Age squared x 100 0.33∗∗∗ (0.11) 0.82∗∗∗ (0.22) 0.35∗∗ (0.13) 0.84∗∗∗ (0.17)
Social Class 2.19∗∗∗ (0.50) -0.17 (0.96) 2.73∗∗∗ (0.39) 1.99∗∗ (0.74)
Rural -0.47 (1.48) 0.02 (1.62) -1.01 (0.74) 0.19 (1.20)
Farmer and Fisherman -10.00∗∗ (3.82) -1.89 (4.28) -2.62 (3.24) -0.77 (3.56)
Self-Employed 2.80∗ (1.50) -1.13 (1.78) 0.00 (1.31) -0.71 (1.36)
Blue Collar Worker -0.41 (0.74) 3.03∗ (1.57) -0.50 (0.67) 0.71 (1.19)
White Collar Worker 1.33 (1.37) -1.64 (1.60) 1.14 (0.75) 1.48 (1.39)
Unemployed -1.09 (1.53) -2.46 (1.67) -0.54 (1.40) 0.51 (1.61)
Observations 16020 11303 25351 13298
R2 0.32 0.39 0.45 0.47
Source: Eurobarometer, 2017. Own calculations.
Note: Note: Ordinary least square estimates, standard errors in parentheses. All specifications include
region-time fixed-effects. Standard errors are clustered at the country level. ***, ** and * indicate
statistical significance levels for p-val. < 0.01, p-val.Figure 3: The Effect of Political Ideology on Open-Market Attitudes
Source: Eurobarometer, 2017. Own illustration.
Note: The figure illustrates the effect of political stance on a scale between 1 (very left) and 10 (very
right) on the the five variables of interest. Category 10 is left out for multicollinearity reasons.
Regressions are specified as in Table 3 and 4.
The Effect of Political Interest
Political interest is a variable that accounts for self-reported interest in and knowledge
about political issues. The variable is categorical and has for realizations. From this
variable, we can deduct how individual attitudes are determined in the context of na-
tional public debates. If—all else equal—politically more informed individuals report
above-average approval rates of TTIP in country A and below-average approval rates in
country B, we can identify certain country-specific narratives surrounding our outcome
variables. Hence, we interact political interest with country fixed-effects. Apart from
that, estimations are specified as in Table 4.24
Results of this exercise are shown in the Appendix. Note that for the sake of clar-
ity, significant coefficients are marked colored. With respect to TTIP, the most nega-
tive narratives are found in the Netherlands, Germany, Luxembourg, Spain, Sweden and
Slovakia. In Italy, Greece, Cyprus and most of the eastern European Member States,
24
For TTIP, we use the specification as shown in Table 3.
21You can also read