CONSUMER RELATIONSHIP MANAGEMENT AND RELATED ISSUES IN THE MOBILE TELECOM INDUSTRY IN INDIA - February 2013
←
→
Page content transcription
If your browser does not render page correctly, please read the page content below
CONSUMER RELATIONSHIP
 MANAGEMENT AND RELATED ISSUES
IN THE MOBILE TELECOM INDUSTRY IN
               INDIA

             February 2013

                             1|Page
1. Background
The Indian telecom market is one of the most competitive telecom markets in the world. There
are 13 telecom service providers and entire telecom market is divided into 22 circles distributed
geographically throughout the country. There is serious competition across circles as around 11
telecom players are present in each circle. It is not only the number of players but existence of
level playing field that makes the competition intense. Compare to other countries in the world,
the competition in Indian telecom market is hyper as only few countries in the world have more
than 5 players1.
In fact, studies have pointed out that “too much” of competition has had an adverse impact on the
spectrum allocation policies for wireless. Competition has resulted in allocative inefficiencies
with spectrum being spread too thinly across operators. The result has been a fragmented market
with many operators, each having very limited bandwidth with limited alternative wire-line
infrastructure available, thus posing restrictions in the supply side for broadband connectivity
(for instance, International Internet bandwidth per 10,000 population in Mbps is 2.2, while it is
172.2 for Finland).2
While this may be true and “too much” competition may have limited the “customer experience”
of the west, but it was this intense competition that was essential in delivering voice to as many
customers as possible and was the critical first step in implementing the budget telecom network
model. Operators have managed to provide affordable voice connectivity, even to the poor
within these markets for substantially low costs. They have achieved this through a series of
technological and service-process innovations. The radically lower prices attracted more minutes
of use, which, in turn, made further reduction possible. Operators were able to load their
networks with high volumes of revenue-yielding minutes because they had succeeded in
reducing the transaction costs of dealing with large numbers of customers who generate small
amounts of revenue. Prepaid, which reduces transaction costs and also accommodates the needs
of those with irregular earning patterns, was a critical element. Along with these innovations, the
exponents of the budget telecom network model also succeeded in drastically reducing both
capital costs and operating costs.3
The total subscriber base in India stood at 937.7 mn as on 30th September 2012. Private sector
operators’ share in the market was 88.43% and remaining belonged to state owned units
(11.57%). Wireless subscribers were 96.7% of the total subscribers. Subscribers have been
leaving fixed line services for mobile services.
1
Indian Mobile Services Sector – Struggling to maintain sustainable growth, White Paper by Cellular Operators
Association of India(COAI)-PricewaterhouseCoopers(PwC), August 2011.
2
Sridhar, V., etal. Flexible spectrum management for mobile broadband services: How does it vary across advanced
and emerging markets? Telecommunications Policy (2012), http://dx.doi.org/10.1016/ j.telpol.2012.07.008
3
Samarajiva, Rohan. Leveraging the Budget Telecom Network Business Model to Bring Broadband to the People.
Information Technologies and International Development Journal (2010). Volume 6, SE, Special Edition, 93–97.
2|PageThe wireless subscriber base is predominately urban (63.06%) and rural subscribers constitute
36.94% of the total. Overall teledensity stands at 74.49, in urban areas it is 154.64 and in rural
areas 39.52, which shows, there is still much scope for expansion in rural areas. Within wireless
services, 90.8% were GSM subscribers and 9.2% were CDMA subscribers. Another major
characteristic of Indian telecom market is that wireless subscriber base is mainly prepaid
dominated customers (96.3%) and postpaid subscribers only constituted 3.7%. Characteristics of
these prepaid customers are prominent which include switching between telecom operators
frequently, using mobile device with capability of multi-SIM, low value, low usage, etc.
Basically, prepaid customers seek incremental lower prices and better value for money. Mobile
devices can have capacity up to 4 SIMs and multi-SIM handsets were 57% of the total handsets
that were shipped in India in 2011, representing y-o-y Growth of 61%.4 The tariff war among
telecom operators coupled with entry of some small players has led to significant increase in
ownership of multi-SIM handsets.
Figure 1: Presence of telecom service providers- circle wise (as on 30th September 2012)
Circles
West Bengal Bharti
U.P.(W)
U.P.(E) Reliance
TN (incl. Chennai)
Rajasthan Vodafone
Punjab
Tata
Orissa
North East Idea
Mumbai
Maharashtra Aircel/Dishnet
MP
Kolkata
BSNL
Kerala MTNL
Karnataka
J&K Uninor
HP
Haryana Sistema
Gujarat
Loop
Delhi
Bihar Videocon
Assam
AP Quadrant (HFCL)
0 20 40 60 80 100
Subscribers(millions)
Source: TRAI performance indicator report, September 2012.
Recently wireless subscriber base has been dwindling (as growth over previous quarter was -
2.94% on September 2012). This decline of subscriber base is mainly due to cleaning up of
4
Source: Indian Mobile Handsets Report http://www.nextbigwhat.com/indian-mobile-handsets-report-multi-sim-handsets-make-up-
over-57-of-total-shipments-297/ (accessed on 26th Jan. 2013)
3|Pageinactive subscribers by the service providers.5 Exit of some of the service providers, to some
extent, have also affected this decline in subscriber base. Reason behind exit of few players was
that Supreme Court had ordered cancellation of licences issued on/after January 2008 due to
unfair allocation of spectrums and the service providers whose licences were cancelled were
allowed to continue till January 18, 2013. Companies like Loop Mobile, S-Tel and Etisalat have
already stopped operations in circles allocated to them in January 2008.6 Further, Uninor has
shut down its operations in Kolkata and West Bengal circles and Videocon has also stopped its
GSM operations in 11 circles. These companies had requested their customers to port to another
network either by using Mobile Number Portability (MNP) or otherwise. However, not all
subscribers migrated to another network, because many of them use multi-SIMs. They simply
have to shift to another SIM of existing service provider. Customers with multi-SIM had taken
SIM card of small players in addition to one from top player because in the beginning attractive
packages were offered by small players to increase their subscriber base.
Out of the total wireless subscribers, 77.1% subscribers were active subscribers in VLR (Visitor
Location Register). Active subscribers in this case mean how many actually use their
connections. This has bearing on service providers’ revenue as active subscribers are the ones
who actually going to pay.
Figure 2: Active wireless subscribers as percentage of total subscribers as on September 2012 (in %)
94.5 91.8
90.1
76.2 77.1
62.2 59.9
53.5 53.5 51.4 50.3
46.8 46.6
40.0
Source: TRAI’s press release on telecom subscription data, September 2012.
As can be seen from figure 2 above, Idea, Bharti, and Vodafone are the top three service
providers with active subscribers more than 90%. Small players and public sector units (BSNL
5
Source: http://articles.timesofindia.indiatimes.com/2012-12-22/telecom/35968862_1_subscriber-base-service-
providers-sim-cards (accessed on February 9, 2013)
6
Source: http://articles.timesofindia.indiatimes.com/2012-12-22/telecom/35968862_1_subscriber-base-service-
providers-sim-cards (accessed on February 9, 2013)
4|Pageand MTNL) have comparatively less active subscribers. Idea (Rs. 107), Bharti (Rs.137) and
Vodafone (Rs.122) have also performed better with Average Revenue Per User (ARPU) across
their respective circles compared to others.7
Top five service providers have combined share of 76% of the total market in terms of total
subscriber base (i.e. Bharti-20%, Vodafone-16%, Reliance-15%, BSNL-13% and IDEA/Spice-
12%). However, in terms of active subscribers market share of top five players was 81.4% as on
September 2012.
If we have a look at net addition of subscribers in the third quarter of 2012 (figure 3), service
providers like Videocon, Reliance, Unitech and MTNL were top losers and small players--
Quadrant (HFCL) and Aircel along with BSNL were gainers. Top players--Vodafone and Bharti
did manage to hold on to much of their customers as net loss of subscribers was less than 1%.
Figure 3: Net addition of subscribers as on 30th September 2012 over previous quarter-30th June 2012
10
6.23
5 2.67
1.38
0.27
0
Subscribers (million)
Aircel/Dishnet
Unitech
Bharti
Loop
MTNL
Tata
BSNL
Quadrant (HFCL)
Sistema
Reliance
Vodofone
Videocon
Idea/Spice
-5
-2.33 -3.88
-0.74 -4.95
-7.53
-10 -0.68 -1.45
-15 -12.78
-20
-20.22
-25
Source: TRAI’s press release on telecom subscription data, September 2012.
Has competition delivered benefits to the consumer?
An evaluation of the Indian telecom sector in last decade reveals that service providers were
highly focused on customer acquisition from the beginning. The race for acquisition of
customers was intense in order to gain market shares. However, in 15 years with existence of 15
players (now reduced to 13), much of the urban markets is saturated. Tele-density in these urban
markets is beyond 150 now, meaning there is not enough market left to add new mobile
connection, other than eating each other’s market shares. Rural market is the next target for
expansion of customer base, but it is tough to expand in rural market due to many limitations
such as low value customers, lack of infrastructure and low levels of education etc.
7
Report on ARPU/Revenue Analysis by Cellular Operators Association of India (COAI), July-Sept. 2012.
5|PageSo far telecom operators have tried to maximize revenue by minimizing costs and expanding
customer base. With increasingly saturated market (specially Urban), ideally they should try to
shift their focus on serving existing customers better and improve customer experience in order
to build value based long lasting relationships. Therefore, spending resources on retention of
existing customers and developing relationships with them is next focus area for the telecom
operators. To retain customers, service providers will have to improve service quality for their
customers. Moreover, telecom market is showing some signs that tariffs can no longer be
reduced beyond a point as recently Airtel and Idea have increase their call rates as much as by
100%.8 Continuously rising costs, decreasing tariffs and saturated markets have made this
increasing tariff inevitable. If service providers want customers to pay more, they will have to
invest more in giving better customer experience.
Presently customers are not able to differentiate operators based on services provided.
Prices/tariffs are also comparable across the service providers. Therefore, main differentiators in
this highly competitive market are difficult to point out, but some of the generally perceived
differentiators among the telecom operators are coverage and quality of network, brand loyalty,
advertisements, customised offers, etc.
High prepaid subscriber base, increasing churn rates and price sensitive customers are both cause
and effect of price war between operators. High price sensitive and low value customers are less
demanding about customer services, which do not serve as differentiator between operators.
However, this does not imply that the operators do not have a customer focus. First, quality of
service regulation has mandated specific benchmarks, which have to be met for regulatory
compliance. This has to be complied with a well-established grievance redressal mechanism.
Operators just have to make sure that they are able to provide at least what the regulator sets, in
the budget telecom model of competition.
Many established players in the market, such as Vodafone and Airtel, have built their strategies
around reducing prices rather than providing high level of customer services. This is why, not
many subscribers would be able to differentiate operators based on services. Average Revenue
Per User (ARPU) in the industry is around Rs. 99 9 (less than $2) per month, which means there
is hardly any room for taking some part of this to provide better customer services. One can
argue that high volume of customer base makes up for low level of ARPU, however, high
volume of customer base also means more pressure on customer services. Even though prepaid
customers are less demanding of customer services, still there will be some demand for it and
with increasing customer base pressure on customer services will go up.
Recent 3G auction has turned out to be very costly for the operators. This implies that service
providers will be more focused on serving their debts. Therefore, room for improving customer
services might further narrow down. Introduction of Mobile Number Portability (MNP) has put
8
http://articles.economictimes.indiatimes.com/2013-01-23/news/36505845_1_tariff-hike-tariff-increases-
telecom-sector (accessed on February 2, 2013)
9
TRAI Performance Indictor Report, July-Sept. 2012.
6|Pagemore strain on the operators’ resources as it would be test of their abilities to retain customers
and improve loyalty. The operators are focusing more on urban market for enhancing customer
experience, because in rural areas many customers have multi-SIM devices, less loyalty, low
value customers and thus controlling the churn in this segment would be costly and difficult.
Telecom operators will have to play dual role, they have to concentrate on urban market for
revenue by providing better experience to customers and venture in rural market for expanding
subscriber base. For this reason the operators will have to build solid customer relationship
management (CRM).
It is in this background that we review Customer Relationship Management (CRM) practices. It
is indeed evident that with ARPU as low as USD 2 per month, majority of customers being
prepaid and multiple SIM ownership being the norm rather than an exception poses a challenge
for telecom operators to choose CRM practices. CRM practices have thus to respond to these
challenges such that they can act as a differentiator in this highly competitive and increasingly
mature market. Operators realize that consistency of brand and service experience beyond the
fundamentals of network coverage and quality are very important, but there were few examples
of industries that had been able to truly drive wide reach while at the same time delivering brand
consistency.
2. Consumer Relationship Management
In a dynamic telecom market like India, implementation of CRM and making sure that it
performs well is a huge challenge. In such a dynamic market, to gain competitive edge or keep
existing one, a company has to continuously improve, innovate and manage its resources to stay
ahead. Many telecom companies have been building their organizational capacity in this regard.
CRM is thus an outcome of the dynamics of competition as there is no option but to adopt such
practices for staying afloat in a mature market. Thus, most of the telecom have adopted
technology for CRM activities such as service activation, revenue and billing management,
customer analytics and contacts Centers/call centers
CRM is a systemic approach to handle customer relationships which aims at minimizing cost on
customer acquisition, better customer interaction, efficient customer service, high overall
customer satisfaction, increase rate of customer retention, etc. Collecting information about
customers’ behaviour, analysing the information for making marketing strategy, using the
information for improving customer service and making business more efficient are important
features of CRM.
7|PageFigure 4: Following chart shows how CRM is used keeping in target optimization of customer retention
Source: Transformation telecom retention with analytics by James Taylor, Decision Management Solutions, 2010.
CRM requires organizational and business level approaches – which are customer centric –to
doing business rather than a simple marketing strategy. Effective CRM depends upon many
things such as how the data is collected, how analytics are used to understand the data i.e.
intelligent handling of data and technology, quality of customer database, development of
relationship with customers to build loyalty, and building knowledge base and diffusing it well to
different areas within the company. Moreover, only having technology and infrastructure is not
enough as other aspects such as decision-making processes and organizational structures also
have impact on effectiveness of CRM.
As far CRM for customer services is concerned, almost all telecom operators have to deliver at
least according to regulations on quality of service published by TRAI. That means standardized
customer services across operators i.e. outcome is almost same. Now difference could be
organizational factors such as how decisions are taken and how effectively information is
managed. Therefore, operations of customer services might be different for different operators
but they would come up with almost similar regulatory driven outcome.
However, technology and applications have been evolved in Indian telecom, following figure
describes it. It can be seen from the chart that products and service have been evolved over time.
The operators have been continuously seeking different and innovative ways of revenue
generations. Nature of handset market has changed over the time as well, like the introduction of
smartphones and other small phones capable of 2G and 3G services has contributed in changing
dynamics of the market. Even concept of CRM in Indian telecom sector has evolved from just
plain customer profiling and analytics to more advance predictive analytics, customer experience
and customer value management, churn management and web analytics. Use of technology in
CRM has increase with time as CRM software like Oracle Siebel has been widely used across
telecom operators. Currently some of them have also started implementing e-CRM, for example,
Airtel has started implementing e-CRM recently which includes aspects like online customer
support, web interface and customer online profiling.
8|PageFigure 5: Evolving technology/application
Old Telecom Landscape New Telecom Landscape
Long Distance Voice Music Payments
Local Products and Security Storage
Services
Data Video Gaming
Video
Handset/Modem Devices PC Cell Phone VoIP Phone
Plain Customer Web Analytics Predictive Analytics
CRM
Profiling/Analytics Churn Customer Experience
Management Management
Customer Value
Management
Source: Customer Care for High Value Customers by Srinivasan S.T. and Krishnan K.C., Infosys’ White Paper, August 2010.
In the beginning, telecos were managing whole system manually. The system was not up to the
mark as it was not enough to meet expectations of growing customers. Issues like not being able
to recharge anywhere in the country (one has to carry scratch cards from his/her original circle)
and not able to pay bill anywhere in India were prominent. Subscriber base was increasing at a
very high rate and so was pressure on quality of service. This forced telecos to invest in
technology to make operations more efficient. Presently most of them use centralize CRM
software based systems, in which customers can use customer services from anywhere in the
country without compromising on quality.
Use of technology is a key aspect of CRM. It allows service providers to manage their CRM
activities efficiently and effectively. Telecom industry is responsible for 17% of the total
revenue10 of Information Technology sector in India. This shows the industry is using IT services
extensively in its operations to bring in efficiencies. Basically, IT services are playing auxiliary
role to enable effectiveness of CRM activities in the Indian telecom market. Technology is used
in CRM implementation to create IT based structure for managing customer relationships. This
technology supported CRM system helps many segments within the company for example
supports sales, marketing, creation of robust customer database, facilitates management system
to integrate and analyse the data using analytics, and customer care services. Sales support
includes providing customer information to sales management and it also helps them to track
10
Indian Mobile Services Sector – Struggling to maintain sustainable growth, White Paper by Cellular Operators
Association of India(COAI)-PricewaterhouseCoopers(PwC), August 2011.
9|Pageproduct availability and delivery. Marketing support includes segmentation of customers for
better planning and marketing strategies and also helps to measure already existing marketing
campaigns. Due to implementation of technology based CRM system, telecom companies are
able to leverage benefits such as cross selling and up selling of relevant schemes based on
effective customer segmentation and generation of accurate leads and SMS bursts that target
only the right customers based on their segmentation.
Indian telecom companies are facing dual challenge of attracting customers and retaining them
through providing constantly better customer experience. Companies are trying to provide
quality customer support round the clock with self-serve channels through SMS and email. In
customer care services IT structure creates self-help systems which provide solutions to many
common queries. These self-help systems are available in both format voice call and web based.
These customer care services are supported by database system and software that help to
integrate and to analyze the data (D. Desai, et al, 2007).
Given that the average life of prepaid customer in Indian telecom market is about 8 months,
indicates high churn rates (Jha, 2011). With high churn rates among prepaid subscribers,
lifecycle management of customers is a challenge for the service providers in India. As
mentioned earlier, telecom operators using sophisticated technologies such as Oracle to manage
their CRM practices. This is particularly crucial in the context of constantly changing customer
preferences and ever evolving market dynamics. Success of right CRM strategy lies in
recognising right segmentation of customers and targeting them accordingly. Managing lifecycle
of customer effectively by using analytic services and best CRM practices is the key for
maintaining competitive edge in the market.
There is no doubt that Indian telecom operators are increasingly making efforts to build effective
CRM process. However, nature of the market generally does not allow them to invest in
enhancing customer care services. As already mentioned, Indian telecom is mostly prepaid
dominated and there is less loyalty among subscribers for any particular operator. Presence of
multi-SIM devices and implementation of MNP have made switching even more easy. As a
result mobile operators have less incentive to invest in overall customer experience. The telecom
players compete on tariffs/customised offers/advertisement rather than on customer service.
Even though dominance of prepaid customers has certain advantages to operators as it brings
down billing costs, less to no bad debt, and just providing average customer service delivery
would be enough, but prepaid customers are usually very price sensitive, low value, less loyal
and less demanding about services.
Lifecycle management
10 | P a g eSource: Michael W. Starkey, David Williams, Merlin Stone, (2002) "The state of customer management performance
in Malaysia", Marketing Intelligence & Planning, Vol. 20 Iss: 6, pp.378 - 385
Targeting
Indian telecom companies mainly target customers by segmenting them. Broader segmentation
would be urban and rural. Any targeting strategy would aim at improving revenue and expanding
market shares. For improving revenue, the operators mainly target relatively high value
customers in general and urban customers in particular. With saturated urban market, major
focus of acquisition of new customers is in rural market. As a result, rural telecom penetration
has become important. So far rural customers are extremely price sensitive and care less about
services. Service providers are coming with different plans targeted for rural/BoP customers e.g.
chota (small) recharge (starts from Rs.5), farmer plans of BSNL, etc. Service providers like
Vodafone and Reliance segmented rural customers and bundled rural centric services with
mobile device aiming for penetrating rural market aggressively. Many customers in rural cannot
afford to buy mobile devices. So these service providers bundle services with affordable devices
and offered that to rural customers. Vodafone called it “Magic Box branded handset”. These
handsets were offered in the market at Rs. 1,000 together with a SIM connection, three-month
validity card and some special recharge offers on talk time and VAS.11
Service providers segment in other ways as well. These ways include small and medium
enterprises (SMEs), youths including young professionals, family and special category
(celebrities, politicians, and CEOs). Airtel targets young segment with offers like free SMS
services and group talk/chat/SMS. Many service providers also offer family based offers. In
India family member are more like to be geographically dispersed, so if they stay on one network
they generally get cost advantages. Thus telecom companies are using integrated customer
11
Source: Vodafone’s drive for differentiation in rural areas, Global Telecom Business, July/August 2008.
11 | P a g esegmentation base strategy to target customers. Psychographic and lifestyle are some of the other
aspects on which customers are segmented.
Moreover, segmenting of customers first, then target them according to their segment is
important, because various studies have shown that 70% of the revenue comes from 30%
customers12 Therefore targeting customers by appropriately segmenting them is most efficient
way of enhancing life value and profitability of customers. Operators also improve value of
customers by using strategies such as up-selling and across-selling.
Major service providers are targeting rural market for increasing their subscriber base through
focused and innovative marketing. A case of Vodafone is depicted in the box below. Telecom
operators are using different channels to reach customers such television, newspaper, word of
mouth, internet, radio, pamphlets, etc. In one survey,13 it was observed that in urban areas,
television, internet and newspaper are dominant channels to reach customers and in rural areas
“word of mouth” factor playing important role followed by television as 58% customers said that
they received information about their service provider by “word of mouth” and 24% said it was
television.
Rural marketing by Vodafone: Buying an entry level handset at 1,200-1,500 ($27-$34) is still a
significant payment and this has resulted in many rural consumers only being able to access
telecommunications through a payphone or shared mobile phone. So while many rural consumers had
SIM cards and a mobile number, this did not necessarily equate with increased individual usage. SIM
ownership in the absence of phone ownership also creates a whole series of service challenges such as
lost and damaged SIMs — challenges with maintaining minimum recharge values and SIM validity. To
address the challenge of handset affordability in November 2007 Vodafone introduced the Vodafone
Magic Box handset to focus on a bottom-up rather than top-down approach. They were able to bring the
Magic Box branded handset to market at 1,000 rupees together with a SIM connection, three-month
validity card and some special recharge offers on talk time and VAS — there was no subsidy. Importantly,
the handset also came bundled with easy access to Vodafone’s VAS platform. These devices were of
good quality and came with two year’s replacement warranty.
….
Source: Adopted from “Vodafone’s drive for differentiation in rural areas, Global Telecom Business,
July/August 2008”.
Another study14 done for Tata Indicom has showed that factors such as network coverage
(includes signal strength) and prices are most significant factors for customers to select telecom
operator as 61% surveyed customers placed the highest importance to these two factors. The
study also points out another important factor that has influence while selecting operator is
advice by friends and relatives i.e. network effect.
12
Customer Care for High Value Customers by Srinivasan S.T. and Krishnan K.C., Infosys’ White Paper, August 2010.
13
Understanding consumer behaviour in rural for telecom by B. Sandeep, Institute of Public Enterprise,
Hyderabad, 2010.
14
Understanding consumer behaviour in rural for telecom by B. Sandeep, Institute of Public Enterprise,
Hyderabad, 2010.
12 | P a g eContact Points
Customer experience (which is basically interaction between customer and service provider at
various levels) develops from various contact points. Given the dynamic nature of customer
preferences, service providers have to provide various channels for serving customers and
addressing their complaints. Just creating call centres would not be enough in such a dynamic
market. Service providers have to think of different touch points such as internet, self-service
channel (IVR), company stores, social media, etc. to match customers’ preferences. This would
help the service provider to develop and enhance customer experience and also add to
competitive advantage of the company. Modern CRM technology is very useful in bringing
efficiencies in all touch points so that customers’ relationship with company is managed in such
a manner that lifecycle value of customer is enhanced.
Contact
Points
Company
Call Centre Website Social Media Kiosks Franchise
Stores
Call Centre
All telecom operators in India are required to set up call centres. These call centres not only
serve as a channel for redressal of grievances of their customers but also as touch points for all
kinds of services and information. Since the call centres are direct touch points with customers,
they serve as a good tool for developing customer relationships. This generally has long lasting
effect on life cycle of customers. All these call centres have to function round the clock. These
call centres have to have a toll free number for calling the customer care. Any call or SMS made
to this number is not chargeable to customers. As for addressing complaints, these call centres
usually provide a docket number to customer, after she/he has made complaint. The call centres
or customer care centres have to adhere the time limit specified in the Telecom Regulation on the
Quality of Service. Wherever no time limit has been specified, all such complaints shall be
redressed within seven days of registration of complaints.15
Generally, implementation and management of call centres operations has been outsourced by
telecom operators. For this, telecom companies have used core competencies of the Indian BPO
segment.16 “The telecom operators outsourced the entire contact centre operations to 4-5 BPO
corporations for managing the operations of the entire country. The operators took a two-pronged
approach of limiting the number of strategic partners they tied-up with and ensuring that the
contact centre sites got located conveniently at the non- metro locations with regional language
15
Source: http://www.nationalconsumerhelpline.in/Sectorwisedetails.aspx (accessed on December 9, 2012)
16
The changing face of contact center by Om Kumar Jha, 2010.
(http://www.theceoinsights.com/joomla/index.php?option=com_content&view=article&id=168:the-changing-
th
face-of-contact-center-&catid=54:articles&Itemid=58 accessed on 15 February 2013)
13 | P a g epreferences to cut costs and manage attrition.” (Jha, 2010). Bharti, for instance has outsourced
its call centres operations for mobile services have been outsourced to IBM Daksh, Hinduja
TMT, and Teletech & Mphasis. This too has become an industry norm.
Company’s website
Service providers have established their own websites, which serve as another channel for
disseminating information to the customers. Many customers find this channel convenient as
they usually find all information in one place such as frequently occurring problems and their
solutions, all available offers/recharges, customer care number/email ID, formalities for getting
new connection, etc. With implementation of e-CRM recently, these websites are increasingly
playing important touch points for customers. Many customers, who are technology savvy prefer
to go to website than call customer care.
Social Media
Service providers are increasingly using social media as another touch point to build relationship
with their customers. For example, many service providers have their web pages on facebook,
where they share information, address complaints, and promote offers. They take advantage of
social media through network effect. This is also the reason service providers are very prompt in
replying to queries on social media web sites. If they fail to build their image on the web, it
would mean so many people would be reading about it and they will experience negative side of
the network effect. With increasing improvement in handset technology, customers are finding
easy to access social media anytime and anywhere. Therefore, this touch point is also very
crucial in developing relationship with customers.
Company stores
Company stores have been established by many service providers e.g. Airtel Store, Vodafone
Store, etc. Generally staffs at these stores are well trained. Companies regularly invest in training
of the staffs. These stores are playing important role as a touch points for customers and
marketing outlet for the company. These stores educate customers about various service, offers,
and important processes. Wherever physical presence of the customer is required, the customers
will have to go to these stores. For example, if one has to transfer postpaid connection from one
circle to another and while using number portability facility customers required to go through
these stores. Service providers are increasing looking at these type of stores as an important
strategic channel to build customer relationships.
Kiosks
Use of Kiosks by service providers is also common. These are generally placed in places like
malls and airports. Kiosks are automated machines, which can be used for getting information
about new offers, recharging prepaid connection, paying postpaid bills, etc. This touch point is
not much popular in India as people still prefer call centres and web based channels.
14 | P a g eShopkeepers /kirana stores/ small shopwalas
These small retailers serve as important sales points for service provider. This is particularly
important against the background of prepaid dominant market, in which customers generally
prefer to recharge frequently. Therefore accessibility of recharge coupons becomes very crucial
parameter for competitive edge. These small retailers fill this gap very well. These shopwalas
generally sale products of all telecom operators this serves as very cost effective channel of sales.
Customer relationship activities happen outside operators’ management as well i.e. at small
kirana/pan shops. One can use these small shops to recharge mobile and also can easily get all
information regarding tariffs, various plans, documents required for new connection, etc.
Generally for every Rs. 100 recharge by customer these small shopwalas get Rs. 2-4. Everyday
telecom operator agents visit these small shops and collect the turnover after deducting
shopkeepers’ shares. These franchise kind of sales points offer many advantages to telecom
operators since these shopwalas are local people and can convey all relevant information to
customers in local dialect. Customer can get information regarding all operators in one small
shop as these shops keep recharge coupons/SIM cards of all existing operators in the market.
Recently, operators are following strategy of increasing commission for these small retailers on
selling their SIM cards. This is recent phenomena, so difficult to say how much impact it would
have in increasing subscriber base. A recent case of Uninor telecom company is presented
below:
Increasing commission of small retailers to push sales: Norway’s Telenor has planned to offer
higher commissions to retailers and distributors in small towns and cities from February 2013 as it
adopts a new strategy to incentivise point of sales that make around Rs 5,000-6,000 a month from
selling SIM cards and mobile recharge coupons. By taking this step, Uninor has become the first
company to effectively increase commissions to smaller retailers and distributors at a time when most
mobile phone companies have reduced these commissions over the last several quarters. Telcos had
started reducing dealer commissions in mid-2011 when they lowered dealer commissions from 3.8% to
3.5% while commissions on the first recharge were brought down from Rs 50 to Rs 35. On an average,
a retailer presently earns 3.5% as commission on every mobile recharge and anywhere between Rs 15-
30 on every SIM card sold.
An increment on existing commission will motivate such retailers to push more sales of Uninor SIM
cards and generate more business.
The telco that operates under the Uninor brand has shifted to what it calls a ‘differential commission
management’ system where it will pay more to smaller retailers while larger retailers would be given
marginally lower commissions.
….
Source: Adopted from http://articles.economictimes.indiatimes.com/2013-01-14/news/36331814_1_small-retailers-
sim-cards-commissions (accessed on 12 February 2013)
15 | P a g eWelcoming
In India, to get a new prepaid or postpaid connection one has to fill up Prepaid Customer
Application Form (CAF) available across network of retailers or independent sale agent or direct
sale agents or companies’ mobile stores. Documents that are required with the application form
are: One colour/BW photograph and any one document from the list: Passport; Arms License;
Driving License; Photo Identity Card having address; Election Commission ID Card; Ration
Card with photo and address applicable for person whose photo is affixed; Certificate of address
having photo, issued by Village Panchayat head (for rural areas), etc.
Recently (in November 2012) TRAI has tightened the procedure of verification facts provided by
subscriber. According to new guidelines the authorised dealer has to give undertaking that data
provided by new subscriber is physically varied. There is also provision for police inquiry, if
information found to be not correct. That means after customer hands over filled up application
form, the retailer has to give in writing or certifying that information provided by the subscriber
is correct and physically verified. After telecom operator receives this documents from retailer
then a tele-varification is carried out by the operator, then only SIM is activated. After buying
SIM card from dealer activation of SIM takes up to 24 hours. However, it also depends on the
location, because in rural areas or in small towns, it may take more than 24 hours to activate the
SIM. Therefore practice of retailers to activate SIMs as soon as customer submits complete filled
up application form has been discontinued.
Getting to Know Customers
For both to acquire new customers and for retention of existing customers telecommunication
companies require to build robust database of customers. Knowing your customers well could be
the key difference between success and failure. Knowing your customer means to build a rich,
coherent, integrated picture of a customer. To build understanding of the products they own, the
services they use, their usage patterns, the problems they have had and more. After construction
such a database, another key aspect is to put this data into work. For this reason analytics
services can help the companies to make decisions effectively and quickly. Using analytic
services companies are finding out risky customers, then they are predicting value of those
customers, and finally targeting them to minimize churn, to maximize profit and to reduce cost.
Indian telecommunications companies are increasingly using analytical services to make their
business strategies effective and efficient.
In a market where all the operators are offering similar tariffs and have all existing modes of
servicing the customers, the differentiation can only be achieved if an operator succeeds in
identifying the match between types of transaction and modes of service for each segment of
16 | P a g ecustomer.17 Telecommunication companies are segmenting customers and targeting them
according to their value and investing in potentially high value customers by providing them
better services/offers. This will make sure long term viability of business strategy. This means
retention cost of BOP and SME customers, whose average spending is likely to be low, must be
high. Thus, they would not on priority while companies prepare their strategies for retention or
improving customer experience, because it is costly to do so.
Other aspect of getting to know customer is making decision of retention of customers based on
their loyalty and value (assuming that some customers will churn anyway). Based on behaviour
pattern of customers, service providers estimate customers that are likely to leave and how many
of these customers are worth retaining. These estimates help service providers to build their
strategies and intervene timely and effectively to retain customers that are worth doing so. For
this, service providers use predictive analytical models to find out which customers are likely to
churn and which are not.
Moreover, major part of the cost of new customer acquisition is spent on SIM card, channel
commission and incentives, and special incentives with SIM card. Since most of the urban
market in India has matured it would make more sense for operators to focus on retention of
customers by providing better customer experience, than acquiring new customers. In fact in
such a market cost of acquiring new customers is usually high compared to cost of retaining.
Cost of serving existing customers is Rs. 5-7 per subscriber per month, while cost of adding new
customer is Rs. 100-125.18
Analytics services play important role in doing predictive analysis and identify customers based
on their value. Analytic services are performed on the basis of huge database of customers
created by the operators. These databases contain information including personal, demographic,
call volume, usage, calling patterns, etc.
Customer segmentation is mainly done through data mining of customer behavior: Bharti
Airtel has reached this point. Bharti Airtel offers an integrated suite of communication and
entertainment services to more than 100 million customers—and it is adding 2.5-3 million customers
every month. These customers make more than 3 billion calls each day, and are supported by 1.3
million retailers and over 20,000 call center agents. To make this huge infrastructure work, Bharti
Airtel must understand their customers and optimize transactions across the company. This means
developing analytics to make the right decisions in real time. Bharti Airtel uses analytics to segment
their large customer base, allowing them to focus on micro segments in India’s rural market, for
instance, where they offer coverage in 400,000 villages. Churn analysis, prediction and prevention
are critical and are the basis for My Airtel My Offer—a system that optimizes the plan for a customer
and is available through retailers and in self-service channels.
Bharti Airtel has developed such a fine-grained segmentation approach by applying data mining and
predictive analytic techniques to its customer and usage data. This segmentation drives the whole
customer lifecycle, from acquisition to retention and development. With customers from urban
professionals to rural villagers whose phone is their only technology, segmentation is a pre-requisite
17
Source: Customer retention- the telco’s next blue eyed boy by Om Kumar Jha, May, 2011
(http://www.telecomindiaonline.com/customer-retention-the-telco-next-blue-eyed-boy.html)
18
Source: Customer retention- the telco’s next blue eyed boy by Om Kumar Jha
17 | P a g efor effective targeting.
Moreover, Bharti Airtel customers have access to something called My Airtel, My Offer. Driven by
sophisticated predictive analytics and Bharti Airtel’s precise segmentation of its customer base, My
Airtel My Offer predicts the best possible plan for each customer. These personalized plan
suggestions are presented consistently across Bharti’s 20,000 call center representatives, its million
plus retail partners and direct to consumers through interactive voice response and SMS systems
among others.
….
Source: Transformation telecom retention with analytics by James Taylor, Decision Management Solutions,
2010.
Telecom operators use predictive models based on the data sets available to segment customers and target
customers for retention.
Customer Development
This section mainly deals with value added services (VAS) as VAS is a significant contributor in
improving customer experience with service provider. In addition to providing services at better
price and maintaining quality network coverage, VAS also plays important role in customer
development. That is why Indian telecom companies are increasingly focusing on VAS as a
strategy to improve revenue and retain customers. Recently, India telecom market is witnessing
surge in VAS, particularly after the rollout of services like 2G and 3G. VAS in mobile market
has evolved from just SMS based services like Astrology, jokes, news, etc. to application based
and internet based services. Since VAS is one of the key factors that influence customer
experience, VAS is considered as a differentiator by the telecom operators to stay in the
competition.
Telecom industry is using CRM practices to understand preferences and needs of customers to
generate appropriate VAS applications. These companies generally outsource VAS services to
third party companies, but recently telecos also looking to build in-house VAS applications. The
mobile VAS market has been growing around 60% per annum and factors responsible for this
growth are m-commerce, multi-media games, 3G, mobile Internet for faster data upload and
download, and also the rural VAS market which has a huge potential in India.19
Presently revenue generation of mobile VAS industry is over Rs. 27000 crore. Indian Telecom
Market Overview 2012, a study by Zinnov, has pointed out in its report following mobile VAS
categories that are being implemented by Indian telecom companies:20
1. M- health: Leading telcos such as Vodafone, Airtel and Aircel are partnering healthcare
companies to deliver m-health services. Typical m-health services include provision of
locating hospitals, fixing appointments, registration of patients, getting medical advice,
facilitating treatment, and seeking blood donation.
19
VAS Asia 2012 (http://www.bharatexhibitions.com/english/VASA2012.php accessed on February 22, 2013)
20
Adopted from “Mobile VAS in India to cross $6B by 2013 by Swati Prasad, Inside India, November 2012.(
http://www.zdnet.com/in/mobile-vas-in-india-to-cross-6b-by-2013-7000008005/ accessed on February 22, 2013).”
18 | P a g e2. M- governance: Many Indian states such as Kerala, Gujarat, Bihar, Goa and Andhra Pradesh
have initiated m-governance practices primarily through SMS-based platform.
3. M-education: Major telecom players are enabling mobile as a platform for imparting
education. For instance, Aircel and MTS are partnering NGOs for educational initiatives
aimed at underprivileged children. Reliance Communications is delivering interactive, real-
time courses across 105 cities. Airtel is imparting education through IVR (interactive voice
responde), which includes English-speaking courses at basic level.
4. M-commerce: Telecom carriers are increasingly taking interest in m-commerce services.
Reforms are encouraging telcos to offer services such as m-microfinance, m-retailing, and
mobile-wallet services. Some of the recent government initiatives include increasing mobile
payment limit to INR 50,000 (US$901.8) by RBI, and the creation of Interbank Mobile
Payment Service (IMPS).
5. M- agriculture: These services bridge the information gap between farmers and market
conditions. Key services include commodity prices, local info, weather updates, multiple
language support, and so on. Reliance communication provides its service, called Grameen
VAS, while Airtel has a service it named, Bahtar Zindagi, for the rural farmer.
6. M-infotainment: Almost all leading telecom companies provide information and
entertainment-related services. Infotainment is the largest contributor to overall MVAS
revenue. This segment covers categories such as sports, travel, news, ringtones, music, and
videos.
Indian VAS services have not picked up in rural area as yet. Though many in the industry believe
that VAS could be the future for developing market and generating revenue, only if service
providers do it right that is finding innovative ways to offer value at minimum cost. As for rural
area VAS is not popular as 65% of rural subscribers do not know what a data service is.
However, of those who know two-thirds regularly use one.21
VAS services are provided by third party to telecom companies. These VAS companies get only
30-40% of the revenue generated from VAS services22remaining is retained by telecom
operators. At the global stage situation is different where companies like Google inc. and Apple
Inc. share as much as 70-80% revenue with VAS companies, in order to encourage innovation
and quality in VAS content.
21
Building rural telecoms, one rupee at a time by Mohammad Chowdhur, PwC India, January 2012.
22
Mobile VAS firms turn to global markets for survival by Ruchita Saxsena, live mint, December 2012.
(http://www.livemint.com/Industry/Ftm64F0VLsMXWTcnfDDnGI/Mobile-VAS-companies-turn-to-global-markets-for-
survival.html accessed on February 22, 2013).
19 | P a g eManaging Problems
At present, CRM for customer services in the Indian Telecom industry is mainly regulation
driven. The telecom operators have little incentives to go beyond the benchmarks set by the
regulator (table above gives summary of the benchmarks).
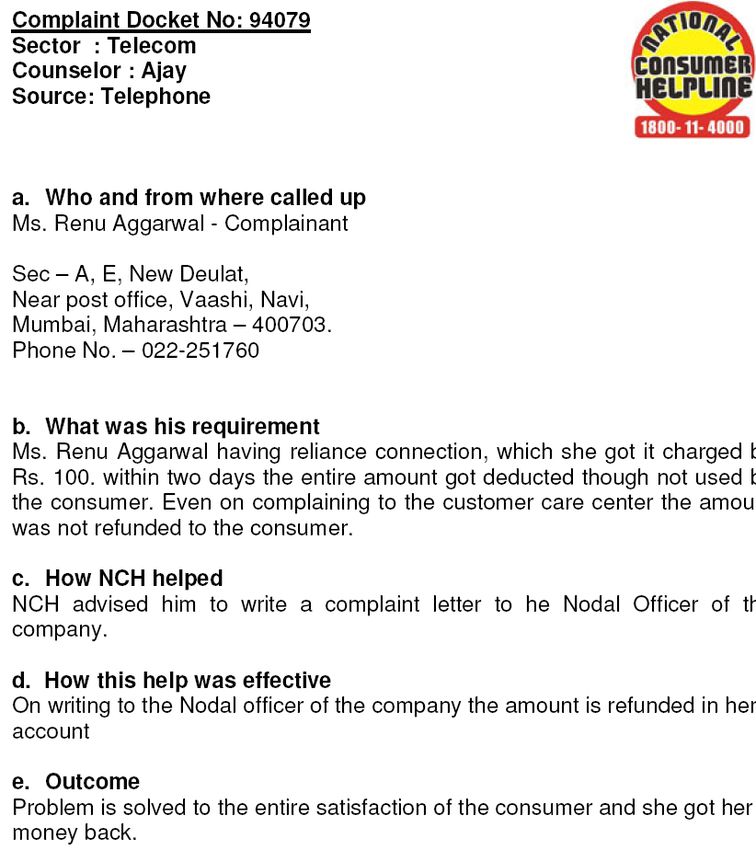
India has a three tier grievance redressal mechanism. These three tiers being Call Centre of
Service Provider concerned, Nodal Officer of Service Provider concerned and Appellate
Authority within the company of Service Provider.
A telecom consumer has to register complaints for any problem he faces with customer care of
his service provider and obtain a docket number. Call centres must resolve complaints relating
to faults in or disruption of service within 3 days and all other complaints within 7 days. In case
his complaints are not addressed then he can approach the nodal officer of the company. The
nodal officer must resolve complaints relating to faults in or disruption of service within 3 days
and all other complaints within 10 days. Further if problem does not get solved, customer can go
to appellate authority, which is appointed from within the company. The appellate authority must
resolve the complaint within 3 months. In case the appellate authority fails to address grievance
of consumer, then TRAI has the authority to decide on the matter and at any time the consumer
is free to appeal with consumer court under Consumer Protection Act 1986 or any other law in
force from time to time.
The three tier self-regulatory system set up by telecom companies – customer care, nodal
officers, and appellate authorities waste a lot of time for the customers and is expensive for the
telecom companies. The amounts involved in most consumer problems is so small that it doesn’t
make sense for most customers to take action – like finding a lawyer and filing a complaint.
Telecom industry has such high churn rate (new customers signed up each day/current customers
deactivating their accounts) that an individual customer does not seem to matter in the larger
scheme of things.
Win-back
Wining back customers is also an integral part of customer care system. Predictive analysis helps
service providers to find out the customers’ dissatisfactions and point out the customers who are
likely to quit. In case if customer has already left to competitors, service providers investigates
possible reasons for defection through analyzing data collected across customer contact points,
then renewed offers/promotions are made to customers to win them back. Thus, data mining and
analysis tools help to identify possible reasons behind customer dissatisfaction and level churn
among them and then help to prepare strategies of winning back customers accordingly.
Discussion on MNP and churn is done the next section.
3. Mobile Number Portability and Churn
20 | P a g eMobile Number Portability (MNP) was launched in India from January 2011. The number of
requests of MNP has been continuously rising since then. In the first month (February 2012) 3.8
million requests were received and next 23 months total number of requests reached at 80.1
million in December 2012. Compound monthly growth rate during last 23 months was 14%.
During first 14 months MNP requests grew at the rate of 18.6% and in next 9 months growth rate
was 6.4% (compound monthly growth). Even though total number of MNP requests are growing
continuously, the growth rate has been falling constantly. Lowest number of MNP request net
addition was received in November 2012 (i.e. 2 million).
Figure 6: Monthly MNP trends in India
90.0
80.1
80.0 Total MNP requests 75.177.1
69.8
70.0 Monthly net addition 64.9
MNP requests (n million)
59.3
60.0 Growth rate
54.3
50.2
50.0 45.9
41.9
40.0 37.1
32.8
29.2
30.0 25.8
23.2
20.6
18.1
20.0 15.6
13.0
10.6
8.5
10.0 6.4
3.8
0.0
Apr-11
May-11
Apr-12
May-12
Nov-11
Aug-12
Nov-12
Feb-11
Mar-11
Jun-11
Jul-11
Aug-11
Sep-11
Feb-12
Mar-12
Jun-12
Jul-12
Sep-12
Dec-12
Dec-11
Oct-11
Jan-12
Oct-12
Source: TRAI press releases on telecom subscriber data for various months from Feb 2011 to Dec. 2012.
(http://www.trai.gov.in/Content/PressReleases.aspx)
Even though rate MNP requests are increasing, but it is just around 8% of total subscriber base. MNP
requests have been launched, does not mean that all customers might have ported out to competitors.
Many telecom operators might have taken steps to retain these customers like finding out reasons for
churn and offering appropriate offers to them.
With dwindling subscriber base, telecom companies are trying to attract each other’s customers, thus
causing high churn, which basically means customer leaves network of one service provider for another.
This also means a huge amount of resources are being spent by service providers for exchanging
customers. This may look like waste of valuable resources in the sector. However, this is a crucial part of
highly competitive market, which forces companies to be on their toes always and keep on innovating and
maintaining their operations at most efficient level. If this situation continues, companies will have to
21 | P a g efocus more on retaining customers by providing better customer experience to maintain their competitive
edge.
23
The process of applying for MNP : The customer who wants to port his mobile number to some other
operator has to send an SMS to 1900 in: PORT –(mobile number) format. The SMS reply to this request
consists of a unique porting code. The customer then sends SMS to the preferred operator quoting the
unique code. This code is valid only for a few days, and customer has to apply again if it expires. The
existing operator of customer will check with new operator & if there are no dues then approval will be
given for porting. The customer gets an SMS on the time and date when porting will take place. As per
rules by TRAI the process has to be completed within 4 days of applying. After porting is completed the
new operator sends SMS regarding the change of operator. The customer is not able to use his number
for about 2 hours when the porting takes place. The process is kept simple so that the customer does
not have to go through a lot of paperwork before switching operators.
Monthly churn rate in India averages around 6% per month, 24 which is very high. Subscribers that churn
are the potential candidates for number portability. However, when one looks at the proportion of
churning subscribers that take their telephone numbers with them, in India most subscribers are moving to
new mobile carriers without taking their phone numbers with them. (B. Allen, 201224). So, MNP has
very little impact on overall churn rate as MNP as a proportion of total churn would be very less. It is only
those high value postpaid customers and some prepaid customers, would want to port out using MNP if
their experience with existing service provider is not good.
4. Indicators – quality of service
Many factors are responsible for better customer satisfaction such as call waiting time, efficiency and
approachability of different customer touch points, billing credibility, availability and easy accessibility of
recharge and payment options, quality of network, etc.
Generally telecom companies should set benchmarks for measuring quality of service for example 0.4%
billing error for satisfying performance and anything more than that means unhappy customers, implying
more churn. In Indian scenario, the regulator has set benchmarks for almost all quality of service
indicators. These benchmarks are shown in the table below. These standards for quality of service were
introduced to protect consumers’ interests in this rapidly expanding industry.
Whether these benchmarks are good enough for delivering best customer services or telecom companies
will have to set their own benchmarks addition to what regulator has set to enhance effectiveness of
services to customers, this is a matter of separate research.
Table 1: Quality of service indicators
S. Parameters Benchmark % of CMTS^ Licensees not
No. Meeting the Benchmarks
23
Adopted from “Effect of Mobile Number Portability on customer retention in Madhya Pradesh circle of Bharat
Sanchar Nigam Limited a state owned telecommunication company by Gaya Prasad Patel, BSNL ,Bhopal (MP)
India.”
24
India’s experience with Number Portability by W. Bruce Allen, Neustar Inc., May, 2012
22 | P a g eYou can also read