A LANDSCAPE SCAN of Immigrant- and Refugee-supporting Organizations in Southeast Michigan
←
→
Page content transcription
If your browser does not render page correctly, please read the page content below

A L A N D SCAPE SCAN
         of Immigrant- and
         Refugee-supporting
         Organizations in
         Southeast Michigan

Prepared by    Funded by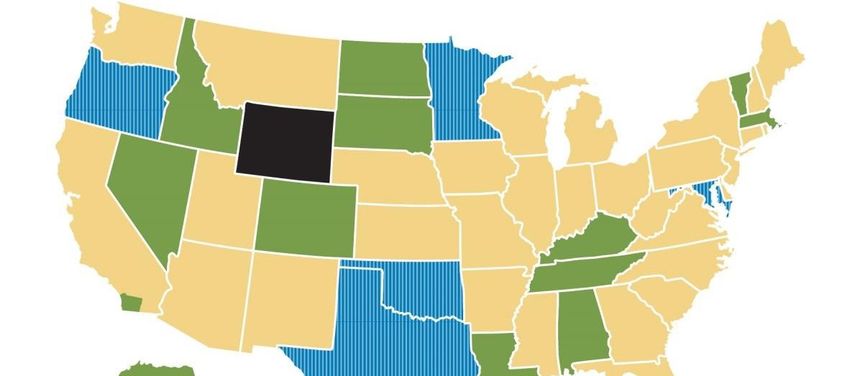
Prepared by
          Public Sector Consultants
          Lansing, Michigan
          www.publicsectorconsultants.com

          Prepared for
          Community Foundation for Southeast Michigan
          Detroit, Michigan
          www.cfsem.org

This project is funded through the Community Foundation for Southeast Michigan, the Kresge
                           Foundation, and the Skillman Foundation.

Cover design by Joshua A. Smith, Who’s That?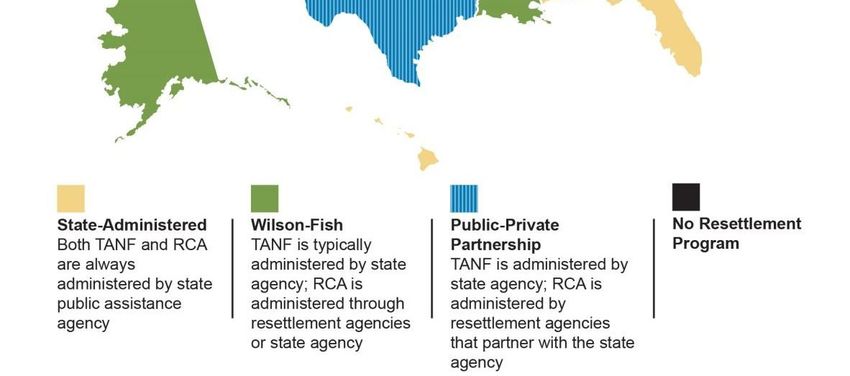
TABLE OF CONTENTS
INTRODUCTION ...................................................................................................................................................................... 4
PROBLEM STATEMENT AND METHODOLOGY ...................................................................................................................... 5
KEY FINDINGS ....................................................................................................................................................................... 5
RECOMMENDATIONS ............................................................................................................................................................ 6
REFUGEE STATISTICS ........................................................................................................................................................... 7
Background ........................................................................................................................................................................... 7
Michigan Refugee Trends..................................................................................................................................................... 7
National Refugee Trends ...................................................................................................................................................... 8
Key Findings .......................................................................................................................................................................... 9
MICHIGAN’S REFUGEE FUNDING STRUCTURES AND THE NATIONAL RESETTLEMENT PROCESS ................................. 10
The National Resettlement Process ................................................................................................................................... 10
Michigan’s Refugee Funding Structures ........................................................................................................................... 12
Key Findings ........................................................................................................................................................................ 13
FORM 990 DATA ANALYSIS ................................................................................................................................................ 13
Purpose of Form 990 .......................................................................................................................................................... 13
Methodology ....................................................................................................................................................................... 14
Results and Discussion ...................................................................................................................................................... 14
Key Findings ........................................................................................................................................................................ 17
SURVEY OF IMMIGRANT- AND REFUGEE-SERVING ORGANIZATIONS IN SOUTHEAST MICHIGAN ................................. 18
Purpose of the Survey ........................................................................................................................................................ 18
Results ................................................................................................................................................................................. 18
Key Findings ........................................................................................................................................................................ 20
INTERVIEWS OF IMMIGRANT- AND REFUGEE-SERVING ORGANIZATIONS IN SOUTHEAST MICHIGAN.......................... 21
Purpose of the Interviews ................................................................................................................................................... 21
General ................................................................................................................................................................................ 21
Settlement and Integration ................................................................................................................................................. 21
Housing ............................................................................................................................................................................... 24
Employment ........................................................................................................................................................................ 25
Health and Mental Health ................................................................................................................................................... 26
Language Training Programs ............................................................................................................................................. 27
Policy Landscape and Funding Structure ......................................................................................................................... 27
Funding Collaborative......................................................................................................................................................... 28
CONCLUSION ....................................................................................................................................................................... 28
REFERENCES ....................................................................................................................................................................... 31

INTRODUCTION
Refugees and immigrants are important to the fabric of our society. They contribute to the economic well-
being of the communities we live in and bring stories of courage and indominable spirit against great
odds, a value and experience many Americans share with them. More than 100 million Americans can
trace their ancestry to immigrants who arrived at Ellis Island between 1892 and 1954 (Keeling 2018). In
2016, the total foreign-born population in Michigan reached 6.7 percent, and 51.8 percent of the 653,196
foreign-born residents were naturalized citizens (U.S. Census Bureau n.d.). Of these citizens, 455,146
reside in southeast Michigan. Many families from this population have made their new homes in
southeast Michigan, which is defined as Wayne, Oakland, Macomb, Washtenaw, and Genesee Counties
for this report.

Southeast Michigan is a place of activity where many different nonprofit organizations provide an array of
services to refugees, immigrants, and asylees.1 However, the services that this population receives are
threatened as the United States undergoes a period of fundamental transformation in immigration policy.
Significant changes in current policy priorities include building a border wall with Mexico, cutting legal
immigration, deporting millions of unauthorized immigrants, and banning refugees from certain Muslim-
majority countries (Pierce et al. 2018). On August 31, 2018, the U.S. Department of State announced the
withdrawal of all financial support to the United Nations Relief and Works Agency for Palestine Refugees,
an agency that supports around five million refugees through education, healthcare, microfinance,
infrastructure improvement, and emergency response services. The withdrawal culminated in a $360
million reduction in the agency’s annual budget in just over two years. Though many national
organizations rely on this type of federal aid for services, much of this funding has been greatly reduced or
eliminated altogether. These immigration policies have far-reaching implications for refugees, asylees,
and immigrants worldwide and in southeast Michigan.

In order to address these policy changes and meet the needs of the region’s foreign-born population,
developing a regional strategy in southeast Michigan that includes collaboration between refugee-,
asylee-, and immigrant-serving organizations as well as grantmaking organizations on unified goals is
crucial. Currently, southeast Michigan lacks an organized, formal structure for the local philanthropic
community to collaboratively learn, share, and fund issues that support immigrant and refugee
populations in the region. An initial step toward building the Southeast Michigan Immigrant and Refugee
Funder Collaborative is to understand the current philanthropic landscape that supports
immigrant/refugee populations, as well as how nonprofits in the region are meeting these populations’
needs. This report outlines the priorities of service and grantmaking organizations as well as the bodies of
work that they each manage. By highlighting the needs expressed by these organizations, this report
builds a better understanding of the gaps in services and overall funding and provides recommendations
on opportunities for creating a sustainable infrastructure to support refugee, immigrant, and asylee
communities in southeast Michigan.

1
  The U.S. Department of Health and Human Services’ Office of Refugee Settlement (2015) defines “refugee” as any person outside
their country of nationality who is unable or unwilling to return to it because of persecution for reasons of race, religion, nationality,
membership of a particular social group, or political opinion; it defines “asylees” as those who travel to the United States and
subsequently apply for/receive a grant of asylum. For more information on these populations, visit https://www.acf.hhs.gov/.
The Immigration and Nationality Act (INA) of 1952 defines an “immigrant” as any alien in the U.S., except one legally admitted under
specific nonimmigrant categories (INA Sec. 101 (a)(15)). For more information, visit
https://www.uscis.gov/ilink/docView/SLB/HTML/SLB/0-0-0-1/0-0-0-29/0-0-0-101.html.

Landscape Scan of Immigrant- and Refugee-supporting Organizations in Southeast Michigan                                                      4
PROBLEM STATEMENT AND METHODOLOGY
While studies have been conducted on the economic impact of refugee and immigrant households in the
Midwest by the New American Economy, the Michigan Economic Center, and Global Detroit, an
inventory of philanthropic investments made to these communities has not been developed. To address
this information gap, the Community Foundation for Southeast Michigan (CFSEM) contracted Public
Sector Consultants (PSC) to conduct a landscape scan of immigrant- and refugee-serving programs and
nonprofit organizations in southeast Michigan—a five-county region comprising Wayne, Oakland,
Macomb, Washtenaw, and Genesee Counties. The landscape scan identifies current funding structures as
well as strengths and gaps in overall funding and services. It also builds a collaborative response to
support immigrant and refugee communities in southeast Michigan.
PSC conducted the scan by analyzing Worldwide Refugee Admissions Processing System (WRAPS) data
trends in Michigan (2012 to currently available) and identified local, state, and federal funding structures
for immigrant-, refugee-, and asylee-serving organizations. PSC performed a Form 990 analysis of
organizations that serve these populations in the study area and conducted stakeholder surveys and
interviews of select organizations and thought leaders in the field.2,3
Key findings and recommendations based on these findings are summarized below.
KEY FINDINGS
Based on its research, PSC found that:
The number of refugees entering Michigan fell by 85.7 percent since fiscal year (FY) 2016. Nationally,
the federal cap on the number of refugees the U.S. accepts has declined from a high of 85,000
refugees in FY 2016 to a low of 30,000 refugees in FY 2019.
Federal funds given to Michigan through the Refugee Cash Assistance (RCA) program and the
Refugee Medical Assistance (RMA) program have declined, as have the number of refugees receiving
funds under the Temporary Assistance for Needy Families (TANF) program. In response to these
drops in funding, grants to Michigan from the Office of Refugee Resettlement (ORR) for social
services and targeted assistance have increased.
Service organizations face increased financial pressures due to decreases in federal assistance. They
have adapted to these changes by raising more revenue through philanthropic donations, optimizing
their operational structures, and relying on volunteer staff.
During interviews, service organizations expressed the view that despite the reductions in new refugee
arrivals, the need for their services is growing.
Grantmaking organizations do not have a specific focus on refugees or immigrants but rather focus on
broader themes, such as reducing poverty, encouraging arts and culture, etc. Their effect on the lives
of refugees and immigrants is incidental to their primary grantmaking mission.
In order to qualify for grants from philanthropic organizations, service providers must often creatively
fit their programs and services into categories that may not actually match in definition or design.
2
Form 990 is financial documentation required of nonprofits by the Internal Revenue Service.
3
The year 2012 was used as a starting point for this analysis because it showcased changes under a previous presidential
administration.
Landscape Scan of Immigrant- and Refugee-supporting Organizations in Southeast Michigan 5 In southeast Michigan, no regional strategy prioritizes what areas of service are funded. As a result,
funds available and the services provided form a patchwork. This regional patchwork creates
numerous gaps in much-needed services.
Based on the research findings, PSC also made a specific set of recommendations for CFSEM. The
recommendations are not prescriptive; however, if followed, they could allow southeast Michigan to
better meet the needs of the refugee and immigrant communities they serve.
RECOMMENDATIONS
PSC’s research found there is broad support for creating a new collaborative of existing organizations in
southeast Michigan to develop a sustainable infrastructure to support immigrant and refugee
communities. PSC recommends that:
1. CFSEM lead efforts to organize a new collaborative in southeast Michigan focused on building
supports for refugee and immigrant communities.
2. While leading these efforts, CFSEM should be explicit in the goal of the collaborative to build
infrastructure support for refugee and immigrant communities.
3. The collaborative should include grantmakers, service providers, and thought leaders. Grantmakers
are necessary to make resources available for the collaborative. Service providers understand the
needs encountered in the community and their recommendations surrounding regional priorities are
important. However, service providers may add their own bias toward priority areas based on their
organizational missions. Thought leaders have a pulse on refugee and immigrant community needs
but not the same operational and logistical knowledge as service providers, so including them in the
collaborative will make the current patchwork of funds and services more streamlined and build
supports effectively.
4. The collaborative should not simply be another resource for providing monies for direct services but
should focus on telling stories about immigrant and refugee experiences to the broader regional and
statewide community.
5. The collaborative should develop a regional strategy for southeast Michigan by prioritizing areas for
funding and services. Priority areas for the collaborative could include healthcare/medication, mental
healthcare, entrepreneurship, transportation, English-as-a-second-language (ESL) classes, and
housing, with the recognition that many areas are linked inextricably and cannot be discussed as
separate.
6. The collaborative should foster dialogue and collaboration between member organizations to reduce
service overlap and competition and to increase efficiency.
7. The collaborative should lead advocacy efforts in the region, state, and nationally through the
combined power of its constituent members.
Landscape Scan of Immigrant- and Refugee-supporting Organizations in Southeast Michigan 6REFUGEE STATISTICS BACKGROUND To understand the inflow of immigrants into the U.S. and Michigan since FY 2012, PSC conducted an analysis of WRAPS data for refugee admissions and arrivals. Each FY ran from October 1 of a given year to September 30 of the following year. WRAPS is a collaborative computer information system provided by the Refugee Processing Center (RPC)—operated by the U.S. Department of State—to collect data on the movement of refugees from countries around the world to the U.S. for resettlement. The RPC uses this data to achieve its annual refugee admissions objectives. For PSC’s purpose, this data provided context for emerging trends regarding the effects of federal policy on refugees. Moreover, it also helped determine how refugee admissions changed in Michigan and in the U.S. since 2012 as well as the makeup of these populations (where they came from and where they stayed). Understanding this broader context also helped inform and implement the online survey and interview instruments. Using Tableau 10.5, a visual-analytic software, PSC also illustrated these changing trends, making the data accessible to different audiences. MICHIGAN REFUGEE TRENDS Texas, California, New York, Michigan, and Ohio are the top five states in refugee acceptance since FY 2012. While Texas and California have accommodated an average of more than 5,000 refugees per year, New York and Michigan accommodated more than 3,000 each since FY 2012. Plotting these arrivals shows that the Midwest has generally accepted more newly arriving refugees than other parts of the country. Out of the 428,355 refugees admitted into the U.S. since FY 2012, the top five states accounted for 34.2 percent (146,630) of the total number admitted, while the top ten states accounted for 54.4 percent (232,867). Michigan accounted for 5.3 percent of this total, a larger admittance rate than other states. This may be due to southeast Michigan’s large Arab community, which attracts many immigrants (The New Economy Initiative 2016). Even though Michigan has been a top-five state in accepting refugees, the changing national priorities have resulted in an 85.7 percent decline in total refugees entering Michigan since FY 2016 (Exhibit 1), a drop in refugees from 4,258 refugees in FY 2016 to 610 refugees in FY 2018. Between FYs 2016 and 2017, Michigan witnessed a reduction of refugees entering the state by 1,722 individuals. This accelerated to 1,926 refugees between FYs 2017 and 2018. Comparing across seven years, refugee arrivals in Michigan during FY 2018 account for only 2.7 percent of all arrivals from FY 2012 onwards. The policy priorities at the national level have had profound impacts not only on the total number of refugees entering Michigan but also on the nationality of those who enter the state. Since FY 2012, Iraq, Burma, and Syria accounted for 73.5 percent of the 22,667 refugees who had arrived in Michigan. Between FYs 2017 and 2018, refugee numbers from Iraq dropped from 802 to eight; Syria from 683 to three; Sudan from 50 to two; and Iran from 25 to zero. In contrast, refugee numbers increased Landscape Scan of Immigrant- and Refugee-supporting Organizations in Southeast Michigan 7
from four to 45 from the Ukraine and zero to 13 for Pakistan. The reduction in refugee acceptance from
Iraq, Syria, Iran, and Sudan is primarily due to Executive Order 13780, titled Protecting the Nation from
Foreign Terrorist Entry into the United States. On June 26, 2018, the U.S. Supreme Court upheld the
order, which bans entry of individuals from Iran, Libya, Somalia, Syria and Yemen. North Korea and
Venezuela are also on the list. Chad, Iraq, and Sudan have been removed from the list.

EXHIBIT 1. Distribution of Total Refugees within Michigan, by Country of Origin (FY 2012 to FY 2018)

 Country of                  FY           FY          FY           FY           FY           FY             FY              Total
 Origin                    2012         2013        2014         2015         2016         2017           2018    Total   Percent
 Iraq                      2,484       3,431        2,759        1,442        1,119         802              8   12,045    53.1%
 Burma                       539          489         409          434          284         126             94    2,375    10.5%
 Syria                          1           6            1         179        1,374         683              3    2,247     9.9%
 Congo                        79          120         226          251          618         427            255    1,976     8.7%
 Somalia                      98          196         275          287          255         102              3    1,216     5.4%
 Bhutan                      317          165         187          121          140         135             92    1,157     5.1%
 Afghanistan                    0           4           11          33          210           55            46     359      1.6%
 Sudan                        16           99           24          90           55           50             2     336      1.5%
 Eritrea                        7          13           42          30           49           53            23     217      1.0%
 Burundi                        3          22            0          51           54           23             8     161      0.7%
 Iran                           8           9           11          22             9          25             0      84      0.4%
 Cuba                         12           40           26            3            0           0             0      81      0.4%
 Ukraine                        4           0            0            7            8           4            45      68      0.3%
 Ethiopia                       1           4           12          11           17            8             5      58      0.3%
 Rwanda                         5          18            0          11             7           9             2      52      0.2%
 Total **                  3,594       4,651        4,006        3,012        4,258       2,536            610   22,667     100%
 Total % **              15.9%        20.5%        17.7%        13.3%       18.8%         11.2%           2.7%

Note: ** Totals include numbers for all countries. Exhibit 1 shows only the top 15 countries of origin.

NATIONAL REFUGEE TRENDS
Every year, the executive branch of the government sets a cap on the total number of refugees who can be
legally admitted into the U.S. This cap can be adjusted based on administration priorities and as a
response to refugee crises. Additionally, refugee applications can be processed at rates that allow the
annual cap to be met, exceeded, or not reached.

According to the WRAPS data, 428,355 refugees were admitted into the U.S. from FY In these seven
years, the U.S. came close to meeting its annual admission cap, except for 2012 (Exhibit 2). In response to
the Syrian refugee crisis of 2016, the government increased the cap to 85,000—100 percent of this cap
was met. In FY 2017, there was no defined cap, but 53,716 refugees were allowed to enter the U.S. In FY
2018, the cap was cut to 45,000, a 47 percent reduction from 2016, despite continued crises in Syria and
emerging crises in Yemen. For FY 2018, 47.9 percent of the cap was filled (Exhibit 2). The data at the
national level shows that not only have the caps been reduced, but the federal government is processing
refugee applications at a lower rate than before.

Landscape Scan of Immigrant- and Refugee-supporting Organizations in Southeast Michigan                                             8
The United Nations High Commissioner for Refugees (UNHCR) (2017) estimated that there were
approximately 25.4 million refugees worldwide at the end of 2017. However, current trends show that
even as the need for refugee services grows, the U.S. government has continued to reduce its annual
ceiling for refugee admissions. The 30,000 U.S. cap for FY 2019 represents 0.11 percent of the total
worldwide refugee population—a small fraction of actual needs. Given that less than 50 percent of the
refugee cap was filled in FY 2018, PSC estimates that a similar pattern will occur in FY 2019.

EXHIBIT 2. Total Refugees Admitted into U.S. and Percentage of Annual Ceiling Reached (FY 2012 to FY
2018)

KEY FINDINGS
Federal policies regarding refugees are having a profound impact on Michigan and the country. Though a
ban on individuals entering the country from predominantly Muslim countries affected refugees
worldwide, federal policy affected those arriving in Michigan by country of origin considerably in FY 2018
(Liptak and Shear 2018; Pierce et al. 2018). Those admitted from Iraq, Syria (historically, among the
highest numbers admitted to Michigan), Somalia, and Iran were reduced from 807, 683, 102, and 25 in
FY 2017 to eight, three, three, and zero in FY 2018, respectively. Overall, Michigan has seen an 85.7
percent drop in refugee admissions when compared to FYs 2016 and 2018. Having been the fourth-
ranked state nationwide in refugee admissions, Michigan’s decrease in FY 2018 is likely to have a far-
reaching impact on organizations that serve these populations and the state. Service organizations within

Landscape Scan of Immigrant- and Refugee-supporting Organizations in Southeast Michigan                  9
Michigan that rely on monies linked to refugee numbers are likely to experience further funding
disruptions. Federal monies and state monies with formulas that consider total number of refugees are
likely to have a disproportionate impact on Michigan due to the large overall decline in refugee numbers.
Service organizations will face pressures to maintain their level of service despite possible federal and
state funding cuts. As government plays a lesser role in funding services for this population, the
importance of grantmaking organizations will increase. Grantmaking organizations will face pressures to
fill the void left by possible funding cuts at the federal and state levels. Beyond economic implications,
there are also cultural consequences to consider. With fewer refugees, there is less diversity and a less
vibrant Michigan—attributes difficult to financially quantify.

MICHIGAN’S REFUGEE FUNDING STRUCTURES AND THE
NATIONAL RESETTLEMENT PROCESS
PSC conducted a review of refugee resettlement processes and monies available through federal and state
funds to better understand overall funding gaps for service providers in southeast Michigan. Though local
funds were considered in this review, only data on federal and state monies for refugees were available
directly. However, local funds for refugees and immigrants available at the aggregate level are
summarized in this report’s Form 990 analysis. Important providers of these funds are reported in the
later interview section.

PSC also conducted a literature review on Michigan’s resettlement process and models. PSC contacted the
Michigan Department of Licensing and Regulatory Affairs to provide data on the RCA program, TANF,
and other grants for FYs 2016, 2017, and 2018. Data was available on RCA dollar amounts received by the
state, but dollar amounts for refugee TANF amounts were not.

THE NATIONAL RESETTLEMENT PROCESS
The U.S. receives referrals on refugees needing resettlement through the UNHCR, U.S. embassies,
nongovernmental organizations, and self-registration (Boland and Gaffney 2017). Prior to admission,
refugees undergo overseas vetting that includes interviews, extensive security checks, and medical
screenings. After this process, the Department of Homeland Security approves or disapproves admission.
The U.S. Department of State processes the applications of those accepted.

Resettlement Agencies
Nine national U.S. resettlement agencies determine where newly arrived refugees will live, and coordinate
with local resettlement agencies to secure housing (Elkin et al. 2018).4 Local resettlement agencies
provide refugees initial reception and placement services during the first 90 days of arrival. These services
include taking refugees to their new homes, applying for social security numbers, registering children for
school, setting up medical appointments, accessing public benefit programs and ESL classes, and aiding
with everyday expenses, such as rent, clothing, and food (Elkin et al. 2018).

4
  These nine organizations include Church World Service, Episcopal Migration Ministries, Ethiopian Community Development Council,
Hebrew Immigrant Aid Society, International Rescue Committee, Lutheran Immigration and Refugee Service, United States Conference
of Catholic Bishops, U.S. Committee for Refugees and Immigrants, and World Relief.

Landscape Scan of Immigrant- and Refugee-supporting Organizations in Southeast Michigan                                         10
Cash Assistance Programs
Once in the U.S., refugees are eligible for three cash assistance programs: TANF, RCA, and the Matching
Grant Program. TANF benefits are not refugee specific and are typically available for five years after they
enter the country. RCA is available for up to eight months from arrival and matching grants are available
for up to 180 days after arrival. Apart from cash assistance, local resettlement agencies help refugees
enroll in medical assistance, such as Medicaid or RMA, through the ORR and the Supplemental Nutrition
Assistance Program, depending on eligibility. In southeast Michigan, the Michigan Department of Health
and Human Services (MDHHS) is responsible for administering TANF and RCA grants for refugees.
Nationally, there are three different models for administering RCA grants (Exhibit 6).

EXHIBIT 3. RCA Models since January 2016, by State

Note: Since January 2016, Kansas, Maine, and New Jersey no longer offer state-administered programs, and Texas no longer
administers a public-private partnership model.
Source: Elkin et al. 2018.

Landscape Scan of Immigrant- and Refugee-supporting Organizations in Southeast Michigan                                    11
MICHIGAN’S REFUGEE FUNDING STRUCTURES
In Michigan, refugees apply for TANF and RCA benefits at local public assistance offices. These offices
have specialized units with multilingual staff who understand refugee eligibility rules. The advantage of
the Michigan model of funding is that refugees who do not qualify for TANF can be easily enrolled into
RCA by the MDHHS (Elkin et al. 2018). Refugees enrolled in TANF, RCA, or both are provided access to
an array of employment-related programs, including career and technical education programs and on-
the-job training. These services are provided by refugee-serving organizations after eligibility for cash
assistance is determined. Exhibit 3 shows how the employment service model works in Michigan.

EXHIBIT 4. RCA and Employment Service Model in Michigan

Source: Elkin et al. 2018.

The average number of annual RCA recipients in Michigan fell by 83.8 percent and direct benefits to
individuals fell by 86.4 percent between FY 2016 and FY 2018 (Exhibit 4). Between FYs 2017 and 2018,
the numeric and percentage change is even greater. The average annual dollar amount in assistance
received by a refugee from the RCA program was $317.20 in FY 2016 and $266.40 in FY 2018. In
addition, refugee medical spending fell by 24.5 percent since FY 2016. Combined, RCA and medical
assistance fell from $3,733,240.40 in FY 2017 to $1,042,355.50 in FY 2018—a 72.1 percent reduction.
Dollar amounts spent on refugees through the TANF program were not available; however, the total
number of TANF recipients fell by 34.2 percent between FYs 2017 and 2018.

EXHIBIT 5. State-provided Assistance to Refugees (FY 2016 to FY 2018)

                                                                Annual Number of          RCA Spending
                                       Total RCA                    Refugee TANF           by FY (Direct       Refugee
                                      Recipients               Recipients (Monthly           Benefits to       Medical
 Year                          (Monthly Average)                          Average)          Individuals)      Spending
 2016                                    3,552 (296)                    24,324 (2,027)     $1,126,817.50   $1,176,922.30

 2017                                    4,968 (414)                    33,468 (2,789)     $1,455,981.00   $2,277,259.40

 2018                                       576 (48)                    22,008 (1,834)     $ 153,465.50*    $888,890.00
 Percent Change FY
                                             –83.8%                               –9.5%          –86.4%          –24.5%
 2016 to FY 2018
 Percent Change FY
                                             –88.4%                             –34.2%           –89.5%          –61.0%
 2017 to FY 2018

*Does not include data for September 2018.

Landscape Scan of Immigrant- and Refugee-supporting Organizations in Southeast Michigan                                12
Between FYs 2017 and 2018, monies received through the ORR grants by the state increased by 27.1
percent for social services and targeted assistance (Exhibit 5). During the same period, monies available
for services to older refugees increased by 52.7 percent and school impact services grew by 16.3 percent.
Data on social service employment case load was unavailable for FY 2018, but between FYs 2016 and
2017, the employment case load rose by 11.9 percent.
EXHIBIT 6. ORR Grants (FY 2016 to FY 2018)
Social Service
Social Services Employment
and Targeted Services to Older School Impact Services
Assistance Refugees Services Caseload
2016 $3,279,366.0 $121,500.0 $797,133 2,441
2017 $2,683,231.0 $121,500.0 $631,145.0 2,732
2018 $3,409,544.0 $185,523.0 $733,776.0 N/A
Percent Change FY
4.0% 52.7% –7.9% N/A
2016 to FY 2018
Percent Change FY
27.1% 52.7% 16.3% N/A
2017 to FY 2018
KEY FINDINGS
Between FYs 2017 and 2018 in Michigan, total RCA recipients fell by 88.4 percent, refugee TANF
recipients fell by 34.2 percent, RCA spending fell by 89.5 percent, and refugee medical spending fell by
61.0 percent. On average, the annual cash assistance provided in FY 2018 by the RCA program was
$266.40 per individual, enough to cover approximately one month’s car payment. Given that the refugee
cap for FY 2019 was lowered to 30,000, the RCA and RMA programs may face further financial strain.
However, ORR grants to Michigan increased between FYs 2017 and 2018, allowing grant recipients to
provide much-needed services for refugees.
FORM 990 DATA ANALYSIS
PURPOSE OF FORM 990
Nonprofit organizations recognized by the Internal Revenue Service (IRS) in the U.S. must file tax Form
990, which provides the public with financial information about these organizations. PSC analyzed this
data of immigrant- and refugee-serving organizations to determine organizational revenues and
expenditures in 2015 and 2016. Data from the analysis showed the direct economic impact of service
organizations, provided information on their solvency, and highlighted gaps in financial support.
Landscape Scan of Immigrant- and Refugee-supporting Organizations in Southeast Michigan 13METHODOLOGY Initially, Michigan 2-1-1 services provided PSC with the employer identification number (EIN) of every refugee and immigrant service organization within the five counties of southeast Michigan.5 Using each organization’s EIN, PSC extracted their 990 forms from GuideStar, an online service that provides information on IRS-registered nonprofit organizations. Michigan 2-1-1 services provided PSC with the employer identification number of seven refugee and immigrant service organizations within the study area, and CFSEM added another 21 organizations to this list. PSC was able to find 2015 and 2016 tax forms for the seven organizations from the 2-1-1 services list and 16 organizations from the CFSEM list within GuideStar. PSC was unable to find 2015 or 2016 tax forms for the remaining five organizations. In addition to the 23 organizations with available tax forms, PSC added another 15 by searching within GuideStar for all organizations classified as refugee- and immigrant-serving organizations (code P84 under Human Services). Organizations with a zero budget in 2015 or 2016, or those classified as defunct by the IRS, were not included in this analysis. PSC analyzed organizational revenues (Part VIII of the form) and expenses (Part IX) from the 2015 and 2016 tax forms for the 38 organizations in the final list. The balance sheet, Part X of the form, which covers assets, liabilities, and fund balances of the organizations, were not analyzed since PSC determined this information to be tangential to the project’s focus. In addition, the activities and governance section of the tax forms were often missing information; therefore, PSC did not include them in the analysis either. Information from the activities and governance section on the total number of employees within the organizations was collected through the online survey instrument. RESULTS AND DISCUSSION A plot of the average revenues and expenses (2015 and 2016) shows that most (26) refugee- and immigrant-serving organizations in southeast Michigan have an average budget of less than $1 million and very few (four) organizations have an average budget greater than $10 million (Exhibit 7). Samaritas is the largest organization, with an annual average budget exceeding $100 million. The Arab Community Center for Economic and Social Services (ACCESS), Arab American and Chaldean Council (ACC), and the Michigan Advocacy Program (MAP) are the other three organizations with average revenues greater than $10 million. These four organizations combined account for 79.3 percent of total revenues and 79.6 percent of all expenditures across all organizations within southeast Michigan. 5 Michigan 2-1-1 is a free service connecting state residents to assistance for health and human services agencies and resources, such as bill payment assistance and community, crisis, employment, food, and health services. Landscape Scan of Immigrant- and Refugee-supporting Organizations in Southeast Michigan 14
EXHIBIT 7. Average Revenues and Expenses of Organizations within Southeast Michigan

Note: Organizations with revenues and expenses greater than $10 million are indicated with their name.

The total revenue for all organizations within southeast Michigan increased by $9.02 million (5.02
percent) between 2015 and 2016, while expenses grew by $480,000 (0.27 percent) (Exhibit 8).
Correspondingly, average revenues increased by $240,648, while average expenses rose by $21,861. The
slower growth in expenditures compared to revenues may be an indication that organizations are
exercising caution about spending. The annual budget of the smallest organization was 0.01 percent of the
budget of Samaritas, while the median annual budget of all organizations was 0.48 percent of that of
Samaritas. Due to economies of scale, those with larger budgets may have more advantages, including the
ability to provide stronger advocacy.

Landscape Scan of Immigrant- and Refugee-supporting Organizations in Southeast Michigan                  15
EXHIBIT 8. Summary Statistics of Organizational Revenues and Expenses within Southeast Michigan

                                                             Revenue                                    Expenses
 Statistical Measures                               2015                    2016                 2015              2016
 Average                                            $ 4,755,393             $ 4,996,041          $ 4,711,298       $ 4,733,159
 Median                                               $ 522,846               $ 487,006           $ 476,948         $ 498,105
 Mode                                                        N/A                     N/A                N/A               N/A
 Minimum                                                $ 19,440                   $ 877            $ 15,978         $ 12,583
 Maximum                                         $ 101,224,100             $ 99,763,132        $ 101,566,638   $ 100,302,147
 Total                                           $ 179,686,313           $ 188,708,619         $ 178,159,318   $ 178,639,363
 Number of Organizations                                       38                         38             38                38

Revenues grew between 2015 and 2016, and the composition of revenues changed. Program service
revenue, defined as revenue earned by selling products or services related to the mission of the
organization, fell from 63.22 percent to 41.30 percent (Exhibit 9). Program service revenue includes
income earned from providing a service, facility, or product to a government agency that benefited that
government agency directly instead of the whole public. This contrasts with government grants, which
increased from 6.11 percent to 13.65 percent, and are grants from local, state, federal, or foreign
government sources that enable an organization to provide a service or maintain a facility for the direct
benefit of the public. Contributions grew from 26.95 percent to 42.46 percent and are the combined total
of income from federated campaigns, membership dues, and fundraising events related to organizations
minus government grants.

EXHIBIT 9. Source of Revenue for All Organizations, by Year

Landscape Scan of Immigrant- and Refugee-supporting Organizations in Southeast Michigan                                      16
Expenses did not show major changes between 2015 and 2016. Administrative costs fell from 42.90 percent to 42.27 percent (Exhibit 10) as did other expenses that year, dropping from 22.45 percent to 21.39 percent. Program service expenses grew by 1.69 percent from 34.65 percent to 36.34 percent. These calculations suggest organizations were paying for their program expenses by reducing administrative and other costs. EXHIBIT 10. Source of Expenses for All Organizations, by Year KEY FINDINGS Between 2015 and 2016, revenues for service organizations increased by $9.02 million (5.02 percent) compared to a $480,000 (0.27 percent) increase in expenditures. Organizations grew revenues by relying more on contributions and government grants than on program service revenues. On the expenditure side, organizations increased service expenditures by redirecting administrative and other expenses. Samaritas, ACCESS, ACC, and MAP showed the highest revenues and expenditures. More broadly, eight other organizations had revenues and expenditures greater than $1 million: Catholic Charities of Southeast Michigan, Catholic Social Services of Washtenaw County, Southwest Solutions, Chaldean Community Foundation, Jewish Family Services of Washtenaw County, Chaldean Federation of America, Zaman International, and Michigan United. Because of their size, these 12 organizations are key in shaping the public’s and policymakers’ opinions on refugee, immigrant, and asylee policy. Most organizations in southeast Michigan are reacting in a proactive manner to the challenges they face, but some may not be able to sustain operations without additional funding sources. When service organizations fail, the resulting service gaps must be filled by others, increasing the strain on funding streams. Landscape Scan of Immigrant- and Refugee-supporting Organizations in Southeast Michigan 17
SURVEY OF IMMIGRANT- AND REFUGEE-SERVING
ORGANIZATIONS IN SOUTHEAST MICHIGAN
PURPOSE OF THE SURVEY
PSC conducted a 25-question online survey of 38 organizations identified in the Form 990 data analysis
from southeast Michigan. The purpose of this survey was to gain insight into the philanthropic
investments made to these organizations, as well as the needs, barriers, and gaps in services for refugees,
immigrants, and asylum seekers living and accessing human services in southeast Michigan. The survey
consisted of questions within four topic areas: services, clients, funding, and organizational
characteristics. PSC did not seek to differentiate between refugees, immigrants, and asylum seekers. A
total of 18 organizations answered the survey—a response rate of 47.3 percent.

RESULTS
Service Types
Question three of the survey asked respondents about the types of services their organizations provide to
refugees, immigrants, or asylum seekers. PSC created a list of 15 preselected service types from which
organizations could choose: adult education; job training; employment/job placement;
healthcare/medication; mental healthcare; English language/translation services; immigration services;
other legal services; food; housing; transportation; youth education, mentoring, and/or tutoring; social
services; advocacy for refugee/immigrant rights; and an open-ended other category. Out of the 15 service
types, respondents noted immigration services (72.2 percent), English language/translation services (72.2
percent), and advocacy for refugee and immigrant rights (66.6 percent) most frequently. The four types of
services least likely to be provided were healthcare/medication (22.2 percent), mental healthcare (38.9
percent), transportation (38.9 percent), and other legal services (38.9 percent). Most other services, such
as adult education; job training; employment and job placement; housing; youth education, mentoring,
and/or tutoring; social services; and others were provided by 50 percent or less of the organizations.

Service Areas
Question four of the survey asked respondents about the percentage of their organizational annual budget
allocated to the 15 service types. The top five service types where organizations spent most of their
revenues were in youth education, mentoring, and/or tutoring (x̅ = 23.7 percent, SE = 13.8 percent);
social services (x̅ = 15.6 percent, SE = 7.1 percent); immigration services (x̅ = 15.2 percent, SE = 5.4
percent); employment/job placement (x̅ = 12.0 percent, SE = 4.3 percent); and other legal services (x̅
= 10.7 percent, SE = 4.1 percent).6 The three service areas where organizations spent the least of their
revenues were in healthcare/medication (x̅ = 1.8 percent, SE = 1.2 percent), mental healthcare (x̅ = 4.7
percent, SE = 2.2 percent), and adult education (x̅ = 4.8 percent, SE = 1.9 percent).

6
  x̅ stands for the mean. SE refers to standard error, a measure of the statistical accuracy of an estimate, equal to the standard deviation
of the theoretical distribution of a large population of such estimates.

Landscape Scan of Immigrant- and Refugee-supporting Organizations in Southeast Michigan                                                   18
Funding Sources
Question five of the survey created a grid where organizations could select source(s) of funding by service
type. Respondents reported receiving monies from 185 funding sources. The largest number of funds were
from private donors (44.9 percent), followed by the federal government (21.6 percent), state government
(20.0 percent), and local/municipal government (10.3 percent). Private donors included organizations
such as the Jewish Federation of Metropolitan Detroit, the W.K. Kellogg Foundation, the Ford
Foundation, and the Michigan State Bar Foundation. Federal government sources of funding included the
U.S. Department of Health and Human Services, the U.S. Department of Justice, and the U.S. Department
of Housing and Urban Development. State monies for services were provided by the Michigan
Department of Education, the governor’s office and the MDHHS. Local and municipal contributors
included the Cities of Dearborn and Detroit as well as Washtenaw County.

Populations Served
Organizations varied greatly in the average number of people served in a month, ranging from ten to
2,300, with a mean of 461 individuals and an SE of 266. Out of 18 organizations, 11 reported serving
individuals already receiving aid through public assistance programs (TANF, Supplemental Security
Income, food stamps, and Medicaid), with 10 to 90 percent of the clients receiving public assistance.
Refugee-, immigrant-, and asylee-serving organizations reported, on average, that 75 to 100 percent of
their clients live below the federal poverty line. Most organizations specifically served women, men, and
minors, while two reported serving families as well as those in the lesbian, gay, bisexual, and transgender
communities. Almost 90 percent of organizations referred refugees, immigrants, and asylees to services
within their county, while almost 67 percent referred individuals to services outside their county. Ten
organizations (55.6 percent) served their clients from one to three years, while five (27.8 percent) served
their clients for more than three years. The five most-referred services for these populations were
healthcare and medication (72.2 percent), mental healthcare (72.2 percent), housing (66.7 percent), adult
education (66.7 percent), and English language/translation services (61.1 percent).

Organizational Budgets
For FY 2017, the average organizational budget for was $4.32 million, with a range from $52,614 to
$26.26 million. The median budget was $1.57 million, indicating a right-skewed distribution of budgets
(Exhibit 7). This skewed distribution was also observed in the Form 990 analysis, and the survey data
further validated the results of the Form 990 analysis. The proportion of the annual budget dedicated to
immigrants, refugees, and asylees ranged from 5 to 100 percent of organizational budgets, with a mean of
55.8 percent (SE = 9.8 percent). The largest source of funding for organizations came from private
donations (44.6 percent of budget, SE = 8.8 percent), followed by the federal government (mean = 18.9
percent, SE = 5.9 percent), state government (13.8 percent, SE = 6.0 percent), local government (2.8
percent, SE = 1.4 percent), other sources (0.8 percent, SE = 0.5 percent), and investments/endowments
(0.4 percent, SE = 0.4 percent). Private donations include philanthropic investments and foundation
grants.

Landscape Scan of Immigrant- and Refugee-supporting Organizations in Southeast Michigan                  19
Staffing
In terms of staffing, organizations serving refugees, immigrants, and asylees had between zero to five
executive-level positions (1.8 full-time equivalents, or FTEs, SE = 0.3 FTE), zero to 16 director-level
positions (3.9 FTEs, SE = 1.1 FTEs), zero to 250 program-level positions (29.9 FTEs, SE = 15.5 FTEs), zero
to 30 administrative-level positions (4.2 FTEs, SE = 1.9 FTEs), and zero to 21 other paid positions (two
FTEs, SE = 1.4 FTEs). Almost all organizations relied heavily on the help of volunteers. Volunteer hours
ranged from 720 to 19,500 annually, with a mean of 7,145 hours. If a full-time employee works 2,080
hours a year, the mean number of volunteer hours is equivalent to having 3.44 FTEs annually.

Within the service organizations, if the mean number of executive-level, director-level, program-level,
administrative support, and other paid staff positions is added, there are approximately 42 employees.
The average number of clients served per month by the service organizations was 461. Even after
including volunteer hours, the ratio of employees to clients served per month within service organizations
was greater than ten, an indication that these organizations may be stretching their staffing resources to
meet community needs.

KEY FINDINGS
In southeast Michigan, the need for refugee, immigrant, and asylee services is high, with service
organizations helping hundreds of clients monthly and on an ongoing basis. Most individuals and families
receiving services live in poverty. While it is unclear whether services provided are enough to get
individuals and families out of poverty, it is clear is that without these services the individuals and
families would be worse off. Private donations are the main source of revenue funding these services,
followed by federal, state, and local government funding. Access to these services is important because it
is likely to determine the success of settlement and integration within the broader southeast Michigan
community.

The survey showed that strengths and gaps in services exist within southeast Michigan and were created
by four factors. The first factor was that not all service providers offered services across all 15 service
areas. Service areas of relative strength in which there were many providers were immigration services,
English language/translation services, and advocacy for refugee and immigrant rights. Gaps were most
pronounced in healthcare/medication, mental healthcare, transportation, and other services. Other
services include entrepreneurship, financial empowerment, emergency services, etc.

The second factor creating strengths and gaps in services was how much of finite budgetary resources was
allocated to different program areas by service organizations. Service organizations allocated more of their
budget to service areas within youth education, social services, immigration services, employment/job
placement, and other legal services. Fewer monies were allocated to the areas of healthcare/medication,
mental healthcare, and job training.

The third factor creating strengths and gaps in services is how much money was available from
grantmakers to fund programs within the 15 service areas. PSC’s survey did not collect this information
directly, but information based on 185 total sources of funding indicated some service areas received more
support than others. The areas that received more funding support from external organizations included
immigration services, English language/translation services, transportation, and adult education. The
areas that received less support were other services, healthcare/medication, and other legal services.

Landscape Scan of Immigrant- and Refugee-supporting Organizations in Southeast Michigan                       20
In southeast Michigan, the service areas that received the greatest support were immigration services and
English language/translation services, while those receiving the least support were
healthcare/medication, mental healthcare, and other services. The remaining ten service areas aligned
differently on the factors either as strengths or weaknesses or a combination of both.

The fourth factor that could have resulted in gaps in services was a lack of adequate staff to meet the
needs of the community. Quantitatively, it can be said that service organizations in southeast Michigan
rely heavily on volunteer staff and have a client-to-staff ratio of greater than ten to one. However, it is not
known whether this staffing level is adequate or inadequate. In order to better determine how the needs of
the community were being met, PSC paired the survey with qualitative interviews of service organizations,
grantmakers, state agencies, and individuals with expertise in refugee/immigrant issues. The findings
from the interviews are presented in the next section. When combined with the quantitative survey data,
they present a better picture of the strengths, gaps in services, and resources available to the community,
as well as the interest that organizations have in creating a collaborative to address gaps.

INTERVIEWS OF IMMIGRANT- AND REFUGEE-SERVING
ORGANIZATIONS IN SOUTHEAST MICHIGAN
PURPOSE OF THE INTERVIEWS
PSC conducted interviews with multiple organizations that work on issues impacting the lives of
immigrants, refugees, and asylees. The purpose of these interviews was to gain additional insights into the
services being provided, projects being funded, barriers, and gaps in services to immigrants and refugees.
Interviewees included service organizations, grantmaking organizations, state government offices, and
individuals with expertise in immigrant/refugee issues. PSC conducted 14 interviews—five face-to-face
and nine via telephone. The interviews consisted of 36 questions and took approximately two hours to
complete. Questions stayed within ten topics: general, settlement and integration, housing, employment,
health and mental health, language training programs, policy landscape, funding structure, funding
collaborative, and open ended. The interview script was modified for conversations with state agencies.

GENERAL
Organizations support immigrants and refugees in southeast Michigan in different ways. Typically,
grantmaking organizations fund a wide variety of projects or services related to immigrants and refugees
incidentally (e.g., funding for projects aimed at people in poverty where refugees are a subset). Some
funded projects for immigrants and refugees specifically (e.g., having an arts and culture team within the
organization that focuses their grants on ethnic communities). Service providers and grantmaking
organizations have collaborated with CFSEM either directly or indirectly in the past.

SETTLEMENT AND INTEGRATION
Service and grantmaking organizations provide an array of services for settlement and integration. Almost
all organizations provided examples of programs that have led to improved outcomes for refugees and
immigrants. Organizations provide advocacy and help refugees and immigrants with necessities, such as
finding affordable housing, obtaining legal services, finding ESL classes that include technological
literacy, and joining initiatives that help change the narrative around refugees and immigrants.

Landscape Scan of Immigrant- and Refugee-supporting Organizations in Southeast Michigan                      21
The overarching issue that emerged regarding settlement and integration was the lack of access to
services. PSC was able to organize the lack of access to services into specific barriers that prevented better
access. The barriers included language, culture, employment/financial, transportation, inability to obtain
a legal Michigan ID, lack of positive stories about this population, and duration of services. The barriers
were often intricately linked and could not be neatly separated into distinct and separate pieces. For
example, not being able to speak English well could put a refugee/immigrant/asylee at a disadvantage
during a job interview, which directly impacts employability.

Language Barriers
Many refugees, immigrants, and asylees do not speak English. One interviewee shared that some refugees,
immigrants, and asylees they encountered do not know how to sign their name as they were only used to
fingerprints for identification in their country of origin. Teaching refugees, immigrants, and asylees basic
reading, writing, and speaking skills was an important step in the integration process according to this
interviewee. Another interviewee mentioned a refugee client who was able to obtain a job at the Detroit
airport but could not read bus signs or maps that would allow them to commute to work.

Another interviewee talked about how businesses in their area had called and asked if a bilingual bank
existed in the neighborhood. Others shared examples of how refugees/immigrants/asylees trying to get a
social security number or a driver’s license had navigate a minefield of services difficult to access without
a strong grasp of English.

One interviewee shared their story regarding the Flint water crisis, during which information was not
translated correctly to residents. Government translations were literal and failed to convey the intended
message. The interviewee’s organization hired translators who translated materials at third- and fourth-
grade reading levels into Spanish and Arabic, and the information was then disseminated in a way the
community could understand. During the same crisis, refugees and immigrants who went to centers for
clean bottled water had to show identification, which many people did not have. Advocacy efforts by this
organization led to individuals not having to show identification; instead, they could simply state their
individual zip code.

As one interviewee put it “…there are many social service initiatives to help people face the economic
challenges, but these are not linguistically accessible or culturally competent in the way they provide their
services, so utilization among immigrants and refugees is lower.”

Cultural Barriers
One barrier impacting many refugees and immigrants is the difficulty of bridging cultural gaps. An
interviewee shared a story about a refugee client who attended a job interview. During the job interview,
the refugee candidate was asked what animal he would choose to be if given a choice. The candidate
answered that he would choose to be a lamb. In the U.S., it may be typical for candidates in the given
situation to choose an apex predator, such as a wolf or lion, to showcase their skills in leadership;
however, the candidate chose a lamb because of his Christian faith, representing his humility, which is an
important part of his culture. The candidate got the job because his employers understood the cultural
context of the candidate’s response. According to this interviewee, for every instance where cultural
context is understood and appreciated, there are many more instances where they become a barrier.

Landscape Scan of Immigrant- and Refugee-supporting Organizations in Southeast Michigan                     22
You can also read