DigitalCommons@UMaine - The University of Maine
←
→
Page content transcription
If your browser does not render page correctly, please read the page content below
The University of Maine
DigitalCommons@UMaine

Transportation                                                        Margaret Chase Smith Policy Center

6-2021

Rural Public Transportation and Maine: Review of State Best
Practices
Erin Brown

Jonathan Rubin

Follow this and additional works at: https://digitalcommons.library.umaine.edu/mcspc_transport

This Report is brought to you for free and open access by DigitalCommons@UMaine. It has been accepted for
inclusion in Transportation by an authorized administrator of DigitalCommons@UMaine. For more information,
please contact um.library.technical.services@maine.edu.
Rural Public Transportation and Maine: Review of State Best Practices

               Rural Public Transportation and Maine:
                   Review of State Best Practices
                                   Technical Report
                                      June 2021

                            Erin Brown and Jonathan Rubin
             Margaret Chase Smith Policy Center and the School of Economics
                                  University of Maine

Abstract
MaineDOT has a family of transit plans that have been developed over the past five years
through collaborative efforts with partners and stakeholders. These plans share similar
themes, guidance, and recommendations and tie into the Department’s last Strategic Plan,
which was completed in 2016. However, since their development, there have been a
number of important and related efforts and developments that impact the strategic vision
and plan for transit services in Maine. This report reviews how other states with similar
demographics, population disbursements, and climates are addressing their transit
challenges, with a focus on rural areas, access, and equity. One caution is that states and
transit agencies do not use the same metrics when reporting program costs and benefits.

Acknowledgements and Disclaimers
This study would not have been possible without the strong cooperation of the Maine
Department of Transportation. We would like to specifically recognize the following
individuals from MaineDOT: Joyce Taylor, Jennifer Brickett, Ryan Neale, Taylor LaBrecque,
Dale Peabody, and Dawn Bickford. In addition, we also thank Katherine Freund, Dana
Rowangould, Sarah Cushman, and Kathryn Ballingall. The views and opinions expressed in
this report are solely those of the Margaret Chase Smith Policy Center and the individual
authors. They do not represent those of Maine Department of Transportation or any other
individual or organization that has provided information or assistance.

                                                                                     Page 1 of 48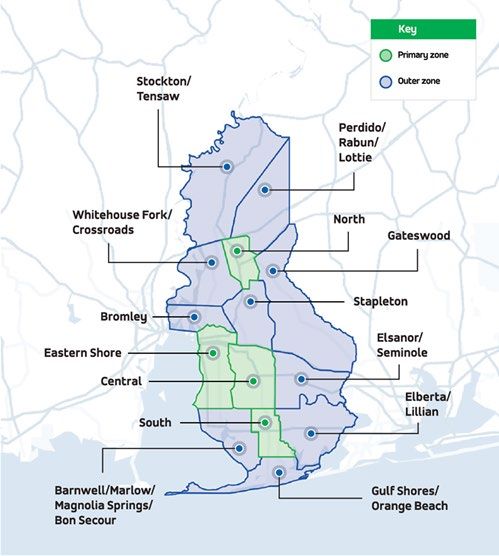
Rural Public Transportation and Maine: Review of State Best Practices

Executive Summary
Access to critical services, such as jobs, education, healthcare, and shopping, is essential for
the livability of any community. For those living in rural communities, these services are
often farther away, requiring access to a vehicle or public transit.

From 2010 to 2016, rural America experienced a decline in population. Recently, this trend
reversed, and rural counties as a whole saw a modest increase in population. Though the
population may be relatively stable, from 2010 to 2019, nationally, rural public transit
ridership grew over 30%. In comparison, during the same time period, urban ridership
decreased by about 1%.

Given the larger population of older Americans in rural communities, this trend in rural
transit is likely to continue. In Maine, the oldest and most rural state, preparing to meet this
need is fundamental for our communities. The Maine Strategic Transit Plan 2025 found a
great need for public transportation. Public transportation provides access to essential
services for individuals and households with limited access to a private vehicle.

This report reviews how other states with similar demographics, population
disbursements, and climates are addressing their transit challenges, with a focus on rural
areas, access and equity.

In Vermont
   •   Federal funding accounts for about 85% of total revenues for the Vermont Agency of
       Transportation (VTrans)’s public transit program. The Vermont State Transportation
       Fund covers the remaining amount.
   •   Farebox revenue for rural transportation providers covers less than 3% of their
       operating expenses. One-third of rural transportation providers are fare-free.
   •   Vermont identified that the critical needs of those with substance use disorders
       were not being met by current transportation programs. The Recovery and Job
       Access Pilot Program, funded by a grant from the Federal Transit Administration
       (FTA) is designed to fill those gaps. It provides transportation to group meetings,
       access to recovery centers, drug testing sites, and medical appointments, as well as
       job access (training, interviews, and initial commutes). Over 2,000 trips were
       provided from September 2019 through April 2020.
   •   The Rides to Wellness program lowers the transportation barrier for medical care by
       providing rides to medical appointments not covered by Medicaid or the Elders and
       Persons with Disabilities Transportation Program. Since April 2018, about 1,000 trips
       have been provided.

Key takeaways from Vermont:

                                                                                     Page 2 of 48
Rural Public Transportation and Maine: Review of State Best Practices
1) The consolidation of rural public transportation providers can produce cost
savings through economies of scale, resulting in better pricing for vehicles,
insurance, fuel, and supplies.
2) Integration can lead to service improvements. Existing routes can be modified to
better fit customers’ needs. The cooperation between service providers through
joint schedules can provide increased access and a better rider experience.
3) Potential feasibility of microtransit for areas with small populations. A
microtransit pilot program is being tested in Montpelier, the first city of its size to
use microtransit.
In New Hampshire
• State funding covers about 6% of operating expenses for rural providers.
• Farebox revenue makes up a small percentage of operating expenses for rural
providers. In 2019, it covered 4.9% of operating expenses.
• Federal funding is the main contributor to operating expenses, covering 52.3%.
• Local funding sources cover 13.5% of operating expenses for rural transit providers.
Key takeaways from New Hampshire:
1) State partnerships with private transit providers can provide expanded intercity
route coverage.
2) Volunteer drivers provide critical transportation services, especially in rural
areas, but cannot compensate for insufficient funding.
In North Dakota
• 1.5% of funding for public transportation is provided by the state through
appropriations from the State Highway Fund.
• State funding covers 22.8% of operating expenses for rural transit providers. Federal
funding covers just over half of operating expenses. Fares and local governments
provide similar amounts, 10.5% and 11.9%
Key takeaways from North Dakota:
1) Offering programs specifically aimed at workers and allowing scheduling
flexibility can make transit more accessible.
How Maine compares
• When compared with the peer states, Maine is the second largest rural transit
provider (in terms of unlinked passenger trips, vehicle revenue miles, and vehicle
revenue hours), behind Vermont. Maine also has the second highest operating
expenses overall, again behind Vermont.
• Of the four states, Maine’s rural public transit providers receive the least federal
funding for operating expenses. In 2019, they received $2,394,795, or 18.4% of
operating expenses. New Hampshire, which received the second lowest amount,
Page 3 of 48Rural Public Transportation and Maine: Review of State Best Practices
spent over $3 million of federal funds for the operating expenses of rural transit
providers.
• Much of the funding burden for rural public transit falls on Maine’s local
municipalities. Local funds covered 24.6% of rural providers’ operating expenses in
2019, or over $3 million.
• North Dakota has the highest operating expense per unlinked passenger trip,
$18.69. Maine has the second highest cost, $12.27 per trip. Maine’s cost is only
slightly higher than Vermont’s cost of $12.09 per unlinked passenger trip.
• Maine’s largest contributor to the operating expense per unlinked passenger trips is
other funding sources, at $5.71. These may include advertising, contract stops, and
funds from other agencies and institutions. Local funds cover $3.01 per unlinked
passenger trip and federal funds cover $2.25. For comparison, in Vermont, other
funds cover $0.21 per unlinked passenger trip, local funds $0.87, and federal funds
$7.46.
Innovative programs across the US
• Independent Transportation Network (ITN) is a community-based organization,
specializing in the transportation of seniors and those with visual impairments. ITN
uses private vehicles, in conjunction with both volunteer and paid drivers, to create
a community transportation network.
• The California Green Raiteros Rideshare Program was started as an informal, self-
organized, dial-a-ride program to provide service between the (low-income) rural
farming community of Huron and essential services of Fresno. Through a
partnership with EVgo and the Latino Equity Advocacy & Policy Institute (LEAP), the
program has been expanded. The program currently receives grant funding from
the Fresno Clean Shared Mobility Network.
• Dynamic bus routing operates on the same concept as “mobility-on-demand”
ridesharing services, such as Uber or Lyft. Baldwin County, a rural county in
Alabama, utilizes Via microtransit technology to provide on-demand transportation
to a 2,000 square mile service area, with a population of 200,000. They utilize three
service zones, offering different levels of service depending on location. Ben
Franklin Transit (BFT), in Washington state, uses microtransit to increase transit
access and help solve the first mile/last mile problem.
• The VVTA Needles CarShare, in Needles, California, partnered with Enterprise to
create a carshare program for a small population. Enterprise provides the vehicles.
In return, VVTA guarantees a minimum monthly payment, regardless of usage. To
make this more accessible to lower income individuals, users do not pay annual fees
or for insurance and fuel.
Page 4 of 48Rural Public Transportation and Maine: Review of State Best Practices
Contents
Abstract................................................................................................................................................................ 1
Acknowledgements and Disclaimers ............................................................................................................... 1
Executive Summary............................................................................................................................................ 2
Figures ................................................................................................................................................................. 6
Tables ................................................................................................................................................................... 6
Introduction ........................................................................................................................................................ 7
Peer State Case Studies ..................................................................................................................................... 8
Vermont .......................................................................................................................................................... 8
Funding .....................................................................................................................................................10
Vermont Alternative Transportation and Pilot Programs ..................................................................11
Lessons Learned......................................................................................................................................12
New Hampshire ...........................................................................................................................................15
Funding .....................................................................................................................................................17
Lessons Learned......................................................................................................................................18
North Dakota ................................................................................................................................................20
Funding .....................................................................................................................................................21
Highly Rural Veteran Transportation Grant .........................................................................................22
Lessons Learned......................................................................................................................................23
Maine .................................................................................................................................................................24
Comparison with Peer States .....................................................................................................................25
Innovative Solutions .........................................................................................................................................27
Green Raiteros – California.........................................................................................................................27
Microtransit ..................................................................................................................................................29
Independent Transportation Network......................................................................................................31
VVTA Needles CarShare ..............................................................................................................................32
Appendix ...........................................................................................................................................................33
Vermont Rural Public Transportation Providers .....................................................................................33
New Hampshire Rural Transportation Providers ....................................................................................34
North Dakota Tribal Transportation Providers ........................................................................................35
North Dakota Rural Transportation Providers ........................................................................................36
Maine Rural Transit Providers....................................................................................................................40
Bibliography ......................................................................................................................................................42
Page 5 of 48Rural Public Transportation and Maine: Review of State Best Practices
Figures
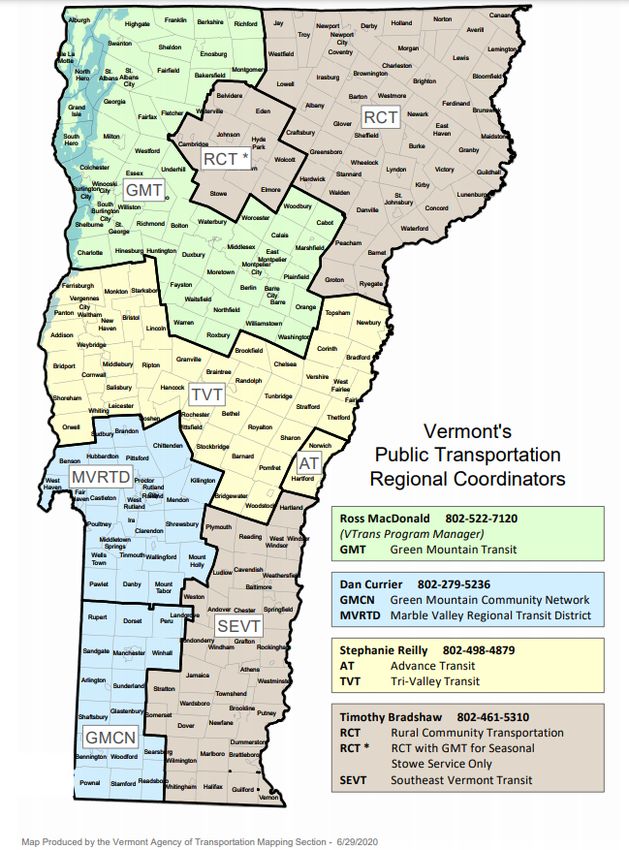
Figure 1: Map of Vermont's public transportation regions. ......................................................................... 8
Figure 2: Funding Sources for Operating Expenses of Vermont Rural Transit Providers, 2019.. ..........11
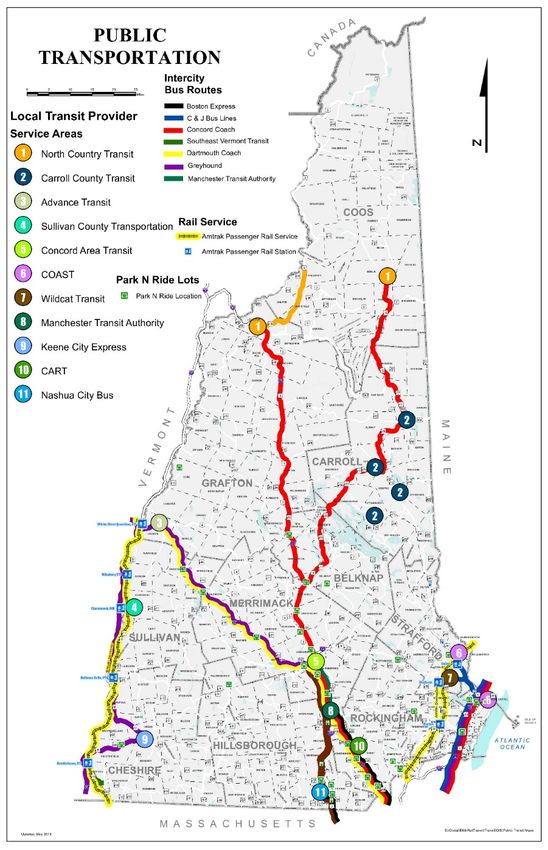
Figure 3: Public transportation in New Hampshire, May 2019. North County Transit and Carroll
County Transit are both provided by Tri-County Transit. ..........................................................15
Figure 4: Funding Sources for Operating Expenses of New Hampshire Rural Transit
Providers, 2019. ...............................................................................................................................18
Figure 5: Operating funding sources of North Dakota rural and tribal transit providers, 2019. ..........22
Figure 6: Maine transit regions. ......................................................................................................................24
Figure 7: Green Raiteros service area............................................................................................................28
Figure 8: Service zones for BRATS On-Demand. ..........................................................................................31
Tables
Table 1: Vermont Transit Providers: Revenue Miles and Hours. ................................................................. 9
Table 2: Unlinked passenger trips by mode, Vermont 2019. .....................................................................10
Table 3: New Hampshire summary of services provided in 2019. ............................................................16
Table 4: Unlinked passenger trips by mode for rural transit providers in New Hampshire, 2019. ......17
Table 5: Summary of North Dakota rural and tribal transit providers, 2019. The City of Minot
and the Turtle Mountain Band of Chippewa Indians are the only providers with bus service.
...........................................................................................................................................................20
Table 6: Summary of services provided by Maine rural transit providers, 2019. ....................................25
Table 7: Aggregation of service metrics for rural transportation providers by state, 2019. ..................26
Table 8: Funding sources for operating expenses of rural transit providers by state, 2019. ................26
Table 9: Operating expense per unlinked passenger trip of rural transit providers by funding
source, 2019. ....................................................................................................................................27
Table 10: Efficiency metrics of rural transit providers, by state, 2019. .....................................................27
Page 6 of 48Rural Public Transportation and Maine: Review of State Best Practices
Introduction
Access to critical services, such as jobs, education, healthcare, and shopping, is essential for
the livability of any community. For those living in rural communities, these services are
often farther away, requiring access to a vehicle or public transit.
From 2010 to 2016, rural America experienced a decline in population (Cromartie 2018).
Recently, this trend reversed, and rural counties as a whole saw a modest increase in
population (Cromartie 2020). Though the population may be relatively stable, from 2010 to
2019, rural public transit ridership grew over 30%, from 95.6 million trips to 125.5 million
trips (National Transit Database 2020). In comparison, during the same time period, urban
ridership decreased by 0.92% (National Transit Database 2020).
Given the larger population of older Americans in rural communities, this trend in rural
transit is likely to continue. In Maine, the oldest and most rural state, preparing to meet this
need is fundamental for our communities.
The Maine Strategic Transit Plan 2025 found a great need for public transportation. Maine
is not only the oldest state, but it is aging more rapidly than others. By 2030, one quarter of
Mainers will be over 65. Moreover, Maine’s strategic transit plan forecasts that 90% of
Mainers want to age in place (Peter Schauer Associates 2015).
Public transit is not just for Maine’s seniors. Public transportation provides access to
essential services for individuals and households with limited access to a private vehicle.
Additionally, in some areas, individuals prefer to be carless. Currently about 7%, or 39,628
households in Maine are without private vehicles, 75% of whom are in rental occupied
housing units (American Community Survey, 2019).
However, rural public transit is often overlooked in transportation research. This report
highlights lessons learned from three peer states (Vermont, New Hampshire, and North
Dakota) which may inform Maine’s own rural transit best practices. Innovative transit
solutions are discussed, as possible inspirations for Maine’s transit systems.
Page 7 of 48Rural Public Transportation and Maine: Review of State Best Practices
Peer State Case Studies
Vermont
Vermont has eight public transportation
regions served by seven different public
transit providers (Vermont Agency of
Transportation Mapping Section 2020).
Services offered include fixed-routes,
demand-response routes, and deviated
fixed-routes (fixed-routes with some
deviations based on demand), as well as
a recently launched on-demand
microtransit service (Steadman Hill
Consulting, Inc., Monahan Mobility, and
Foursquare Integrated Transportation
Planning 2020a). In addition to these
more traditional programs, Vermont
also has two pilot programs to increase
transit access for at-risk groups: Rides to
Wellness and Recovery and Job Access
Rides (Lorber and Falbel 2018; Vermont
Agency of Transportation 2019).
Transit providers vary greatly in terms of
service area, number of routes, and
passenger trips. Green Mountain Transit
Figure 1: Map of Vermont's public transportation
(GMT) Authority is the largest transit
regions. Source: Vermont Agency of Transportation
provider, in terms of passenger trips Mapping Section, 2020.
and vehicle revenue hours (see Table
1). 1 However, they are surpassed in vehicle revenue miles by Rural Community
Transportation (RCT). In 2019, RCT passengers took about 10% of the number of trips that
GMT passengers took.
1
Green Mountain Transit Authority serves Chittenden, Franklin, Grand Isle, Lamoille, and Washington counties.
Page 8 of 48Rural Public Transportation and Maine: Review of State Best Practices
Table 1: Vermont Transit Providers: Revenue Miles and Hours.
Annual Annual Vehicle Annual Vehicle
Transit Provider 2 Reporter Type
Unlinked Trips Revenue Miles Revenue Hours
Green Mountain
Full 2,843,044 3,877,420 212,209
Transit Authority
Marble Valley Rural General
806,778 3,632,945 147,343
Regional Transit Public Transit
Southeast Vermont Rural General
445,702 1,432,400 59,557
Transit Public Transit
Rural General
Tri-Valley Transit 282,751 3,513,911 121,803
Public Transit
Rural Community Rural General
264,752 4,046,097 151,056
Transportation Public Transit
Green Mountain Rural General
200,154 1,959,304 79,708
Community Network Public Transit
Rural General
Advance Transit 136,090 143,144 9,105
Public Transit
Differences in annual vehicle revenue miles are largely accounted for by differences in
service mixes and population density. GMT serves the most densely populated part of the
state and its most utilized service is bus transportation (fixed route or deviated fid route
service). For RCT, about 71% of its service is demand-response service (see Table 2).
2
Source: Office of Budget and Policy 2020.
Page 9 of 48Rural Public Transportation and Maine: Review of State Best Practices
Table 2: Unlinked passenger trips by mode, Vermont 2019.
Commuter Demand- Demand-response -
Transit Provider 3 Bus Trips
Bus Trips response Trips Taxi Trips
Green Mountain
8.46% 5.59% 0.00% 85.95%
Transit Authority
Marble Valley
17.51% 17.55% 0.00% 64.94%
Regional Transit
Southeast Vermont
6.22% 6.03% 0.00% 87.75%
Transit
Tri-Valley Transit 20.48% 42.28% 0.00% 37.23%
Rural Community
10.56% 65.91% 5.13% 18.41%
Transportation
Green Mountain
0.00% 56.31% 0.00% 43.69%
Community Network
Advance Transit 0.00% 1.22% 0.00% 98.78%
Tri-Valley Transit, which has similar annual vehicle revenue hours as GMT, also sees
demand-response as its most used mode of transportation (Office of Budget and Policy
2020). Their service area includes Addison, Orange, and northern Windsor counties.
A brief description of the routes and services offered by each rural public transportation
provider can be found in the Appendix.
Funding
Funding for the Vermont Agency of Transportation’s public transportation program is
provided by a combination of state and federal funding (“FY 2021 Transportation Program”
2020; Office of Budget and Policy 2020). In Vermont, federal funding accounts for about
85% of total revenues. The Vermont State Transportation Fund covers the remaining
percentage (“FY 2021 Transportation Program” 2020). Contributors to the Transportation
Fund include motor vehicle taxes, penalties and fees, gasoline taxes, sales and use taxes on
aviation jet fuel, and pilot and aircraft license fees (Transportation Fund 2019). For the 2021
fiscal year, the Vermont legislature has budgeted $41,234,820 for transit (“FY 2021
Transportation Program” 2020).
Funding for local providers is a mix of federal, state, and local funds, as well as farebox
revenue. Federal assistance to transit provides for the majority of operating expenses of
every local transit provider in Vermont. Passenger fares account for less than 3% of
operating expenses (see Figure 2). State and local sources have varying levels of
3
Source: Office of Budget and Policy 2020.
Page 10 of 48Rural Public Transportation and Maine: Review of State Best Practices
significance, depending on the transportation provider. Local funding ranges from 0% to
26.15% (7.16% of all rural operating expenses) and state funding ranges from 11.07% to
34.77% (27.69% of all rural operating expenses) in 2019 (Office of Budget and Policy 2020).
Figure 2: Funding Sources for Operating Expenses of Vermont Rural Transit Providers, 2019. Source: Office
of Budget and Policy 2020.
Marble Valley Regional Transit District
Green Mountain Community Network
Rural Community Transportation
Southeast Vermont Transit
Tri-Valley Trnasit
Advance Transit
$0 $1,500,000 $3,000,000 $4,500,000 $6,000,000
Fares Local Funds State Funds Federal Assistance Other Funds
Vermont Alternative Transportation and Pilot Programs
Go! Vermont
Go! Vermont is Vermont’s statewide transportation information clearinghouse. Their
mission is to help individuals save money, reduce their carbon footprint, and provide
mobility. Their website provides resources on public transportation, ferries, ridesharing,
train travel, and cycling, as well as information on working remotely and telecommuting.
For bus users, Go! Vermont provides real time bus tracking. Electric vehicle owners can use
Go! Vermont to find electric vehicle charging stations.
By joining Go! Vermont, users can earn rewards for utilizing green transit, as well as
qualifying for the Guaranteed Ride Home Benefit. To earn rewards, members track their
green trips, for which they earn points. For many commuters, one of the barriers to using
shared transit or alternative transportation is the fear of “getting stuck” if there were to be
an emergency. The Guaranteed Ride Home ensures a ride home for bus riders, carpoolers,
and vanpoolers. The Guaranteed Ride Home Benefit will reimburse individuals for their
travel costs, such as taking a taxi, up to $70 (“Guaranteed Ride Home Benefit” 2021).
Go! Vermont also has a trip planner. After entering starting and ending locations, the trip
planner shows users non-private car transportation options including carpool and vanpool
matches, public transit routes, bike routes, and walking routes. If there are carpool or
vanpool matches, registered Go! Vermont users can contact them to arrange a shared ride.
Page 11 of 48Rural Public Transportation and Maine: Review of State Best Practices
The trip planner also shows the locations of park and ride lots, bike shares, car shares, bike
paths, and electric vehicle charging stations.
Rides to Wellness Pilot Program
Access to transportation can be a barrier to receiving non-emergency medical care. Lack of
transportation causes patients to miss appointments or avoid scheduling appointments,
because they know they cannot get to the appointment (Lorber and Falbel 2018). Rides to
Wellness is a pilot program in Vermont, funded by a grant from the Federal Transit
Administration (FTA).
Rides to Wellness has three main goals:
A. To improve health outcomes for the vulnerable populations that use
community centers.
B. To reduce the use of emergency services, thereby saving additional resources.
C. To improve financial performance for health centers, hospitals and funding
programs (such as Medicaid) by reducing missed appointments. (Lorber and
Falbel 2018, 5).
This effort began in April 2017 and an implementation plan was established in April 2018.
This program started with two pilot sites, the Mount Ascutney region and St. Johnsbury,
and has since expanded to five sites (MacDonald 2020). Though initially funded with a
grant, each pilot site has committed to providing sustainable funding. Since April 2018,
about 1,000 trips have been provided through this program (MacDonald 2020)
Recovery and Job Access Rides Pilot Program
In spring of 2018, the Recovery Transportation Working Group was formed. They identified
access to support groups and meetings, recovery centers, drug testing sites, job training
and access, and medical appointments as critical needs. The working group estimated that
transit providers could provide 800-1,000 trips per month, with costs ranging from $17-$36
per trip. Assuming an average trip cost of $20-$25 and 1,000 trips per month, the program
cost would be between $20,000 to $25,000 per month (Baker et al. 2018). VTrans received a
grant for $170,000 to fund this program and cover gaps in service. Rural Community
Transportation and Marble Valley Regional Transit District also received $40,000 in federal
assistance, with a 50% match requirement (Vermont Agency of Transportation 2019).
Between September 2019 and April 2020, over 2,000 trips were provided (MacDonald 2020)
Lessons Learned
Consolidation of public transportation providers
The consolidation of rural public transportation providers can have many benefits. Cost
savings can be realized through economies of scale, resulting in better pricing for vehicles,
insurance, fuel, and supplies. Integration can lead to service improvements. Existing routes
can be modified to better fit customers’ needs, or service can be expanded into new areas.
Page 12 of 48Rural Public Transportation and Maine: Review of State Best Practices
Through consolidation, transit providers may be able to attain higher staff levels than they
could individually.
Since 2011, Vermont has seen several mergers between multiple public transportation
providers. Chittenden County Transportation Authority and Green Mountain Transit Agency
combined to form Green Mountain Transit. Starting in 2014 and formally completed in
2017, Stagecoach Transportation Services and Addison County Transit Resources merged
to become Tri-Valley Transit. In 2015, Connecticut River Transit was absorbed by Deerfield
Valley Transit, becoming Southeast Vermont Transit.
The State of Vermont supports the consolidation of public transportation agencies, as a
way to find cost savings (Monahan et al. 2017). VTrans provides technical assistance,
facilitates meetings, provides funding assistance, and can manage consolidation efforts, if
requested, to help with the transition.
The merger between Deerfield Valley Transit Association and Connecticut River Transit was
able to realize many benefits. With a larger staff, management and operational efficiency
increased. These efficiency increases gave time to review the bus routes and create service
improvements (Monahan et al. 2017). They have also benefited from economies of scale
when purchasing phone systems, insurance, and operating supplies. Though they have not
experienced significant cost savings due to improvements in service, operating expenses
per vehicle revenue mile in 2018 and 2019 were less than 2017 (Office of Budget and Policy
2020).
Cooperation between operators
Moving between service regions on public transportation usually requires transferring
from one operator to another. With cooperation between service providers, Vermont has
been able to improve the rider experience, by providing regional routes that extend
beyond any individual service area. Providers can maintain their autonomy and their own
fee structures, while operating a joint schedule.
There are currently four regional routes that are operating under a joint schedule, provided
by four of Vermont’s seven transit providers: The 116 Commuter travels between
Middlebury and Burlington; The Burlington/Middlebury LINK, the Rutland Connector (as
called by TVT), or the Middlebury Route; the Route 2 Commuter.
Feasibility of Microtransit
Starting in 2018, the Vermont Microtransit Working Group 4 began exploring the potential
for microtransit service as a substitute for some of the existing fixed-route and demand-
response services currently being offered (Microtransit Working Group 2019). In 2019,
VTrans, in conjunction with Via, conducted a microtransit feasibility study for the
4
The Microtransit Working Group consists of members from VTrans, Montpelier City Council, Green Mountain
Transit, the Sustainable Montpelier Coalition, Vermont Center for Independent Living, and the Central Vermont
Regional Planning Commission (Microtransit Working Group 2019).
Page 13 of 48Rural Public Transportation and Maine: Review of State Best Practices
Montpelier area. Via used historic ridership, land-use, demographic, and economic data,
input from community partners, quality of service assumptions, and information on street
layout and design to conduct their analysis. Different microtransit options, as well as
different levels of demand, were modeled (VIA 2019). Via’s recommendation, based on their
analysis, was the replacement of three fixed-routes and on-demand transportation for
non-emergency medical care, seniors and individuals with disabilities, and Medicaid
services with a fleet of 3-5 microtransit vehicles. They estimated that a fleet of five vehicles
could meet ridership needs of 35 trips per hour, which was greater than the current level of
ridership (27 trips per hour at peak hours) (VIA 2019). Via estimated wait times of less than
15 minutes for riders in the 7.8 square miles service zone, a significant reduction from the
current one hour bus wait times (VIA 2019). The feasibility study concluded that
microtransit in Montpelier can offer riders a higher quality of service than traditional fixed-
routes and demand-response services currently being offered.
Green Mountain Transit (GMT), Sustainable Montpelier Committee, and VTrans launched
Montpelier’s microtransit service, a two year pilot program called MyRide by GMT, on
January 4th, 2020 (White 2020). MyRide by GMT replaces three fixed-routes. The service
area currently includes most of Montpelier, as well as destinations in Berlin. Rides can be
scheduled either through the MyRide by GMT app, an internet browser, a GMT kiosk, or
through GMT’s call center.
Page 14 of 48Rural Public Transportation and Maine: Review of State Best Practices
New Hampshire
New Hampshire has ten local transportation providers. Service is concentrated in the
southern half of the state, where nine of the ten providers are located (New Hampshire
Department of Transportation
2019a). Public transportation
offerings include fixed-route,
deviated fixed-route, and
demand-response services. In
2019, ridership on public transit
was 3,309,109 one-way trips,
plus 45,684 rides for seniors
and individuals with disabilities.
The New Hampshire DOT
subsidizes Concord Coach’s
North Country routes. Riders
took 16,295 intercity bus trips
on those subsidized routes
(NHDOT 2019).
The level of ridership and
service varies widely depending
on the service provider. Wildcat
Transit, the University of New
Hampshire public
transportation system,
accounted for nearly a third of
unlinked passenger trips in
2019 (Office of Budget and
Policy 2020). Compared to
national peers, overall, the rural
providers in New Hampshire
provide significantly less
service, with the exception of
Advance Transit, the largest
rural provider (Steadman Hill
Consulting, Inc. et al. 2020). Figure 3: Public transportation in New Hampshire, May 2019.
North County Transit and Carroll County Transit are both provided
Advance Transit is based in the
by Tri-County Transit. Source: New Hampshire Department of
Upper Valley and provides
Transportation, 2019.
transportation in both New
Hampshire and Vermont. Their
higher service level is attributed to their relationship with Dartmouth College and
Dartmouth-Hitchcock Medical Center (Steadman Hill Consulting, Inc. et al. 2020). Sullivan
County Transportation and Tri-County CAP (including both North Country Transit and
Page 15 of 48Rural Public Transportation and Maine: Review of State Best Practices
Carroll County Transit) operate about 1/3 as much as their peers. Home Healthcare,
Hospice, and Community Services, in the Keene area, operates about 60% as much, and
Concord Area Transit operates about 70% as much (Steadman Hill Consulting, Inc. et al.
2020).
Table 3: New Hampshire summary of services provided in 2019.
Annual
Reporter Annual Vehicle Annual Vehicle
Transit Provider 5
Unlinked
Type Revenue Miles Revenue Hours
Trips
Wildcat Transit (University
Reduced 1,084,633 389,148 25,879
Transportation Services)
Rural General
Advance Transit 758,025 489,015 39,666
Public Transit
Nashua Transit System Full 462,549 612,037 44,800
COAST Full 427,023 813,335 53,488
Manchester Transit Authority Reduced 409,319 646,729 55,121
Belknap-Merrimack CAP/ Rural General
82,403 188,487 12,828
Concord Area Transit Public Transit
Tri-County CAP/North Country Rural General
47,268 190,793 23,134
Transit Public Transit
Home Healthcare, Hospice, and
Rural General
Community Services (Keene 42,599 136,096 9,606
Public Transit
City Express)
Sullivan County Transportation
Rural General
(Southwestern Community 21,829 85,653 6,049
Public Transit
Services Transportation)
CART Reduced 18,060 140,341 8,758
Tri-County CAP/ Carroll County Rural General
8,214 74,014 12,998
Transit Public Transit
Service mixes vary widely between rural transit providers. Trips with Advance Transit are
almost entirely bus trips (fixed-route or deviated fixed-route), while 100% of trips with
Carroll County Transit are demand-response. The other transit provider operating under
Tri-County CAP, North Country Transit, offers the second largest percentage of demand-
response trips. For the other rural providers, bus trips heavily outweigh demand-response
trips.
5
Advance Transit’s ridership only represents ridership in New Hampshire. Source Office of Budget and Policy 2020.
Page 16 of 48Rural Public Transportation and Maine: Review of State Best Practices
Table 4: Unlinked passenger trips by mode for rural transit providers in New Hampshire, 2019. Source:
Office of Budget and Policy 2020.
Demand-response
Transit Provider Bus Trips
Trips
Advance Transit 0.85% 99.15%
Belknap-Merrimack CAP/ Concord Area
8.85% 91.15%
Transit
Tri-County CAP/North Country Transit 52.31% 47.69%
Home Healthcare, Hospice, and
29.03% 70.97%
Community Services (Keene City Express)
Sullivan County Transportation
(Southwestern Community Services 10.69% 89.31%
Transportation)
Tri-County CAP/ Carroll County Transit 100.00% 0.00%
A brief description of the rural transportation providers and their routes and services can
be found the Appendix.
Funding
In the 2020 fiscal year, the State of New Hampshire spent $6,213,174 on public
transportation and they have budgeted $16,013,127 for the 2021 fiscal year (State of New
Hampshire 2021). However, state funding is a minor contributor in the funding mix of rural
transportation providers. In 2019, state funding covered 6% of the operating expenses of
rural transit operators in New Hampshire (Office of Budget and Policy 2020). Federal
assistance is the main funding source for rural providers (Figure 4). In 2019, they covered
52.27% of operating expenses. Farebox revenue plays a small role, covering 4.91% of
operating expenses. 6 Local funding covers 13.52% of operating expenses. Due to Advance
Transit’s close ties with local community organizations, "other” sources cover nearly a
quarter of operating expenses. If Advance Transit is excluded, other sources provide much
less, just over 6.5%.
6
Both Advance Transit and Concord Area Transit received no state funding towards their operating expenses in
2019 (Office of Budget and Policy 2020).
Page 17 of 48Rural Public Transportation and Maine: Review of State Best Practices
Figure 4: Funding Sources for Operating Expenses of New Hampshire Rural Transit Providers, 2019.
Source: Office of Budget and Policy 2020.
Sullivan County Transportation
Tri-County CAP, Inc./North Country Transit
Tri-County CAP, Inc./Carroll County Transit
Belknap-Merrimack CAP/Concord Area Transit
VNA Home Healthcare, Hospice& Community Service
Advance Transit
$0 $1,000,000 $2,000,000 $3,000,000
Fares Local Funds State Funds Federal Assistance Other Funds
Lessons Learned
Volunteer drivers play an important role in rural transit but cannot be the entire solution.
Volunteer drivers provide critical access to medical care, shopping services, social activities,
and more. Volunteer drivers often help fill transit gaps, providing access when none would
have been provided otherwise. Especially in rural areas, volunteer drivers are often the
lowest cost mode of transportation (Steadman Hill Consulting, Inc. et al. 2020; Zhao 2017).
In New Hampshire, only 33 out of 244 communities have regular public transit service.
However, volunteer driver programs operate in 197 out of 244 towns (New Hampshire
Department of Transportation 2019b). They provide 65,000 trips/year, many of which
would not have happened without the volunteer drivers. These trips, as important as they
are, only provide 4% of the total estimated transportation needs for seniors and individuals
with disabilities (New Hampshire Department of Transportation 2019b). 7 All New
Hampshire transit regions report being unable to meet all of the demand for volunteer
driving. To manage, they have been prioritizing medical trips, but realize that they are not
meeting all of their riders’ needs (such as trips for social activities) (Steadman Hill
Consulting, Inc. et al. 2020). The Statewide Strategic Transit Study recommends the
expansion of volunteer driver program capacity, while also acknowledging the shortage of
volunteer drivers and the inability to meet current levels of demand (Steadman Hill
Consulting, Inc. et al. 2020).
7
The Community Transportation Association of America (CTAA) estimated that seniors and other transit-dependent
people in New Hampshire required 1.9 million trips to meet basic life needs (New Hampshire Department of
Transportation 2019b).
Page 18 of 48Rural Public Transportation and Maine: Review of State Best Practices
State partnerships with intercity transportation providers can expand access for riders
New Hampshire’s North Country region spans over 3,000 square miles, three counties, 50
municipalities, and 25 Unincorporated Places (North Country Council 2021). In this vast
area live just over 90,000 people (North Country Council 2021). Transportation from the
northern part of the state to the southern is essential for access to medical care,
employment opportunities, and social/recreation activities. Concord Coach Lines provides
this connection, offering service from Littleton and Berlin, just north of the White Mountain
National Forest, to Concord, the state capital. Riders can continue to travel from Concord
down to Boston.
This service is made possible due to a partnership between Concord Coach Lines and the
New Hampshire DOT. Concord Coach Lines receives an annual subsidy of about $300,000
for the operation of this service, about 60% of the total cost for the routes (Steadman Hill
Consulting, Inc. et al. 2020). Without this partnership, this service would not be
economically feasible (Brooks 2019).
Page 19 of 48Rural Public Transportation and Maine: Review of State Best Practices
North Dakota
North Dakota has 35 public transit providers in its 53 counties (North Dakota Department
of Transportation 2019). Of these providers, 30 provide service solely in tribal and rural
areas. In 2019, five providers did not receive any federal funding, and thus, are not
included in the National Transit Database (Office of Budget and Policy 2020).8 Rural and
tribal transit operators provide fixed-route, deviated fixed-route, and demand-response
service. Demand-response service is by far the most commonly provided service; 23 out of
25 providers only offer demand-response service.
A brief description of the rural and tribal transportation providers can be found in the
Appendix.
Table 5: Summary of North Dakota rural and tribal transit providers, 2019. The City of Minot and the
Turtle Mountain Band of Chippewa Indians are the only providers with bus service.
Annual Annual Vehicle Annual Vehicle
Transit Operator 9 Reporter Type
Unlinked Trips Revenue Miles Revenue Hours
South Central Adult
Rural General 103,575 733,890 43,463
Services
City of Minot Rural General 94,738 155,967 10,851
Souris Basin Transit Rural General 86,434 476,006 33,634
James River Senior
Rural General 55,250 169,090 15,779
Citizens Center
Stark County Council on
Rural General 37,840 165,005 16,459
Aging/Elder Care
West River Transit Rural General 33,251 191,999 19,045
Devils Lake Transit
(Senior Meals and Rural General 26,628 53,204 8,464
Services)
Williston Council for the
Rural General 25,807 122,153 11,010
Aging
Hazen Busing Project Rural General 21,967 32,970 5,234
Standing Rock Public
Tribal Reporter 18,944 228,319 9,030
Transportation
Southwest
Rural General 11,946 98,380 6,249
Transportation Services
8
Only providers that report to the National Transit Database are included in this report.
9
Source: Office of Budget and Policy 2020.
Page 20 of 48Rural Public Transportation and Maine: Review of State Best Practices
Annual Annual Vehicle Annual Vehicle
Transit Operator 9 Reporter Type
Unlinked Trips Revenue Miles Revenue Hours
Kenmare Wheels and
Rural General 11,891 10,816 1,698
Meals
Nutrition United Rural General 11,420 222,710 7,862
Spirit Lake Tribe Tribal Reporter 11,216 177,190 9,069
Cavalier County Senior
Rural General 7,380 43,471 3,264
Meals and Services
Pembina County Meals
Rural General 7,007 111,261 5,563
and Transportation
Kidder-Emmons County
Rural General 5,271 42,710 1,675
Senior Services
Can-Do Transportation Rural General 4,995 36,899 3,114
Turtle Mountain Band of
Tribal Reporter 4,890 101,197 6,220
Chippewa Indians
Walsh County
Rural General 4,829 46,669 2,786
Transportation Program
Nelson County Council on
Rural General 4,438 47,042 1,956
Aging
Dickey County Senior
Rural General 4,246 8,906 1,756
Citizens
Golden Valley/Billings
Rural General 3,235 88,221 3,217
County Council on Aging
Wildrose Public
Rural General 2,379 34,966 1,682
Transportation
Benson County
Rural General 1,649 51,523 1,720
Transportation
Funding
In North Dakota funding for public transportation comes from the Highway Tax Distribution Fund
(“Legislative Appropriations 2019-2021 Biennium” 2017). Revenues from this fund come from
the motor vehicle fuel tax, special fuel taxes, and motor vehicle registration fees. The first $5.5
million in the Highway Tax Distribution Fund are transferred to the State Highway Fund. After
that, the Public Transportation Fund receives 1.5% of the revenues to the Highway Tax
Distribution Fund (Highway Tax Distribution Fund - State Treasurer to Make Allocation to State,
Counties, and Cities n.d.) Funds are disbursed in accordance with the guidelines set by the state
legislature (Distribution of Funds - Continuing Appropriation n.d.)
Page 21 of 48Rural Public Transportation and Maine: Review of State Best Practices
In 2019, the state of North Dakota covered 22.82% of the operating expenses for rural and tribal
transit providers. 10 Federal funding accounts for 52.53% of expenses. Fares and local
governments contribute similar amounts, 10.53% and 11.89%, respectively. Other sources
contribute 2.23%. The relative importance of each funding source varies by transit provider, as
seen in Figure 5.
Figure 5: Operating funding sources of North Dakota rural and tribal transit providers, 2019. Source:
Office of Budget and Policy 2020.
Spirit Lake Tribe
Turtle Mountain Band of Chippewa Indians
Standing Rock Public Transportation
Wildrose Public Transportation
City of Minot
Souris Basing Transit
Walsh County Transportation Program
Hazen Busing Project
Golden Valley/Billings County Council on Aging
Southwest Transportation Services
Can-Do Transportation
Nelson County Council on Aging
Benson County Transportation
West River Transit
Cavalier County Senior Meals & Services
Kidder-Emmons County Senior Services
Kenmare Wheels & Meals
Williston Council for the Aging
Nutrition United
Dickey County Senior Citizens
Pembina County Meals and Transportation
South Central Adult Services
James River Senior Citizens Center
Devils Lake Transit (senior Meals & Services)
Stark County Council on Aging/Elder Care
$0 $250,000 $500,000 $750,000 $1,000,000 $1,250,000 $1,500,000
Fares Local Funds State Funds Federal Assistance Other Funds
Highly Rural Veteran Transportation Grant
The Highly Rural Veteran Transportation Grant program gives grant funding to Veterans
Service Organizations and State Veterans Service Agencies for the transportation of
veterans to medical care in eligible counties (U.S. Department of Veterans Affairs 2021).
“Highly rural” is defined as a county or counties with population density of less than seven
people per square mile (U.S. Department of Veterans Affairs 2015). The North Dakota
Department of Veterans Affairs, in conjunction with the North Dakota DOT, has contracted
existing transit operators to provide this service. 36 out of 53 counties in North Dakota are
eligible (North Dakota Department of Veterans Affairs 2016). In Maine, Piscataquis County
10
This does not include transit providers who do not report to the National Transit Database.
Page 22 of 48Rural Public Transportation and Maine: Review of State Best Practices
is the only eligible county and provides transportation to clinics in Bangor and Lincoln (U.S.
Department of Veterans Affairs 2021). If the definition of “highly rural” is expanded, this
grant program may be able to help meet the transit needs of Maine’s veterans.
Lessons Learned
Flexibility for workers
Given the highly rural nature of North Dakota, the vast majority of transit providers only
offer demand-response service. Two transit providers in North Dakota have taken
innovative approaches to make their services more attractive to workers.
Kenmare Wheels and Meals provides service seven days a week. However, they do not
regularly offer transportation services in the evenings (Mattson and Hough 2015). For many
workers who rely on public transportation, this creates a barrier for employment. Kenmare
Transit has implemented a “work transit” service. Employees can schedule rides to and
from work outside of regular service hours, by special arrangement with Kenmare Transit
(Kenmare Wheels & Meals 2020).
Having to schedule daily rides to and from work can be burdensome. James River Senior
Citizens Center has created a service to reduce this burden. They have created a monthly
master list of riders’ work-related transit needs (James River Public Transit 2021). Riders fill
out a monthly calendar with their pick-up times and these are then scheduled by the main
office (James River Public Transit 2021). This simple process greatly reduces the daily tasks
that would have previously been required to schedule work-related transportation.
Page 23 of 48Rural Public Transportation and Maine: Review of State Best Practices
Maine
Maine has eight transit regions (see Figure 6). Each region has one designated regional
transportation provider. In addition to the designated regional providers, Maine DOT
partners with other public transportation systems across the state (Multimodal Planning
Division 2019). In total, there are 16 local public transportation providers seven of which
are rural. A summary of their ridership in 2019 can be found in Table 6. A brief summary of
the rural transit providers can be found in the Appendix.
Figure 6: Maine transit regions. Source: Bureau of
Maintenance and Operations, 2018.
Page 24 of 48Rural Public Transportation and Maine: Review of State Best Practices
Table 6: Summary of services provided by Maine rural transit providers, 2019.
Annual Vehicle
Annual Annual Vehicle
Provider 11 Revenue
Unlinked Trips Revenue Miles
Hours
Downeast Transportation 671,879 701,870 44,002
Kennebec Valley
173,878 1,150,653 75,183
Community Action Program
Waldo Community Action
Partners d/b/a Mid-Coast 86,212 1,319,555 62,150
Public Transportation
Aroostook Regional
61,804 299,133 18,281
Transportation System
Downeast Community
48,871 1,023,984 46,511
Partners
City of Bath 11,769 39,054 3,075
West's Transportation 8,097 83,171 3,660
Comparison with Peer States
Through the aggregation of service metrics for rural transportation providers, Maine can be
compared against its peer states. Vermont is the largest service provider, by far (see Table
7). In 2019, they had about three times the annual vehicle revenue miles as Maine. Riders
in Vermont took about double the trips that riders in Maine took. That being said, Maine is
the second largest service provider, outpacing both New Hampshire and North Dakota.
Due to North Dakota’s highly rural nature and reliance on demand-response service, it had
more vehicle revenue miles and hours than New Hampshire, despite having about a third
fewer passenger trips.
11
Source: Office of Budget and Policy 2020.
Page 25 of 48Rural Public Transportation and Maine: Review of State Best Practices
Table 7: Aggregation of service metrics for rural transportation providers by state, 2019. Source: Office of
Budget and Policy 2020.
Annual Vehicle Annual Vehicle
Annual
State 12 Revenue Miles Revenue Hours
Unlinked Trips
(VRM) (VRH)
Vermont 2,136,227 14,727,801 568,572
New Hampshire 960,338 1,164,058 104,281
North Dakota 601,226 3,450,564 230,800
Maine 1,062,510 4,617,420 252,862
Given the service levels, it should be unsurprising that Vermont greatly outspends New
Hampshire, North Dakota, and Maine when it comes to the operating expenses of rural
transit providers (see Table 8). Interestingly, other funding sources, a combination of
advertising revenue, contract stop, and funds from other agencies, cover almost half of the
operating expenses of rural transit providers in Maine, a far larger percentage than any of
the peer states. Local funding sources are also a larger contributor in Maine than in the
other states, covering almost a quarter of the operating expenses. Rural providers in Maine
receive the least federal assistance, both in terms of absolute and relative values.
Table 8: Funding sources for operating expenses of rural transit providers by state, 2019.
Federal
State 13 Fares Local Funds State Funds Other Funds Total
Assistance
$443,560 $1,849,562 $7,152,124 $15,927,587 $457,571 $25,830,404
Vermont
1.72% 7.16% 27.69% 61.66% 1.77%
$297,310 $819,322 $364,893 $3,167,172 $1,410,480 $6,059,177
New Hampshire
4.91% 13.52% 6.02% 52.27% 23.28%
$1,183,284 $1,335,581 $2,564,221 $5,901,160 $250,321 $11,234,567
North Dakota
10.53% 11.89% 22.82% 52.53% 2.23%
$457,088 $3,203,701 $920,090 $2,394,795 $6,066,360 $13,042,034
Maine
3.50% 24.56% 7.06% 18.36% 46.51%
Comparing absolute operating expenses does not account for the number of passenger
trips, vehicle hours, or vehicle miles. In Table 9, below, the operating expense per unlinked
passenger trip is broken down by funding sources. For Maine, the operating expense per
unlinked passenger trip is $12.27, the second highest. However, the amount of federal
assistance per unlinked passenger trip is the lowest, at $2.25, and the contribution of local
funds is the highest, $3.02. In comparison, Vermont, with an operating expense per
12
Source: Office of Budget and Policy 2020.
13
Source: Office of Budget and Policy 2020.
Page 26 of 48You can also read