Corruption in Croatia: BRIBERY AS EXPERIENCED BY THE POPULATION - Co-fi nanced by the European Commission
←
→
Page content transcription
If your browser does not render page correctly, please read the page content below
Vienna International Centre, PO Box 500, 1400 Vienna, Austria
Tel.: (+43-1) 26060-0, Fax: (+43-1) 26060-5866, www.unodc.org

                                                                Corruption in Croatia:
                                                                      BRIBERY AS EXPERIENCED
                                                                           BY THE POPULATION

                                                                        Co-financed by the
                                                                        European Commission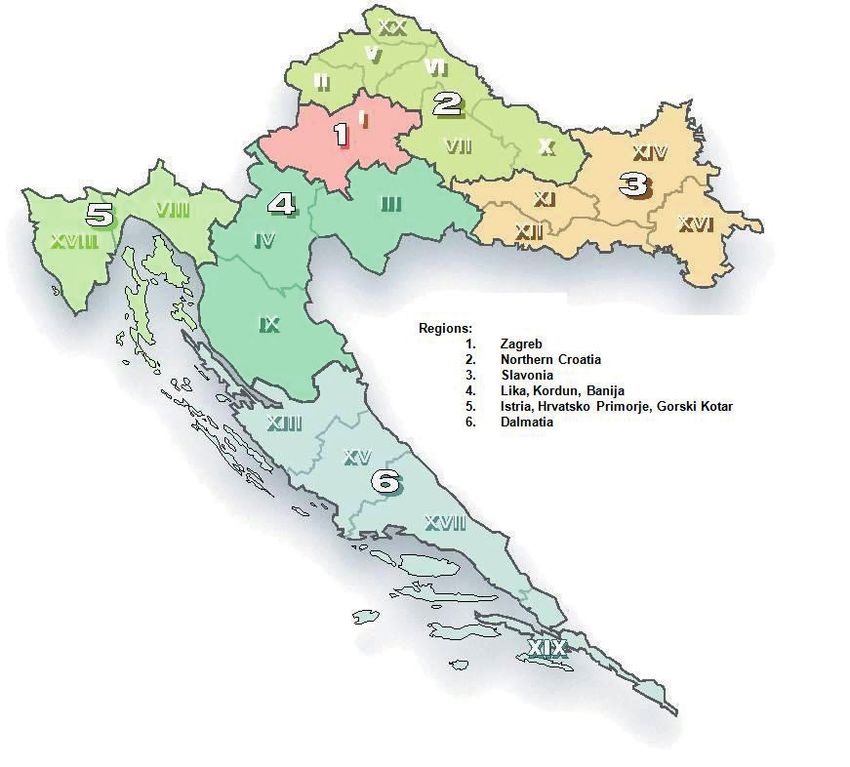
UNITED NATIONS OFFICE ON DRUGS AND CRIME
                 Vienna

    CORRUPTION IN CROATIA:
 BRIBERY AS EXPERIENCED BY THE POPULATION
Copyright © 2011, United Nations Office on Drugs and Crime Acknowledgments This report was prepared by UNODC Statistics and Surveys Section (SASS) and Institute of Economics, Zagreb (EIZ): Field research and data analysis: Jelena Budak (EIZ) Edo Rajh (EIZ) Research supervision and report preparation: Enrico Bisogno (SASS) Felix Reiterer (SASS) Michael Jandl (SASS) Serena Favarin (SASS) Philip Davis (SASS) Design and layout: Suzanne Kunnen (STAS) Drafting and editing: Jonathan Gibbons Supervision: Sandeep Chawla (Director, Division of Policy Analysis and Public Affairs) Angela Me (Chief, SASS) The precious contribution of Milva Ekonomi for the development of survey methodology is gratefully acknowledged. This survey was conducted and this report prepared with the financial support of the European Commission and the Government of Norway. Sincere thanks are expressed to Roberta Cortese (European Commission) for her continued support. Disclaimers This report has not been formally edited. The contents of this publication do not necessarily reflect the views or policies of UNODC or contributory organizations and neither do they imply any endorsement. The designations employed and the presentation of material in this publication do not imply the expression of any opinion on the part of UNODC concerning the legal status of any country, territory or city or its authorities, or concerning the delimitation of its frontiers or boundaries. Photos: The pictures are used for illustration only and were not taken in the context of corruption. © OSCE
CONTENTS
Contents ................................................................................................................. 1
Executive summary................................................................................................. 3
Key findings ............................................................................................................ 7
Introduction............................................................................................................ 9
      International legal instruments and national policies ...................................................... 9
      The complexity of corruption.......................................................................................... 10
      The importance of studying direct experience ............................................................... 10
      Previous studies conducted in Croatia............................................................................ 10
      The scope and methodology of this study ...................................................................... 11

1. Prevalence of bribery ........................................................................................ 13
2. Nature of bribes ................................................................................................ 17
      Forms of payment ........................................................................................................... 17
      Bribe‐seeking modality and timing ................................................................................. 19
      Purposes of bribes........................................................................................................... 21
      Large bribes ..................................................................................................................... 21

3. Public officials and bribery ................................................................................ 23
4. Reporting of bribery.......................................................................................... 29
5. Other forms of corruption................................................................................. 31
      Public sector recruitment................................................................................................ 31
      Vote‐buying at recent elections ...................................................................................... 32

                                                                                                                                        1
CORRUPTION IN CROATIA: BRIBERY AS EXPERIENCED BY THE POPULATION
6. Vulnerabilities to bribery .................................................................................. 35
7. Perceptions and opinions about corruption ...................................................... 37
8. Prevalence and patterns of other forms of crime .............................................. 43
Reporting of crime........................................................................................................... 47
Perceptions of safety from crime.................................................................................... 47
9. Concluding remarks .......................................................................................... 51
10. Methodological annex..................................................................................... 53
11. Statistical annex.............................................................................................. 55
2EXECUTIVE SUMMARY
Corruption is often reported in the international community to be an area of vulnerability for
the countries of the western Balkans and it appears that the people of Croatia would tend to
agree. Results presented in this report show that Croatian citizens rank corruption as the most
important problem facing their country after unemployment and the performance of the
Government.
Corruption comes in many guises and, in contrast to other surveys that look at people’s
perceptions, this survey focuses on the actual experience of administrative corruption and
provides information on the nature of bribery and its procedures. This is the kind of petty
corruption that affects the daily lives of ordinary people in their dealings with the public
administration, the service provider which plays so huge a role in contemporary society that a
remarkable nine out of ten adult Croatians interact with it at some point during the course of
the year.
Such dealings may be for anything from a medical visit or school enrolment to the issue of a
new passport or driving licence but, according to the results of this survey, a significant
amount of them are of the dubious variety. Although there are notable variations between the
Croatian regions, on average, 18.2 per cent of Croatian citizens aged 18 to 64 have either
direct or indirect exposure to a bribery experience with a public official on a yearly basis. But
when focusing on bribes actually paid, the percentage of Croatian citizens who pay at least
one bribe in that period – among those who have contacts with the public administration – is
11.2 per cent, and those who pay at least one bribe in that period actually do so once every
three months. The highest prevalence of bribery is observed in the Zagreb and Dalmatia
regions, while in Istria, Hrvatsko primorje and Gorski kotar it is below the national average.
The face of corruption is all too familiar but the one seen in Croatia has slightly different
features than in other parts of the globe. For example, the global tendency is for corruption to
be mainly an urban phenomenon, yet in Croatia, as in many other western Balkan countries, it
is almost as prevalent in rural areas as in urban areas (11% vs. 11.3%). And while, as to be
expected, more Croatian men pay bribes than Croatian women, despite established gender
roles that assign more home-based activities to women, the difference between the sexes is
not that marked (13.1% and 10%, respectively).
3CORRUPTION IN CROATIA: BRIBERY AS EXPERIENCED BY THE POPULATION Croatian women are evidently no strangers to corruption but they go about the bribery business in a slightly different manner to their male counterparts. They are more likely to pay a bribe in kind – in the shape of food and drink, for example – while men are more likely to use money. Cash accounts for almost a half (44%) of all bribes in Croatia and, although this type of corruption is petty, the sums paid are far from trivial: the average bribe paid being 2,050 HRK, or the equivalent of approximately 280 Euro1. Such cash payments are substantial, bearing in mind the per capita incomes of many Croatians, but it would be wrong to assume that people are always coerced into paying them. More than half of bribes paid (58%) are actually offered by citizens themselves, while in almost 40 per cent of cases they are paid in response to a direct or indirect request by a public official. This shows the lack of faith some Croatian citizens have in the ability of the public administration to function without the payment of some kind of kickback for facilitating bureaucratic procedures. And the existence of deficiencies and bottlenecks in the public sector is confirmed by the fact that more than a third of citizens (35%) who participate in a bribery act do so to speed up a procedure, while almost one in five (18%) does so to receive better treatment. Such a need for better treatment no doubt explains why the public officials paid most kickbacks in Croatia are doctors. More than half (56%) of citizens who pay bribes pay them to doctors, more than a third to nurses (36%) while 30 per cent pay police officers. The latter mainly being paid for the avoidance of a fine or the reduction of the amount fined. The picture painted in this survey is sometimes a troubling one, but data indicate that there is some resistance to bribery and Croatian citizens do not always consent to the payment of bribes in order to facilitate or benefit from a particular administrative procedure: one in four refuses to do so, turning down the request made by a public official. On the other hand, only a negligible amount of bribe-payers (less than 2%) report their experience to the authorities. There are numerous reasons for this: some citizens do not deem bribery to be of the same gravity as “real” crimes, in part because there is a sense of acceptance that bribery is simply a common practice (17%) and also, when constituting an expression of gratitude for services rendered, actually a positive practice (24%). Citizens also fail to report bribery events because bribe payment can, of course, be of direct benefit to the bribe-payer (26%), and because they believe reporting to be a futile exercise as nothing would be done, nor would anyone care (24%). Interestingly, for almost one in three bribe-payers (29%) this survey interview was the first time they had admitted to the payment of a bribe, having never previously shared the experience with anybody, even close friends or relatives. It seems that when it comes to bribery a well-established and selective code of silence still exists in many cases. Bribery not only affects the services provided to citizens by public officials. The public administration is the largest employer in Croatia and its associated job security and accompanying benefits are highly coveted. Some 18 per cent of Croatian citizens, or members of their households, applied for a job in the public sector in the three years prior to the survey, but of those whose application was successful one in six (16%) admits to paying some money, giving a gift or doing a favour to help secure their position. Among those who failed, there is a widespread perception that factors such as cronyism, nepotism or bribery played a decisive role in the recruitment process, while only 16 per cent believe that the selection was made on merit. Certain malpractices may also have played some kind of role in the most recent elections held in Croatia. Data show that an average of 4 per cent of citizens at the last local elections and 3 1 Amounts in Croatian Kunar are converted into Euro by using the annual average exchange rate published by Eurostat. For international comparisons, amounts in national currency should be converted by using Purchasing Power Parities (PPP): when using conversion rates in PPP, as published by Eurostat, 2,050 HRK are equivalent to approximately 410 EUR-PPP. 4
CORRUPTION IN CROATIA: BRIBERY AS EXPERIENCED BY THE POPULATION

per cent at the last parliamentary or presidential elections were asked to vote for a certain
candidate or political party in exchange for a concrete offer of money, goods or a favour.
While Croatian men in their thirties are those most exposed to bribery, characteristics such as
income, education level or employment status do not appear to have a clear effect on the
probability of experiencing bribery. For instance, although the prevalence of bribery increases
slightly with income level, its frequency does exactly the opposite and the average number of
bribes paid is actually higher among lower income groups than wealthier citizens, with no
social group being exempt from bribery.
Nor, of course, is any social group exempt from the possibility of falling victim to the other
five crime types examined in this survey, yet the prevalence rates for personal theft,
assault/threat, burglary, robbery and car theft in Croatia are considerably lower than for
bribery (3.6%, 3.4%, 1.6%, 0.9% and 0.2%, respectively). These are quite modest levels, on a
par with those evidenced in other European countries, which probably explains why Croatian
citizens feel rather safe in relation to crime. Eight out of ten of them feel safe when walking
alone after dark and an even larger majority citizens feel fairly secure in their homes and
neighbourhoods.
But perceptions about corruption in Croatia are not so positive. Some two thirds of the
population believe that corrupt practices occur often or very often in a number of important
public institutions, including central and local government, parliament, hospitals, judiciary
and the police. Almost half of Croatian citizens (47%) believe that corruption is actually on
the rise in their country, 44 per cent believe it to be stable and a further 9 per cent think it is
decreasing. Perceptions, it should be underlined, are nothing more than opinions and are not
to be confused with the actual experience of corruption that provides the main focus of this
report. Nevertheless, such a perception can be interpreted as an expression of citizens’
awareness of one of the principal challenges facing Croatia, both now and in the years to
come.

                                                                                                      5
KEY FINDINGS
Croatian citizens rank corruption as the third most important problem facing their country
today, after unemployment and the performance of the Government.
Nine out of ten Croatian citizens interact with the public administration at some point
during the course of the year.
In the 12 months prior to this survey, 18 per cent of Croatian citizens had either a direct
or indirect exposure to a bribery experience with a public official.
The bribery prevalence rate among citizens who had contact with public officials in that
period is 11 per cent.
There are no significant differences in the prevalence of bribery in urban and rural areas
of Croatia.
The highest prevalence of bribery is observed in the Zagreb and Dalmatia regions, while
in Istria, Hrvatsko primorje and Gorski kotar it is below the national average.
One in ten Croatian women participates in bribery, as opposed to 13 per cent of Croatian
men.
Everyone who reports the payment of at least one bribe, on average, actually pays four
bribes or the equivalent of one bribe every three months.
Almost half (44%) of bribes are paid in cash, more than a third (37%) as food and drink.
The average cash bribe paid in Croatia is 2,050 HRK, or the equivalent of approximately
280 Euro.
In more than half (58%) of bribery incidents, Croatian citizens initiate the payment,
whereas one in twelve (8%) is explicitly requested to pay a bribe.
The main purposes of paying bribes in Croatia are to speed up a procedure (35%) or to
receive better treatment (18%).
7CORRUPTION IN CROATIA: BRIBERY AS EXPERIENCED BY THE POPULATION
Croatian citizens tend to use bribes in contacts with police and car registration officers to
avoid the payment of a fine or reduce the amount fined.
More than half of all bribe-payers in Croatia pay kickbacks to doctors (56%), more than a
third to nurses (36%).
Of those citizens refusing to pay bribes, one in four (25%) refuses to pay police officers
and almost one in five (19%) refuses to pay doctors.
Only 2 per cent of citizens with corruption experience report the incident. Citizens do not
report corruption experiences because they receive extra benefits (26%) or because they
give bribes voluntarily as a sign of gratitude (24%).
Croatian citizens lack reasons for reporting corruption. More than half think that people
who report corruption are likely to regret it, and nothing constructive will come of
reporting it.
Perceptions of widespread corruption in the public sector are backed up the experience of
the 16 per cent of those who, in the three years prior to this survey, secured a job in the
public administration with the help of a bribe.
The offer of goods, favours and money to attract voters was evidenced during the last
local and national elections: 4 per cent of citizens were approached at local elections and
3 per cent at the last parliamentary or presidential elections.
Corruption has a higher prevalence rate than other crimes such as theft, burglary, robbery
and assault. This is in line with the rather low crime rate in Croatia, where citizens feel
safe at home after dark and do not use advanced security systems to protect their homes.
8INTRODUCTION
Corruption remains an issue for countries all over the world. Socio-economic development,
the institutional and political setting, or the prevailing social and cultural norms are all
elements that can shape it in very different manners, but corruption is still a scourge from
which no country is truly exempt and it is often reported to be an area of vulnerability for the
countries of the western Balkans, including Croatia. Indeed, the citizens of Croatia perceive
corruption to be a major problem: the results presented in this report show that they rank
corruption as the most important problem facing their country after unemployment and the
performance of the Government.
International legal instruments and national policies
In the last decade, awareness of corruption has increased in Croatia and it has become an
important priority in the political agenda of the country. Successive Croatian governments
have committed themselves to fighting corruption and key steps have been taken to address
the issue, in part because of commitments deriving from the European Union accession
process and the subsequent need to adapt national legislation to the acquis communautaire.
Important instruments in the upgrading of the legislative framework for the fight against
corruption are represented by the ratification of two Council of Europe conventions – the
Criminal Law Convention against Corruption (2000) and the Civil Law Convention against
Corruption (2003). In 2005, Croatia also became party to the United Nations Convention
against Corruption (UNCAC), a consequence of which is the Implementation Review
Mechanism, established in 2009 to enable all parties to review their implementation of
UNCAC provisions through a peer review process. One of the objectives of this mechanism is
to encourage a participatory and nationally driven process towards anti-corruption reform and
it is noteworthy that Croatia will be reviewed in the first wave (2010-2011).
Furthermore, the legal framework of national legislation for combating corruption has been
incorporated into the existing criminal legislation and relevant legislation has been adopted
regarding public access to information, financing political parties and the election of judges.
The Law on Conflict of Interest has been amended in relation to appointments to supervisory
boards of state-owned companies and to strengthening the verification of the declaration of
assets by public officials.
9CORRUPTION IN CROATIA: BRIBERY AS EXPERIENCED BY THE POPULATION At the same time, Croatia has strengthened its institutional and administrative capacity for preventing, investigating and prosecuting corruption. The Office for Combating Corruption and Organized Crime (USKOK) was established in 2001, while a National Anti-corruption Programme and Anti-corruption Action Plan were first adopted in 2002 and then reviewed in 2008, the Action Plan undergoing a further revision in March 2010. In recent years, USKOK’s mandate has been reinforced, both in terms of areas of competence (for example, it was given authority on tax fraud cases linked to corruption) and its investigative prerogatives. Such steps testify the commitment of the Croatian authorities to fight corruption in a fair and effective manner. The complexity of corruption Corruption can occur at different levels. A distinction is usually drawn between grand and administrative (petty) corruption, with the former referring to corrupt practices affecting legislative process and policymakers, and the latter referring to dealings between civil servants and the public. In either case, it has a devastating impact on the rule of law, hinders equal access to public services, affects public trust in state institutions and is a hurdle to economic and social development, especially in young democracies. Corruption is a complex crime with blurred boundaries making it often difficult to distinguish between culprit and victim. It is not necessarily a one-dimensional transaction in which an active perpetrator coerces a passive party: both sides may benefit, and the victim might be a third party or the community at large. Moreover, there are cultural and social factors that can further cloud the issue. The giving of gifts, for example, whether as a “thank you” or bureaucratic lubricant, may be considered acceptable in one culture yet unethical in another. The importance of studying direct experience In this context, comprehensive assessments of corruption can greatly assist governments in better tailoring policies and enhancing the capabilities of anti-corruption bodies. At the same time, it is widely accepted that the collection of empirical data in this area represents a real challenge because of the complex and covert nature of corruption. These difficulties are sometimes circumvented by focusing on perceptions about corruption, rather than on actual experience of it. Perception-based indicators, while useful for raising awareness about the issue of corruption and helping to advocate policy measures for addressing it, fail to provide clear indications as to the extent of corruption and vulnerable areas. Increasing concerns are also expressed about the validity of methods used to build perception-based indicators. In recent years, tools for collecting information on direct experiences of corruption have been developed: sample surveys can produce important indicators about the extent and nature of corrupt practices. More importantly, the wealth of information gathered can shed light on the modalities of corruption and the sectors, positions and administrative procedures more at risk. Promoted by a variety of international organizations, national institutions, non-governmental organizations (NGOs) and development agencies, a number of such surveys have been conducted in several countries around the world, including Croatia and the western Balkan region, thus proving the feasibility and relevance of this approach. Previous studies conducted in Croatia One example is the study conducted by Transparency International Croatia in 2003 and 20052, focusing on the perception of corruption among the population, in which corruption in Croatia was perceived to be on the increase: in 2003, 85.9 per cent of the population considered corruption to be spread or widespread; in 2005 more than 89 per cent shared that opinion. 2 Transparency International Croatia, Corruption and Public Information, Attitudes, and Lessons Learned GfK-Centre for Market Research, Survey, May 2003, May 2005, www.transparency.hr 10
CORRUPTION IN CROATIA: BRIBERY AS EXPERIENCED BY THE POPULATION

And corruption was perceived to be recurrent in various sectors of the public administration,
primarily in the judiciary, health and local government (figure 1).

Figure 1:         Percentage of population perceiving corruption to be recurrent in selected
                  sectors, 2003 and 2005

               90%

               80%                                                                                                                            2003
               70%                                                                                                                            2005

               60%

               50%

               40%

               30%

               20%

               10%

                0%
                         Judiciary

                                                                                                                                      Elementary

                                                                                                                                                   Church
                                                                                                   Government

                                                                                                                Universities

                                                                                                                               Army
                                              government;
                                     Health

                                                                                   Privatisation
                                                                      Parliament
                                                            Police

                                                                                                                                      secondary
                                                                       Croatian
                                                Counties;

                                                                                       Fund

                                                                                                                                         and
                                                  Local

 Source: Transparency International Croatia www.transparency.hr, Corruption and Public Information, Attitudes, and Lessons
                          Learned GfK-Centre for Market Research, Survey, May 2003, May 2005.

The Croatian population’s concern about corruption was confirmed by further research
conducted in 2010 by the Croatian Ministry of Justice3. According to the results of that
survey, public opinion perceives corruption to be a major problem, to the extent that corrupt
politicians, judges and civil servants are identified as the main threats to society. The survey
also explored the direct experience of bribery by the population, in the form of the percentage
of citizens reporting a payment made by themselves or a member of their households to
selected public officials in the previous 12 months, among those who actually had a contact
with selected officials in the same period. According to that indicator, the highest values were
recorded for hospital personnel (17.7%), traffic police officers (13.3%), the personnel of the
government inspectorate for consumer protection (10%) and customs officers (6.1%).
The scope and methodology of this study
Following a bilateral agreement between the European Commission and the Croatian
Government, UNODC provided its support in conducting this large-scale survey on
corruption, with the Institute of Economics, Zagreb acting as the national partner for
implementing the survey and research activities. The main objective of this survey was to
examine actual experience of administrative corruption in Croatia: the research probed the
prevailing types and modalities of corruption that affect citizens’ daily lives, with particular
focus on bribery4, a practice that, in accordance with the United Nations Convention against
Corruption, is a criminal offence. Additional topics covered in the surveys include reporting

3
  Research results: Perception of Corruption in Croatia (2010). Strengthening Anti-Corruption Inter-Agency Cooperation –
Awareness Raising Campaign, Ministry of Justice, 2010, http://www.pravosudje.hr/fgs.axd?id=1332
4
  Bribery is defined as (a) the promise, offering or giving to a public official, directly or indirectly, of an undue advantage, for the
official himself or herself or another person or entity, in order that the official act or refrain from acting in the exercise of his or
her official duties and (b) as the solicitation or acceptance by a public official, directly or indirectly of an undue advantage, for
the official himself or herself or another person or entity, in order that the official act or refrain from acting in the exercise of his
or her official duties.

                                                                                                                                                            11
CORRUPTION IN CROATIA: BRIBERY AS EXPERIENCED BY THE POPULATION
of corruption to the authorities, citizens’ opinions about corruption and integrity, and the
experience, as victims, of other forms of crime. In order to collect this information, in 2010, a
sample survey was conducted via face to face interviews with a nationally representative
sample of 3005 Croatian citizens aged 18 to 64, selected randomly in each region of the
country.
Map 1: Regional coverage of the Survey
Note: Numbers I to XX denote counties in Croatia
This report contains the analysis of the data collected in that survey. Its goal is not to rank the
different regions of the country or any selected sector or ministry on a corruption scale, but
rather to provide analytical knowledge about a complex phenomenon, both at a national and
sub-national level. To fight corruption effectively it is necessary to understand its many facets
since there is no simple “one-size-fits-all” solution to the problem. It is believed that the
evidence-based information presented in this report will provide the authorities of Croatia
with an additional tool for developing well-targeted anti-corruption policies. Information that
can also be made use of in the peer review process of the UNCAC Implementation Review
Mechanism, as well as represent a benchmark for measuring future progress in the fight
against corruption.
121. PREVALENCE OF BRIBERY
The public sector plays a major role in contemporary society. Whether for a medical visit,
school and university enrolment or the issue of an ID card, to name but a few examples,
citizens and households depend on its services for a huge variety of reasons. The fact that nine
out of ten adult Croatians reported having at least one contact with a public official in the 12
months prior to this survey shows just how substantial that role actually is.
The demand made on the system is clear but when it comes to integrity in the provision and
use of its services the picture that emerges is a somewhat cloudy one. One important finding
of this survey is that a considerable number of Croatian citizens (510,000, equivalent to
18.2% of adult population aged 18 to 64) had either direct or indirect exposure to a bribery
experience with a public official in the 12-month period in question. As figure 2 shows, this
number represents the sum of three different groups: the percentage of citizens who actually
paid money, gave a gift or counter favour to a public official; the percentage of those
requested to pay a bribe by a public official but refused to do so; and the percentage of those
who shared a household with someone who did pay a bribe.
Figure 2: Direct and indirect exposure of adult population in Croatia to bribery in the 12
months prior to the survey, (2010)
9.7%
2.5% % who personally paid a bribe
6.1%
% who were asked to pay a bribe but
refused
% with household member who paid
a bribe
% with no exposure to bribery
81.7%
13CORRUPTION IN CROATIA: BRIBERY AS EXPERIENCED BY THE POPULATION
The data in figure 2 show that bribery is still a significant issue in the lives of many citizens
of Croatia. At the same time, it is encouraging to note that there is a significant portion of
Croatians capable of saying “no”, thus refusing to pay the kickback requested by a public
official. Data show that for every four citizens who pay a bribe to a public official during the
course of the year, there is one who turns down such a request.
When focusing on bribes actually paid, the prevalence of bribery is calculated as the number
of citizens who, in the 12 months prior to the survey, gave a public official some money, a
gift or counter favour on at least one occasion, as a percentage of citizens who had at least one
contact with a public official. As such, the average prevalence of bribery in Croatia is 11.2 per
cent at a national level, though there is quite considerable fluctuation in the prevalence rate
throughout the different Croatian regions (figure 3).
Figure 3: Prevalence of bribery and average number of bribes paid by region, Croatia
(2010)
14% 7
Average number of bribes paid
12% 6
Prevalence of bribery
10% 5
8% 4
6% 3
4% 2
2% 1
0% 0
Croatia
Slavonia
Dalmatia
Hr. Primorje,
Zagreb
National
Gorski Kotar
Kordun,
average
North
Banija
Lika,
Istria,
Prevalence of bribery Average number of bribes paid
Note: Prevalence of bribery is calculated as the number of adult citizens (aged 18-64) who gave a public official some money, a
gift or counter favour on at least one occasion in the 12 months prior to the survey, as a percentage of adult citizens who had at
least one contact with a public official in the same period. The average number of bribes refers to average number of bribes
given by all bribe-payers, i.e. those who paid at least one bribe in the 12 months prior to the survey.
Figure 4: Prevalence of bribery and average number of bribes paid, by sex and
urban/rural areas, Croatia (2010)
14% 14
Average number of bribes paid
12% 12
Prevalence of bribery
10% 10
8% 8
6% 6
4% 4
2% 2
0% 0
Urban Rural Male Female
Prevalence of bribery
Average number of bribes paid
Note: Prevalence of bribery is calculated as the number of adult citizens (age 18-64) who gave a public official some money, a
gift or counter favour on at least one occasion in the 12 months prior to the survey, as a percentage of adult citizens who had at
least one contact with a public official in the same period. The average number of bribes refers to average number of bribes
given by all bribe-payers, i.e. those who paid at least one bribe in the 12 months prior to the survey.
14CORRUPTION IN CROATIA: BRIBERY AS EXPERIENCED BY THE POPULATION
For example, the prevalence rate is somewhat higher than the national average in the Zagreb
(14%) and Dalmatia (13%) regions, whereas it is considerably lower in the Istria, Primorje
and Gorski Kotar regions (6%) (figure 3). Although there are no significant differences in the
prevalence of bribery in urban (11.3%) and rural (11%) sub-populations on a national level
(figure 4), some variations on a regional level can be delineated. Thus, in the less developed
Lika, Kordun and Banovina regions, the prevalence of bribery in rural areas is double that in
local urban settlements.
Also in Lika, Kordun and Banovina, twice as many men (16%) as women (8%) participate in
bribery, while there is also a considerable disparity between the sexes in Zagreb (17% of men
10% of women). On a national level, however, 13 per cent of the adult male population
participates in bribery, as opposed to 10 per cent of females (figure 4). The difference is not
that remarkable, showing that in spite of perceived gender roles, which assign men greater
responsibility for dealing with the public administration and activities outside the home in
general, women undertake administrative procedures to a similar extent and are no strangers
to bribery.
Nevertheless, it is misleading to consider the prevalence rate alone when evaluating the extent
of bribery in any given country. To get a fairer impression, the frequency of bribe paying
should also be taken into consideration since, while almost one third of bribe-payers in
Croatia give bribes on only one occasion, two thirds of them do so on multiple occasions. On
average, bribe-payers in Croatia pay two public officials on two different occasions, thus
everyone who reported the payment of at least one bribe had to pay four bribes or the
equivalent of one bribe every three months. As figure 4 shows, the highest frequency is in the
Zagreb region, whereas the lowest is in Dalmatia.
Croatians clearly have to pay bribes on a fairly regular basis. Not only does the public
administration play a significant role in their lives, bribery does too.
152. NATURE OF BRIBES
Payments to public officials come in several shapes and sizes and are made for different
reasons in diverse contexts. Money or gifts, for example, may be explicitly requested by
public officials for the completion of a procedure or offered by a citizen to facilitate a service
or simply express gratitude for a service rendered. In this chapter, a number of payment
characteristics are presented in order to shed some light on what is clearly a complex
question.
Forms of payment
In Croatia, 44 per cent of bribes are paid in cash (figure 5), while 38 per cent are given in the
shape of food and drink. Considerably lower down the scale come valuables (7%), other
goods (6%) and the exchange of another service (5%). A large proportion of bribes take a
form that can be interpreted as a barter – either explicit or implicit – between two parties in
which each one of them both gives and receives something in the exchange. But it should be
stressed that in most cases the two parties are not on an equal footing, with one of them (the
public official) usually being in a position of strength from a negotiating perspective.
Figure 5: Percentage distribution of bribes paid by type of payment, Croatia (2010)
50%
45%
40%
35%
30%
25%
20%
15%
10%
5%
0%
Exchange
Valuables
goods
Other
remember
Cash
Food
services
Don't
Note: Data refer to the last bribe paid by each bribe-payer in the 12 months prior to the survey. The sum is higher than 100 per
cent since, in some cases, bribes are paid in more than one form (for example, cash and valuables)
17CORRUPTION IN CROATIA: BRIBERY AS EXPERIENCED BY THE POPULATION
There are, however, some noteworthy fluctuations in these rates throughout the different
Croatian regions. A higher percentage of residents of Lika, Kordun, Banovina (62%),
Dalmatia (55%) and Istria, Primorje and Gorski Kotar (54%), for example, pay money. The
giving of food is more prevalent among residents of the agricultural regions of North Croatia
(51%) and Slavonia (48%). On a national level, the latter is also more prevalent among
women (41%), than among men (38%), who use money more readily to pay bribes (49%)
than women do (35%).
When focusing on bribes paid in cash (figure 6), the results of this survey show that one third
of all bribes are for amounts smaller than 500 HRK (approx 70 Euro5), less than 30 per cent
of all bribes paid are in the 500-1,500 HRK range, one quarter are higher than 1,500 HRK
(approximately 200 Euro) and, interestingly, almost one in ten bribes paid in cash are for
amounts larger than 5,000 HRK (680 Euro). While not quite “grand corruption” these are
certainly very considerable amounts for the households involved. About 13 percent of the
population who paid their last bribe in cash were not willing to disclose the amount paid.
Figure 6: Percentage distribution of bribes paid in cash by amount paid (in Kuna),
Croatia (2010)
< 500kn
500 to 1,499kn
1,500 to 4,999kn
5,000 to 9,999kn
10,000kn +
Refusal
0% 5% 10% 15% 20% 25% 30% 35%
Taking into account all bribes paid in cash, the average bribe amounts to 2,050 HRK, or the
equivalent of approximately 280 Euro; a figure that corresponds to almost one third of the
average Croatian monthly salary in 2010. As table 1 shows, the largest average amounts are
paid in Dalmatia (3,500 HRK), while the smallest are paid in Lika, Kordun, Banovina (820
HRK) and Istria, Primorje, and Gorski Kotar (1,230 HRK).
Table 1: Average amount of bribes paid in cash (in HRK, Euro and EUR‐PPP) by region,
Croatia (2010)
Regions
Istria, National
Lika,
Average North Primorje, average
Zagreb Slavonia Kordun, Dalmatia
bribe Croatia Gorski
Banija
Kotar
HRK 1,839 1,575 2,274 822 1,229 3,497 2,052
Euro 251 215 310 112 167 476 280
EUR-
367 314 454 164 245 698 410
PPP
5
Croatian national currency is Kuna (kn or HRK). Euro/HRK average exchange rate in 2010: 1 Euro = 7.3 HRK
18CORRUPTION IN CROATIA: BRIBERY AS EXPERIENCED BY THE POPULATION
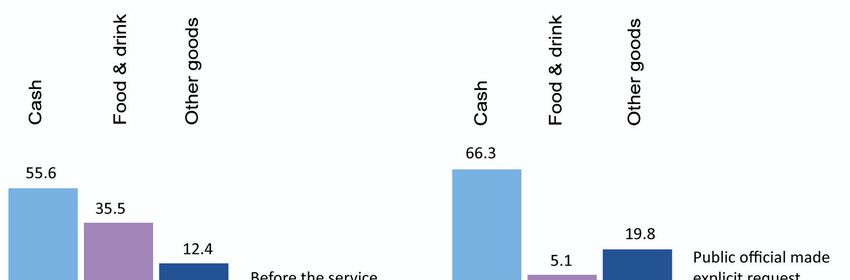
Bribe‐seeking modality and timing
In contacts with public officials resulting in a payment of money or gifts, it is noteworthy that
in more than half of cases (58%) payment is offered by citizens themselves, whereas in
almost 40 per cent of cases payment is actually made following a request. However, in only 8
per cent of cases that request is made explicitly by the public official, while in almost 28 per
cent of cases the public official makes the citizen understand implicitly that a kickback is
necessary. Add to this the other 4 per cent of cases who receive the request through a third
person intermediary (figure 7) and the complexity of corruptive practices can be seen.
Figure 7: Percentage distribution of bribes paid by modality of bribe request/offer,
Croatia (2010)
60%
50%
40%
30%
20%
10%
0%
Citizen Public Public Third party Don`t
made offer official official made remember
made made explicit
implicit explicit request
request request
Note: Data refer to the last bribe paid by each bribe-payer in the 12 months prior to the survey.
The timing of a bribe payment can also shed light on the motivation behind it, in particular as
to whether it is made to facilitate a specific service or as a “thank you” for the successful
completion of the procedure. Data show that every fifth bribe is paid after the service (21%),
virtually every fourth bribe is paid at the same time that the service is provided (24%) and
almost half of all bribes are given before the service is actually carried out (figure 8).
Figure 8: Percentage distribution of bribes paid by timing of payment in relation to
service delivery, Croatia (2010)
1.4%
21.4%
43.8%
9.5%
23.9%
Before the service At the same time
Partly before/partly after After the service
Don`t remember
Note: Data refer to the last bribe paid by each bribe-payer in the 12 months prior to the survey.
19CORRUPTION IN CROATIA: BRIBERY AS EXPERIENCED BY THE POPULATION
As shown in figure 9, cash is more often used than food when payment is made before the
service is delivered, or when it is made at the same time as the service is provided (56% and
47%, respectively), while the giving of food and drink is more prevalent when the
“transaction” is made after the service, or partly before and partly after the service (46% and
26% of cases, respectively).
Figure 9 also shows that cash is most often used when bribes are paid to a public official in
response to a request from a third person (83%). Money is also a very common form of
kickback when an explicit request has been made (66%) or when citizens are made to
understand implicitly that a bribe is expected (63%). On the other hand, when a citizen makes
an offer without being previously requested to do so, food is the most common form of
payment (51%), while cash is given in slightly less than 30 per cent of such cases.
Figure 9: Percentage distribution of bribes paid by type of payment and respectively, by
timing of bribe payment in relation to service delivery and by modality of
bribe request/offer, Croatia (2010)
Note: Data refer to the last bribe paid by each bribe-payer in the 12 months prior to the survey. The sum is higher than 100 per
cent since, in some cases, bribes are paid in more than one form (for example, cash and valuables)
The data seem to point to the fact that, in a significant number of cases (when the offer is
made by citizens and when the bribe is given after the service), citizens provide public
officials with food items as a sign of gratitude for services rendered. But the picture is never
20CORRUPTION IN CROATIA: BRIBERY AS EXPERIENCED BY THE POPULATION
as clear as it first appears: when looking at the size of bribes paid in cash, the average bribe is
more than 2,440 HRK (330 Euros) in those cases where it is voluntarily offered by a citizen,
compared to an average payment of 1630 HRK (220 Euros) when the request is made by an
official. Given their high monetary value, spontaneous offers should not be seen as a mere
sign of gratitude, but rather as having a specific goal, often related to special treatment.
Furthermore, bribes paid in cash before a procedure are, on average, considerably larger
(2900 HRK or 395 Euros ) than those paid after the service (1645 HRK or 224 Euros).
Purposes of bribes
In every procedure bribes may be used for different purposes. People may, for example, give
bribes in relation to the identity card or passport issuing procedure in order to speed up the
procedure, reduce the official fee, receive information or get better treatment. Different
purposes of bribes given, irrespective of the procedure for which they apply, are shown in
figure 10.
Figure 10: Percentage distribution of bribes paid, by purpose of payment, Croatia (2010)
Speed up procedure
Receive better treatment
Avoid payment of fine
Receive information
Finalization of procedure
Reduce cost of procedure
Avoid other problems
No specific purpose
0% 5% 10% 15% 20% 25% 30% 35% 40%
Note: Data refer to the last bribe paid by each bribe-payer in the 12 months prior to the survey.
More than a third of Croatian citizens who get involved in a bribery act do so to speed up a
procedure (35%), while almost one in five do so to receive better treatment (18%). Together
with the third most common purpose – the receipt of information (13%) – these data indicate
that bribery is often used to overcome deficiencies and weaknesses in public service delivery.
Large bribes
Large amounts (more than 5,000 Kuna) paid by Croatian citizens are mostly related to
personal and family issues (87%) and medical visits (59%). The majority of large bribes are
paid before the service (79%) and to speed up the procedure to which they are related (62%).
One third of them are requested by a third party, more than a quarter are paid because the
citizen is made to understand a payment is desired and another quarter are paid voluntarily.
Only about 10 per cent of large bribes are explicitly requested by public officials who receive
the bribe; of which 79 per cent are male.
213. PUBLIC OFFICIALS AND BRIBERY
Just as bribery may be employed for diverse purposes in varying guises and different
contexts, not all sectors of the public administration in Croatia are affected by corruption to
the same extent. There are certain types of public official that seek bribes more frequently
than others, while there are certain procedures and situations in which beneficiaries of public
services are more prone to making offers to public officials in order to reduce red tape and
finalize proceedings.
According to the experience of citizens who paid at least one bribe in the 12 months prior to
the survey, the public officials who receive most kickbacks in Croatia are doctors (56% of
citizens with recent corruption experience give bribes to doctors), nurses (36%), police
officers (30%) and car registration officers (14%) (figure 11). Other types of public officials
receive a smaller percentage of bribes, ranging from municipal elected representatives (2%) to
public utilities officers (7%).
Figure 11: Percentage distribution of bribe‐payers who paid to selected types of public
officials, Croatia (2010)
Doctors
Nurses
Police officers
Car registration officers
Public utilities officers
Custom officers
Social protection officers
Municipal officers
Tax officers
Teachers/Lecturers
Judges/Prosecutors
Land registry officers
Municipal elected representatives
0% 10% 20% 30% 40% 50% 60%
Note: The sum is higher than 100 per cent since bribe-payers could have made payments to more than one public official in the
12 months prior to the survey.
23CORRUPTION IN CROATIA: BRIBERY AS EXPERIENCED BY THE POPULATION
The size of Croatian communities can also have an impact on the type of official involved in
acts of bribery. For example, more citizens from urban than from rural areas pay bribes to
police officers (33% vs. 25%) and car registration officers (16% vs. 10%), who sometimes
receive kickbacks from vehicles owners to facilitate the successful outcome of technical
inspections. Meanwhile, doctors and nurses are more often recipients of kickbacks or gifts in
rural areas than in urban areas: 60 per cent and 41 per cent of bribe-payers in rural areas make
at least one such payment to doctors and nurses, respectively, in comparison with 53 per cent
and 34 per cent in urban areas.
To some extent, it is unsurprising that public officials with a high level of interaction with the
public also receive the highest number of bribes. However, there are some positions in the
public administration, such as in the judiciary or customs service, where the frequency of
interaction with citizens is certainly more limited but where bribery experiences are still a
recurrent problem. For this reason, it is useful to analyse not only which types of officials
account for the greatest numbers of bribe receipts but also the probability of a particular type
of official receiving a bribe when he or she is contacted – independently from the frequency
of interactions. To measure this, the number of citizens who paid a bribe to a selected type of
public official is compared with the number of citizens who had contacts with that type of
official in the 12 months prior to the survey. Figure 12 shows bribery prevalence rates
calculated as the percentage of people who paid a bribe to a selected type of public official
over those who had a contact with the same type of public official.
Figure 12: Prevalence of bribery for selected types of public officials receiving the bribe,
Croatia (2010)
Doctors
Police officers
Nurses
Judges/Prosecutors
Custom officers
Car registration officers
Municipal officers
Land registry officers
Tax officers
Public utilities officers
Social protection officers
Teachers/Lecturers
Municipal elected representatives
0% 1% 2% 3% 4% 5% 6% 7% 8% 9%
Note: Prevalence of bribery is calculated as the number of adult citizens (aged 18-64) who gave a public official some money, a
gift or counter favour on at least one occasion in the 12 months prior to the survey, as a percentage of adult citizens who had at
least one contact with a public official in the same period. In this chart prevalence of bribery is computed separately for each
type of public official.
This indicator shows that the highest average prevalence rates are recorded for doctors (8%),
police officers (7%) and nurses (6%). Moreover, a relatively high value is registered for
judges/prosecutors and customs officers, indicating that they also request the payment of
bribes with a certain frequency from the citizens with whom they deal. The values presented
in figure 12 are also particularly relevant for identifying occupations where the risk of bribery
is higher.
24CORRUPTION IN CROATIA: BRIBERY AS EXPERIENCED BY THE POPULATION
Figure 13: Average number of bribes paid to selected public officials, Croatia (2010)
Car registration officers
Nurses
Doctors
Judges/Prosecutors
Municipal officers
Police officers
Land registry officers
Tax officers
Custom officers
Public utilities officers
Social protection officers
Teachers/Lecturers
0.0 0.5 1.0 1.5 2.0 2.5 3.0
Note: The average number of bribes refers to average number of bribes given by all bribepayers, i.e. those who paid at least one
bribe in the 12 months prior to the survey.
Another important indicator of the extent of bribery among selected public officials is the
frequency of payments. Figure 13 shows the average number of bribes given by bribe-payers
to selected public officials, with teachers, for example, receiving one bribe from each bribe-
payer and nurses and car registration officers receiving two and a half.
The analysis of data relating to the last incident when a citizen paid a bribe reveals that
different types of public official are paid kickbacks for quite different reasons (see figure 14).
For example, police offers are given bribes to avoid or reduce payments of fines, while
doctors and nurses are given money or gifts to reduce waiting times or to receive better
treatment, both crucial aspects in the use of health services and facilities. Bribes to car
registration officers are, on the whole, also paid to accelerate or finalize an otherwise lengthy
or complex procedure. This shows that not only do the numerous administrative procedures
and services carried out in the public sector have different features, they also have weaknesses
for which bribery is often used as a remedy. The precise analysis and resolution of any such
deficiencies and failings would no doubt represent a powerful preventative measure against
corruption.
Modalities of bribe-paying to different types of public official also show the diverse nature of
payments made to them (see figure 15). In the case of doctors and nurses, for example, bribes
are voluntarily offered by citizens in the majority of cases, but payments to nurses are
generally in kind (food or other goods) while those to doctors are more often in cash (43% of
cases, as opposed to 13% of bribes paid in cash to nurses). Bribes are often paid in cash to
police and car registration officers, too, but the amounts involved can vary to a considerable
extent.
It should be noted, however, that Croatian citizens do not always agree to the payment of
bribes in order to facilitate or benefit from a particular administrative procedure. As shown in
chapter 1, for every four citizens who pay a bribe there is one who refuses to do so and turns
down the request made by a public official. Figure 16 shows that police officers and doctors
are two types of civil servant whose bribery requests are often declined: among those citizens
who turn down bribe requests, 25 per cent have been personally asked to pay a bribe by a
police officer, 19 per cent by a doctor and 8 per cent by a judge/prosecutor.
25CORRUPTION IN CROATIA: BRIBERY AS EXPERIENCED BY THE POPULATION
Figure 14: Percentage of bribes paid to Figure 15: Three indicators for bribes
selected types of public paid to selected types of
officials by purpose of public officials:
payment, Croatia (2010) percentage of bribes paid
in cash, of bribes offered
by citizens; and of bribes
paid after service
delivery, Croatia (2010)
Note: Data refer to the last bribe paid by each bribe-payer in the 12 months prior to the survey.
26CORRUPTION IN CROATIA: BRIBERY AS EXPERIENCED BY THE POPULATION
Figure 16: Percentage distribution of adult population refusing payment of bribe in the
12 months prior to the survey by type of public official requesting the bribe,
Croatia (2010)
Police officers
Doctors
Judges/Prosecutors
Social protection agency officers
Nurses
Teachers/Lecturers
Municipal officers
Land registry officers
Tax officers
Municipal elected representatives
Custom s officers
Public utilities officers
Car registration officers
0% 5% 10% 15% 20% 25% 30%
274. REPORTING OF BRIBERY
In general terms, the extent to which a crime is reported to the authorities by its victims is
directly proportional to the combined effect of three factors: the perceived gravity of the
crime experienced; faith in the authorities’ resolve to identify the culprits; and the immediate
benefit the victim can draw from reporting the crime (events covered by insurance, for
example).
In the case of bribery, it appears that none of the above factors is currently playing a role in
Croatia. According to the results of this survey, a mere 2 per cent of bribe-payers report their
experience to the authorities. An important share of those who pay a bribe perceive it as a
positive practice (24% say it is only a sign of gratitude) or simply as a common practice
(17%); another quarter say that they actually receive a direct benefit from paying the bribe so
there would be no point in reporting it. An equal proportion of bribe-payers candidly admit
that reporting would be pointless as nobody would do anything about it. Furthermore, data
show that factors such as the fear of reprisals or insufficient knowledge and awareness of the
authorities responsible for processing citizens’ complaints cannot be considered important
motivations for explaining the low reporting rate (figure 17).
Figure 17: Percentage distribution of bribe‐payers not reporting their personal bribery
experience to authorities according to the most important reason for not
reporting, Croatia (2010)
Benefit received from the bribe
It was a sign of gratitude
It was pointless nobody would care
It w as a common practice
Fear of reprisals
Don`t know to whom to report
Other reason
0% 5% 10% 15% 20% 25% 30%
Note: Data refer to bribe-payers who did not report their last bribe paid in the 12 months prior to the survey to
authorities/institutions.
29CORRUPTION IN CROATIA: BRIBERY AS EXPERIENCED BY THE POPULATION
Bribery experience may not usually be reported to the authorities but bribe-payers do share
their experiences with people they know. About 70 per cent of citizens with bribery
experience discuss it with friends or family but such talk does not go beyond the group of
immediate acquaintances and only fractional numbers of bribe-payers discuss the bribe paid
with individuals or groups who may subsequently spread the word, such as NGOs or
journalists.
But for a considerable proportion of bribe-payers (29%) this survey interview was the very
first time they had admitted to the payment of a bribe, meaning that they had never previously
shared the experience with anybody, not even close friends or relatives. When it comes to
bribery, a well established and selective code of silence evidently still exists in many cases.
Figure 18: Percentage distribution of adult population according to institutions indicated
for future reports of bribery incidents, Croatia (2010)
3.9% 1.0% Police
10.2%
Prosecutor
30.8%
Supervisor to the official
10.4%
Anti‐corruption body
Journalist/media
10.6%
Don't know
17.1% Anti‐corruption NGO
15.9%
Ombudsm an
As stated above, very few citizens resort to the authorities to disclose their experience; but
when they do they usually go to the police, the local prosecutor, the anti-corruption agency or,
in a few cases, to ombudsmen. A similar picture is obtained when citizens are asked which
agency/official they would address in future if they had to report a bribery experience. As
figure 18 shows, almost a third (31%) would approach the police or the local prosecutor
(17%), while another 16 per cent would report the episode to the supervisor of the corrupt
public official in question, an option currently used on extremely rare occasions.
30You can also read