R CT O - Shift Research Lab
←
→
Page content transcription
If your browser does not render page correctly, please read the page content below
I M PA
                   RS                  C
            TO                             T
     C

                                           IN
    FA

                                               G
                                               ITY
   HO
    US

                                               IL
           N
                                           B
               G                           A
        I

                     AFFO           RD

EXPLORING COLORADO'S HOUSING AFFORDABILITY
    CHALLENGES IN ALL OF THEIR COMPLEXITY

   Conducted by Shift Research Lab in partnership with
                 Phyllis Resnick, PhD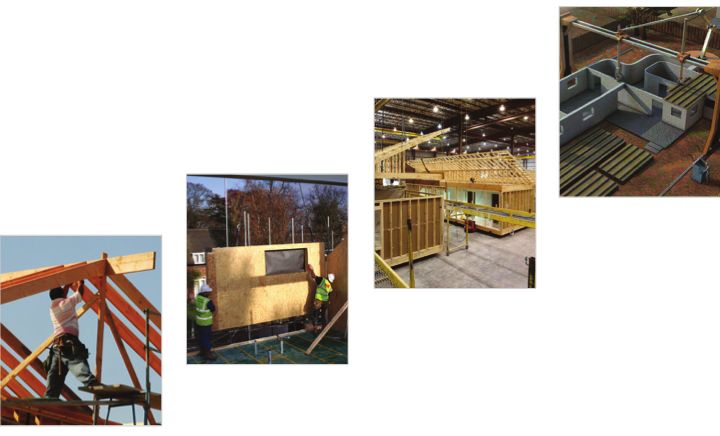
Executive
Summary
  Exploring Colorado's Housing Affordability Challenges in All of Their Complexity

Authored by
Jennifer Newcomer
of Shift Research Lab
and Phyllis Resnick, PhD

                                                                       2018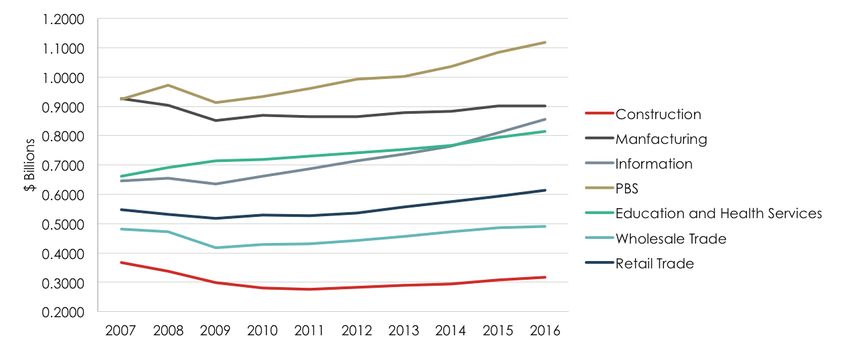
I M PA
              RS            C

                                           Executive
  T       O

                            TI
 C

                                NG
FA

                                    ITY
HOU

                                IL
                                           Summary
 SI

      N                         B
                                A
          G
              AFFORD

                      B ACKGR O U N D

               Colorado’s housing affordability challenge is first and foremost one of supply. Prior to the Great
               Recession, there were more housing units in the seven-county Denver metro region than households.
               But, since the recession, the region has added households at an annual rate that has far outstripped that
               of housing units, consuming the surplus of housing units. As a result, demand has outstripped supply for
               nearly a decade and housing prices have risen in excess of wages, causing housing to become
               increasingly unaffordable for many Coloradans.

               We forecast excess demand to persist, even with record levels of building permit activity. Under these
               circumstances, only significant increases in housing supply will stabilize price; incremental reductions in
               the cost structure of development will accrue to developer profit and do little to ameliorate price pressure.

               And, everyone should care about this affordability challenge. Housing cost-stressed households impact
               all Coloradans through the negative effects on business, public tax bases, health and education.

               Housing Affordability: Why it matters to all Coloradans
  According to a recent Colorado Mesa University poll, housing affordability is the biggest issue facing Coloradans.
  And it is not solely a Denver issue. “Statewide, 14 percent of respondents said housing/real estate was the biggest
  issue facing their community, while 10 percent said the economy was the most important problem. 9 percent of
  respondents listed crime/drugs/violence, 7 percent said education, and 6 percent said government was the biggest
  issue facing their community.”1

  With housing representing, on average, 35 percent of spending for households earning $50,000 or less, housing
  unaffordability is becoming the most significant threat to family economic security in Colorado. Currently, 50 percent of
  Colorado renter households are cost burdened, with housing commanding more than 30 percent of total household income.
  Eighty-five percent of these cost-burdened households have annual household incomes of $50,000 or less.

                    COM POS I T I O N O F M A J O R H O U SE H O LD E X P E N DITURE S ( H H S E A RN IN G LE S S TH A N $50,000)

                       HO
                                U S I NG           SPORTATI O              FOOD                          ALTHCARE                 CL
                                                                                                                                       OTH I NG
                                            RA
                                               N                                                    HE
                                                            N
                                           T

                                35%                 18%                     14%                            9%                           3%

 Source: US Bureau of Labor Statistics, Consumer Expenditure Survey 2016

 ¹http://www.thedenverchannel.com/news/local-news/poll-coloradans-rank-housing-economy-as-biggest-issues-facing-their-communities, accessed 1/22/18
But it was not always this acute. Between 2001 and the onset of the Great Recession, wages in Colorado kept pace with
housing costs in both the rental and ownership markets. With the recovery from the Great Recession, housing costs diverged
upward from wages. Since 2011, Colorado wages are up 11.4 percent while Denver metro rents are up 46.2 percent and the
Denver Case-Shiller index of housing prices is up 48.7 percent.
WAG E S VS H O U SIN G ( P R ICE & RE N T) - A N N UA L GROWTH
14.0%
12.0%
10.0%
8.0%
6.0%
4.0%
2.0%
0.0%
-2.0%
-4.0%
-6.0%
2001 2002 2003 2004 2005 2006 2007 2008 2009 2010 2011 2012 2013 2014 2015
Percent Growth: Case-Shiller Percent Growth: Average Annual Metro Rent Percent Growth: Average Weekly Wage
Sources: S&P Case-Shiller Colorado (Denver) Home Price Index, US Bureau of Labor Statistics Quarterly Census of Employment and Wages (Colorado), Apartment
Association Metro Denver Rent Survey
The cost burden of housing is an issue for every Coloradan, even households that are not directly affected. Annually,
Colorado’s cost-burdened households earning less than $50,000 annually are spending an additional $2 billion over the 30
percent standard to support their housing. That represents $2 billion that is not spent elsewhere on food, clothing, health
care, recreation and other household expenditures. These expenditures could support local businesses, and many would be
taxable and contributing to the provision of state and local services.
But the impacts are not limited to foregone expenditures. Colorado’s service sector will find it increasingly difficult to maintain
a workforce in this housing environment, threatening the viability of many of these businesses. Churn of student enrollment in
Colorado’s public schools, partially due to the community instability that results from high percentages of cost-burdened
households, has shown to adversely affect all student performance and development. And, research has associated the
overcrowding that often occurs in cost-burdened households with greater risk of injury, higher rates of infection, increased
incidences of depression, and other childhood development problems², placing additional pressure on health care and social
service systems.
The trends are not favorable. Our previous work on family economic security shows the state losing jobs paying middle-class
wages, with the hollowing of that middle more to low-wage than high-wage jobs. Between 2001 and 2015, the share of
middle-wage jobs in Colorado fell from 68.9 percent to 63.4 percent. As a result, the state experienced an increase in the
share of high-wage jobs of 1.7 percentage points but also an increase in the share of low-wage jobs of 3.4 percentage points.
To the extent Colorado is losing middle-wage jobs, it is losing them disproportionally and at twice the rate to low-paying jobs.
Yet the new housing being built is disproportionally targeted to the high-income jobs highlighted in economic development
announcements without recognizing that each of the additional high-paying jobs creates lower-paying service jobs at a
greater than one-to-one ratio. If these trends continue with no changes, even more families will become housing cost
burdened. It is in this context that we decided to look more deeply at the multiple, interconnected factors contributing to
housing unaffordability in Colorado.
²Maciag, Mike. No Room in the City. Governing. November 2015.
EXEC UT IV E S UM M AR Y 4S HA R E O F H I G H, M I D D L E , AN D LOW IN CO M E JO BS BY H O URLY WAGE - 2 001 & 2 01 5
Source: Analyst calculation from Bureau of Labor Statistics data
H O U S I N G AFFO RDA BILIT Y - FACTO R S O F CO S T
This study was designed to identify, analyze and synthesize the multiple and interrelated contributing factors to
Colorado’s housing challenge. While it is tempting to identify a single factor, for example construction defect legislation, or
labor, the factors work in concert and interact with the market environment—and each of them matters. A simple fix to a
singular contributor is unlikely to reverse the trend.
A recent study from the National Association of Homebuilders categorized the relative share of costs associated with building
an average single-family home in the United States. While the shares may differ slightly for Colorado, the presentation is
representative of the composition of the factors driving price.
Land
11%
Regulatory
29% 9% Materials - Base
C TOR
- FA SO Materials - Finish
G
N
F
SI
Labor
CO
HOU
ST
Other
18% Profit
9%
Source: Analyst calculation rounded from
4% National Association of Homebuilders 2015 Cost
Study For Single-Family Homes
20%
EXECUT IV E S UM MAR Y 5Colorado has experienced some degree of cost pressure in each of these factors since the end of the Great Recession. The
degree to which the cost pressures impact final housing price vary with the relative importance of each factor to the cost of
construction and the extent to which cost pressures have mounted for the particular factor. But, more importantly, the factors
interact with each other in unexpected ways. As examples, the shortage in labor available to subdivide properties may be
holding down the demand for land, thus dampening what would otherwise be additional pressures on land cost. A migration
of labor back into the state, which ironically may not be happening due to the high cost of housing, could, in the short run,
exacerbate housing costs by placing even more demand pressure on the limited stock of housing available. Even productivity
improvements, often explored as a potential solution, require large up-front investments and the specter of such improvements
may discourage workers to enter the construction trades and in the short-term exacerbate any existing labor shortage.
Further complicating the issue is the fundamental structure of the Colorado housing market, which is experiencing, and is
projected to continue to experience, excess demand, record low vacancy rates, and quite possibly deficits of housing units.
Under circumstances of such demand pressure, only increases in supply bring down price; incremental cost efficiencies
more likely will flow to developer profit. The point is, housing is a system and must be understood, analyzed and addressed
as such. Above all, this project is intended to highlight the networked nature of the housing supply challenge facing
Colorado, and, unfortunately, to dispel the myth that there is a simple, unidimensional driver, and therefore a single solution.
The Research: Setting the Stage for a Discussion About Affordability
Our approach to this research was inductive; we entered the project with no formal model of unaffordability and instead
set out to understand the issue through a series of interviews with professionals involved in various aspects of housing
development. This qualitative approach provided a list of potential factors contributing to housing affordability that were
synthesized into the following categories, and explored more deeply in the factsheets that comprise this report:
The Market Regulatory Productivity Materials
Labor Land Consumer Preference Other
The second stage of this research was a quantitative assessment of each of the above factors and the extent to which each is
contributing to unaffordability. The results, as summarized in the accompanying factsheets, are more nuanced than the
conventional wisdom. Labor shortages exist, but to differing extents for general contracting/homebuilding and trade labor,
with stronger evidence of shortages in the trades. Employment in the subfield of land subdivision is down more than 60
percent from its level in 2001, but employment in other subtrades has increased. The resulting impact on wages is similarly
mixed with most subcategories of trade labor commanding larger increases in real wages than the overall private sector labor
market. Yet real wages in home building and general contracting remain below both 2001 and 2006 levels. Notably, real
wages for single-family general contractors have been largely flat since 2001; they are up only a half of a percent. And even
though the wage pressure in the construction trades suggests a labor shortage, Colorado is using more trade labor per
housing unit built today than it was in either 2001 or 2007.
Material costs displayed mixed results as well. Over the past ten years, most basic building material costs have demonstrated
little inflation. Instead, the increase in material costs is more related to changes in consumer preferences and the industry’s
response. Preferences for larger homes and premium finishes, or perhaps perception of such on the part of developers, have
contributed more to the cost of construction than the general level of inflation in basic building materials.
Land costs are up, but perhaps not as steeply as they would have been had the labor market for those engaged in
subdividing activities not declined. Perhaps due to a shortage of that labor, the pressure to entitle land for development has
slowed, likely holding down the cost pressures on vacant, currently unentitled land. Yet, land already zoned for residential
development is becoming scarcer. Our analysis shows that the seven-county Denver metro region has about five years’ worth
of supply of land in a currently developable state, and once that supply is consumed, converting additional land to a
developable form will add cost. This is on top of other regulatory cost pressures such as development and tap fees, a local
issue in Colorado. These have displayed differing levels of cost pressure depending on the location.
EXECUT IV E S UM MAR Y 6While the individual factors certainly contribute to housing cost inflation, their impacts are more uneven, interrelated and
nuanced than is initially obvious. The market circumstances, however, are unambiguous. Since the early 2000s, the seven-
county Denver metro region housing market transitioned from producing annual surpluses (relative to households) to one of
potential deficit of units to those seeking housing. This is due to both the unexpected growth in “housing seekers” coupled with
the anemic growth in housing units during and just after the Great Recession and a demographic shift toward a larger number of
smaller, single adult family units. Currently, many family units are doubling up, either by choice or due to necessity, resulting in
multiple per housing unit. A reversal of the preference for doubling up will significantly exacerbate the regional housing shortage.
C H AN G E I N H O U SE H OLDS A N D H O US IN G UN ITS - A N N UA L GROWTH
35,000
30,000
25,000
20,000
15,000
10,000
5,000
0
2001 2002 2003 2004 2005 2006 2007 2008 2009 2010 2011 2012 2013 2014 2015 2016
Additional HHs Additional HUs
Source: Colorado State Demography Office
And, our forecast is for a market that will not correct. Even record levels of projected permit activity fail to create a
year-over-year surplus through the 2025 forecast horizon. Alternative forecasts of household formation, which reverse the
trend toward one adult family units, also fail to return the region to healthy vacancy rates. Our alternative forecast projects
vacancy rates in the vicinity of 1.5 percent regionally through 2025, far below the 5 percent generally considered healthy
for a housing market.
B U I L D I N G P E R M I T S AN D A N N UA L S URP LUS R ATE - DE N V E R M E TR O R EGIO N
120,000
100,000
80,000
60,000
40,000
20,000
0
-20,000
-40,000
2001
2002
2003
2005
2006
2008
2009
2010
2011
2012
2013
2015
2016
2004
2007
2014
2017FC
2018FC
2019FC
2020FC
2021FC
2022FC
2023FC
2024FC
2025FC
Surplus (Deficit) of HUs over Housing Seekers Permits
Source: Colorado State Demography Office
EXECUT IV E S UMM AR Y 7First and foremost, as argued and demonstrated earlier, Colorado’s housing affordability challenge is a market problem; demand is outstripping supply. Why, then, with such demand pressure, has the market not corrected and further increased supply? The story of limited supply likely has its genesis in the Great Recession, one largely fueled by real estate excesses. In the wake of the recession, Colorado appears to be left with the “perfect storm” on the supply side: a market dealing with the aftermath of bankruptcies and consolidations, uneven labor shortages particularly in the areas of land development and key trades, and increased levels of risk aversion among the remaining players. In the halo of the recession, rational business practice is to avoid the level of overextension that jeopardized the viability of many firms prior to the recession. Compounding this, with a limited supply of developable land and a shortage of professionals available to shepherd land through the development process, there is neither the capacity nor perhaps the incentive to bring more housing to the market. With limited capacity to build and excess demand, the firms that remained turned to high-return projects: single- family housing out of the reach of those with modest incomes and rental units in high demand due to demographic shifts and the hangover of the foreclosure crisis. Finally, and to a lesser extent, investors entered the market, buying up single-family homes and deploying them as rental properties and the market for existing properties shrank, perhaps partly due to the requirement in Colorado’s senior homestead exemption for ten years of continuous occupancy for eligibility. These multiple phenomena converged to limit supply, creating a vicious cycle in the resale market as potential sellers balked due to the inability to find replacement homes to buy. All the time, demand continued to mount. Much has been written lately about the need to lower the cost of development. As demonstrated by this research, all aspects of housing development have experienced some cost pressure, albeit more unevenly and in some cases less acutely than the prevailing wisdom. Lowering or limiting these costs of development is necessary. However, it will not be sufficient to reduce the price of housing. Given the strong demand pressure, reductions in cost structure that fail to generate enough additional supply to alleviate the excess demand will flow mostly to developer profit and not to price reductions for the consumer. Instead, to be effective, changes in the cost structure MUST be accompanied with sufficient increased supply to alleviate the demand pressure, particularly supply tailored to households currently priced out of the market. This will require solutions that transcend the traditional market and instead focus on innovative approaches, such as those allowing for significant increases in the productivity of housing construction, expanding the supply of developable land, exploring the role of social capital in all phases of housing, and deploying strategic investments in infrastructure to increase the economic viability of less populated areas of Colorado. A CALL TO ACTION The factors contributing to housing unaffordability are complex and interrelated. Maintaining affordability for all segments of the market will require multiple approaches, some of which are yet to be identified, or perhaps even invented. But, to be successful in the current market environment, the actions taken must be structured around the goal of increasing the supply of housing. While programs and policies that reduce cost and expand access to existing housing are necessary, particularly for the neediest Coloradans, they will not be sufficient in reducing price pressure; in the face of the current market conditions, only increased supply will be sufficient. Bringing that additional supply to the market undoubtedly will require the innovative thinking and actions of many; there is no simple solution. Thus, this call to action is designed to encourage all Coloradans to embrace a new way of thinking about Colorado’s housing challenge while recognizing the need to maintain and expand the important programs, policies, and efforts currently underway. It should be interpreted as a set of potential actions that may be taken to augment, not replace, existing policy around housing affordability (e.g. LIHTC, State tax credits, vouchers, density bonuses, etc.). To commence the conversation, we offer the following action areas for consideration: EXECUT IV E S UM MAR Y 8
L A B OR

To the extent the labor shortage is affecting supply of housing:
• Identify areas of labor shortage and expand training apprenticeship programs.
• Advocate for immigration policy that is consistent with the need for skilled trades.
• Explore programs to bring alternative sources of labor to the market, such as employing crews from the
  correctional system in a manner similar to Colorado Correctional Industries’ SWIFT program.

Explore ways to expand labor productivity and bring more supply to the market by using methods such as factory-built
modular housing. Currently both regulation and perception are barriers to these sorts of innovations in building. The
legislature should form a committee to study and address these and other barriers to factory-built housing or other
productivity-enhancing innovations in building. This inquiry should be inclusive of solutions for primary residences, as well
as accessory dwelling units.

Communicate the true impact of major economic development announcements by accounting for the secondary jobs
created by the new primary jobs. This will raise awareness and call attention to the number of additional workers,
generally in lower paying occupations, who will demand housing as a result of the newly created economic activity.

  EN H A N CEM EN T S O F C AP I TAL R E S O U R C E S

• Identify and promote opportunities for social impact capital investments that will enhance the ability to
  bring more supply to the market.
• Expand investible opportunities in private and/or public-private partnership cost abatement vehicles, such
  as community land trusts and pilot projects.

  IN N OVAT ION S I N I N F R AST R U C T U R E P R OV IS IO N

• Expand Colorado’s housing options through strategic infrastructure investments statewide, such as broadband,
  that make other regions of the state economically viable and thus more attractive for housing.
• In the urban settings, explore innovations in shared parking as a means of reducing the burden that parking
  regulations place on new development. This option is particularly viable as the Denver region continues
  development along newly established transit corridors.

  POL ICY

• Monitor trade policy for actions that would increase the price of building materials. Coordinate with relevant state
  agencies, and if appropriate advocate for, trade policies that will not increase the price of those materials.
• Consider a restructure of the Colorado Senior Property Tax Exemption to eliminate the requirement for ten years of
  ownership. This should reduce the incentive for seniors to remain in homes they would rather sell but for the loss of the
  exemption and as a result bring additional inventory and a more healthy “churn” to the resale market. Means testing the
  exemption could offset the additional cost of eliminating the residency requirement.
• Continue to monitor the impact of the changes to Colorado’s construction defect laws to evaluate whether those changes
  have been successful at increasing the inventory of condominium property at more affordable price points.
• Evaluate the impact of the current federal tax reform on housing in Colorado and recommend state-level policy changes
  if appropriate.
• Reach out to other areas, particularly the San Francisco/Bay Area for lessons learned. Explore ways to incorporate those
  lessons into Colorado’s housing policy.

Finally, we recognize that this call to action is a beginning, not an end. It is undoubtedly incomplete, both in coverage and
in detail. It will take a persistent, on-going effort to address affordability in Colorado. To facilitate that effort, we recommend
establishing a Housing Affordability Roundtable to explore these options and others, including the ongoing monitoring of the
entire housing ecosystem.

EXECUT IV E S UMM AR Y                                                                                                             9
AC K N OW LE D GE ME N TS :

   We Would Like To Thank...

   This report was informed by the
   knowledge and expertise of the following
   individuals and organizations:

   • Adams County Housing Authority           • Oakwood Homes
   • Colorado Housing and Finance Authority   • Phil Vaughan Construction Management, Inc.
   • JE Dunn Construction Group, Inc.         • Aspen/Pitkin County Housing Authority
   • JHL Constructors, Inc.                   • Rocky Mountain Home Association
   • Koelbel and Company                      • Thomas J. Ragonetti
   • McWHINNEY                                • Thrive Home Builders
   • Metrostudy                               • Zocalo Community Development

EXECUT IV E S UMM AR Y                                                                   10
S H IF T R E S E A R C H L A B .O R G

                                                  AU T H O R E D BY

    JENNIFER NEWCOMER                                                                    PHYLLIS RESNICK, PHD

J NE WCOM E R @G A RYCOMMUN I T Y.ORG                                              P H Y LLIS @ CO LO R A D O F U T U R E S CSU.O R G

            SP ON SORED BY H OUSI N G CO LO R A D O A ND T H E CO LO R A D O H E A LT H F O U NDAT IO N

            H OUSI N G COLOR A D O.OR G                                   CO LO R A D O H E A LT H.O R G
I M PA
General
RS C
T O
TI
C
NG
FA
Q U ICK OVER VIEW
ITY
Market
HOU
IL
SI
N B
A
G
AFFORD Between 2007 and 2015, growth in households in the
seven-county Denver metro region outstripped that
of housing units, consuming the surplus of housing
During the Great Recession, the Denver region added units and resulting in a tight regional housing
households at levels that exceeded those of the years prior to market. Even with a year-over-year forecast for
the recession. In 2008, the Denver region added 20,346
building permit activity exceeding every year since
households. This is almost double the 10,203 households added
2001, demand pressures will result in continuing tight
to the region in 2005. However, during the recession,
housing markets. As a result, housing prices as
construction of new housing units fell to decades’ lows.
measured by the S&P Case-Shiller Denver Index,
which are up 60 percent since their 2009 low, are
As a result, the pre-recession regional surplus of housing units
over households quickly was absorbed and by some estimates projected to continue to rise, albeit at moderating
and forecasts, the region currently has fewer housing units rates. The market environment suggests that without
available than households seeking residences. Our forecast is meaningful increases in the supply of housing, price
that even record-level building will do little to alleviate the pressure will continue.
pressure and reverse the trajectory of housing prices.
Y EA R- OVE R-Y E AR C H AN G E I N H O US E H O LDS & H O US IN G UN ITS - DE N V E R ME TRO REGION
35,000 Additional HHs
30,000
Additional HUs
25,000
Source: Analyst calculation from
20,000 Colorado State Demography
Office data
15,000
10,000
5,000
0
2001 2002 2003 2004 2005 2006 2007 2008 2009 2010 2011 2012 2013 2014 2015 2016
RESIDENTIAL PERMITS AND HOUSING SURPLUS/DEFICIT (ASSUMES 100% REALIZATION RATE OF ALL PERMITS)
120,000 Surplus (Deficit) of
HUs over Housing
100,000 Seekers
80,000 Permits
60,000 Source: Analyst calculation
40,000 from Colorado State
Demography Office data
20,000
0
-20,000
-40,000
2017FC
2018FC
2019FC
2020FC
2021FC
2022FC
2023FC
2024FC
2025FC
2001
2002
2003
2005
2006
2008
2009
2010
2011
2012
2013
2015
2016
2004
2007
2014How can this be possible? Can there really be more households than housing units? The short answer is no. The Census defines a household as all
the people who occupy a housing unit, so by definition households cannot exceed housing units. But, family and non-family units (single adults or
non-related persons living together) seeking a place to live can exceed housing units. The answer lies in the changing composition of these family
and non-family units in the region. The Colorado State Demographer classifies these units into four types; the relevant distinction for this analysis is
the number of adults. The recent and projected trend is for a continually increasing share of smaller, single adult family units.
Perhaps by choice, perhaps out of necessity, or probably a
mixture of both, single adult units and quite possibly two
S H IFT IN H O US E H O LD CO MP O S IT ION
adult family units are doubling up. This is resulting in an
70.00%
increasing number of housing units sheltering multiple
60.00%
families and leading to the conclusion that the region is
50.00%
operating at a deficit of housing units. But regardless of the
reason, under current building patterns there simply is not 40.00%
sufficient volume of housing to serve the larger number of 30.00%
family and non-family units, now or in the future. 20.00%
10.00%
It is possible to conceive an alternative path for household 0.00%
More than one adult One adult
formation, one in which the trend toward single adult families
Source: Analyst calculation from Colorado State 2010 2050 Forecast
reverses in favor of the pattern of household composition from Demography Office data
the past. We used Colorado State Demographer data to
generate such a forecast, and it does little to brighten the REGIO N A L VACA N CY R ATE UN DE R A LTERNATIVE
outlook for the region’s housing crunch. Under the alternative H O US E H O LD CO MP O S ITIO N A S S UMPTIONS
household forecast, the regional deficit of housing units
erases, but instead the region is left with a prolonged period 10.00%
of historically low vacancy rates. Rather than a healthy 8.00%
vacancy rate of 5 percent, the rate most industry experts 6.00%
believe allows for normal churn in the housing market, Denver 4.00%
will experience vacancy rates in the vicinity of 1.5 percent for 2.00%
0.00%
all forecast years.
2017FC
2018FC
2019FC
2020FC
2021FC
2022FC
2023FC
2024FC
2025FC
2001
2002
2003
2005
2006
2008
2009
2010
2011
2012
2013
2015
2016
2004
2007
2014
Source: Analyst calculation from Colorado State Demography Office data
S & P C AS E SH I L L E R D E N VE R, L E V E L A N D P E R CE N T CH A N GE : H IS TO RY A N D FO RECAST
Case Shiller
Case Shller Percent Change
Case Shiller Level
300 0.15% Forecast (left axis)
250 0.10% Case Shiller
200
0.05% (left axis)
150
100 0% Case Shiller Percent
50 -0.05% Change Forecast
0 -0.10% (right axis)
88
90
92
96
98
00
02
06
08
10
2
6
94
4
14
FC
FC
FC
FC
1
1
0
Case Shiller Percent
19
19
19
19
19
20
20
20
20
20
20
20
19
20
20
8
20
22
24
1
Change (right axis)
20
20
20
20
Source: S&P Dow Jones Indices LLC, S&P/Case-Shiller Denver Home Price Index with analyst forecast
Regardless of the assumptions about household formation, regional housing supply is simply insufficient. As a result, our trend forecast of
regional housing prices is for an increase in the range of 3 to 4 percent each year through 2025. The status quo market environment is not
expected to contribute any significant relief to the mounting affordability pressures to housing. It will require additional supply, over and
above the robust baseline forecast levels of permit activity, to return the region to a healthy housing balance and ameliorate the mounting
price pressures.
POWER ED BY: AUTH O RE D BY:
JENNIFER NEWCOMER: JNEWCOMER@GARYCOMMUNITY.ORG
SH I F TR ESEA RCH L A B.OR G/
H OUSI N G UN A F F ORDA BI L I T Y PHYLLIS RESNICK, PHD: PHYLLIS@COLORADOFUTURESCSU.ORGI M PA
RS C
O
Consumer
T
TI
C
NG
FA
Q U ICK OVER VIEW
ITY
Preference
HOU
IL
SI
N
G B
A Shifts in consumer preference, whether perceived or
AFFORD
real, have significantly impacted the final price of
housing. If it is true that supply responds to demand,
Size does matter. As noted in the Materials Factsheet,
comparing the impact base material costs impose on the
the new supply of housing reflects a shift in
construction of a 1,000-square-foot home over time should be preference in favor of larger, fancier and more
fairly straightforward. However, the size of new homes has amenity-rich residences. It is reasonable to consider
been growing, with the exception of recessionary periods. whether demand is driving supply for the changes in
Results from analyzing property data for the seven-county housing or vice versa, but the result is the same. In
metro Denver region indicate 2008 was the peak of new
metro Denver, with few exceptions, housing has
single-family home median and average square footage,
followed by a decline to 2010, before rising again through
become larger, fancier and, especially in the case of
2016. As builders offer larger homes, base material cost rental housing, more amenity-rich. The HGTV lifestyle
increases are further exaggerated, rendering a greater phenomena has infiltrated all facets of what homes
overall effect on the end price. should look like, and, in most cases, imposes a very
real cost. Changes in consumer preferences are
What is unclear at the moment is whether builders are
driving up prices in Colorado more than the base
responding to a demand for larger homes, or whether larger
homes are selling so well in the current market environment
price of raw materials.
that they are continuing to be offered. Either way, as size
increases, so does final price.
S I ZE O F S I N G L E-FAM I LY R E S IDE N CE - S E V E N-CO UN T Y DE N V E R REGIO N
Source: County Assessor Records
While the size of single-family homes have been growing, the multifamily market has started to introduce some micro-units to the
inventory, particularly in Denver. This could be a market response to demographic shifts such as new single-headed households’ desire
to balance the size of a home with a central location. More of these micro-unit projects are in the pipeline; however, they are still a niche
submarket that has yet to command a significant share of the overall production.
L ARG E R H OM E S F O R S HR I N K I N G FAM I L I E S
Since 1947, square footage per person has risen almost 2.5 times. Today, new homes provide each adult and child, on average, a
staggering 1,000 square feet. In many instances, bathrooms can outnumber the number of occupants.SIZE OF SINGLE-FAMILY RESIDENCE VS. AVERAGE HOUSEHOLD SIZE SEVEN-COUNT Y DENVER REGION
Source: County Assessor Records and US Census Bureau
RAIS IN G T H E F IN I SHE S BAR
Materials used to finish a home’s interior, such as countertops, flooring, and appliances, contribute a measurable percentage of the
overall cost of construction. This is the one area the buyer could have some financial control over due to the range of price points, or
so it was in the past. In an attempt to understand how much flexibility a buyer has today in selecting finishes to help minimize the final
price of a new home, we inventoried the base finish packages offered by publicly-traded and local homebuilders across the state. The
findings further support the notion that this market is catering to buyers of great means. Effectively, what were considered upgrades
in the years leading into the recession (granite countertops, extensive wood and tile flooring, stainless steel appliances and designer
details) are now considered the new standard. In short, the “finishes bar” has been raised, and it appears there is no turning back.
The movement from ‘a la carte’ to ‘it’s all included’ is effectively impossible to quantify; however, it is not unreasonable to consider that
what is now the new base would have been tens of thousands of dollars in upgrades for a homebuyer before the recession. For many
current buyers, those upgrades, which are now standard, could be the difference between being able to purchase a home or not.
Even in the new rental developments, the finishes standard has
played its part. Luxurious amenity packages and lifestyle S TA N DA R D FIN IS H E S P RE V IO U SLY
amenities such as pools, workout facilities and roof top CO N S IDE RE D UP GRA DE S
entertainment spaces, have resulted in rent levels never seen
in this market.
AN E XC LUS IV E LIFE ST YL E C LU B
On the surface, it appears that new homes, particularly ones
in metro Denver where the average sale price has exceeded
$500,000, are no longer for first-time homebuyers. Many new
apartments also cater to a specific market, one that desires an
elevated lifestyle in what is known as a lifestyle state. All of
these new units are a luxury that only those with means can
consider as a place to call home.
Source: Public and Local Homebuilders in Colorado
POWER ED BY: AUTH O R E D BY:
JENNIFER NEWCOMER: JNEWCOMER@GARYCOMMUNITY.ORG
SH I F TRESEA RCH L A B.OR G/
H OUSI N G UN A F F OR DA BI L I T Y PHYLLIS RESNICK, PHD: PHYLLIS@COLORADOFUTURESCSU.ORGI M PA
RS C
Labor:
T O
TI
C
NG
FA
Q U ICK OVER VIEW
Employment
ITY
HOU
Statewide, 2016 employment of general contractors
IL & Wages
SI
N B
G
AFFORD
A and homebuilders was 18.8 percent smaller than it was
in 2001 and 23 percent smaller than it was in 2006,
and real average weekly wages are down 1.9 percent
Labor affects affordability both directly and indirectly. from 2001 and 6.4 percent from 2006 levels. As a
First, increases in labor costs directly increase the cost of comparison, real wages for all private sector
construction, the focus of this factsheet. Second, shortages in employment are up 5.51 percent and 0.67 percent
labor indirectly may affect the volume and timing of
since 2001 and 2006, respectively. While the industry
construction. The indirect relationship is explored in the second
overall employs fewer workers than prior to the
labor factsheet.
recession, there has been no overall wage pressure in
OVERALL PICTURE
residential building construction. Trade labor presents
Residential building construction (single and multifamily a more nuanced wage picture with the majority of
homebuilders and general contractors) has yet to recover to trades exhibiting wage pressure.
2001 employment levels. At the depth of the Great Recession, the
level was almost half that of 2001. In 2016, that deficit had
shrunk to just over 19 percent; however, in 2016 Colorado still
had 3,553 fewer residential building construction employees
21%
than in 2001. A decade after the Great Recession, Colorado is
left with 20.8 percent fewer firms than in 2006.
LABOR
REPRESENTS 21% OF COSTS FOR CONSTRUCTING
A SINGLE-FAMILY HOME
RESIDENTIAL BUILDING CONSTRUCTION EMPLOYMENT AND CHANGE FROM PREVIOUS LEVELS - COLORADO
Residential Building Construction employment 25,000 10%
Percent change from 2001 (rt axis)
0%
Percent change from 2006 (rt axis) 20,000
-10%
15,000 -20%
10,000 -30%
-40%
5,000
-50%
0 -60%
Source: QCEW 2001 2002 2003 2004 2005 2006 2007 2008 2009 2010 2011 2012 2013 2014 2015 2016
The impact on cost, however, is less apparent. There is some evidence that the contraction in the construction labor market has
impacted wages, but only in the past five years, perhaps a correction of the large recessionary declines. A longer-term perspective
shows that since 2006, real wages are still down 6.4 percent, and since 2001 they are down 1.9 percent. By comparison, since 2001 real
wages for all private employment in Colorado are up 5.5 percent.
PERCENT CHANGE IN REAL WEEKLY AVERAGES RESIDENTIAL BUILDING CONSTRUCTION & TOTAL PRIVATE EMPLOYMENT
8.0% Real Residential Construction Employment Wages
6.0% Real Total Private Employment Wages
4.0%
Source: QCEW
2.0%
0.0%
-2.0%
-4.0%
-6.0%
-8.0% 2002 2003 2004 2005 2006 2007 2008 2009 2010 2011 2012 2013 2014 2015 2016Much of the labor employed in building a home is in the specialty trades, not in the homebuilding and contracting categories. Experience
across the trades varies. Most trades have experienced contractions in employment from their 2001 and 2006 levels. But, compared to 2001,
four categories of trade labor saw increases in employment at rates that exceeded the rate of all private sector job growth in Colorado.
Comparing to 2006, that statistic fell to two categories.
C H AN G E I N S P EC I AL I T Y TRA DE L A BO R LE V E LS FR O M 2 006 - CO LO R A DO
Residential roofing contractors
Residential glass and glazing contractors
TOTAL PRIVATE
Residential siding contractors
Residential electrical contractors
Residential tile and terrazzo contractors
Residential plumbing and hvac contractors
Residential finish carpentry contractors
All other residential trade contractors
Residential painting contractors
Residential flooring contractors
Residential poured foundation contractors
Residential drywall contractors
Residential site preparation contractors
Residential structural steel contractors
Residential masonry contractors
Residential framing contractors
Source: QCEW -60% -50% -40% -30% -20% -10% 0% 10% 20% 30% 40% 50%
The findings on trade wages vary depending on the base year. Relative to 2001, real average weekly wages for nine specialty trade
categories have increased in excess of overall private wages, but eight categories have not. Relative to 2006, fourteen categories of trade
labor are experiencing wage pressure in excess of overall state wages and two are not. The majority of the wage pressure for trade labor has
occurred relative to the time just before the recession; the longer-term view displays less pressure on trade wages.
PER CE N T C H AN G E I N AVE R AG E WE E KLY R E A L WAGE R E L ATIV E S IN CE 2 006 - CO LO RADO
Residential roofing contractors
Residential poured foundation contractors
Residential painting contractors
Residential drywall contractors
Residential finish carpentry contractors
Residential siding contractors
All other residential trade contractors
Residential tile and terrazzo contractors
Residential masonry contractors
Residential plumbing and hvac contractors
Residential framing contractors
Residential structural steel contractors
Residential electrical contractors
Residential site preparation contractors
TOTAL PRIVATE
Residential glass and glazing contractors
Residential flooring contractors
Source: QCEW -5% 0% 5% 10% 15% 20% 25% 30%
Labor shortages may be measured by employment levels, but only wage pressure confirms a shortage. For residential construction labor, the
results are decidedly mixed. The levels of labor in building construction are lower than earlier in the 2000s and of late there has been some wage
pressure. But compared to overall wage pressure in Colorado, residential building construction has experienced less wage growth since 2001 and
2006 than total private employment; in fact, real average weekly wages in the sector are still below their 2001 and 2006 levels. Drilling down into
the individual trades presents stronger evidence of a labor shortage. The data for the specialty trades indicate wage pressure in excess of the
broader economy for almost all trades, particularly when measuring from a base year of 2006. The wage data suggest that the labor shortage
affecting construction is in the specialty trades rather than in homebuilding and contractor activities.
POWER ED BY: AUTH O R E D BY:
JENNIFER NEWCOMER: JNEWCOMER@GARYCOMMUNITY.ORG
SH I F TR ESEA RCH L A B.OR G/
H OUSI N G UN A F F ORDA BI L I T Y PHYLLIS RESNICK, PHD: PHYLLIS@COLORADOFUTURESCSU.ORGI M PA
RS C
Labor:
T O
TI
C
NG
FA
Q U ICK OVER VIEW
Impact on
ITY
HOU
IL
Construction Labor market conditions indirectly affect prices in the
SI
N B
A
G
AFFORD
housing market through their impact on the
construction process. Labor shortages that result in
As the previous Labor Factsheet outlined, the data suggest construction delays increase costs and likely the
that the labor shortage, particularly in the specialty
market price of housing. In 2016, the ratio of
trades, likely is having a direct effect on the cost of
housing construction. However, there is less evidence that residential construction employees (General
the lower levels of employment are having an effect on the Contractors and Homebuilders) to new housing units
amount or timing of building, even as production returns to
was up 46 percent statewide from 2001 and almost
near pre-recession levels.
equal to 2007 levels. For trade contractors,
IMPACTS ON VOLUME AND TIMING OF CONSTRUCTION employment per new unit is above both its 2001 and
One measure of the severity of labor shortages is the
2007 levels. Additionally, in the Denver region, the
amount of labor utilized for each housing unit produced.
There are two major categories of labor affecting time from building permit to certificate of occupancy
homebuilding: residential building construction labor and has not increased. Regional labor pressures are not
residential specialty trade contractors. The ratio of
demonstrating an effect on the volume or realization
residential contractor and homebuilder labor to unit built
was 46 percent higher in Colorado in 2016 than in 2001, and rate of new housing, even as regional housing
residential trade labor per unit built was 54 percent higher production returns to pre-Great Recession levels.
than it was in 2001. Relative to 2007, those ratios were far
closer for both labor categories. Trade labor per unit built
was 1.63 and 1.75 in 2007 and 2016, respectively. For
residential construction labor, those values were .51 and .52
for 2007 and 2016. By all measures, there is more labor per
21%
unit built currently than there was either at the beginning of
the century or just before the Great Recession. It must be
noted that these statewide statistics reflect a lower level of
statewide building in 2016 than in 2007 but a higher level of
regional building in the Denver area where the majority of
LABOR
REPRESENTS 21% OF COSTS FOR CONSTRUCTING
A SINGLE-FAMILY HOME
Colorado’s residential construction activity occurs.
RESIDENTIAL CONSTRUCTION & SPECIALT Y TRADE LABOR PER RESIDENTIAL UNIT BUILT LEVELS - COLORADO
4.00
Trade labor per new housing unit
3.50
Residential construction labor per new housing unit
3.00
Source: US Bureau of Labor Statistics, QCEW and Colorado State 2.50
Demography Office 2.00
1.50
1.00
0.50
-
01
02
03
05
06
08
09
10
11
12
13
15
16
04
07
14
20
20
20
20
20
20
20
20
20
20
20
20
20
20
20
20
Labor can also impact the cost of construction by lengthening the time to completion. Significant labor shortages should result in longer durations from
permit to occupancy. However, with the exception of specific multifamily apartment projects in 2011 and 2012, there is little or no evidence that the time
from permit to certificate of occupancy has increased across building types in Denver. This is evidenced by the flat or declining linear trendlines in the
figures on the following page.PER M IT TO CO D U R AT I O N F O R S I N GLE-FA M ILY OV E RA LL ME DIA N: 167 DAYS ( 5.5 MO NTHS)
300
250
200
Days
150 Permit to CO
Overall Median
100
Linear (Permit to CO)
50
0
Q1-2000
Q3-2000
Q1-2001
Q3-2001
Q1-2002
Q3-2002
Q1-2003
Q3-2003
Q1-2005
Q3-2005
Q1-2006
Q3-2006
Q1-2008
Q3-2008
Q1-2009
Q3-2009
Q1-2010
Q3-2010
Q1-2011
Q3-2011
Q1-2012
Q3-2012
Q1-2013
Q3-2013
Q1-2015
Q3-2015
Q1-2016
Q3-2016
Q1-2004
Q3-2004
Q1-2007
Q3-2007
Q1-2014
Q3-2014
Q1-2017
Source: QCEW
Source: City of Denver
PERM I T TO CO D U R AT I O N F OR TOWN H O M E S OV E R A L ME DIA N: 2 74 DAYS ( 9.1 MONTHS)
500
450
400
350
300
Days
250 Permit to CO
200 Overall Median
150
Linear (Permit to CO)
100
50
0
Q1-2000
Q3-2000
Q1-2001
Q3-2001
Q1-2002
Q3-2002
Q1-2003
Q3-2003
Q1-2005
Q3-2005
Q1-2006
Q3-2006
Q1-2008
Q3-2008
Q1-2009
Q3-2009
Q1-2010
Q3-2010
Q1-2011
Q3-2011
Q1-2012
Q3-2012
Q1-2013
Q3-2013
Q1-2015
Q3-2015
Q1-2016
Q3-2016
Q1-2004
Q3-2004
Q1-2007
Q3-2007
Q1-2014
Q3-2014
Q1-2017
Source: City of Denver
PER M I T TO CO D U R AT I O N F O R A PA RTME N TS OV E R A L ME DIA N: 471 DAYS ( 15.7 M ONTHS)
1000
900
800
700
600
Days
500 Permit to CO
400 Overall Median
300 Linear (Permit to CO)
200
100
0
Q1-2000
Q3-2000
Q1-2001
Q3-2001
Q1-2002
Q3-2002
Q1-2003
Q3-2003
Q1-2004
Q3-2004
Q1-2005
Q3-2005
Q1-2006
Q3-2006
Q1-2007
Q3-2007
Q1-2008
Q3-2008
Q1-2009
Q3-2009
Q1-2010
Q3-2010
Q1-2011
Q3-2011
Q1-2012
Q3-2012
Q1-2013
Q3-2013
Q1-2014
Q3-2014
Q1-2015
Q3-2015
Q1-2016
Source: City of Denver
There is some evidence of labor shortages, particularly in the specialty trades. The previous factsheet demonstrated wage pressure for trade labor, but
this analysis shows that trade labor per unit built still exceeds its pre-recession level. Labor per unit built for general contractors and homebuilders has
returned to pre-recession levels. These findings are in the context of building statewide remaining lower than pre-recession levels, but building in the
Denver region above 2007 levels. For the Denver region, there is little evidence that the labor shortage is hampering either the level of building or the
timing to completion of residential construction projects. Instead, the data suggest that production could be increased without stressing the current
supply of labor.
POWER ED BY: AUTH O R E D BY:
JENNIFER NEWCOMER: JNEWCOMER@GARYCOMMUNITY.ORG
SH I F TRESEA RCH L A B.OR G/
H OUSI N G UN A F F OR DA BI L I T Y PHYLLIS RESNICK, PHD: PHYLLIS@COLORADOFUTURESCSU.ORGI M PA
RS C
O
Labor
T
TI
C
NG
FA
Q U ICK OVER VIEW
ITY
Productivity
HOU
IL
SI
N
G B
A Compared to other major sectors of the economy,
AFFORD
construction has achieved the least in terms of
Productivity numbers speak, but so do images. One productivity gains. This is true if productivity gains are
industry leader suggested that a visit to a construction site measured over the last decade or the last seven
today would reveal techniques and methods that have decades; by one standard measure, the construction
barely changed since the middle of the past century. As
industry is no more productive today than it was in
most industries have gained efficiencies through shifting to
more capital-intensive production methods, one industry 1947. The inability of the industry to harness
analysis¹ suggests that construction is experiencing the productivity gains and the resulting inefficiencies are
opposite. Workers are actually replacing machinery at many contributing to the lack of housing affordability.
firms, largely because firms are concerned about their
ability to carry the fixed costs associated with large capital
investments during periods of recession.
Labor investments, on the other hand, are more easily reduced and rarely leave firms with legacy costs. While industry leaders
can envision an evolution toward more productive building methods (see the continuum below), most processes remain far to the
left of the homebuilding innovation continuum and have not changed in more than 50 years.
T H E H O M E BUILDIN G IN N OVATIO N CO N TIN UUM
4
3D PRINTING
3
MODUL AR
2
1
COMPONENTS
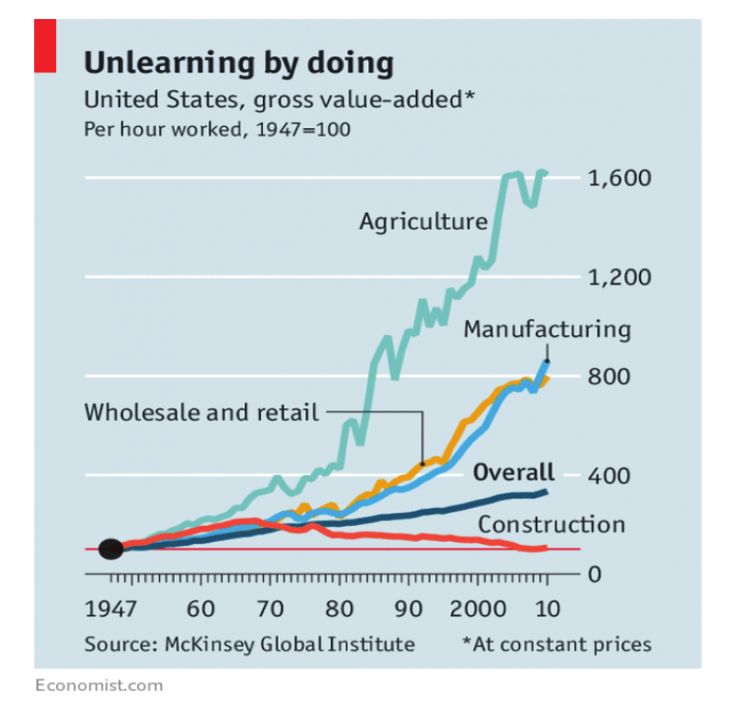
STICK BUILT (TRADITIONAL)Consistent with the images, the data reflect the lagging nature of productivity improvements in construction. One standard measure
of productivity is real gross value added per labor hour worked, a measure of the value of the output that is created by an
incremental hour of labor input. On this measure, construction fails to achieve the level of productivity of 2007 and by far
underperforms all other major industrial categories.
I N D E X O F R E AL G R O S S VA LUE A DDE D P E R H O UR WO R KE D ( 2 007 = 100)
Manufacturing
Source: Calculated from US Bureau of Labor Statistics data
HISTOR ICA L PER SP E CT I VE
The longer view is even more stark. With a base in the
post-WWII year of 1947, McKinsey Global Institute measured
the same productivity measure: real gross value added per
hour worked. Their findings, reported in The Economist², show
overall industrial productivity was up almost 400 times, with
agriculture leading the way with an increase by a factor of
1,600. Over the same time period, this measure is flat for
construction.
Confirming the sentiment of industry experts, construction
has enjoyed virtually no gains in labor productivity in more
than half a century. In a housing market that needs more
supply, productivity improvements are critical.
¹ https://www.recode.net/2017/6/6/15701186/robots-construction-homes-technology-drones-building-automation-productivity, accessed 1/22/18
² https://www.recode.net/2017/6/6/15701186/robots-construction-homes-technology-drones-building-automation-productivity, accessed 1/22/18
POWER ED BY: AUTH O R E D BY:
JENNIFER NEWCOMER: JNEWCOMER@GARYCOMMUNITY.ORG
SH I F TRESEA RCH L A B.OR G/
H OUSI N G UN A F F OR DA BI L I T Y PHYLLIS RESNICK, PHD: PHYLLIS@COLORADOFUTURESCSU.ORGI M PA
RS C
Land
T O
TI
C
NG
FA
Q U ICK OVER VIEW
ITY
HOU
IL
SI
N
G B
A Land, whether vacant or under some previous use, is
AFFORD
the basis of supply for new development, and its
LOCAL CONTROL AND THE DEVELOPMENT RUNWAY availability varies greatly from jurisdiction to
In Colorado, local control gives each jurisdiction power over its jurisdiction. Metro Denver, and Colorado overall, has
own land, and depending on its goals, will designate certain
an abundance of land; however, land that is
portions for residential and non-residential uses. Residential
properties provide very little revenue for local governments, as
currently zoned for new residential development is in
compared to non-residential properties, due to the fiscal tax limited supply. Our estimates indicate the current
structure that exists. Financial powers afforded to municipalities inventory can support five years of growth. Limited
for revenue generating sources are primarily rooted in sales and
land supply, coupled with household demand, has
use taxes. While some revenues are generated through the
property tax—approximately 8.8 percent according to revenue
resulted in land valuations that have risen
totals from the Colorado Legislative Council—it is reasonable to measurably since 2010, led by a significant jump in
assume a potential fiscal bias toward zoning land for more multifamily rental properties. Without some of the
non-residential uses because it better supports budgets.
constraint on labor, land would most likely assume a
Availability of land zoned for residential development effectively
larger share of the market’s price pressure. But the
acts as the development runway, allowing developers or builders real pressure is yet to come. Unless land is
to proceed quickly to construction. This “use-by-right” inventory preemptively rezoned for residential development,
avoids the heavy regulatory process of re-entitlement or rezoning,
developing unentitled land will be a much more
thereby reducing costs, including time and money, on a project.
Our analysis shows, in metro Denver, the current amount of land
expensive proposition, as highlighted in the
zoned for residential development would only carry five years of Regulatory Factsheet.
forecasted household growth, assuming no additional land would
be rezoned. As a result, many multifamily residential
developments have gone (and are currently going) through
rezoning because the property was deemed worth it. Looking 18%
specifically at single-family development, Metrostudy’s analysis
finds that builders have calibrated the number of annual starts to
18%
equal that of finished lots, suggesting a reluctance to take on the
LAND OF COSTS FOR CONSTRUCTING
expense of re-entitling land. This tight land supply has REPRESENTS A SINGLE-FAMILY HOME
implications for the market’s ability to deliver new units in a timely
manner, as well as create additional pressure on land valuation.
L A N D VALUAT I O N C H AN G E ( F RO M 2 010 - 2 017) - S E V E N-CO UN T Y DE N V E R REGIO N
300%
250%
200%
150%
Median
100% Average
50%
0%
-50%
Single-Family Townhomes Multifamily All
Source: Analyst calculation from County Assessor records; 2010, 2017LA N D VALUAT ION
When looking across metro Denver, the greatest land valuation increase since 2010 (the most comprehensive historical year
available) is concentrated in downtown Denver and Boulder, areas where overall real estate values are high. These locations have
seen overall land valuations increase in excess of 56 percent, mainly driven by multifamily apartment development. It should be
noted that these increases do not account for properties that were not zoned for residential development in 2010. Many instances of
recent apartment development have come by way of rezoning properties, and anecdotal reports reflect transactions at record prices
per square foot. Notwithstanding these reports of record land prices, it is likely that the shortage of labor and/or pressure from other
factors is limiting the amount of building. This serves to reduce the demand for developable land and dampen its price pressure.
L AN D VALUAT I O N C HA N GE 2 010 - 2 017 ( P E R S QUA RE FO OT)
Source: Analyst calculation from County Assessor records; 2010, 2017
P OWE R ED BY: AUTH O R E D BY:
JENNIFER NEWCOMER: JNEWCOMER@GARYCOMMUNITY.ORG
SH I F TRESEA RCH L A B.OR G /
H OUSI N G UN A F F OR DA BI L I T Y PHYLLIS RESNICK, PHD: PHYLLIS@COLORADOFUTURESCSU.ORGI M PA
RS C
Materials
T O
TI
C
NG
FA
Q U ICK OVER VIEW
ITY
HOU
IL
Price trends for the typical base materials used in
SI
N B
A
G
AFFORD constructing new housing are not consistent. Since
entering the Great Recession, material price inflation is
extremely uneven. This can be attributed to the fact that
Constructing a housing unit requires a set of base these materials are largely influenced by macroeconomic
materials that are consistent across most housing conditions, not exclusive to homebuilding. Depending on
types. Typically these are concrete for the foundation, what date is selected as the base year, the change in
wood for framing walls and roofs, plywood for
prices can render widely different results. Finally, as will
sub-flooring and roof underlayment, gypsum for interior
be outlined in the Consumer Preference Factsheet,
wall surfaces, and copper for plumbing, among others.
Any fluctuation in the pricing of these materials has a materials are contributing to the increased price of
direct impact on the overall cost of the housing unit. housing largely due to a shift in preferences rather than
core inflation in base material prices.
OVERALL PICTURE
Since the start of the Great Recession, two of these major
materials, ready-mix concrete and gypsum, have
demonstrated an increase in their price, followed by a
29%
modest increase in plywood. Wood for framing was relatively
flat over that period, while copper measurably dropped.
MATERIALS
REPRESENT 29% OF COSTS FOR CONSTRUCTING
A SINGLE-FAMILY HOME
M A J OR M AT ER I AL S I N F L AT I O N: AS M E AS URE D BY TH E P RO DUCE R P R ICE IN DE X 2007 - 2016
Ready-Mixed Concrete 21.9%
Softwood Cut Stock & Dimension -0.5%
Plywood 9.2%
Gypsum 24.1%
Copper Wire & Cable -20.3%
Source: Bureau of Labor Statistics
Across the five major materials analyzed, only ready-mix concrete has demonstrated a consistent increase in its price index, followed by plywood.
P R OD UCER PR I C E I N D E X : R E ADY-M I X CON CR E TE P R O DUCE R P RICE IN DE X : P LY WOOD
Source: Bureau of Labor Statistics
*For ready-mix concrete and plywood, 1986 = 100You can also read