FAT-Schriftenreihe 343 - Objective assessment of database quality for use in the automotive research and development process - VDA
←
→
Page content transcription
If your browser does not render page correctly, please read the page content below
FAT-Schriftenreihe 343
Objective assessment of database quality for use in the automotive
research and development process
Objective assessment of database quality for use in the
       automotive research and development process

Johann Ziegler, Henrik Liers
Verkehrsunfallforschung an der TU Dresden GmbH

Albine Chanove, Maria Pohle
Fraunhofer-
Fraunhofer-Institut für Verkehrs-
                        Verkehrs- und Infrastruktursysteme IVI

Das Forschungsprojekt wurde mit Mitteln der Forschungsvereinigung
Automobiltechnik e.V. (FAT) gefördert.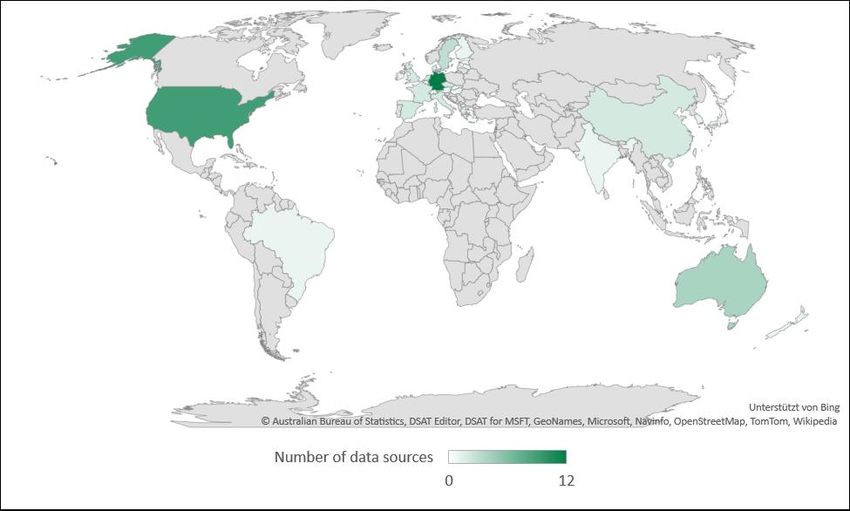
Acknowledgments
The Research Association for Automotive Technology (FAT) has commissioned the Traffic Acci-
dent Research Institute at TU Dresden GmbH (VUFO) and the Fraunhofer Institute for Transpor-
tation and Infrastructure Systems (IVI) to work on the mentioned research project. Vehicle man-
ufacturers and numerous suppliers have joined in the FAT to conduct pre-competitive and joint
research under the framework of the German Association of the Automotive Industry (VDA).

The initiation of this research project was originated from the FAT AK3 working group by
Dr.-Ing. Michael Düring (Volkswagen AG) and Michael Wagner (Continental AG). The two FAT
project leaders were always valuable idea generators. Their constructive criticism and ap-
proaches contributed significantly to the success of this research project. Our first gratitude be-
longs to them.

Our second gratitude belongs to all members of FAT AK3 working group, who contributed to the
development of the matching process with a scientific questionnaire and many approaches during
the interim meetings.

Due to the support letter by Mrs. Prof. Dr.-Ing. Langowsky (FAT), many data providers could be
won for the research project by providing meta data information on database. For this effort, we
would like to thank Mrs. Prof. Dr.-Ing. Langowsky and all supporters.

   •   International Traffic Safety Data and Analysis Group (IRTAD)
   •   Initiative for the global harmonisation of accident data (IGLAD)
   •   Aalborg University - Traffic research group by H. Lahrmann
   •   Hellenic Institute of Transport (HIT) by D. Margaritis
   •   Insurance Institute for Highway Safety by B. Mueller for information on the VIPA project
I. Table of contents

I. Table of contents
I. Table of contents ..................................................................................................................... I
II. Abstract.................................................................................................................................. II
III. Task ......................................................................................................................................III
IV. Abbreviations and indices .................................................................................................... IV

1. Introduction .......................................................................................................................... 1

2. Research on data sources................................................................................................... 2
   2.1. National data sources ...................................................................................................... 4
     2.1.1. Geographical coverage ............................................................................................. 5
     2.1.2. Data source size ....................................................................................................... 6
     2.1.3. Database history ....................................................................................................... 6
     2.1.4. General and specific content ..................................................................................... 7
     2.1.5. Conditions of survey .................................................................................................. 8
     2.1.6. Definition of the injury severity................................................................................... 8
   2.2. In-depth data sources .....................................................................................................10

3. Development of the meta database ...................................................................................14
   3.1. Structure and implementation .........................................................................................14
   3.2. Codebook .......................................................................................................................19

4. Objective assessment ........................................................................................................22
   4.1. Questionnaire .................................................................................................................22
   4.2. Matching process ...........................................................................................................25
   4.3. Implementation of the result matrix .................................................................................27

5. Use of the meta database ...................................................................................................29

6. Executive summary ............................................................................................................35

7. Outlook ................................................................................................................................36

Appendix .................................................................................................................................37
   List of literature ......................................................................................................................37
   List of figures .........................................................................................................................39
   List of tables ..........................................................................................................................40

                                                                                                                                                  I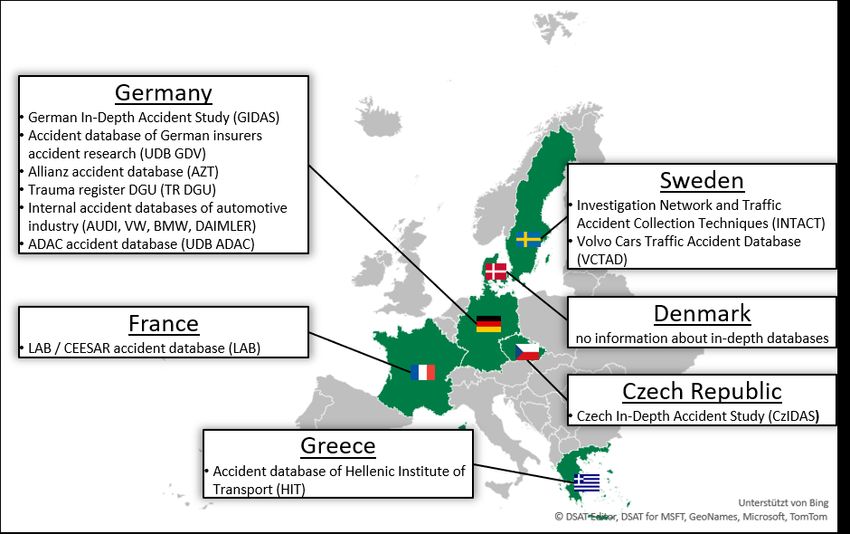
II. Abstract
II. Abstract
Numerous interdisciplinary aspects are considered in the research and development environ-
ment, particularly in the field of vehicle and traffic safety. The relevant issues of assisted, con-
nected, and automated driving and the further development of passive and integral safety systems
require reliable data sources. The sometimes very heterogeneous traffic and accident situation
between countries and continents makes it necessary to take as many as possible data sources
from several countries/regions into account. The aim of the present work is to develop a unified
meta database that contains all necessary information for the research and development depart-
ments on a meta based level (no raw data) for several countries.
One of the main objectives is the research on international data sources in the field of traffic and
vehicle safety. This includes national road accident statistics based on police accident data as
well as highly detailed investigations in smaller regions (so-called In-depth data sources). At the
beginning of this research project, the following countries are defined for further investigation:
Germany, France, Greece, Czech Republic, Sweden, Denmark and USA. The research on data
sources in the selected countries in the field of traffic and vehicle safety identified 32 data sources
out of which 19 could be fully inventoried in the meta database. In total 64 data sources are
identified worldwide.
The basis for the development of the meta database is the German In-Depth Accident Study
(GIDAS). GIDAS is a cooperation project of the Federal Highway Research Institute (BAST) and
the Research Association for Automotive Technology (FAT). For the development, fragments of
the GIDAS database structure as well as knowledge and expertise in database development are
used. The structure of the meta database is characterised by a general fact sheet information
about the researched data source and its content on accident-relevant variables. In total, the meta
database contains 15 data tables that are uniquely assigned via an identification number (primary
key). Parallel to the meta database development, a codebook for the description of 237 variables
contained in the meta database has been developed
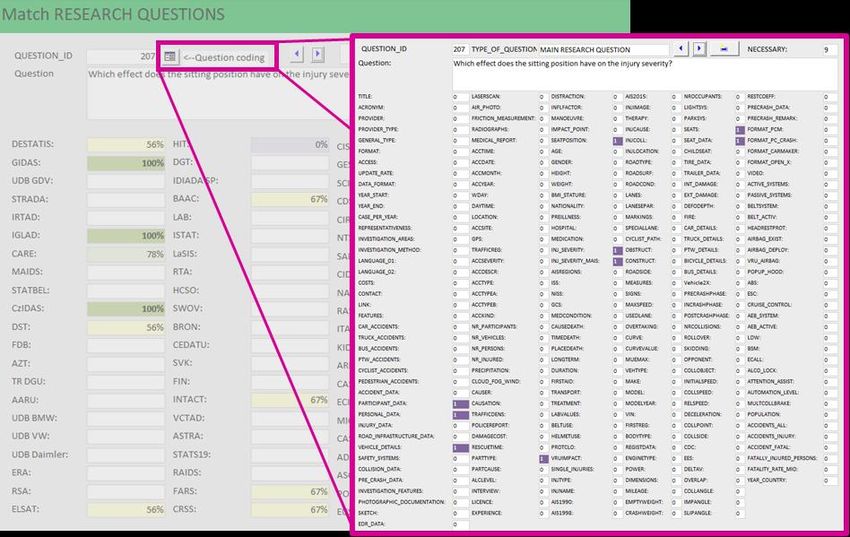
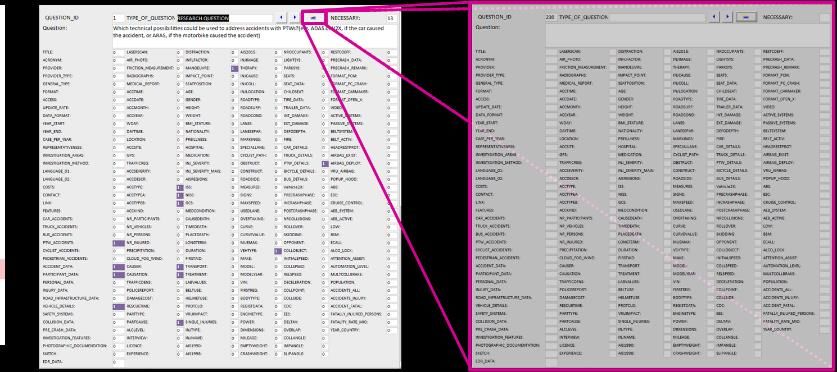
In addition, a questionnaire is used to check the applicability of the developed meta database for
specific questions from the German automotive industry. Therefore, the same set of variables
from the meta database is used to code the questionnaire. For the objective assessment between
the meta database and questionnaire a matching process is developed. The aim of the matching
process is to indicate the covered percentage of necessary variables in the various data sources
for each question. The perfect matches are represented by a 100 % coverage, suggesting that
this data source may be one of the most appropriate ones for answering the question. The results
of the matching process are collected in a result matrix
The meta database and the result matrix can be a useful tool to make the development process
even more efficient by minimising the research time for suitable data sources to answer the rele-
vant development questions in the field of the vehicle safety. Furthermore, the meta database can
act as a platform to bring several data providers from different countries together and to encour-
age the global harmonisation of road accident data sources.
II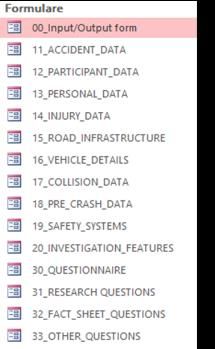
III. Task

III. Task
The task of this research project is subdivided into several tasks, which are described more in
detail in the following report:
   • Identification of data sources in the environment of vehicle safety and road traffic acci-
         dents
   • Contact and consultation of data providers with a detailed interview on the investigation
         methods, data content and quality management of the data source
   • Development of a result matrix (meta database) incl. applicability assessment in a suita-
         ble form
   • Checking the applicability of the data sources for certain research questions specified by
         the German automotive industry and suppliers
   • Development of a matching process to compare the meta database and the question-
         naire

                                                                                             III
IV. Abbreviations and indices
IV. Abbreviations and indices
Symbol Description
AADT Average Annual Daily Traffic
ADAC German Automobile Club (Allgemeiner Deutscher Automobil-Club e.V.)
AIS Abbreviated Injury Scale
BAAC Bulletin d’analyse d’accidents corporels (analysis report of road acci-
dents involving physical injury)
BAST Federal Highway Research Institute
CARE Community Road Accident Database
CDS Crashworthiness Data System
CDV Transport Research Centre (Czech Republic)
CEESAR Centre Eurpéen d’Etudes de Sécruité et d’Analyse des Risques
CERTH Centre for Research and Technology Hellas
CISS Crash Investigation Sampling System
CRSS Crash Report Sampling System
CZ Czech Republic
CZIDAS Czech In-Depth Accident Study
DESTATIS Federal Statistical Office
ELSAT Hellenic statistical database
EU European Union
EUSKA Electronic accident type map (Elektronische Unfalltypensteckkarte)
FARS Fatality Analysis Reporting System
FAT Research Association for Automotive Technology (Germany)
GES General Estimates System
GIDAS German In-Depth Accident Study
HGV Heavy goods vehicle
HIT Hellenic Institute of Transport
ICAM International Centre for Automotive Medicine (University of Michigan)
IDIADA Institut d'Investigació Aplicada de l'Automòbil (Institute for Applied Auto-
motive Research)
INTACT Investigation Network and Traffic Accident Collection Techniques
IVI Fraunhofer Institute for Transportation and Infrastructure Systems
LAB Laboratory of Accident Analysis, Biomechanics and Human Behavior
MAIS Maximum Abbreviated Injury Scale
MHH Hannover Medical School
NASS National Automotive Sampling System
NHTSA National Highway Traffic Safety Administration
PDF Portable Document Format
POLSAS Police record system (Danish police case management system)
SCI Special Crash Investigation
SQL Structured Query Language
SUV Sport utility vehicle
IVIV. Abbreviations and indices
USA United States of America
PTW Powered two-wheelers
VDA German Association of the Automotive Industry
VIN Vehicle identification number
VIPA Vulnerable Road User Injury Prevention Alliance
VRU Vulnerable road user
VUFO Traffic Accident Research Institute at TU Dresden GmbH
WHO World Health Organization
V1. Introduction
1. Introduction
In the research and development environment of the automotive industry, numerous interdiscipli-
nary aspects are considered, particularly in the field of vehicle and traffic safety. The relevant
issues of assisted, connected, and automated driving and the further development of passive and
integral safety systems require reliable data sources. The sometimes very heterogeneous traffic
and accident situation between countries and continents makes it necessary to take as many as
possible data sources from several countries/regions into account. However, it is not always ob-
vious which data source is suitable for which kind of research question or development approach.
The aim of the present work is to develop a unified meta database that contains all necessary
information for the research and development departments on a meta based level (no raw data)
for several countries.
One of the main objectives is the research on international data sources in the field of traffic and
vehicle safety. This includes national road accident statistics based on police accident data as
well as highly detailed investigations in smaller regions (so-called In-depth data sources).
In addition to the development of a meta database, a questionnaire is used to check the applica-
bility of the developed meta database for specific questions from the German automotive industry.
For the objective assessment between the meta database and questionnaire a matching process
is developed. The aim of the matching process is to indicate the covered percentage of necessary
variables in the various data sources for each question. The results of the matching process are
collected in a result matrix.
Based on the developed meta database and the matching process, the result matrix offers a
possibility for an objective assessment of data sources and provides the opportunity for data pro-
viders to improve their data quantity and data quality. Furthermore, the meta database can act as
a platform to bring several data providers from different countries together and to encourage the
global harmonisation of traffic accident data sources.
12. Research on data sources
2. Research on data sources
The research on data sources for road traffic accidents differs between national databases and
in-depth databases. Regardless of the origin of the data (national or in-depth databases), the
researched databases for this project are designated as data sources and the developed data-
base as meta database (Figure 1).
Figure 1: Scheme of the project with defined wording
The so-called national data sources are based on data collected by the police, which consist a
large number of investigated accidents and give a macroscopic view of accident scenario. The
use of a police reported data source on a national level allows a national coverage of the accident
scenario and the acquisition of numerous cases.
The main focuses of the police investigation and the national data sources are the collection of
general accident-related data to gather evidence for the later apportion of the blame for monitoring
the general accident situation and assessing the infrastructure safety. In-depth data sources fol-
low a different approach, where the data providers mainly want to investigate how the accident
could happen without focusing without focusing on evidence for the later attribution of blame.
In comparison to the national data sources, in-depth data sources are mostly characterised by a
smaller number of cases, but usually by a higher level of detail in the investigation of road traffic
accidents. This allows a microscopic view of the accident scenario. In contrast to the police re-
ported accidents, the accidents of the in-depth data sources are usually investigated by accident
researcher and medical experts.
Depending on the sampling plan and the number of investigated cases, some in-depth data
sources offer the opportunity to extrapolate their accident scenario on a national level to make
representative statements.
22. Research on data sources
At the beginning of the research project, it was agreed with the Research Association for Auto-
motive Technology (FAT) that the detailed research on data sources should be focused on se-
lected countries. The countries were selected as following: at least one representative European
country per compass direction (north, east, south, west), plus Germany, and one non-European
representative country. (Figure 2).
Figure 2: Selected countries for the detailed research on data sources
During the research process of data sources, the Swedish national authority explains that the
access to the meta data of the police accident investigation is reserved only for Swedish research
institutes. Subsequently, the research according to national data sources has been extended to
Denmark to maintain the motivation of the country selection with one Nordic representative.
The complete selection contains Germany, France, Greece, Czech Republic, Sweden, Denmark
and the United States of America (USA). In addition to the country selection, basic information
about data sources in other countries should be included in the meta database.
32. Research on data sources
2.1. National data sources
Based on the country selection, the following section investigates national data sources in partic-
ular. Basically, all data sources share a common parameter base, such as timeline, general acci-
dent properties, participant types and injury levels. However, various differences can be found on
closer inspection1.
The data sources are not only investigated at the level of the data scope but have to focus on the
level of their meta data and data definitions as well. Therefore, the codebook, the general condi-
tions of acquisitions, the context and the definitions have been reviewed. A first overview of the
research data sources is given in Table 1.
Table 1 shows first differences of the national data sources e.g., the number of recorded variables
or the definition of severity levels. These and other aspects will be discussed in the following
sections.
Table 1: Investigated national accident data sources
Germany Czech Republic France Greece Denmark EU USA USA
Country
(EUSKA) (ASCZ) (BAAC) (ELSAT) (Polsas) (CARE) (CRSS) (FARS)
Geographical
Federal states Country EU Counties Country
coverage
Accidents/year 300,000* 100,000 58,000 11,000 3,500** 1,300,000 50,000 33,600
Timeline 1990-today 1990-today 1975-today 1970-today 1990-today 1993-today 2016-today 1975-today
Number of
100 60 65 80 70 55 110 140
variables
At least one vic- At least one fatal-
Conditions of tim, one motor ve- ity, one motor ve-
At least one victim, one vehicle, on the public road
survey hicle, on the pub- hicle, on the public
lic road road
Severity of
Severity Time-based def-
Time-based definition the highest KABCO scale
definition inition and MAIS
injury
Only fatal acci-
Also cost estima-
Comment Also cost estimations dents. Also cost
tions
estimations
* As there is no global German police accident data source, the value “accidents/year” is from the DESTATIS table,
only for traffic accidents with injuries. The other information are displayed based on the EUSKA format.
** At the time of the study, access to the police database was not granted: the value “accidents/year” is from the IRTAD
database.
1 For the entire parameter set and the development of the data see the meta database (Section 3.1)
42. Research on data sources
2.1.1. Geographical coverage
One of the first important aspects for national data sources is the geographical coverage. Most of
them consist indeed of a coverage area that includes the whole country as well as the overseas
territories. However, two countries (Germany and the USA) have a federal political organisation
with different ways to set up a statistic strategy on road traffic accidents for the whole country.
In Germany, each federal state has to create and manage a police accident data source. However
the German Accident Statistic Law (Straßenverkehrsunfallstatistikgesetz – StVUnfStatG) defines
a minimum of to be collected accident information and their definition. This allows the German
federal statistical office (DESTATIS) to unify and publish the road traffic accident data under an
aggregated form.
Next to the minimum accident information, the data of each federal state provide further variables,
especially the geographical coordinates, detailed information of accident causes or accident
sketches. However, the additional information can differ between the states making an accurate
and complete comparison difficult. For example, the accident data of Saxony reports the vehicle
identification number (VIN) allowing to decode the vehicle manufacturer, model type, the model
year or built-in assistance systems of motor vehicles. Further, the State of Baden-Württemberg
records the usage of cycle-helmets or, if known, denotes the Average Annual Daily Traffic (AADT)
at the accident site. Another example: Bavaria, Brandenburg, Saxony-Anhalt and Hessen have a
more distinguished 3-digit-accident type, while Berlin uses raw motion lines for all participants to
describe the accident constellation. In addition, Berlin provides 3d-scans of the accident site for
accidents with severe and fatal injuries.
Another difference in the accident data can be the data format or the structure. Many databases
define variables at an accident- or participant-level. In contrast, the State of Saarland records all
information at the accident-level and thereby limits the number of accident participants to three.
However, a format, which is used in the majority of the federal states is called EUSKA (Electronic
accident type map) [1] and is inventoried in the meta database. EUSKA data includes the required
information by the German Accident Statistics Law and allows for state-specific additional data.
Similar to the German federal states, each American federal state has to create and manage its
own police accident data source. States are encouraged to follow the national agency recommen-
dations of the National Highway Traffic Safety Administration (NHTSA) for the data collection, so
that all states have the same parameters, but it is not mandatory [2]. In order to create a unified
and single accident database, the NHTSA has two different databases, which are not compiled in
the same way: one is an extrapolation of selected counties to obtain an estimation for all accidents
(with/without personal injury), and the other one is an (almost) complete survey of fatalities.
The Crash Report Sampling System (CRSS database) receives its data from a nationally repre-
sentative probability sample [3], selected from the different police-reported accidents that occur
annually and result of property damage, injury, or death. These accident reports are chosen from
60 selected areas across the United States that reflect different properties: the geography, the
52. Research on data sources
population density, the miles driven, and the number of accidents. CRSS analysts review the
original accident reports, interpret and code their information in the common database. After the
coding phase, quality checks are performed on the data, both automatically and manually to en-
sure validity and consistency. When these are completed, CRSS data files become available and
exploitable, for road experts as for the public. Based on these representative samples, accident
trends are estimated at a national level after an additional extrapolation.
The Fatality Analysis Reporting System (FARS database) only contains traffic accidents with fa-
talities from the 50 federal states, the District of Columbia and Puerto Rico.
Contrary to the CRSS database, it is not based on representative samples. Since the NHTSA
managed to have a cooperative agreement with an agency in each state’s government to provide
information on all qualifying fatal accidents. In theory, all fatal accidents involving at least one
motor vehicle are reported. FARS analysts present in each state are responsible for gathering,
reviewing and coding the original data to the FARS format. The number of analysts varies by
state, depending on the number of fatal accidents and the ease of obtaining data. Data is not only
based on the accident database, but also on the vehicle registration and driver licensing files as
well as medical data, including e.g., death certificates and hospital data.
Due to data protection regulations, and as they apply to German data sources, no personal iden-
tification data such as names, addresses or national insurance numbers are available in the US
data sources either.
2.1.2. Data source size
A second important aspect for national data sources is the size of the data source, e.g., the in-
vestigated number of accidents per year. Most of them have more than 10,000 cases per year,
which allow them to reach a high degree of representativity.
2.1.3. Database history
In Europe, the national accident data sources are usually more than 30 years old since the Euro-
pean Commission stated the creation, management and use of accident databases with its 1993
regulation [5]. Due to these regulations, the last European countries are obliged to set up an
accident database.
In the United States, the first national accident data source GES (General Estimates System)
appeared in 1988, and the FARS data appeared in 1975. However, following an overhaul of the
variables and structure, the current version is from 2016. The previous national data source GES
is now called CRSS and the previous in-depth data source NASS CDS (Crashworthiness Data
System) is now called CISS (Crash Investigation Sampling System). Only the FARS database
was not officially changed, although it was also modified.
62. Research on data sources
2.1.4. General and specific content
In general, national data sources mainly provide information on data related to the place of the
accident, the time when the accident occurred, at least the vehicle at fault (such as defined by the
police officer) and at least the driver of this vehicle.
Thus, all sources contain data on time, weather, light, type of road, the area, crossing with regard
to the place of the accident and its temporality. There are also data on the type of vehicle, the
obstacle hit (if any), the type of accident, the age of the driver and the type of injury. However,
there are differences in the level of detail. On this point, the number of variables in Table 1 gives
an idea how detailed the data sources can be. For example, the Greek data source ELSAT (Hel-
lenic statistical database) has several variables registering the road infrastructure with the pres-
ence of different road markings in the middle and on the side, with the mention of safety barriers
and separation in the middle, and with the existence of special lanes, like a bicycle lane or a bus
lane [6].
A specificity in the France data source BAAC is to record the driving manoeuvre of each partici-
pant instead of a pre-categorized accident constellation between the accident participants. Addi-
tionally, a special motorbike manoeuvre is distinguished: lane splitting (e.g., in traffic jams, in
slowdown traffic on a two-lane road) [7].
Due to the high modal split of cyclists, the Danish data source POLSAS (police case management
system) records specific information about the infrastructure related to cycle infrastructure [8].
Information can be provided on the existence of a cycle path at the accident scene, how it is
designed and how it ends at the intersection. For example, at a T-intersection, the cycle path that
was previously on the pavement, separated from the road, joins the road and disappears into the
lane for cars.
One special feature of the Czech data source ASCZ (Accident Statistics Czech Republic) is that
the car manufacturer of the vehicle responsible for the accident is registered. There are about 60
different manufacturers to choose from, depending on the type of vehicle (bus, car, motorbike,
etc.) [9].
Another special feature of the Czech data source ASCZ as well as the German data sources is
the cost estimation of the material damage in each accident. In both countries, the majority of cost
estimations are made by the police officers and based on a visual analysis of the material dam-
age.
The structure of the FARS and CRSS databases provides a chronology of harmful events, such
as an impact with another vehicle, or an impact with a fixed object, or a fire in a vehicle (about 60
different events). It is possible for a given accident to record a list of so-called harmful events and
order them from first to last in time. In this list, the most harmful event can also be coded. This is
used to assess the most probable causes of the accident. Moreover, all collision events are rec-
orded not only according to their temporality, but also according to the involvement of different
actors. This is particularly useful in accidents with at least three vehicles. For example, a collision
72. Research on data sources
event will be recorded first between vehicle A and B, and then between vehicle B and C, in the
case of rear-end collisions.
2.1.5. Conditions of survey
For the European countries, the conditions of survey of an accident in the data sources are the
same: the accident must involve at least one vehicle, and one victim on the public road.
In the US data sources, at least one motor-vehicle must be involved in an accident. In CRSS,
there must be at least one motor-vehicle involved in an accident and at least one injured person.
In FARS, there must be as well at least one motor-vehicle involved in an accident and at least
one participant, which must have died within 30 days. Thereby, VRU accidents are only recorded
if at least one participant has died according to the above conditions and at least one motor-
vehicle was involved. Fatalities of single-VRU-accidents or accidents between VRU are not in-
cluded [4].
2.1.6. Definition of the injury severity
Most of the police accident data sources in Europe use a time-based definition of the injury se-
verity. Casualties are considered as fatalities if they die within 30 days after the accident. Partici-
pants are considered as seriously injured if they stay in a hospital more than 24 hours (stationary)
after the accident, and slightly injured under 24 hours (ambulant) or if the casualties are treated
by the rescue service directly (only) at the accident scene. However, this method is being ques-
tioned because some cases go unrecorded, for example single accidents of cyclists with treat-
ments several days later [10]. Starting in 2013, various reports [11] [12] [13] have highlighted the
weaknesses of a time-based definition and have advocated the use of a standard format for all,
suggesting the trauma scale “Maximum Abbreviated Injury Scale” (MAIS). Although the Commu-
nity Accident Report Database (CARE) stores the injury severity also under a time-based defini-
tion since its creation, the MAIS was newly implemented in 2015.One drawback of this new vari-
able is that the completeness of its coding strongly depends on whether the member countries
also report injuries under this scale.
The danish police database POLSAS proceeds a different way in the recording of the severity
level. A "slight" degree is to be chosen if the present injury, or the condition of the person corre-
sponds to a specific list. A "severe" level is to be chosen if the condition of the person corresponds
to another list, e.g., if there is a visible fracture, dislocation or severe sprain. If a participant has
more than one injury, the highest level is retained.
82. Research on data sources
Both CRSS and FARS list their injuries according to the KABCO scale. This scale was created in
1966 and adopted by the states, although the definitions were left up to the state’s discretion.
While working on a common accidents criteria list, the scale was reviewed and the definitions
settled in 2017 [13]. It is now composed of six different levels of injury severity, observed at the
scene of the accident:
• K – Fatal injury;
• A – Suspected serious injury;
• B – Suspected minor injury;
• C – Possible injury;
• O – No apparent injury.
So-called serious injuries are defined as result in one or more of the following: severe laceration
resulting in exposure of underlying tissues/muscle/organs or resulting in significant loss of blood,
broken or distorted extremities, crush injuries, suspected skull, chest or abdominal injury, signifi-
cant burns, unconsciousness or paralysis. The definition of level B is therefore based on whatever
is lighter than level A, and level C is reserved for non-visible injuries, but still complaints of pain.
Level O is for non-injured participants.
92. Research on data sources
2.2. In-depth data sources
In-depth accident data sources are mainly investigated by interdisciplinary research units. They
often consist of a technical team supplemented by a medical and/or psychological unit. The former
investigates the technical aspects of the accident (e.g., infrastructure, vehicle) and the medical
part investigates the injuries suffered by the persons in the accident and the physical/psycholog-
ical backgrounds as well as the mental consequences caused by the accident.
Most data providers of in-depth data sources reconstruct their accident scenario in order to know
the most probable accident sequences. Due to the increased effort in the data recording and
reconstruction, the number of accidents is smaller than in national data sources.
In-depth investigations are mainly realised at selected locations where either more accidents oc-
cur or a selected type of road users are present or the boundary conditions like landscape, driver
milage or age distribution are representative for a certain region or country. Based on a fixed
sampling plan with a random accident selection and a defined weighting process, some data
providers have the possibility to extrapolate their data for representative statements to the inves-
tigation area or even to certain regions.
According to the defined country selection, the following in-depth data sources have been re-
searched in Europe (Figure 3).
Figure 3: Research on in-depth data sources for the country selection in Europe
102. Research on data sources
The accident data recording in Germany is operated on an in-depth level by various data provid-
ers. One of the most significant data sources for in-depth traffic accident research is the German
In-Depth Accident Study (GIDAS).
GIDAS is a collaborative project of the Federal Highway Research Institute of Germany (Bun-
desanstalt für Straßenwesen / BASt) and FAT. Since mid-1999, the GIDAS project has collected
on-scene accident cases in the areas of Hanover (by the MHH – Hannover Medical School) and
Dresden (by the VUFO - Traffic Accident Research Institute at TU Dresden GmbH). The data
collected in the GIDAS project is very extensive and serves as a knowledge base for various
groups of interest [27]. The main feature of GIDAS is that the investigated data are representative
for Germany due to the sampling plan for the accident selection and the weighting process [14].
Parallel to the access to the GIDAS data source, most of the automobile manufacturers in Ger-
many also operate their own accident investigations. The focus of the internal accident research
units is to investigate the accident scenario and accident behaviour of their latest vehicle models.
Findings from this work are directly returned to the development departments for eventual adjust-
ments to the current models and as baseline for new developments [15] [16] [17]. Further in-depth
data sources are operated by insurance companies (e.g., German Insurers Accident Research
UDV, Allianz) and automobile clubs (e.g., ADAC)
In 2007, a Swedish consortium of the government department for transport, the Chalmers Uni-
versity of Technology and the automotive industry set up the Investigation Network and Traffic
Accident Collection Techniques (INTACT). The consortium was concerned with the establishment
of a methodology for the in-depth investigation of road traffic accidents around the Gothenburg
area, in which at least one of the following vehicle types must be involved
• Car (all categories)
• Light truck (≤3500 kg)
• Heavy goods vehicle (HGV) (>3500 kg)
• Bus (all categories)
Another selection procedure is when an ambulance is called to the accident scene due to as-
sumed personal injury. The final report of this consortium was published in 2010 and involved in
total 123 investigated accidents on the spot [18]. Further in-depth accident data sources are op-
erated by Volvo Car Corporation [19] (Volvo Cars Traffic Accident Database - VCTAD) and Volvo
Trucks [20] to the accident investigation of their latest vehicle models.
The research on the availability of in-depth data sources in Denmark did not provide any infor-
mation.
Based on the knowledge and structure of GIDAS, the Transport Research Centre (CDV) from the
Czech Republic, Skoda and IDIADA CZ set up the Czech In-Depth Accident Study so-called
CZIDAS in 2011. CZIDAS collecting accidents on two investigation spots (Brno, Hradec Králové).
Every year nearly 300 accidents are investigated. In addition to the investigation each case is
reconstructed, and the participants are interviewed according to a psychological scheme [21].
112. Research on data sources
The investigation of road traffic accidents at a microscopic level in Greece is operated by the
Centre for Research and Technology Hellas (CERTH) or rather by the Hellenic Institute of
Transport (HIT). The investigation is conducted around the site of the institute in Hellas [22].
In France, in-depth investigations for road traffic accidents are realised by the Laboratory of Ac-
cident Analysis, Biomechanics and Human Behavior (LAB) and CEESAR (Centre Eurpéen
d’Etudes de Sécruité et d’Analyse des Risques) [23]. A request for meta information by codebooks
or manuals has been denied. After a publication of the project results, a decision will be made
whether meta information on the data source will be disclosed or not.
The research on in-depth data sources in the USA yielded in three data sources (Figure 4). The
representative share of U.S. road accident data is government-owned and subject to the U.S.
Department of Transportation (DOT). The NHTSA is the central authority for the investigation of
road traffic accidents and data.
The National Centre for Statistics and Analysis (NCSA), a department within the NHTSA, is re-
sponsible for the preparation and analysis of statistical accident data. NCSA is the superordinate
authority for various data collection programmes, whose research content varies between national
and in-depth.
Figure 4: Research on in-depth data source in the United States of America
122. Research on data sources
One of these data recordings with more in-depth content on road traffic accidents is the Crash
Investigation Sampling System (CISS). CISS is based on the Crashworthiness Data System
(CDS) of the National Automotive Sampling System (NASS), which was withdrawn in 2016 and
replaced by CISS. The accident investigation is carried out by in-depth research units. The case
selection is based on thousands of randomly selected traffic accidents from police accident re-
ports, which are supposed to be representative for the USA in terms of geography, population,
mileage and number of accidents. CISS only investigates accidents involving passenger cars,
light trucks, sport utility vehicles (SUVs) and vans, in which at least one of the involved vehicles
is towed and at least one of the involved persons is injured [24].
The Special Crash Investigations (SCI) is considered to investigate special accident scenarios.
The cases for the SCI data source based on the data from the GES/CRSS, CDS/CISS and FARS.
Depending on the research contract the cases are investigated for the SCI data source more in
detail. The aim of these investigations is to publish a case number of at least 100 representative
accidents per study. In the past, the SCI investigated accidents caused by carbon monoxide poi-
soning or cases in which babies or small children were left in the car and suffered health damage
due to hyperthermia (overheating) or hypothermia. Other SCI studies focused on accidents in-
volving vehicles where special airbags, child seats or alternative powertrains are used. Another
SCI study investigated the accident scenario of school buses where at least one occupant was
fatally injured [25].
The Vulnerable Road User Injury Prevention Alliance (VIPA) was founded by the International
Centre for Automotive Medicine (ICAM) of the University of Michigan. The collection began in
2015, producing a detailed database of Michigan pedestrian and bicyclist accidents where police
were called to the accident scene. The data of the VIPA database are not representative for the
USA but should provide a rough impression of the accident scenario between VRUs and vehicles
of U.S. vehicle fleet [26].
For the meta database the CISS database and SCI database are completely researched. The
VIPA is registered based on scientific publications, because no response was received upon the
request for access to the manual or codebook.
133. Development of the meta database
3. Development of the meta database
The basis of the meta database is the GIDAS structure, which is characterized by several levels,
starting with the accident level, participant level, person level and the lowest level, the injury level.
These four levels are linked by a CASE-ID, which is a consecutive number within a year and the
respective investigation area [28].
For the development of the meta database, fragments of the GIDAS structure as well as
knowledge and expertise in the database development are used [29]. Some of the GIDAS content,
which is represented by an entire data table (e.g., tire data table, trailer data table) is limited to
the essentials and is described for the meta database by one variable (e.g., tire data, trailer data).
3.1. Structure and implementation
In general, the meta database only contains the existence of certain information in the data
sources through a binary coded variable. Raw data of the data sources are not included.
The main structure of the meta database is divided into two categories (Figure 5). The fact sheet
information on data sources are stored in the part “GENERAL INFORMATION”. Information on
the accident scenario, infrastructure data or vehicle information are inventoried in the “CONTENT”
part of the meta database. In general, each area consists of several tables, which are linked to
each other by a unique identification number (primary key) called “SOURCE_ID” and starting with
the number 1. Each data source has its own “SOURCE_ID“ and is assigned continuously without
restriction (i.e., by country/region or number of accidents per year).
Figure 5: Schematic structure of the meta database
143. Development of the meta database
The category “GENERAL INFORMATION” is mainly characterized by the tables
“01_DATA_SOURCES” and “02_FACT_SHEET”. The first mentioned table contain all important
information on the data source, for example in which country the data source is located and its
data provider. In addition to the type of data source (national or in-depth data source), this table
contain information on the database format and its access possibilities.
In comparison to table “01_DATA_SOURCES”, the table “02_FACT_SHEET” contains mainly in-
formation on the data size (e.g., cases per year), the coverage (e.g., investigation area) and the
beginning or ending of the accident investigation. It also provides an assessment of the repre-
sentativity of the data source as well as contact details.
The assessment of the representativity is often based on mathematical methodologies that com-
pare the investigated accident scenario with a higher-level or specific accident scenario (e.g.,
national data source). Based on the known sampling methodologies for the accident investigation
of the individual data sources, the representativity of the data sources can be assessed. Three
types of representativity are considered:
• data sources which achieve representativity by full sample survey (mainly police-recorded
data),
• data sources with large sample sizes and parameter ranges which allow for extrapolation
and thereby representative results and
• data sources with limited representatives.
Information on country-specific key figures is stored in table “03_COUNTRY_FACTS” and is
linked to the table “01_DATA_SOURCES” by the “COUNTRY_ID”. Each country and each conti-
nent has its own “COUNTRY_ID“. In addition to the number of inhabitants, the table also include
the number of all road traffic accidents. The researched accident numbers based on national
statistics or the latest global status report on road safety from the World Health Organization
(WHO) [32]. The published year of the statistics is also included.
Furthermore, the following (annual total) numbers are stored here:
• Accidents with personal injuries
• Accidents with fatalities
• Total number of fatalities in road traffic accidents
In order to ensure comparability between countries, the death rate per one million inhabitants and
the year of data origin are given in the country fact table.
The methodology and which investigation tools are used for the accident collection are stored in
the table “04_CONTENT”. The table “05_INVESTIGATION_TEAMS” provides the opportunity to
add further information on the investigation units by the user. Furthermore, the table “05_INVES-
TIGATION_TEAMS” is the only table with a second primary key (second data level), because one
data source can be investigated by several investigation units (e.g., GIDAS, CIDAS). Based on
the table “02_FACT_SHEET”, the table “05_INVESTIGATION_TEAMS” collects general
153. Development of the meta database
information on the research units, such as the coverage, the accidents per year or investigation
period (start or end of the investigation).
The tables with general information are directly connected to the “CONTENT” of the data source,
which is based on a similar structure as GIDAS. The table “11_ACCIDENT_DATA” includes all
characteristics of the accident which are necessary to answer general questions on the accident
scenario. Further information on the accident participants and the kind of road users (e.g., vehicle
or pedestrian) are stored in the table “12_PARTICIPANT_DATA”.
The table “13_PERSONAL_DATA” contains general information on the persons that are involved
in the accident, independent of the kind of road users. In addition to the physical characteristics
of persons, the table “13_PERSONAL_DATA” contains information on the usage of a seatbelt, a
helmet usage or worn protective clothing.
Information on data of single injuries are stored in the table “14_INJURY_DATA”. Parallel to the
information on the single injury types, the injury localization and the injury causes, the injury se-
verity according to time-based definition and the abbreviated injury scale (AIS) are stored. The
definition for the time-based injury severity is described in the section 2.1.6 - Definition of the
injury severity”.
The AIS is an anatomical-based coding system and represent the threat to life associated with
the injury. The entire AIS code is defined by the type of injury, the location, and the injury severity.
The AIS injury severity code is determined by a scale of one to six, whereby AIS=1 represents a
minor injury and AIS=6 represents an untreatable injury [30]. The coding of the AIS according to
various update year (e.g., AIS 1998, AIS 2008, AIS 2015) is also included in the meta database.
If data sources contain information on infrastructures, road types or road conditions it is entered
in table “15_ROAD_INFRASTRUCTURE”. Information on view obstacles, traffic signs and speed
limit is also stored in the road and infrastructure table.
The table “16_VEHICLES_DETAILS” contains all general vehicle information. Specific infor-
mation on the different vehicle types is stored as one variable per vehicle type (e.g., car details,
truck details, PTW details). In addition to the general information of the vehicles, information on
damage and deformation is also stored in the vehicle table. Damage to the vehicles is determined
by visual inspection. In contrast, deformation is based on measured values that indicate the depth
or bulge of the damage.
Parameters to evaluate the crash constellation are mainly based on reconstruction data of the
accident scenario. Typically, for in-depth data sources, the most accident scenarios are rebuilt by
computer-based software. Consequently, important information for the pre-crash and in-crash
phase are generated. The information on the existence of such reconstructed data is stored in
the table “17_COLLISION_DATA”. Describing variables for the crash constellation as well as in-
formation on the initial speeds or collision speeds are also part of this table.
For the evaluation of active safety systems, information on the pre-crash phase is necessary.
After the reconstruction of the accident scenario, time-based parameters and data are generated
via simulation tools to describe the pre-crash phase more in detail. The information on the
163. Development of the meta database
existence of pre-crash data is stored in the table “18_PRE_CRASH_DATA”. If a data source con-
tains video sequences of the accident scenario, this information is also stored in the pre-crash
table.
Information on installed active or passive safety systems in vehicles are important for the assess-
ment and evaluation of such systems. Accordingly, the information on the existence of vehicle
safety systems in a data source is stored in the table “19_SAFETY_SYTSEMS”. In addition to the
information on existence of safety system, it is also important to know whether the safety systems
were activated or not during the crash phase. Information on the activation status of safety sys-
tems is also stored in the table “19_SAFETY_SYSTEMS”.
Based on the above explained schematic structure, the meta database structure is transferred
into a Microsoft® Access® database format (.mdb) (Figure 6). Microsoft® Access® is a database
management system for medium-sized databases and can be accessed via queries based on the
Structured Query Language (SQL) or other programming languages.
Figure 6: Structure of the meta database in Microsoft® Access®
173. Development of the meta database
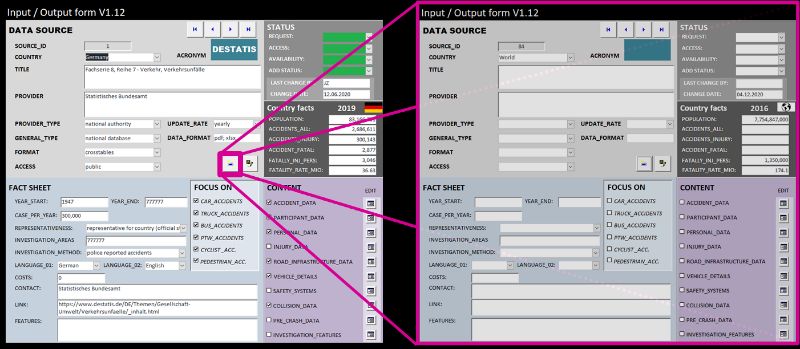
Information about the researched data sources could be entered by using an input mask, which
is directly linked to all data tables. Furthermore, this mask services as output formular (Figure 7).
Figure 7: Input / Output mask for the researched data sources
The main page of the input / output mask shows the general information on the researched data
sources (light grey box) and the associated fact sheet information (blue box). In addition to the
status box (upper right box), the country facts below provide information on the accident scenario
by each country according to latest researched statistic. The content box (violet box) gives an
overview of the available content for each data source.
Several input masks on the lower right side of the content box offer the possibility to enter data in
the specific content table (e.g., “10_ACCIDENT_DATA”, “11_PARTICIPANT_DATA”). Each but-
ton is directly linked to a separate input mask for the respective input table.
183. Development of the meta database
In total, the meta database contains 15 data tables and 10 in-/output masks. Parallel to the meta
database development, a codebook for the description of 237 variables contained in the meta
database has been developed.
3.2. Codebook
For the description of the tables with several variables and parameters a codebook is set up. The
basis of the codebook is the GIDAS codebook [28] with the following three tables/categories
• RECORDS,
• VARIABLES and
• LABELS.
The table “RECORDS” contain the descriptions of all the tables in the meta database. The content
of the tables is defined by variables and these are described in the “VARIABLES” table. The
specifications of the variables are called labels, and these are explained in the “LABELS” table.
The connection between the tables is not directly linked by one common primary key (Figure 8).
Each table contains its own primary key, which can also be found in the subordinate table.
Figure 8: Structure of the codebook
Most variables in the meta database are defined by a binary code. The binary code 1 describes
that an information is available in the data source. In contrast, the binary code 0 describes that
an information is not available in a data source. Furthermore, some variables are more specified
by further labels because the anticipated objective quality assessment for a data source based
on the existence of an information alone is insufficient (e.g., representativity).
Variables, that must be extended either in the description or by further labels, are mainly identified
in the answering of the questionnaire. For this purpose, the top 50 variables are described in more
detail or are extended by additional labels in the codebook. The top 50 variables are determined
by the number of times a variable is used to answer the 197 questions (Table 2). Superordinate
variables (e.g., ACCIDENT_DATA, PARTICIPANT_DATA) are not included into the list.
193. Development of the meta database
Table 2: Top 50 variables from the answering of the questionnaire
Number of binary code 1
Ranking Variable Short description
(necessary for the answering)
1 INITIALSPEED Initial speed 37
2 ACCTYPE Type of accident 34
3 COLLSPEED Collision speed 34
4 ACTIVE_SYSTEMS Active safety systems available 25
5 ACCSEVERITY Overall/Maximum accident severity 24
6 VEHTYPE Vehicle type 23
7 PRECRASHPHASE Information on the pre-crash phase 23
8 PARTTYPE Type of participant 21
9 MANOEUVRE Maneuver of the participant before the accident 21
10 CDC Application of force during the crash (CDC coding) 21
11 CAUSATION Information about (main) accident causes 19
12 COLLSIDE Crash side of the vehicle or pedestrian 18
13 REPRESENTATIVENESS Representativity 17
14 NRCOLLISIONS Number of collisions 17
15 AEB_SYSTEM Autonomous emergency braking 17
16 INJ_SEVERITY Injury severity according to OEDC definition 15
17 COLLPOINT Collision point (measured value) 15
18 CRUISE_CONTROL Cruise control system 15
19 LDW Lane departure warning 15
20 SINGLE_INJURIES (General) availability of data for single injuries 14
21 INJCAUSE Injury caused by 14
22 PASSIVE_SYSTEMS Passive safety systems available 14
23 BSM Blind spot monitor 14
24 ACCKIND Kind of accident 13
25 DECELERATION Deceleration or Acceleration 13
26 EES Energy Equivalent Speed 13
27 DELTAV Differential velocity 13
28 ACCTYPEA Participant A according to accident type 12
29 ACCTYPEB Participant B according to accident type 12
30 INJTYPE Injury type 11
31 ESC Electronic stability control 11
32 EDR_DATA EDR information 10
33 CAUSER Main causer of the accident 10
34 INJ_SEVERITY_MAIS Injury severity according to MAIS 10
35 ABS Anti-lock braking system 10
36 AEB_ACTIVE Autonomous emergency braking active 10
PHOTOGRAPHIC_DOCU-
37 Photographic documentation 9
MENTATION
38 LOCATION Accident location 9
39 PARTCAUSE Accident causations for each participant 9
40 INCRASHPHASE Information of the in-crash phase in an accident 9
41 ATTENTION_ASSIST Attention assistance 9
42 AUTOMATION_LEVEL Automation level 9
43 CASE_PER_YEAR Numbers of accidents per year 8
44 SEATPOSITION Seat position / seat adjustments 8
45 VRUIMPACT Impact of VRUs 8
46 INJCOLL Injury caused collision 8
47 MAKE Vehicle brand 8
48 MODEL Vehicle model 8
49 BODYTYPE Body type of the vehicle 8
50 CRASHWEIGHT Crash weight of the vehicle 8
20You can also read


