NUTRITION INFORMATION IN ROUTINE REPORTING SYSTEMS - A Landscape Analysis for UNICEF's Eastern and Southern Africa Region
←
→
Page content transcription
If your browser does not render page correctly, please read the page content below
10,000

8,000

6,000

4,000
         Jan   Feb   Mar   Apr   May   Jun     Jul   Aug    Sep   Oct   Nov   Dec

                             2017       2018         2019

   NUTRITION INFORMATION IN
   ROUTINE REPORTING SYSTEMS
  A Landscape Analysis for
  UNICEF’s Eastern and Southern Africa Region
Acknowledgements

This report was prepared by UNICEF’s Eastern and Southern Africa Regional Office.

Contributors
This Landscape Analysis was led by Norah Stoops, for UNICEF Eastern and Southern Africa
Regional Office in collaboration with Joan Matji, Mara Nyawo, Grainne Moloney, Kudakwashe
Chimanya and Marjorie Volege (Nutrition Section), Maria Muniz and Braeden Rogers (Health
Section) and Sean Blaschke (T4D).
This Landscape Analysis would not have been possible without the support and engagement
of the countries in the Eastern and Southern Africa Region who gave their time and expertise
to answer our many questions about their nutrition information system. Special thanks go
to Ministry of Health HMIS staff and nutrition department staff as well as to HISP and WHO
staff and UNICEF country office staff in all 21 countries in the region. We especially thank
the countries who opened up their information systems for review. This has facilitated
the development of the recommendations in this report that, it is hoped, will support
improvements to data availability and use across the region and beyond.
This report was made possible with the financial support of USAID Food For Peace and the
Government of the Netherlands.

© United Nations Children’s Fund (UNICEF)

April 2020

Permission is required to reproduce any part of this publication. Permissions will be freely
granted to educational or non-profit organizations.

Please contact:
United Nations Children’s Fund
Eastern and Southern Africa Regional Office
P.O. Box 44145 Nairobi, Kenya 00100
Telephone: (254) 20-76 22226 | Facsimile: (254) 20-76 22078

Suggested citation:
United Nations Children’s Fund, Nutrition Information in Routine Reporting Systems:
A Landscape Analysis for UNICEF’s Eastern and Southern Africa Region, UNICEF Eastern and
Southern Africa Regional Office, 2020.

Cover graph: Cover graph shows National level child admissions for severe acute
malnutrition (6months – 5 years) 2017-2019, from a medium-burden country in the Eastern
and Southern Africa Region.
NUTRITION INFORMATION IN
ROUTINE REPORTING SYSTEMS
A Landscape Analysis for
UNICEF’s Eastern and Southern Africa Region

                                A Landscape Analysis for UNICEF’s ESAR | 2019   3
©UNICEF-UGA-2012-Sean Blaschke

4   Nutrition Information in Routine Reporting Systems
Contents

Acknowledgements								8
Acronyms										9
Glossary										10
Executive Summary								12
1. Introduction									14
     1.1   Health Management Information Systems (HMIS)				                              15
     1.2   Use of DHIS2 Platform in ESA Region					                                      16
     1.3   Terminology									                                                          16
     1.4   The Planning and Information Cycle						                                      17
     1.5   DHIS2 skill-sets required							                                              18
2. Methodology									19
3. Findings										21
     3.1 Nutrition Information System environment					                          21
     3.1.1 Nutrition Policy								                                             21
     3.1.2 HMIS and Nutrition collaboration and Technical Working Groups (TWG)
     in MOH										                                                           21
     3.1.3 Parallel and Supplementary information systems				                   22
     3.2 Access to DHIS2 and Use of Data						                                  24
     3.2.1 Access to DHIS2								                                              24
     3.2.2 Dashboards									                                                  24
     3.2.3 Indicators and Data Elements						                                   26
     3.2.4 Report generation in DHIS2							                                    31
     3.2.5 Use of Information								                                           31
     3.2.6 Patient Level Data								                                           32
     3.3 Quality of data in DHIS2							                                        34
     3.3.1 Applications (apps)								                                          34
     3.3.2 Data Quality									                                                35
4.   Promising practice								37
5.   Challenges									39
6.   Recommendations								40
7.   Conclusion									42
8.   Annexes										43
     8.1 Table of recommended indicators and data elements			                            45
     8.2 Landscape questionnaire							                                                  50
     8.3 Summary table of Nutrition results per country				                              53
     8.4 Data elements and/or indicators collected per country			                        54
     8.5 List of country reports								                                                 55

                                               A Landscape Analysis for UNICEF’s ESAR | 2019   5
Tables

                Table 1: Methods used to collect Landscape Analysis information			               19
                Table 2: Scheduling for review of nutrition indicators				                       21
                Table 3: Parallel systems								                                                22
                Table 4: Access to DHIS2 and availability of nutrition dashboards			             24
                Table 5: Relationship between Data Elements and Indicators			                    26
                Table 6: Examples of poor and best practice for data element naming convention 27
                Table 7: Examples of poor and best practice indicator naming conventions         28
                Table 8: Indicators collected								                                            28
                Table 9: Vitamin A supplementation, routine supplementation, per semester        29
                Table 10: Vitamin A supplementation 2 dose average annual coverage		             30
                Table 11: Vitamin A coverage, Country Y – example of re-calculation of indicators 31
                Table 12: Use of data								                                                    31
                Table 13: Version of DHIS2 in use (at the time of the Landscape Analysis)		      34
                Table 14: Applications that should always be available in any DHIS2 instance     35
                Table 15: Number types used for Data Elements					                               36
                Table 16: Nutrition information capacity and support				                         37
                Table 17: Dashboard objects used in South Africa					                            38

6   Nutrition Information in Routine Reporting Systems
Figures

Figure 1: Use of DHIS2 across UNICEF Eastern and Southern Africa Region                  16
Figure 2: The planning cycle								                                                     17
Figure 3: The information cycle							                                                   17
Figure 4: Example of dashboard for Nutrition					                                        25
Figure 5: Example of dashboard objects (from Child and Nutrition Dashboard
used for training)									                                                  25
Figure 6: Vitamin A 12-59 months coverage over 10 years, Country X		                     30

Boxes

Box 1: Use of a supplementary information system in Tanzania			                          23
Box 2: Gender disaggregation – an alternative to collecting disaggregated data           27
Box 3: Use of the Patient Tracker App in Botswana					                                   32

                                               A Landscape Analysis for UNICEF’s ESAR | 2019   7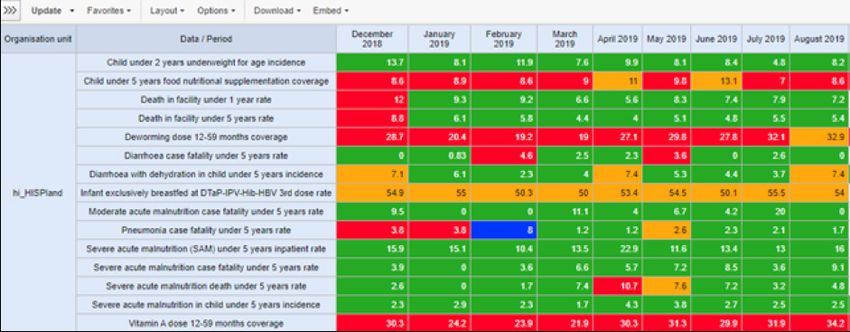
Acknowledgements

                This Landscape Analysis would not have been possible without the support and
                engagement of the countries in the Eastern and Southern Africa Region who gave
                their time and expertise to answer our many questions about their nutrition information
                system. Special thanks go to Ministry of Health HMIS staff and nutrition department staff
                as well as to HISP and WHO staff and UNICEF country office staff in all 21 countries in
                the region.
                This Landscape Analysis was lead by Norah Stoops, for UNICEF Eastern and Southern
                Africa Regional Office in collaboration with Joan Matji, Mara Nyawo, Grainne Moloney,
                Kudakwashe Chimanya and Marjorie Volege (Nutrition Section), Maria Muniz and Braeden
                Rogers (Health Section) and Sean Blaschke (T4D).
                We especially thank the countries who opened up their information systems for review.
                This has facilitated the development of the recommendations in this report that, it is
                hoped, will support improvements to data availability and use across the region and
                beyond.

8   Nutrition Information in Routine Reporting Systems
Acronyms

App			Application
CO			         (UNICEF) Country Office
DHIS2		       District Health Information Software version2
DQ			         Data Quality
ESA(R)		      Eastern and Southern Africa (Region)
ESARO		       Eastern and Southern Africa Regional Office for UNICEF
GAVA			       Global Alliance for Vitamin A
GMP			        Growth Monitoring and Promotion
HIV			        Human Immunodeficiency Virus
HISP			       Health Information Systems Program
HMIS			       Health Management Information System
HQ			         Headquarters
IMAM			       Integrated Management of Acute Malnutrition
LOU			        Letter of Understanding
MoH			        Ministry of Health
MUAC		        Mid-upper arm circumference
M&E			        Monitoring and Evaluation
NA			Not Applicable
OPD			        Outpatient Department
PMTCT		       Prevention of Mother to Child Transmission
RO			         (UNICEF) Regional Office
T4D			        Technology for Development
TOR			        Terms of Reference
TWG			        Technical Working Group
WASH			       Water, Sanitation and Hygiene
WCA			        West and Central Africa
WHO			        World Health Organisation
WHO DQ Tool   World Health Organisation Data Quality Application
UNICEF		      United Nations Children’s Fund

                                         A Landscape Analysis for UNICEF’s ESAR | 2019   9
Glossary

                 Apps (in DHIS2): These are custom made software applications that can be used to
                 view the data in DHIS2. Pivot Tables are generated using an app. Charts and maps also
                 use apps. There are other apps that can help with viewing how DHIS2 is constructed.
                 The Indicator Search will show how an indicator is constructed, the HMIS dictionary will
                 show all the Data Elements in the DHIS and the WHO Metadata browser shows both
                 data elements and indicators and their respective groups. An important Data Quality App
                 is the WHO Data Quality Tool that shows reporting completeness, reporting timeliness,
                 outliers and missing data.
                      Scorecard App: Designed to show comparisons across facilities/districts/etc for
                      selected interventions. The use of traffic-light colour coding of cells to highlight good,
                      needing improvement and not doing well is also part of the Scorecard App.
                      Bottleneck Analysis App: Based on the Tanahashi model allows analysis of
                      interventions using selected tracer indicators to identify where bottlenecks are
                      occurring in the health system. Once configured, the App allows for automated
                      bottleneck analysis, producing the standard bottleneck analysis graphs with current
                      data as available in the DHIS2.
                      Action Tracker: Allows selection and tracking of actions identified to address
                      bottlenecks.
                 The Scorecard, Bottleneck Analysis and Action Tracker Apps have been developed by
                 University of Oslo and HISP Tanzania with support from UNICEF and are now available to
                 download and use within DHIS2.
                 Count Indicator: This indicator only adds up raw numbers, it counts or adds up gender
                 and age disaggregation. This usually uses category combinations and the denominator
                 is 1.
                 Configuration of indicators: Indicators need to be configured in DHIS2. This
                 configuration is the process of assigning the correct numerator, denominator and
                 multiplication factor.
                 Configuration: A change to the DHIS2 platform that can be locally implemented and
                 managed i.e. by MOH Government team. It requires no new software development.
                 Examples of configuration include creating new nutrition indicators or setting up a
                 nutrition Dashboard. UNICEF supports systems that are highly configurable as this
                 allows countries the flexibility to adapt the system to their needs.
                 Customisation: A change that requires a software engineer to change or add underlying
                 code in the DHIS2 software itself. This usually cannot be done by MOH teams and
                 requires on-going technical support for future functionality and up-grades. UNICEF does
                 not usually support customization as this has implications for sustainability of the system.
                 DHIS2: Free and open source software used as well as individual patient data in many
                 low- and middle-income countries globally. It is the HMIS software used in 20 of the 21
                 countries in ESARO
                 Data element: This is the term used to describe either numerator or a denominator.

10   Nutrition Information in Routine Reporting Systems
This is raw data and is mainly observations of events, for instance how many children were screened
using MUAC. The actual raw data values are captured according to each data element. An example
would be Antenatal client 1st visit. This can become the numerator for ANC 1st visit coverage and
the denominator for Antenatal client tested for HIV. Aggregate data elements are normally used for
routine data.
Dataset: A group of data elements that are put together on a form for data capture. It could be a
reporting form that is made electronic, so it is the same as the paper data collection tool. A Dataset is
assigned to facility together with frequency of reporting so that data can be captured.
Event data: Event data is anonymised data that is captured on both routine and non-routine basis. It
can capture single events, like a training report, with details like participant numbers, gender and age
split etc. There is no patient or client identifier attached.
HISP: Health Information Systems Programme – a network of DHIS experts with links to the University
of Oslo with local offices (nodes) in 10 countries: South Africa, India, Tanzania, Uganda, Rwanda,
Nigeria, Vietnam, Norway, Kenya, Malawi.
HMIS: Health Management Information System is the systems and processes whereby a country
defines what information it wants to collect and report on in either a paper and/or electronic format.
This can be routine aggregated data or individual patient data. The time period for data collection can
range from daily, weekly, bi-weekly, monthly, quarterly and yearly. The HMIS reports on activities that
range from household, community, facility, sub district and higher.
Indicator: Measure of performance, usually a rate or percentage or proportion. It has a numerator and
a denominator and a factor, either a 100% or other value specifically if population is used. Indicators
are generally annualised when the denominator is a population figure. The numerator is multiplied by
12 and gives the result as if this was the figure for the year. An example would be Antenatal client
1st visit coverage.
DHIS2 Instance: The national DHIS2 database in a country is called a ‘live’ or ‘production’ instance.
A country should also have training instance which is used for training purposes. For testing purposes,
a Testing or Sandbox instance is used. This prevents using the national production instance being
used for purposes other than pure data capture and analysis.
Metadata: This is the term used to describe all the indicators, the data elements, the various indicator
and data element groups, the validation rules and the organisational hierarchy. It is data about data.
Numerator and Denominators: Indicators have a numerator and denominator; the numerator is
the figure on top and the denominator is the number at the bottom of the calculation. It can be data
that is captured monthly, as in Antenatal Client 1st visit or a population figure like population 0-11
months which is only entered yearly.
Organisational Hierarchy: The list of service delivery points/facilities captured in the DHIS2 that
are organised into hierarchical geographic units: sub-district/district/counties/provinces/states/regions/
national. Facilities are grouped according to a geographical area and according to Facility Type. This is
used in data analysis when services and performance can be compared according to both geographical
and facility type.
Relative period / fixed period: Data analysis is also done according to time. A fixed period refers
to data displayed for a specific time period. Quarter 1 of 2019 will only show data for that specific
fixed period. A relative time period is more flexible and changes as the calendar advances. Quarter 1
2019 can be the last quarter if the current calendar data is April 2019, but if the date is August 2019,
the last quarter is Quarter 2 of 2019.
Technical staff: this refers to Information Technology staff who are highly skilled in terms of ICT
(Information and Communication Technology). This is generally the staff who work with the more
technical aspects of DHIS2, this would include server support and version upgrade.
A Landscape Analysis for UNICEF’s ESAR | 2019 11Executive Summary
UNICEF plays an important role in supporting Ministries of Health to collect reliable
and timely nutrition and health data through national health management information
systems (HMIS). Improving data and information systems and supporting improvements
to the HMIS is an area of focus in UNICEF’s approach to health systems strengthening,
contributing to health systems that close the equity gaps in maternal, new-born, child
and adolescent health and nutrition, and work towards Universal Health Coverage. The
availability of timely and reliable nutrition and health information supports the development
of health-related policies, strategies, plans and budgets at national level and improves
decentralized capacity for management. Further, this provides the necessary information
for evidence-based prioritisation, resource allocation and monitoring and evaluation. Data
availability at a local level (i.e. facility or district) allows for local decision-making, course
corrections and improvements to interventions.
With this background, a landscape analysis of the status of nutrition information reported
through the national HMIS and the DHIS2 platform was carried out across UNICEF’s
Eastern and Southern Africa region, including all 21 countries. The status of nutrition
information systems in the Ministries of Health was reviewed. Fourteen countries were
physically visited, with others were contacted remotely.
Discussions were held with UNICEF staff, and in the Ministries of Health, where possible
with both the Nutrition and HMIS teams. A questionnaire was sent in advance and a
group discussion took place. All countries reported a Nutrition policy in place with most
policies current or currently being updated. The relationship between the Nutrition unit
and the HMIS team was generally governed through a Technical Working Group. The
process of updating Nutrition indicators, data collection tools and the HMIS itself was
not always well defined. Several countries had a routine review process in place, others
reviewed on an ad-hoc basis while some were updating the HMIS system for the first
time in 5 years or more.
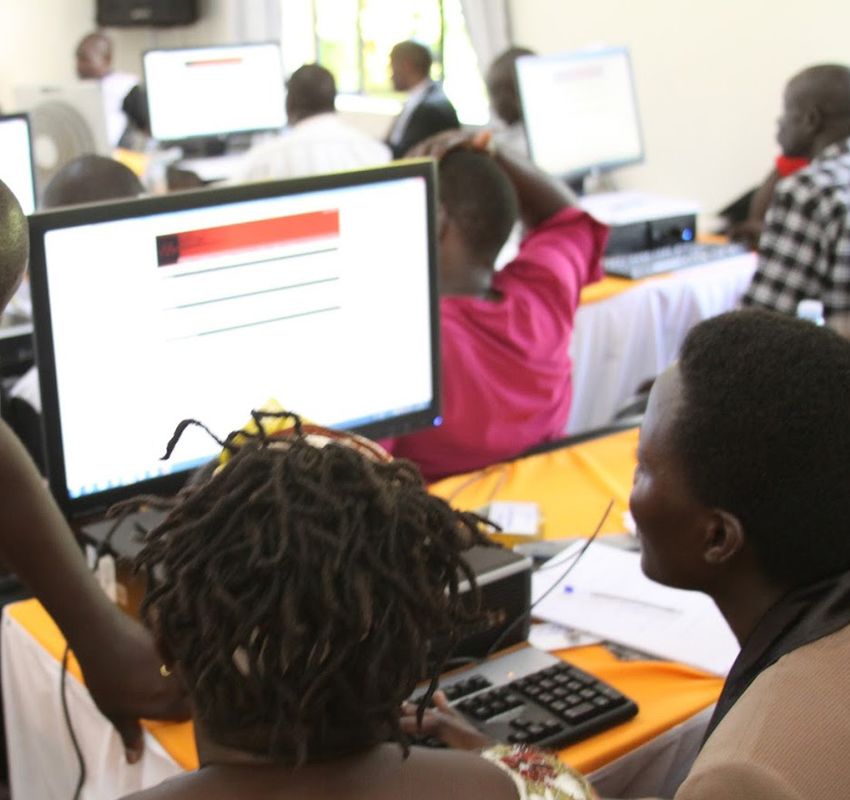
In most countries UNICEF staff were able to access DHIS2. Ten of the twenty-one
countries either do not provide access to UNICEF and partners or have a complex
mechanism of allowing access. In Areas/Units/Departments where UNICEF staff were
given access to DHIS2, they were very comfortable with manipulation of DHIS2 and in
some countries staff have been successfully deployed to the Ministry of Health Nutrition
Unit with support from UNICEF. Further, in addition, in some countries, UNICEF is working
closely with Ministries of Health to strengthen the integration of nutrition information into
routine reporting systems, to improve the quality of the data available and to facilitate the
regular use of data to improve programme performance across the countries in the ESA
region
The use of DHIS2 for Nutrition reporting was carefully examined. Many countries are
collecting large amounts of data, and this impacts on data quality. Not all the data
collected is converted into indicators. The Sphere Standard indicators used for measuring
quality of the Integrated Management of Acute Malnutrition (IMAM) were not always
correctly defined. As there was no standard list of nutrition indicators, countries varied
in how they collected and reported data. It was also observed that there were problems
with DHIS2 configurations giving incorrect indicator values. Therefore, support is needed
for countries to assist them to design improved data collection tools and reporting forms
12 Nutrition Information in Routine Reporting Systemsand their configuration/ set up in DHIS2. Issues with data quality were also noted in terms of incorrect
configuration of indicators, with no adherence to best practice conventions for data element and
indicator naming, among others (see detail in section 6.2.3). Across the region, there was limited use
of dashboards that would show current nutrition program status and support actions and decision
making, suggesting that use of the data collected in the DHIS2 is not optimal. Within UNICEF there
appears to be a high degree of use of data/information for program planning and decision making,
however this is not always translated into good use of data by the nutrition programs in MOH.
Recommendations for UNICEF and Ministries of Health include developing a list of standardised
indicators with data elements and providing support to countries when it comes to revising indicators
and datasets in DHIS2. It is also recommended that there be improved presentation of country data
in the form of dashboards to allow easy review of key information at all levels (national / regional /
district). Capacity building for both UNICEF and MOH Nutrition staff in using DHIS2 is important so
that maximum use can be made of the routine HMIS and the rich information it can provide.
A Landscape Analysis for UNICEF’s ESAR | 2019 13r Apr
2017
May Jun
2018
1
Jul Aug
2019
Sep
Introduction
Oct Nov Dec
Accurate and timely nutrition information is crucial for monitoring programme
performance and tracking progress against national and global targets on a regular basis.
It is further crucial for monitoring coverage of interventions in order to highlight key areas
for improvement, and advocate for and justify fund allocation. A strong routine data
reporting system is one of the building blocks of a well-functioning health system and is
a key area of work for health systems strengthening and a key focus for UNICEF support
in order to build more resilient health systems.
Nutrition information is not always captured through national routine information systems
in the health ministries. This makes it difficult to track and evaluate progress made
against nutrition targets at central as well as decentralised levels, resulting in lack of use
of nutrition data for programme performance improvement. As a first step to support the
better reporting of nutrition data in national routine information systems as well as use of
that data for evidence-informed programme improvements and course corrections in the
Eastern and Southern Africa region, UNICEF Regional Office commissioned a landscape
analysis of the use of DHIS2 for nutrition programming in the region.
The focus of the landscape analysis was:
• To assess the status of capture of nutrition information through routine systems
(the National Health Management Information System – HMIS) and the use of
DHIS2 for routine nutrition information reporting and analysis.
• To inform how UNICEF can better support government-led national improvements
to the routine HMIS.
• To contribute to building both a global and regional standard set of indicators
recommended to be monitored through the routine information system.
The Landscape Analysis was carried out between February and November 2019 for all
twenty-one countries in UNICEF’s Eastern and Southern Africa Region (ESAR). The HMIS/
DHIS2 was reviewed for 16 of the 21 countries, either in-person (through an in-country visit)
or remotely, and the findings are summarised in this report. To complete the Landscape
Analysis, countries responded to a detailed questionnaire (Annex 8.2). Responses were
provided by both UNICEF and Ministry of Health colleagues, and responses were collected
in person through meetings in 14 countries1, and remotely via email and skype calls in two
countries2. Five countries did not complete the full Landscape Analysis questionnaire,
these were Comoros (who are in the process of converting to DHIS2), Botswana, Eritrea,
Somalia and Zambia who all provided key information through a summary spreadsheet
that is included in Annex 8.3. A country-specific report was produced for each HMIS/
DHIS2 that was reviewed, with country-specific recommendations for improvement (a
list of reports available on request is provided in Annex 8.5).
This report presents some background information around DHIS2, documents the
methodology used for the landscape analysis, presents the findings including examples
of best practice and sets out the key recommendations for improving reporting and
use of nutrition information in the Eastern and Southern Africa region. The Landscape
Analysis looked at the use of the DHIS2 platform aggregate function which concentrated
1
Angola, Burundi, eSwatini, Ethiopia, Kenya, Lesotho, Malawi, Mozambique, Namibia, Rwanda, South Africa, Tanzania, Uganda, Zimbabwe.
2
Madagascar and South Sudan.
14 Nutrition Information in Routine Reporting Systemson data entry and analytics. The systems Microsoft Access and linked Excel Pivot Tables.
assessed for this report all refer to the routine This concept was adapted by the University of
monthly health information reporting that most Oslo Informatics Department and converted
countries should have in place. It does not to become an internet-based database in pilot
refer to disease surveillance, record reviews or countries and finally reached an advanced stage
other methodologies related to monitoring and with a full roll-out in Kenya in 2010. This set the
evaluation. stage for it to become the leading free and open
source software platform used by an increasing
1.1 Health Management number of low- and middle-income countries as
Information Systems (HMIS) a mechanism for handling capture, management
and visualisation of routine data (aggregate,
All 21 countries have an HMIS Unit embedded event and more advanced patient-level data
in the Ministry of Health. The Monitoring and using DHIS2 Tracker). It is now used by 67 low
Evaluation Unit may be part of the HMIS, or may and middle-income countries, including national-
be separate, and the people responsible for the scale deployments in 46 countries and pilot
actual configuration of DHIS2 are often situated programs in 21 countries3. Use of DHIS2 is
in another section – usually an Administrative supported by the Health Information Systems
section for Management Services within the Programme (HISP), which is a global action
Ministry of Health. Nutrition Unit programme research network first established in South
teams may or may not have their own Monitoring Africa and supported by the University of Oslo,
and Evaluation staff, and how they interact with now with ‘nodes’ in 10 countries.
the HMIS Unit is also not always clear. This split
of roles and responsibilities at times results in a The use of applications (apps) like the Scorecard
disjointed approach to revision of indicators and app, Bottleneck Analysis app and Action Tracker
correction of any DHIS2 configuration errors and app together with the dynamic and interactive
can affect the smooth functioning of the whole dashboards that can be generated using
health information system. information available within DHIS2 instances
simplifies the process of data synthesis,
DHIS2, District Health Information Software visualization and use for planning, performance
version 2, is a relational open source, web- management and accountability purposes.
based health management information system The apps support end users to assess system
(HMIS) platform built on Postgres that requires performance using routine information sourced
connectivity, (i.e. the internet) to be able to be from DHIS2 and other systems, and then to
accessed and used. It is a generic platform that use this information to prioritize and implement
supports a wide range of uses including beyond evidence-informed corrective action. Over time
the health sector. The software supports many applications (apps) have been developed
capture, management and visualization of routine to expand the functionality of the core platform
data (aggregate, event, and case based). It was of DHIS2. They can be downloaded and installed
initially developed in South Africa in 1998 using instantly.
3
DHIS2 in Action: https://www.dhis2.org/inaction
© UNICEF239942
A Landscape Analysis for UNICEF’s ESAR | 2019 151.2 Use of DHIS2 Platform in ESA Region
Figure 1: Use of DHIS2 across UNICEF Eastern and Southern Africa Region
Nineteen of the twenty-one
countries in UNICEF’s Eastern
and Southern Africa Region
(ESAR) use DHIS2 as the
platform for data management
and use. Of the remaining two,
one is currently converting to
DHIS2 (Comoros), while one
country (eSwatini) uses a patient-
based system for data collection
with analysis and output reports
are still in the process of being
developed. The setup, hosting
and configuration of DHIS2 can
be a complex task, with a large
degree of technical skill required.
Some countries have not
included all the relevant nutrition
data into DHIS2, and this has
led to parallel information flows.
In all these countries there is a
process to move all the data
being captured in a parallel
system into the routine data into
DHIS2.
There are 16 Anglophone countries in the region, where English (and Swahili) are used for the
DHIS2, 3 Francophone countries and 2 Lusophone countries. Ethiopia follows the Ethiopian calendar
as opposed to the Gregorian calendar which is used throughout the rest of the region.
1.3 Terminology raw data collected, as well as calculated values,
as indicators.
In HMIS, and in this report, an indicator is a
variable that has a numerator and denominator Once the set of indicators with numerators and
and uses a factor to get a result. This could be denominators is defined, they should be set up
a percentage, a ratio or per 1,000 population. in an electronic data handling system that will
Numerators and denominators are data capture, validate, analyse and provide reports
elements, which are displayed on reporting for program management and performance
forms. Count indicators are raw data that assessment. The electronic data handling
consists most often of the sum of gender and/ system most often used in UNICEF’s Eastern
or age disaggregation. There is often confusion and Southern Africa region is the District Health
about the meaning of terms such as ‘Indicator’, Information Software, Version 2 (DHIS2; see
with some programs referring (incorrectly) to all Figure 1).
16 Nutrition Information in Routine Reporting Systems1.4 The Planning and Information Cycle
Ideally, countries should develop a Health Information Systems Strategy, leading to an HMIS framework
which guides actions and activities. Having an essential indicator dataset to measure goals and
targets from the national strategic plan, is a crucial first step. This requires active participation from
all programs and the HMIS Unit. Each health program should define its goals, objectives, targets and
resulting indictors. In this process of defining indicators, the numerators and denominators should
also be defined.
Figures 2 and 3 show the steps in the planning cycle and the data handling process in the information
cycle. These two cycles complement each other – what information needs to be collected comes
from the Planning Cycle and then after the data has gone through the various stages in the information
cycle, it is used to monitor and evaluate if the targets that were set have been achieved.
Figure 2: The planning cycle
The Planning cycle defines the basis
for understanding how to measure
a program. The situation analysis
documents the current status in
a country, leading to decisions on
what needs to be achieved in terms
of goals, objectives, indicators and
targets. Actions are taken to achieve
these objectives and goals. The final
step of this cycle is to monitor and
evaluate if the set targets have been
achieved.
Figure 3: The information cycle
This cycle shows how data flows,
starting from the decisions on what
to collect – data elements that are
based on indicators, to data quality
checks, conversion to indicators,
presenting the data/information and
then using it to assess performance.
It is crucial to follow this process in order to adequate planning as to how the data will be
define what should be included in a national analysed. The process and rationale for the
HMIS. This Landscape Analysis found that, at design of the report can at times be to collect
times, the process used to define what should as much data as possible with insufficient
be collected starts with the development of a justification and forethought as to the use of
reporting form which collects raw data (data the data during analysis. For example, there
elements) that are captured in DHIS2 without were instances where there was no indicator
A Landscape Analysis for UNICEF’s ESAR | 2019 17definition or denominator available behind the (the list of facilities, sub-districts,
data elements that are being reported. This districts and provinces/states that each
results in bloated datasets (reported from a facility belongs to), data elements and
facility for a specific health program) that at times datasets against which data is captured,
contain very little information, (there are many customisation of indicators and validation
zeros reported) and therefore cannot be used in rules. This requires a high degree of
decision making. A further disadvantage of these technical skill plus a clear understanding
bloated datasets is that they require a larger of both DHIS2 and public health, as well
server space, which rapidly fills up, requiring as program specific knowledge.
more funds to purchase bigger servers. The
cost implications of these decisions are usually • DHIS2 is used by 2 main groups of health
not considered when designing data collection staff, the people who capture the data and
tools and reporting forms with detailed age and then validate it, and the managers who
gender breakdowns. A further result is wasted use the analytics aspects to interrogate
staff time and staff de-motivation in completing and understand program performance.
complicated data reports. There is a clear delineation between those who
regularly work with DHIS2 – the ‘techies’ (IT)
1.5 DHIS2 skill-sets required specialists, and the HMIS and Nutrition Unit staff.
There are different groups of people who use The ‘techie’ group is not always sited within
the DHIS2 at country level. These include: the HMIS Unit. This has the potential to create
tension and sub-optimal communication. It was
• Highly skilled Information Technology noted during this Landscape Analysis that the
(IT) specialists are required to be able technical IT staff who work with DHIS2 are sent
to provide hosting services, perform to various DHIS2 courses offered (for instance
version upgrading, system maintenance through the University of Oslo), however these
and other technical server related courses are seldom offered to the staff of the
issues. These specialists would ideally HMIS Unit, and even less to the Nutrition Unit
have a qualification (e.g. BSc / MSc or program staff. These differing roles at times
equivalent) in computer science. limited communication between these crucial
groups and the limited exposure of programme
• The HMIS team and the IT section may staff to the more technical issues around DHIS2
take responsibility for the configuration is likely contributing to some of the mistakes
of DHIS2 for in-country set-up, including found in the configuration of indicators and the
developing the organisational hierarchy, lack of indicators, despite the availability of data.
© UNICEF0310673
18 Nutrition Information in Routine Reporting Systemsr Apr
2017
May Jun
2018
2
Jul Aug
2019
Sep
Methodology
Oct Nov Dec
A Landscape Analysis questionnaire was developed with input from the UNICEF ESA
Regional Office nutrition and health sections as well as the T4D section. This was used
as a basis for discussions with country offices, and to collect a standard set of information
from each country in which it was applied. The questionnaire was sent electronically to
all 21 countries, along with an introduction of the work to be undertaken as part of the
Landscape Analysis.
In order to collect the information, country visits were made to 14 of the 21 countries in
the UNICEF ESA region. Country visits took between 2-3 days where meetings were
held with UNICEF Nutrition staff and where possible a meeting with Ministry of Health
Staff from the HMIS Unit and Nutrition Unit. Skype conference call was used for one
country, and the full questionnaire was completed via email for one country. Summary
information was collected from the remaining 5 countries (presented in Annex 11.3).
Table 1: Methods used to collect Landscape Analysis information
Country Methodology used Access to DHIS2
1 Angola Country visit & full questionnaire Training server
2 Botswana Summary spreadsheet completed via email None
3 Burundi Country visit & full questionnaire UNICEF user rights
4 Comoros Summary spreadsheet completed via Skype Not currently using DHIS2
call
5 Eritrea Summary spreadsheet completed via email Not currently using DHIS2
6 Eswatini Country visit & full questionnaire No DHIS2
7 Ethiopia Country visit & full questionnaire None
8 Kenya Country visit & full questionnaire User rights obtained
9 Lesotho Country visit & full questionnaire Admin rights obtained
10 Madagascar Full questionnaire completed via email None
11 Malawi Country visit & full questionnaire Admin rights obtained
12 Mozambique Country visit & full questionnaire UNICEF user rights
13 Namibia Country visit & full questionnaire * Admin rights obtained
14 Rwanda Country visit & full questionnaire Partial admin rights
15 Somalia Summary spreadsheet completed via email None
16 South Africa Country visit & full questionnaire User rights obtained
17 South Sudan Full questionnaire completed via Skype call Partial admin rights
18 Uganda Country visit & full questionnaire UNICEF user rights
19 Tanzania Country visit & full questionnaire None
20 Zambia Summary spreadsheet completed via email None
21 Zimbabwe Country visit & full questionnaire User rights obtained
*Country visit to Namibia was carried out by the UNICEF ESARO Nutrition Specialist
A Landscape Analysis for UNICEF’s ESAR | 2019 19Where possible access was obtained for viewing the countries’ DHIS2 instance, and this resulted
in a greater understanding of the use and set-up of DHIS for this review. A report was written after
each country visit, detailing the major findings and recommendations for improvement. This was sent
to the UNICEF Country Office for comments and any feedback was incorporated, after which a final
version was sent to the Country Office for dissemination to the Ministry of Health. Countries not
visited were sent a spreadsheet to complete in order to provide some basic details on the nutrition
information system.
©UNICEF-UGA-2012-Sean Blaschke
20 Nutrition Information in Routine Reporting Systemsr Apr
2017
May Jun
2018
3
Jul Aug
2019
Sep
Findings
Oct Nov Dec
3.1 Nutrition Information System environment
3.1.1 Nutrition Policy
All countries visited, or countries from which data was obtained, except one reported
that there was a nutrition policy in place. A nutrition policy was considered as either a
separate document or part of a national health strategy. The country that did not have a
nutrition policy has one under development however with no confirmation of where it will
be hosted, i.e. in the Ministry of Health or in the Premier’s office. All the Nutrition policy
documents had time frames, and most were up to date. Those that were out of date (4
out of 21) were in the process of being updated. Indicators and targets for Nutrition were
sometimes provided but there was seldom clarity around the source of the data, means
of verification, and what would be obtained from surveys, from routine systems or other
M&E data sources.
3.1.2 HMIS and Nutrition collaboration and Technical Working Groups
(TWG) in MOH
Table 2: Scheduling for review of nutrition indicators
Were the nutrition When is the next planned Is there an agreed
indicators updated national revision of DHIS2 timeline for national
within the last 3 indicators? revision of DHIS2
years indicators?
Angola Yes No set date No
Botswana Yes In progress Yes
Burundi Yes No set date No
Comoros Yes Will be reviewed during DHIS2 No
set-up in 2020
Eritrea Yes No set date No
Eswatini Not known Not known No
Ethiopia Yes No set date Yes
Kenya Yes No set date Yes
Lesotho Yes In progress to finalised by March Yes
Madagascar No No set date No
Malawi Yes No set date No
Mozambique In progress In progress No
Namibia No Rolling revisions on-going No
Rwanda In progress In progress No
Somalia No No set date Yes
South Africa Yes 2020 Yes
South Sudan Yes No set date No
Uganda Yes No set date Yes
Tanzania No Not known No
Zambia Yes Not known No
Zimbabwe No In progress No
A Landscape Analysis for UNICEF’s ESAR | 2019 21Most countries reported a close collaboration 3.1.3 Parallel and Supplementary
with the HMIS and the Nutrition Unit within information systems
the relevant MOH with mention that a lot of
the discussions occur within the TWGs for data Table 3: Parallel systems
and monitoring. The role of the Monitoring and Is there Is there a
Evaluation Unit was generally seen to be within a parallel supplementary
the broad ambit of the HMIS Unit. In some system for system for
countries there is a very slow process of adoption nutrition nutrition
of new reporting tools and inclusion of new data information? information?
elements and indicators that are required. It is Angola No No
also common to find that the responsibility of Botswana No No
the Nutrition Unit is limited only to developing
Burundi No No
a reporting tool with no further input required.
This results in the data being collected to enable Comoros Yes No
the creation of indicators; however, no indicators Eritrea Yes No
are created or configured in DHIS2. Eswatini Yes No
Ethiopia Yes Yes
There is no consistency in how often a country
Kenya No No
updates its national indicators and associated
data elements and reporting tools. While 16 Lesotho No No
countries reported that their DHIS2 indicators Madagascar Yes No
have been reviewed in the last 3 years or that Malawi No No
a review is currently in progress (Table 2), just Mozambique Yes No
two countries could say when their next review
Namibia No No
is scheduled, and 7 of 21 countries reported a
Rwanda Yes No
pre-agreed regular review process (every 2-3
years). These reviews are internally driven by Somalia Yes No
the Ministry of Health HMIS Unit, with varying South Africa No No
support from partners. This impacts on how South Sudan Yes No
and when DHIS2 is configured. Some countries Uganda No No
are currently in the first revision of their DHIS Tanzania No Yes
in the last 5 years. Just 6 of the 21 countries
Zambia No No
reported that there is an existing scheduled
process of updating the country indicator list, Zimbabwe No Yes
with associated changes required to what is A parallel information system is defined as
collected and reported. At times inflexibility the same data being collected separately through
and lack of clarity around schedules for indicator two systems and there are some countries
reviews and the process for introduction of where this is happening. Parallel systems are
newly required information results in the established when there is limited access to the
development of parallel reporting systems in national DHIS2 for reasons that vary between
order to be able to collect new information. countries. Most countries that have a parallel
Some countries were easily able to add in new system are actively working towards reducing
datasets and indicators, while for others getting the need for it and are moving towards one
any changes to the actual indicator configuration system for handling all routine data.
process was not easy. This is linked to the
availability of a formal indicator review process A supplementary information system is
with the process clearer in countries where this different from a parallel system and is defined
exists. As actual configuration, or creation, of an as an additional system that includes both
indicator can be a technically complex task, this routine health and nutrition data that is taken
work tends to remain with the DHIS2 ‘techie’ automatically from DHIS2, as well as other
technical team, who are not public health or types of data provided by other sectors such
program experts. This has resulted in errors as Agriculture, Trade, Education, or provided by
found in various DHIS country databases in other organisations including WFP and combined
terms of indicator construction. together onto a specific platform. An example
of this is a database keeping data related to
22 Nutrition Information in Routine Reporting Systemshealth, nutrition, food security and WASH. This It is recommended to use, where possible, the
database may or may not be hosted within the routine MOH system, however when there is
MOH and may or may not use DHIS2 as the a co-ordinated approach to needing other data,
platform. This database may also keep data that the use of a supplementary database can be
is not routine (i.e. that is collected from surveys useful. Tanzania is a good example where the
or other sources), and which does not fit into the DHIS2 is not accessible to outside partners and,
traditional format of aggregated data. UNICEF in order to have an information system that
Nutrition programs tend to want to keep these is useful, a supplementary system using the
supplementary information systems as they DHIS2 platform that is housed outside the MOH
are frequently easier to access and is possible has been created and is often referred to and
to have input into the design of them, including used.
what information to collect.
Box 1: Use of a supplementary information system in Tanzania
In Tanzania the HMIS includes some nutrition indicators and uses the DHIS2 platform, however
data is only available to partners to view through an on-line web portal which does not allow
for viewing data over long time periods, or to drill down to a level lower than the district.
Also, available data from the portal is limited. In order to establish a comprehensive system
for monitoring nutrition service delivery status, a Multisectoral Nutrition Information Platform
(MNIP) has been established, that is a complementary platform to the national HMIS, and
centralizes all nutrition information on one platform that is also housed in DHIS2. The aim of
this system is to have one common platform where all partners can access nutrition related
information equally and easily. The MNIP also aims to improve the quality and consistency of
the data while reducing the reporting burden for district staff through automating data linkages
within DHIS2 (from the HMIS) and from other information systems – such as between the
Ministries of Health, Agriculture, Water and Nutrition). Having data available in a timely way
and on an easily accessible platform will also ensure the ability for timely feedback to districts
to enable timely corrective actions where necessary. Data collected through the MNIP is
used for routine programmatic monitoring, for regular bottleneck analyses, for completing the
national scorecard on a monthly basis to track status of key indicators and for monitoring
annual workplan implementation.
©UNICEF-SUD2016-00011-Sari Omer
A Landscape Analysis for UNICEF’s ESAR | 2019 233.2 Access to DHIS2 and Use It was noted that 10 countries were not
providing user access for analytic purposes to
of Data DHIS2 for UNICEF Country Offices (at the time
3.2.1 Access to DHIS2 of the Landscape Analysis). In Rwanda if data
was required, the UNICEF staff would have to
Table 4: Access to DHIS2 and availability of visit the HMIS Unit and review in situ and then
nutrition dashboards download required data. In Tanzania UNICEF
staff were being referred to the Web Portal
DHIS2 Is there a where some of the DHIS2 data was available.
access for functioning However, this was unsatisfactory as the data is
partners dashboard limited, is in a fixed format and is generally not
with nutrition
timely. The definitions of the indicators were
indicators?
unknown and this limited acceptability of the
Angola Yes No data. Ethiopia is still working on a Data Access
Botswana No Yes Protocol and until then there is no formal DHIS2
Burundi Yes Yes access for partners. In South Africa a Data User
Comoros Not using DHIS NA Agreement is required, and this is granted for a
Eritrea Yes No
limited time period. It is recommended that a
Letter of Understanding (LOU) be developed that
Eswatini Not using DHIS No
could be used as the basis for giving permanent
Ethiopia No No access to DHIS2 instances for UNICEF or
Kenya Yes No partners. This LOU could add limitations, for
Lesotho No No instance a time-frame after which data can be
Madagascar No No freely used and reported on or specify a regular
Malawi Yes No review period for the access.
Mozambique Yes No 3.2.2 Dashboards
Namibia No Yes
The aim of a DHIS2 dashboard is to see the
Rwanda No No
current (automatically up-dated) performance
Somalia Yes Yes
of selected key indicators at a glance when
South Africa No Yes opening DHIS. Analysis objects are created,
South Sudan No No which can be tables, charts or maps, and are
Uganda Yes No then carried onto the dashboard. UNICEF is
Tanzania No No supporting the use of dashboards at country
Zambia Yes Yes level for both health and nutrition indicators, in
order to allow easy and regular monitoring of
Zimbabwe Yes No
data and progress against targets by managers
Access to DHIS2 is dependent on obtaining and staff at all levels. However, more work
formal login credentials from the relevant is needed to improve availability and use of
Ministry of Health. Some UNICEF offices have dashboards as only 6 countries reported the
analysis access rights while other offices have availability of a functioning dashboard that
no access rights and need to go to the HMIS Unit includes nutrition indicators (Table 4). This
to see the data online. It was also noted that was one of the identified shortcomings of the
in most countries limited access was given to analysis aspect of the nutrition information
features which should be automatically available system. A possible reason for this is the need
to all analytic users, and the lack of availability of to build dashboards at country level, suggesting
the Data Quality App was the most noticeable that there is a lack of expertise for the optimal
gap. Access to the DHIS2 is crucial if information configuration of dashboards and/or a lack of
is going to be used to its fullest potential – it is knowledge around what objects are best to
in using, analysing and reviewing the data on a include on the dashboard for. To address this,
regular basis that progress and improvements it would help if countries were provided with
can be made to programs and therefore to the support to create appropriate dashboards that
general health status of the population. are the same (reflecting the appropriate data)
whether they are opened at National, or District
24 Nutrition Information in Routine Reporting Systemsor Sub-district level. Dashboards in this region could be configured to monitor progress against the
African Union Nutrition Scorecard, to facilitate monitoring of country contributions to regional targets.
Below is an example of a dashboard for Nutrition services that is seen when opening DHIS2.
Figure 4: Example of dashboard for Nutrition
Figure 5: Example of dashboard objects (from Child and Nutrition Dashboard used for training)
A Landscape Analysis for UNICEF’s ESAR | 2019 253.2.3 Indicators and Data Elements used. Either indicators should be configured
with this data or the need for the data should be
Quantity of data collected reviewed. Table 5 shows that out of 5 countries
Most countries are collecting too much reviewed, only one (country 5) comes close to
data which impacts on data quality. Table 5 the recommended ratio. Countries with a very
demonstrates the relationship between data low ratio of data elements to indicators should
elements and indicators for selected countries. reduce the amount of redundant information by
The Table shows data from various (anonymous) either using it to calculate indicators or stopping
countries in ESA and West and Central Africa collection. A practical way to assess data
(WCA) regions. As a general rule, the aim is to element usage in order to identify redundant
have a data element to indicator ratio of 1: 0.8 to data is to run a report for the past 3 years
0.5, meaning that if there are more than double showing which data elements have had less
the number of data elements to indicators, than 10 values captured – those identified are
there is data being collected that is not being the data elements that are not used.
Table 5: Relationship between Data Elements and Indicators
Country 1 Country 2 Country 3 Country 4 Country 5
Aggregate Data Elements 4948 9249 2820 5160 484
Indicators (excluding Count) 286 425 125 226 185
DE to Indicator ratio 0.05 0.04 0.04 0.04 0.38
As a general principle each data element should be used as part of an indicator. Table 5 shows that
data is being collected in the routine system but is not being used to calculate indicators. The higher
the ratio of data elements to indicators, the more data is being converted into indicators that can
measure performance.
Disaggregation of data by gender
The need to be able to understand some aspects of health service utilisation by gender is not doubted,
however the routine health information system may not necessarily be the most appropriate way to
collect and report this data. Gender disaggregated data adds to the size of the database (which has
cost and sustainability implications), means additional workload for staff for data collation, reporting and
data entry and often results in poor data quality where the sum of the male and female disaggregation
does not equal the total number entered.
If a gender disaggregation is required and is not collected through the routine system for the specific
Nutrition program, it is possible to estimate the proportion of male and female through attendance
records. This can be done by using the facility headcount or attendance for the 0-59 months which
is collected according to gender. Add the two figures together, then calculate the proportion that is
male. Use this proportion to breakdown any other figures into a male percentage, thus giving a gender
disaggregated value. The gender split can also be cross checked and triangulated against population
data.
26 Nutrition Information in Routine Reporting SystemsBox 2: Gender disaggregation – an alternative to collecting disaggregated data
Calculating a gender-disaggregated value using OPD proportion
How to calculate a gender proportion
OPD attendance 0-59 months Collect OPD attendance
numbers by month. The
Month Male Female Total Male proportion of male attendees
attendance Proportion is 48.8% (3970/8133*100).
January 589 612 1201 49.0
February 629 664 1293 48.6 To estimate the number of
March 688 706 1394 49.4 male and female children
attending growth monitoring
April 659 691 1350 48.8
and promotion (GMP) out
May 726 771 1497 48.5 of a total 7846 children
June 679 719 1398 48.6 weighed, find the number
Jan-Jun 3970 4163 8133 48.8 equal to 48.8% of 7846
(7846*48.8%), which equals
3829 boys attending GMP.
The remaining are therefore
female, which is 4017
girls attending GMP (7846-
3829=4017).
Naming conventions Naming of data elements
Poor naming standards and inconsistent The phrase ‘number of’ or ‘total number of’
naming make the use of data in the analytics are superfluous and should not be used. The
problematic. All data in DHIS2 during analytical French and Portuguese databases have many
processes, be it data elements or indicators examples of this. Data elements use a singular
are sorted alphabetically. It is therefore very expression, meaning that plurals are not used.
important to ensure that name variables are Examples of this shown here are from outside
used in such a way that they are easy to find of nutrition programming to promote easier
and understand. This includes naming data understanding of some of the issues to do with
elements and indicators in such a way that they naming conventions.
are understood to be either raw data, number,
rate, proportion or percentage.
Table 6: Examples of poor and best practice for data element naming convention
Screenshot 6.1: French naming (poor) Screenshot 6.2: Portuguese naming (poor)
Screenshot 6.3: English (poor) Screenshot 6.4: English (best practice)
A Landscape Analysis for UNICEF’s ESAR | 2019 27Naming of indicators
Indicators should also have a standard naming convention. Although it maybe counterintuitive to use
terminology in a certain way, standard naming is crucial to ensure efficient sorting and sequencing of
indicators. The term ’percentage’ or ‘proportion’ is not the first word of the indicator, it should come at
the end as per screenshot 7.3 below:
Table 7: Examples of poor and best practice indicator naming conventions
Screenshot 7.1: English (poor) Screenshot 7.2: English (poor)
Screenshot 7.3: English (best practice)
Table 8: Indicators collected
Indicator Number of Overweight/obese rate 4
countries Normal nutritional status rate 3
Child health Exclusive Breastfeeding at 6 3
Vitamin A supplementary 6-11 10 months rate
months coverage Outpatient Therapeutic Program
Vitamin A supplementary 12-59 11 OTP Cure rate 6
months coverage
OTP death rate 6
Vitamin A supplementary 6-59 12
OTP non-response rate 6
months coverage
OTP default rate 6
Deworming 12-59 months 7
coverage OTP transferred rate 6
MUAC screening 1 OTP new HIV testing rate 2
Antenatal Care Stabilization Centre
Antenatal IFA supplementation 11 SC Cure rate 6
rate SC death rate 7
Antenatal client deworming rate 5 SC non-response rate 6
Antenatal client anaemia rate 9 SC default rate 6
Neonatal SC transferred rate 6
Low birth weight rate 16 SC new HIV testing rate 2
Early breastfeeding-initiated rate 7 Supplementary Feeding
Nutrition Care & Support SF Cure rate 4
Child under 5 years underweight 13 SF death rate 4
rate SF non-response rate 4
Moderate acute malnutrition rate 13 SF default rate 4
Severe acute malnutrition rate 14 SF transferred rate 4
Stunting rate 6
28 Nutrition Information in Routine Reporting SystemsYou can also read