A Vulnerability Analysis for the Management of and Response to the COVID-19 Epidemic in the Second Most Populous State in Brazil - Frontiers
←
→
Page content transcription
If your browser does not render page correctly, please read the page content below
ORIGINAL RESEARCH
                                                                                                                                                    published: 13 April 2021
                                                                                                                                           doi: 10.3389/fpubh.2021.586670

                                              A Vulnerability Analysis for the
                                              Management of and Response to the
                                              COVID-19 Epidemic in the Second
                                              Most Populous State in Brazil
                                              Igor Silva Campos 1 , Vinícius Ferreira Aratani 1 , Karina Baltor Cabral 1 ,
                                              Jean Ezequiel Limongi 2 and Stefan Vilges de Oliveira 3*
                                              1
                                                Undergraduate Medical, Faculty of Medicine, Federal University of Uberlândia, Uberlândia, Brazil, 2 Undergraduate Course
                                              in Collective Health, Institute of Geography, Federal University of Uberlândia, Uberlândia, Brazil, 3 Department of Collective
                                              Health, Faculty of Medicine, Federal University of Uberlândia, Uberlândia, Brazil

                                              The COVID-19 pandemic has the potential to affect all individuals, however in a
                                              heterogeneous way. In this sense, identifying specificities of each location is essential
                                              to minimize the damage caused by the disease. Therefore, the aim of this research was
                             Edited by:       to assess the vulnerability of 853 municipalities in the second most populous state in
               Salvatore Flavio Pileggi,
                                              Brazil, Minas Gerais (MG), in order to direct public policies. An epidemiological study was
               University of Technology
                      Sydney, Australia       carried out based on Multi-Criteria Decision Analysis (MCDA) using indicators with some
                       Reviewed by:           relation to the process of illness and death caused by COVID-19. The indicators were
                            Lei Gong,         selected by a literature search and categorized into: demographic, social, economic,
 Anhui Center of Disease Control and
                    Prevention, China
                                              health infrastructure, population at risk and epidemiological. The variables were collected
               Francesco Bogliacino,          in Brazilian government databases at the municipal level and evaluated according to
                National University of
                                              MCDA, through the Program to Support Decision Making based on Indicators (PRADIN).
                 Colombia, Colombia
                                              Based on this approach, the study performed simulations by category of indicators and a
                   *Correspondence:
               Stefan Vilges de Oliveira      general simulation that allowed to divide the municipalities into groups of 1–5, with 1 being
              stefanbio@yahoo.com.br          the least vulnerable and 5 being the most vulnerable. The groupings of municipalities were
                                              exposed in their respective mesoregions of MG in a thematic map, using the software
                    Specialty section:
          This article was submitted to       Tabwin 32. The results revealed that the mesoregion of Norte de Minas stands out with
    Infectious Diseases - Surveillance,       more than 40% of its municipalities belonging to group 5, according to economic, social
            Prevention and Treatment,
                a section of the journal
                                              and health infrastructure indicators. Similarly, the Jequitinhonha mesoregion exhibited
              Frontiers in Public Health      almost 60% of the municipalities in this group for economic and health infrastructure
             Received: 23 July 2020           indicators. For demographic and epidemiological criteria, the Metropolitana de Belo
           Accepted: 15 March 2021            Horizonte was the most vulnerable mesoregion, with 42.9 and 26.7% of the municipalities
            Published: 13 April 2021
                                              in group 5, respectively. Considering the presence of a population at risk, Zona da Mata
                              Citation:
    Campos IS, Aratani VF, Cabral KB,         reported 42.3% of the municipalities in the most vulnerable group. In the joint analysis
 Limongi JE and Oliveira SVd (2021) A         of data, the Jequitinhonha, Vale do Mucuri and Vale do Rio Doce mesoregions were the
           Vulnerability Analysis for the
                                              most vulnerable in the state of MG. Thus, through the outlined profile, the present study
 Management of and Response to the
   COVID-19 Epidemic in the Second            proved how socioeconomic diversity affects the vulnerability of the municipalities to face
         Most Populous State in Brazil.       COVID-19 outbreak, highlighting the need for interventions directed to each reality.
        Front. Public Health 9:586670.
     doi: 10.3389/fpubh.2021.586670           Keywords: COVID-19, social vulnerability, disease outbreaks, epidemics, policy formulation, health policy

Frontiers in Public Health | www.frontiersin.org                                      1                                                April 2021 | Volume 9 | Article 586670
Campos et al.                                                                                                           Vulnerability for the COVID-19

INTRODUCTION                                                                social, economic, health infrastructure, population at risk and
                                                                            epidemiological, are directly related to the increase in illness and
In late December 2019, hospitals in Wuhan, China, identified                death due to the life-threatening condition.
numerous patients with pneumonia of unknown cause (1). After                   Therefore, the aim of this study was to identify areas of higher
investigating the possible etiologic agent involved, on January             vulnerability in the state of Minas Gerais and, from there, assess
7, 2020, Chinese scientists isolated a new type of coronavirus              the region in a segmented and directed way (mesoregions of
from an individual and, therefore, were able to sequence its                Minas Gerais) in order to contribute to the elaboration of public
genome (2).                                                                 policies for prevention and combat of COVID-19.
    The SARS-CoV-2 or 2019-nCoV virus is the causative agent
of the clinical syndrome known as COVID-19 (Coronavirus 19
disease) (3). Although SARS-CoV-2 belongs to the same gender
                                                                            METHODS
as the viruses responsible for Severe Acute Respiratory Syndrome            Study Design
(SARS) and Middle East Respiratory Syndrome (MERS), the new                 This is an epidemiological study to assess vulnerability based on
coronavirus appears to be related to mild infections disorders              Multi-Criteria Decision Analysis (MCDA) (10). The indicators
but with a high rate of transmissibility (3–5). Considering the             were selected to allow the assessment of the state of Minas
high levels of transmission, on March 11, the World Health                  Gerais according to the vulnerability to COVID-19 at the
Organization (WHO) characterized COVID-19 as a pandemic                     municipal level.
due to the rapid spread across countries, such as Italy, Spain and,
later, United States, that currently has the highest number of cases        Study Area
of the novel coronavirus disease (6).                                       The study assesses the state of Minas Gerais (MG), one of the 27
    In Brazil, on February 26, 2020, the first case of COVID-19             federative units in Brazil, located in the southeastern region of
was confirmed in the state of São Paulo and the first death on              the country, and characterized as the second most populous state
March 17, in the same state. During the months of April, May                and the fourth with the largest territorial extension. It borders
and June, the number of cases and deaths increased exponentially            the states of São Paulo (south and southwest), Mato Grosso
and, then, on June 20, 2020, Brazil was the second country in the           do Sul (west), Goiás (northwest), Bahia (north and northeast),
world with the highest number of confirmed cases, more than                 Espírito Santo (east), and Rio de Janeiro (southeast). According
1 million, and also the second country with the most confirmed              to data provided by the Brazilian Institute of Geography and
deaths, about 50 thousand (6).                                              Statistics (IBGE), MG has an estimated population of 21,168,791,
    In this context, the state of Minas Gerais, the second most             demographic density of 33.41 inhabitants per km² (11, 12) in a
populous state in the country, initially stood out for presenting           territory of 586,521,123 km², which corresponds, approximately,
an apparently controlled situation. While neighboring states in             to the sum of the territorial areas of Spain and Portugal. The
the southeastern region accumulated more than 300,000 cases                 population is predominantly urban, 85.3% (12), composed of
and almost 22,000 deaths by COVID-19, Minas Gerais was                      22.3% of people from 0 to 15 years old, 69.3% from 15 to 64 years
one of the states with the least confirmed cases, approximately             old and 8.1% above 65 years old. MG is the state with the third
27,000 (6). However, recent researches pointed to a possible                highest gross domestic product (GDP) in Brazil and has Human
underreporting scenario owing to the unprecedented increase                 Development Index (HDI) of 0.731 (11, 12).
in deaths from causes clinically similar to COVID-19, including                The state of MG, whose capital is located in the municipality
SARS, respiratory failure and pneumonia, and due to the low                 of Belo Horizonte, has 853 municipalities distributed in 12
number of tests performed by the state in comparison with                   mesoregions: Noroeste de Minas, Norte de Minas, Jequitinhonha,
the others, according to data obtained from the Minas Gerais                Vale do Mucuri, Triângulo Mineiro and Alto Paranaíba, Central
Department of Health (7).                                                   Mineira, Metropolitana de Belo Horizonte, Vale do Rio Doce,
    From this perspective, the high number of cases in                      Oeste de Minas, Sul e Sudoeste de Minas, Campos das Vertentes,
neighboring states and underreporting in Minas Gerais rendered              and Zona da Mata. Created in 1990 by IBGE, these mesoregions
the region extremely susceptible to the increase in the number              are guided by regional particularities related to social and
of cases of COVID-19, with the occurrence and diffusion of                  administrative processes (13) (Figure 1).
new cases. In this situation, delimiting and defining the main
regions of vulnerability in the state is essential to guide the             Data Analysis
population, managers, public policies and government healthcare             The indicators used in this analysis were categorized into:
workforces. The concept of vulnerability, in this case, considers           demographic, social, economic, health infrastructure, population
aspects that can measure whether the resources designated to the            at risk, and epidemiological. In the process of selection of the
protection of people are available or in need. Thus, a complex set          indicators, articles that describe or analyze factors that could
of indicators may determine a higher or lower vulnerability (8, 9).         interfere directly in the increase of damage caused by COVID-
    In this work, the indicators, selected based on the literature to       19 in the population were selected based on a literature search in
identify the vulnerability of the cities of Minas Gerais, describe          Scielo and PubMed databases. Then, among 18 articles selected
physical, social and individual characteristics that enable to              (14–31), 23 indicators were identified, categorized and used in
assess and qualify the regions with greater difficulty in managing          this paper. Other indicators that could potentially have some
the pandemic. These indicators, divided into demographic,                   relation to the disease and death caused by coronavirus infection

Frontiers in Public Health | www.frontiersin.org                        2                                       April 2021 | Volume 9 | Article 586670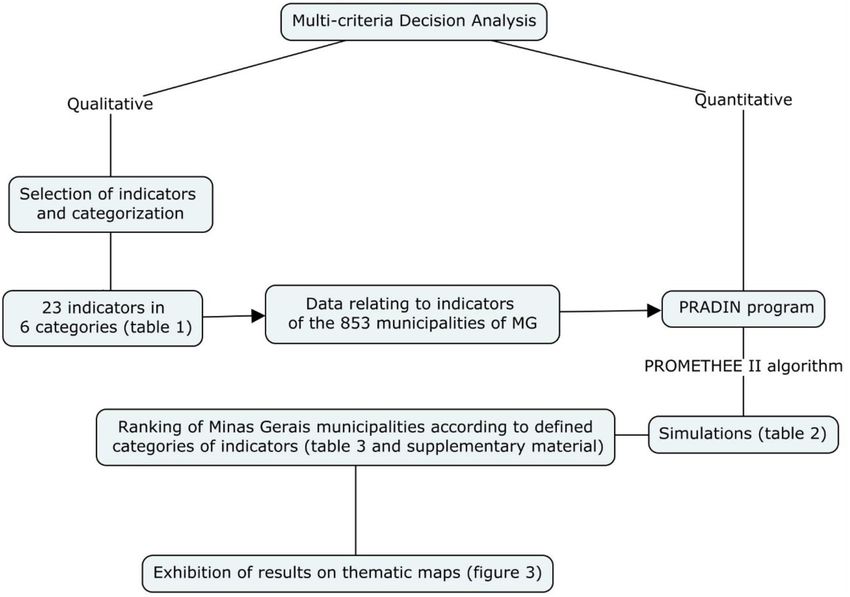
Campos et al.                                                                                                                               Vulnerability for the COVID-19

 FIGURE 1 | (A) Map of Brazil highlighting the state of Minas Gerais in red. (B) Map of the state of Minas Gerais divided into its mesoregions.

were not used because the official data available were limited at                          The use of this approach in Health Surveillance is
the municipalities level.                                                               recommended by the Ministry of Health of Brazil as an
   After selecting the indicators, these variables were collected                       analysis methodology for the management process of the
from the databases of the Brazilian Institute of Geography and                          Brazilian Unified Health System (SUS) (34). Importantly, the
Statistics (“IBGE”) (https://www.ibge.gov.br/), Atlas of Human                          method has already been used to classify areas of vulnerability
Development of Brazil 2013 (http://hdr.undp.org/en/content/                             for Trypanosoma cruzi (35) and to map the vulnerability
new-atlas-human-development-brazil), from the National                                  to hantavirus infections in Brazil (36). Likewise, in the
Supplementary Health Agency (NSHA) (http://www.ans.gov.                                 United States, the methodology was used to analyze the
br/), Mortality Information System (MIS) (http://www2.datasus.                          risk of Chagas disease in Texas (37).
gov.br/DATASUS/index.php?area=060701),           the     National                          In order to facilitate the understanding of the statistical
Registry of Health Establishments (NRHE) (http://www2.                                  analysis performed, we divided the session into: Decision-
datasus.gov.br/DATASUS/index.php?area=0204&id=6906) and                                 making, seeking to explain the tools used in the analysis
from the State Secretariat of Health of Minas Gerais (https://                          and choice of indicators; Simulations, explaining what the
www.saude.mg.gov.br/). Then, 23 indicators remained, grouped                            simulations are and how they work; Categorization, showing
according to categories (Table 1). The tabulated absolute data                          how we organize the indicators in the study; Weights, explaining
were adjusted to the respective values in percentage, incidence                         the distribution of the weights of the indicators; Organization
or mortality per 1,000 inhabitants, using information from the                          of results, explaining how the data were grouped and placed on
population projection of Minas Gerais for the year 2019 (11).                           thematic maps.

                                                                                        Decision-Making
Statistical Analysis                                                                    Multi-criteria Decision Analysis (MCDA) can be conceptualized
The vulnerability of the municipalities of Minas Gerais to                              as a set of strategies to assist in making decisions about a
COVID-19 was evaluated by a complex set of factors, herein                              complex problem. MCDA uses and evaluates several criteria
represented by the indicators (32). For the joint analysis of these                     and perspectives aimed at identifying priorities, better health
factors, an instrument known as Multi-criteria Decision Analysis                        management and planning solutions (10). The technique allows
(MCDA) was applied through the Program to Support Decision                              the decision to occur based on what the decision-makers consider
Making Based on Indicators (PRADIN) software, in order to                               to be relevant to the situation (10). Thus, applying the concept
represent the vulnerability of these municipalities (33).                               of this methodology (MCDA) to the present study, different

Frontiers in Public Health | www.frontiersin.org                                    3                                               April 2021 | Volume 9 | Article 586670
TABLE 1 | Indicators by category (demographic, social, economic, health infrastructure, population at risk, epidemiological) used in the Multi-criteria Decision Analysis (MCDA) to assess the vulnerability of the
Frontiers in Public Health | www.frontiersin.org
Campos et al.
municipalities of Minas Gerais to COVID-19.
Category Indicators Description Application in the context of COVID-19 Source References
Demographic Percentage of the population Percentage of the population residing in a There is a correlation between the increase in population 2010 IBGE population census (14, 15)
living in an urban area situation of urban domicile in the density, proportion of built area, industrial concentration and
municipalities of Minas Gerais. other parameters associated with urbanization and increased
morbidity by COVID-19. Additionally, air pollution, which is
prevalent in locations with high rates of urbanization,
contributes to the probability of infections.
Demographic density Demographic density of the territorial unit There is evidence that population density affects the number 2010 IBGE population census (14, 16, 17)
(Inhabitant per square kilometer) of COVID-19 daily cases.
Social Percentage of inadequate Households without basic sanitation The virus that causes COVID-19 has already been detected in 2010 IBGE population census (15, 18, 19)
sanitation condition, that is, they were not connected sewage samples in several countries and in the feces of
to the general water supply network, to infected patients, hence demonstrating the need for proper
sanitary sewage and had no access to waste treatment.
garbage collection.
Illiteracy percentage Rate of people aged 15 and over who Important factor of social vulnerability, especially considering 2010 IBGE population census (20, 21)
cannot read or write that one of the bases for combating the disease is
information. Studies also indicate a higher prevalence of
certain comorbidities in people with low levels of education.
Gini index It measures the degree of inequality that Studies indicate that the Gini index can be extremely useful to Atlas of human development in (22, 23)
exists in the distribution of individuals measure the exposure-disease relationship. Brazil 2010 (http://hdr.undp.org/
according to per capita household income. en/content/new-atlas-human-
development-brazil)
4
Municipal human development Geometric mean of the indexes related to The HDI can allow the assessment of social vulnerability by Atlas of human development in (24)
index income (per capita income indicator), measuring the level of development of each region from three Brazil 2010 (http://hdr.undp.org/
Education (geometric average of the essential factors for quality of life. en/content/new-atlas-
school attendance sub-index, with 2/3 humandevelopment-brazil)
weight, and of the schooling sub-index,
with 1/3 weight) and Longevity (obtained
through the life expectancy at birth), with
equal weights.
Economics Percentage of the population Population considered extremely poor. Poverty and unemployment, characteristics of a population 2010 IBGE population census (17)
with per capita monthly income with such a low monthly income, are social determinants
of up to 70 reais (BRL) directly related to higher mortality caused by COVID-19.
(equivalent to US$ 13)
Percentage of the population Percentage of people by municipality who Considering the need to treat more severe cases in Intensive National supplementary health (25, 26)
with health insurance have access to health insurance. Care Units (ICU) and the low availability of beds due to high agency TabNet DataSUS
demand, access to a private health network becomes an (March/2020)
April 2021 | Volume 9 | Article 586670
important indicator of less vulnerability.
Gross domestic product per Proportion between the wealth produced The concentration of financial resources facilitates the 2010 IBGE population census (19)
Vulnerability for the COVID-19
capita by a municipality and its number of promotion of measures to contain the pandemic, such as
inhabitants. increasing the number of tests in the population.
Health Number of beds per 1,000 Proportion of the number of hospitalization Due to the pandemic, a great increase in the demand for TabNet DataSUS - Brazilian (25, 27)
infrastructure inhabitants beds by municipality. health services is expected, thus it is essential to identify the national registry of health
most vulnerable regions and optimize the use of services and facilities (NRHE) - Physical
dimension resources that will be necessary to strengthen the resources - 2019
response capacity of the health system regionally and locally.
(Continued)Frontiers in Public Health | www.frontiersin.org
Campos et al.
TABLE 1 | Continued
Category Indicators Description Application in the context of COVID-19 Source References
Number of respirators per 1,000 Proportion of the number of respirators by
inhabitants municipality.
Number of doctors per 1,000 Proportion of the number of doctors by TabNet DataSUS - Brazilian
inhabitants municipality. national registry of health
establishments (NRHE) - Human
resources - 2019
Number of nurses per 1,000 Proportion of the number of nurses by
inhabitants municipality.
Number of rapid tests per 1,000 Proportion of the number of rapid tests for Although total population testing is impractical, a Data provided by the state health (28)
inhabitants COVID-19 performed by municipality. well-designed program is essential to determine the department of Minas Gerais on
prevalence of COVID-19 in the general society, in specific 06/22/2020
subgroups (including healthcare workers) and at-risk groups.
Number of molecular tests Proportion of the number of molecular
(RT-PCR) per 1,000 inhabitants tests (RT-PCR) performed by municipality.
Population at Percentage of the population Percentage of the resident population in According to the World Health Organization, the mortality rate 2010 IBGE population census (29)
risk aged 60 or over the municipalities of Minas Gerais aged 60 caused by COVID-19 increases with older age, with higher
or over. mortality among people over 80 years old.
Mortality from diseases of the Deaths per residence - Chapter ICD-10: X. Cancer, hypertension, diabetes, Chronic Obstructive TabNet DataSUS mortality (29–31)
respiratory system per 1,000 Diseases of the respiratory system in Pulmonary Disease (COPD), heart and cerebrovascular information system - MIS - 2018
inhabitants 2018. diseases are major risk factors for patients with COVID-19.
Thus, municipalities with numerous cases of these
5
life-threatening conditions become more vulnerable.
Mortality from diabetes per 1,000 Deaths per residence - Chapter ICD-10:
inhabitants IV. Diabetes (E10–E14) in 2018.
Mortality from neoplasms per Deaths per residence - Chapter ICD-10: II.
1,000 inhabitants Neoplasms (tumors) in 2018.
Mortality from diseases of the Deaths per residence - Chapter ICD-10:
circulatory system per 1,000 IX. Circulatory system diseases in 2018.
inhabitants
Epidemiological Incidence of COVID-19 Proportion between new cases of These occurrence measures are essential to compose an Epidemiological bulletin of the (31)
COVID-19 of a municipality and its overview of COVID-19 in the municipalities of Minas Gerais, in secretary of health of Minas
population. addition to informing the evolution of the infectious illness in Gerais on 06/22/2020
the state, a fact that would not be achieved only with the
exposure of the absolute data of cases and deaths from the
disease.
April 2021 | Volume 9 | Article 586670
Mortality of COVID-19 Number of COVID-19 deaths per 1,000
inhabitants.
Vulnerability for the COVID-19
Lethality of COVID-19 Proportion between the number of deaths
caused by COVID-19 and the population
affected.Campos et al. Vulnerability for the COVID-19
indicators selected by the authors were evaluated to identify and a general simulation, covering all 23 indicators, therefore
the most vulnerable areas of Minas Gerais to COVID-19 and, totaling seven simulations (Table 2).
therefore, priorities for public policies to combat the pandemic. For the development of the MCDA, each city of Minas Gerais
MCDA is a qualitative and quantitative process (Figure 2). was included in a spreadsheet and received a set of data related
The qualitative phase corresponds to the choice of factors related to the indicators (Table 1), which were analyzed by the PRADIN
to the analyzed problem, the indicators (Table 1). In turn, the program according to the total number of municipalities in order
quantitative phase refers to the techniques that are employed in to classify them according to their vulnerability (worst indicators
the search for a multi-criteria solution, which have already been reflect greater vulnerability).
described and analyzed by the literature (10, 38). The choice of
the technique depends on how the problem presents itself and Weights
how it relates to the qualitatively selected factors (10, 38). The weights given to the indicators (0–10) in the MCDA were
The present work used the Preference Ranking Organization established by the decision-makers. In this work, all indicators
Method for Enrichment of Evaluations, the PROMETHEE received the same weight in the hierarchy process, since no
technique, specifically variant 2, because this is an over- evidence was found on which factor influences COVID-19’s
classification method that allowed the municipalities to be illness and death processes to a higher or lower extent. For
structured hierarchically, based on indicators related to the the authors of the present study, giving different weights to
complex problem, in order to determine priority levels (38). the indicators is inconsistent in view of the complexity of
The technique allows simulations to be performed (Table 2) the pandemic scenario experienced in Brazil, a country full of
by comparing the municipalities for each defined indicator, structural problems, so that any type of assumption about the
according to functions capable of defining the overcoming of one greater or lesser importance of the indicators without accurate
city in relation to another. legitimation by the scientific literature could invalidate the
The PROMETHEE II method was computationally results obtained.
implemented to the Program to Support Decision Making
Based on Indicators (PRADIN) in order to facilitate its Results Organization
operationalization. Therefore, using the functions of the After the analysis of the indicators by MCDA, each simulation
PROMETHEE algorithm, associated with PRADIN, simulations was classified into quintiles, according to the multi-criteria
can be performed for the selected indicators. The values (0–1) indicator (MCI) and divided into groups of vulnerability
received by each city in the simulations are known as multi- according to municipalities, mesoregions and population size,
criteria indicators in the app, and from there, the hierarchy for classified in an ascending order. Groups 1 and 2 were composed
vulnerability classification occurs. by the municipalities with the least vulnerability, group 3 with
moderate vulnerability and groups 4 and 5 were those with the
greatest vulnerability.
Simulations After the classification and definition of the groups,
After collecting the data related to the chosen indicators, these
the codes of the municipalities and the program Tabwin
data were inserted in the program, PRADIN, to be compared
32 (http://www2.datasus.gov.br/DATASUS/index) were used to
and hierarchized. In the present work, it was called simulation
construct the vulnerability maps for COVID-2019. In thematic
every time the program performs this process of comparison and
maps, the darker colors of the municipalities represent
hierarchization of the chosen indicators. Thus, these simulations
greater vulnerability, while the lightest colors indicate lower
indicate how the data was organized in the app.
vulnerability. For the organization and evaluation of the collected
data, the regionalization of the municipalities of Minas Gerais in
Categorization Mesoregions was used (Figure 1).
To facilitate the use of this analysis by health managers, To compose the data analysis, the concept of population size
the study divided the indicators into categories (demographic, of each municipality was also used (39), categorizing in small
social, economic, health infrastructure, population at risk, municipalities those with up to 25 thousand inhabitants, in
epidemiological) and carried out separate simulations with medium-sized municipalities those with population between 25
indicators belonging to each one. Thereby, the vulnerability and 100 thousand inhabitants and in large municipalities those
can be analyzed in different perspectives, allowing segmented with more than 100 thousand inhabitants.
interventions based on the categories, which are usefull according Due to the advantages of the technique, other studies used this
to the interest of health managers. tool to assist in decision making considering disease surveillance
Therefore, the simulations occurred in a segmented manner, programs (35–37, 40–42). Interestingly, a recent study carried
according to groupings, evaluating the group of indicators by out in India performed an analysis very similar to this study,
the pre-defined categories (Table 2). Posteriorly, an analysis was in which researchers mapped the vulnerability of India to
undertaken from a joint simulation of all multi-criteria indicators COVID-19 (41). Given the importance of the method and its
to establish the vulnerability scenario for Minas Gerais at the increasingly recurrent use, a systematic review was conducted
municipal level for COVID-19. This general simulation enabled to assess and synthesize articles that used multi-criteria analysis
a more complete view of the pandemic scenario at Minas Gerais. for decision making in health area (42). This review highlighted
Six simulations were conducted, with the groupings of indicators the methodological variety that can be used to construct MCDA,
Frontiers in Public Health | www.frontiersin.org 6 April 2021 | Volume 9 | Article 586670Campos et al. Vulnerability for the COVID-19
FIGURE 2 | Flowchart with step-by-step description of the methodology.
with the collaboration of both literature and decision makers in this mesoregion. The findings also revealed that 97.0% of the
and experts in the process of evaluating the best criteria and municipalities categorized as large ones were included in group 5
discussing the results for evaluation of the decision (42). of vulnerability (Table 4).
From the analysis of social indicators, the results showed that
RESULTS the mesoregions Oeste de Minas and Metropolitana de Belo
Horizonte occupy, together, the position of the least vulnerable.
The results obtained by the multi-criteria analysis of the Both have 63.0% of their municipalities integrating groups 1 and
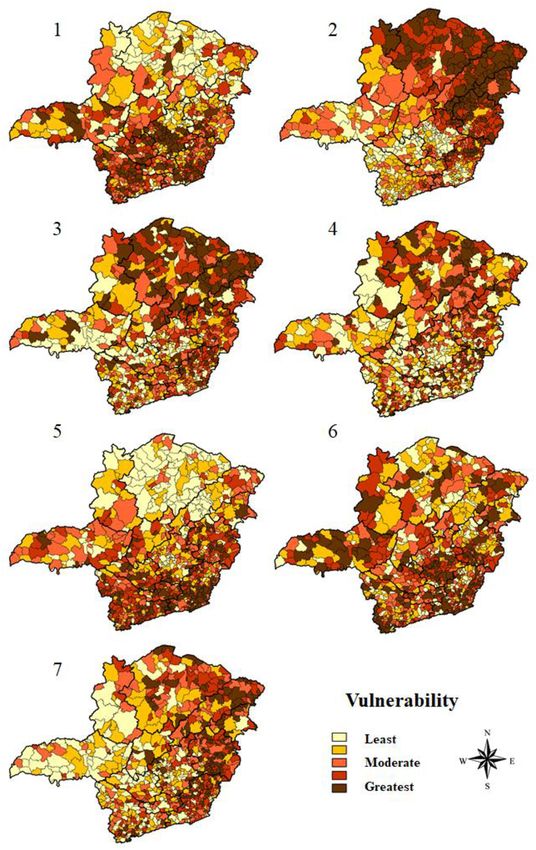
groupings of indicators are depicted in Figure 3, according 2. In contrast, Norte de Minas, Vale do Rio Doce and Vale do
to the analysis of the 853 municipalities in Minas Gerais Mucuri stand out as the most vulnerable (Figure 3-2). While
(Supplementary Table 1). Table 3 shows the mesoregions of the the first two mesoregions have, respectively, 85.3 and 81.4% of
most and least vulnerable municipalities in Minas Gerais for their municipalities distributed between groups 4 and 5, the
COVID-19, in accordance with the grouping of indicators used Vale do Mucuri mesoregion exhibits 91.3% of its municipalities
in the multi-criteria analysis of decision. integrating the most vulnerable groups, where 4 of the 10 most
From the analysis of demographic indicators, the results vulnerable cities are located in this mesoregion (Table 3). Besides,
indicated that the Norte de Minas mesoregion is the least 84.9% large and 45.2% medium-sized municipalities were among
vulnerable (Figure 3-1). Accordingly, this mesoregion had 80.9% the least vulnerable in relation to social indicators (Table 4).
of the municipalities with the least vulnerability, groups 1 and Regarding economic indicators, Triângulo Mineiro/Alto
2, and 9 municipalities among the 10 least vulnerable in the Paranaíba mesoregion was the least vulnerable region in the
state for these indicators. Contrarily, the Metropolitana de Belo state, with 68.2% of the municipalities classified in groups 1
Horizonte had 53.4% of its municipalities classified in groups 4 and 2 (Figure 3-3). The Jequitinhonha and Norte de Minas
and 5, that is, with greater vulnerability (Table 3). Thus, 7 of the mesoregions had 56.9% and 47.2% of their municipalities
10 most vulnerable municipalities in Minas Gerais were located categorized in group 5, respectively. Importantly, 6 most
Frontiers in Public Health | www.frontiersin.org 7 April 2021 | Volume 9 | Article 586670Campos et al. Vulnerability for the COVID-19
TABLE 2 | Simulations performed by category of indicators (1–6) and the general simulation (7), gathering all the indicators simultaneously.
Indicators Simulations
1st 2nd 3rd 4th 5th 6th 7th
Demographic
Population percentage living in urban area X X
Demographic density X X
Social
Percentage of inadequate sanitation X X
Human development index X X
Illiteracy percentage X X
Gini index X X
Economic
Population percentage with monthly income higher than 70 reais (equivalent to US$ 13) X X
Population percentage with health insurance X X
Gross domestic product X X
Healthcare infrastructure
Number of respirators by 1,000 inhabitants X X
Number of beds by 1,000 inhabitants X X
Number of nurses by 1,000 inhabitants X X
Number of doctors by 1,000 inhabitants X X
Number of rapid tests by 1,000 inhabitants X X
Number of molecular tests (RT-PCR) by 1,000 inhabitants X X
Population at risk
Mortality from respiratory diseases by 1,000 inhabitants X X
Mortality from cardiovascular diseases by 1,000 inhabitants X X
Mortality from neoplasm by 1,000 inhabitants X X
Mortality from diabetes by 1,000 inhabitants X X
Population percentage with 60 years or more X X
Epidemiological
COVID-19 incidence by 1,000 inhabitants X X
COVID-19 mortality by 1,000 inhabitants X X
COVID-19 lethality X X
All indicators (general) X X X X X X X
vulnerable municipalities in the state belong to these regions part of group 5 (Table 3) (Figure 3-5). Furthermore, 22.0% of
(Table 3). Further, within this analysis category, 52.2 and 75.7% the municipalities classified as small-sized were part of group 5
of medium-sized and large cities, respectively, are part of the (Table 4).
groups 1 and 2 and, therefore, have lower vulnerability (Table 4). Based on epidemiological indicators, the Norte de Minas
When analyzing the indicators that assess health and Jequitinhonha mesoregions stood out due to their
infrastructure, the results reported that Oeste de Minas and lower vulnerability with, respectively, 59.6 and 56.9% of
Central Mineira mesoregions are less vulnerable, with 31.8 the municipalities classified in groups 1 and 2. In turn,
and 30.0% of the municipalities in group 1, respectively Metropolitana de Belo Horizonte and Triângulo Mineiro/Alto
(Table 3). Norte de Minas and Vale de Mucuri were among Paranaíba revealed higher vulnerability, with 54.3% and 57.6%
the most vulnerable areas, with 41.6 and 34.8% of the of the municipalities classified in groups 4 and 5, respectively
municipalities in group 5, respectively (Figure 3-4) (Table 3). (Table 3) (Figure 3-6). However, 7 of the 10 most vulnerable
In this regard, medium-sized and large municipalities with, municipalities in the state are located in the mesoregion of
respectively, 80.8 and 84.9% in groups 1 and 2, have lower Zona da Mata. Moreover, the findings reported that 45.2% of
vulnerability (Table 4). medium-sized municipalities and 97.0% of large municipalities
Considering the estimation of population at risk, the findings were classified in group 5 (Table 4).
showed that the mesoregion of Norte de Minas was the least The analysis of all indicators jointly demonstrated that
vulnerable, with 61.8% of its municipalities classified in group Triângulo Mineiro/Alto Paranaíba is the least vulnerable
1. Notwithstanding that, Zona da Mata mesoregion proved to mesoregion (Table 3) (Figure 3-7). With 57.6% of its
be the most vulnerable, with 42.3% of its municipalities being municipalities classified in group 1, this region contains 5 of the
Frontiers in Public Health | www.frontiersin.org 8 April 2021 | Volume 9 | Article 586670Campos et al. Vulnerability for the COVID-19 FIGURE 3 | Thematic maps of the vulnerability simulations of the municipalities of Minas Gerais for COVID-19, based on the multi-criteria decision analysis. 10 least vulnerable municipalities. It is noteworthy to highlight group 5 (47.8%), Vale do Rio Doce comprises 5 of the 10 most the positions of Vale do Mucuri and Vale do Rio Doce. While the vulnerable municipalities, with 44.1% of its municipalities first mesoregion has the highest rate of municipalities occupying integrating group 5 (Table 3) (Figure 3-7). Additionally, the Frontiers in Public Health | www.frontiersin.org 9 April 2021 | Volume 9 | Article 586670
Campos et al.                                                                                                            Vulnerability for the COVID-19

general analysis revealed that small municipalities are among                 and sanitary capacity to contain the spread of the virus (18).
the most vulnerable, with 43.7% of their representatives divided              Thus, in the analysis of vulnerabilities, large and medium-sized
between groups 4 and 5 (Table 4).                                             municipalities, predominant in the central-southern portion of
                                                                              the state, demonstrated less risk, given that the best social
                                                                              indicators are verified in Oeste de Minas and Metropolitana
DISCUSSION                                                                    de Belo Horizonte mesoregions. In contrast, the northern
                                                                              mesoregions, especially Vale do Mucuri, are the ones with the
The use of MCDA to generate these results was based on                        worst educational and housing conditions (50). The northern
the perspective that the health-illness-care process depends on               portion of the state herein proved to be more socially vulnerable
several factors determined by the individuals’ living conditions.             to COVID-19, demanding public policies directed to improving
Thus, exploring the structure and spatial dynamics of the                     these indicators to overcome the contagion.
population is essential for the characterization of health                        In addition, from the analysis of economic indicators, the
situations to plan actions and allocate resources (15, 43). From              results indicated greater vulnerability in the northern region of
this perspective, in order to draw a panorama of reality, the use             Minas Gerais, mainly in Jequitinhonha and Norte de Minas, in
of indicators becomes an important instrument to measure it in a              contrast to Triângulo Mineiro/Alto Paranaíba and Metropolitana
succinct, objective, quick and efficient way, aiming to support an            de Belo Horizonte. Remarkably, this information is relevant
intervention (43).                                                            as, in the context of the pandemic, the politicians have
    In the context of the COVID-19 pandemic, it is emphasized                 focused on populations at risk considering mainly comorbidities
that the novel coronavirus infection has the potential to                     and age (46). However, socioeconomic issues have been in
affect everyone in society, however in a heterogeneous way                    the background, which may favor COVID-19 exposure and
(44), therefore requiring identification of areas of vulnerability.           mortality. Additionally, economically disadvantaged people are
Although various strategies for mitigating the rate of disease                more likely to live in accommodation with high number of
transmission are recommended for the entire community, it is                  people and less access to open areas, besides to having unstable
pivotal to examine areas based on their unique characteristics,               occupations that do not allow remote office work (46). In this
including demographic variation, economic aspects, health                     sense, the current prevention model based mainly on social
conditions of population and characteristics of the health system,            isolation can be fragile and limited when applied to needy,
in order to produce improved and targeted interventions (45).                 isolated and low-educated populations (51). Therefore, poverty
Thus, in a state with a projection of more than 20 million                    represents a hurdle to effective measures to contain the pandemic
inhabitants in 2019 and more than 580 thousand km² of                         and must be taken into account in public policy decision making.
area (IBGE), the peculiarities of each region become even                         Regarding the health infrastructure indicators, a higher
more accentuated.                                                             vulnerability was also found in the northern regions. This
    In this scenario, Minas Gerais occupied, in 2012, the                     category is especially important when considering more severe
9th position in the national urbanization ranking (24), but                   cases of the disease, which require hospitalization in Intensive
its territorial vastness causes important internal inequalities               Care Units (ICU) (26). Inadequate health infrastructure directly
regarding the urbanization rates of the municipalities, a relevant            influences the mortality rate caused by COVID-19. In this
fact for vulnerability analysis of COVID-19 (46). Indeed,                     context, the Brazilian health regions with the highest mortality
COVID-19 is closely related with high population density owing                rates are located in places where the shortage of ICU beds and
to the high degree of social interactions. In this sense, individuals         ventilators is more prevalent (27). Thus, the saturation of ICU
living in urban areas are more likely to test positive for the disease        and respirators resulting from the increasing demand becomes
when compared to individuals living in rural areas (47, 48). Thus,            an aggravating factor for the COVID-19 pandemic and requires
the lower vulnerability verified in Norte de Minas mesoregion                 attention from managers (25). In this context, the construction
is due to the much lower urbanization rates in comparison to                  of temporary hospitals, as has already been done in other parts of
the average state, in addition to the low demographic density                 Brazil, may be an alternative.
and predominance of smaller cities (12). Furthermore, proving                     Considering the number of tests for COVID-19, an important
this strong relationship, it is important to mention the specificity          factor in determining the prevalence of infection/disease in
of Montes Claros (Figure 3-1), a municipality in the Norte de                 the population (28), Brazil, as the vast majority of other
Minas that differs in terms of higher rates of urbanization and,              developing countries, has a very modest number when compared
for this reason, exposed a similar profile to the municipalities              to developed countries (52). Despite being the second country
located in the center-south portion of Minas Gerais, with                     with the highest number of absolute deaths and the fifth with the
high vulnerability, comparable to the Metropolitana de Belo                   highest number of deaths per million inhabitants, Brazil is only
Horizonte mesoregion (49).                                                    the 14th country testing patients, hence demonstrating a serious
    According to the Atlas of Social Vulnerability in Brazilian               concern (53). The context of Minas Gerais is even more worrying,
Municipalities (50), by 2015, all thirty municipalities in the                considering that the state has the third lowest number of tests
Southeast region classified as high social vulnerability were                 per thousand inhabitants among the 26 states and 1 federative
located in Minas Gerais. Further, considering the COVID-19                    unit (6). This has failed to identify potential transmitters and
transmission scenario, locations with better education, sanitation            directly influences the number of reported cases, which may
and development indicators concentrate greater instructional                  be much lower than the actual number. Additionally, questions

Frontiers in Public Health | www.frontiersin.org                         10                                      April 2021 | Volume 9 | Article 586670
Campos et al. Vulnerability for the COVID-19
TABLE 3 | Mesoregions of municipalities and groups of vulnerability (1 and 2 representing lower vulnerability, 3 moderate vulnerability and 4 and 5 greater vulnerability) for
COVID-19 in the state of Minas Gerais, according to indicators used in the multi-criteria decision analysis.
Mesoregions and groups Indicators (%)
Demographic Social Economic Healthcare Population Epidemiological General
infrastructure at risk
Campo das vertentes 1 8.3 19.4 11.1 22.2 5.6 16.7 25.0
2 25.0 33.3 27.8 25.0 16.7 13.9 22.2
3 22.2 33.3 41.7 19.4 16.7 30.6 25.0
4 19.4 13.9 11.1 13.9 27.8 19.4 19.4
5 25.0 0.0 8.3 19.4 33.3 19.4 8.3
Central mineira 1 23.3 16.7 23.3 30.0 20.0 33.3 40.0
2 26.7 30.0 20.0 20.0 20.0 13.3 23.3
3 23.3 33.3 16.7 20.0 20.0 16.7 13.3
4 20.0 16.7 26.7 20.0 26.7 23.3 16.7
5 6.7 3.3 13.3 10.0 13.3 13.3 6.7
Jequitinhonha 1 37.3 0.0 3.9 9.8 45.1 23.5 0.0
2 33.3 2.0 13.7 17.6 21.6 33.3 17.6
3 19.6 7.8 11.8 21.6 21.6 17.6 23.5
4 9.8 31.4 13.7 29.4 11.8 15.7 21.6
5 0.0 58.8 56.9 21.6 0.0 9.8 37.3
Metropolitana de belo 1 17.1 42.9 25.7 28.6 28.6 15.2 27.6
horizonte 2 21.9 15.2 25.7 20.0 25.7 13.3 25.7
3 7.6 16.2 20.0 26.7 19.0 17.1 21.9
4 10.5 12.4 17.1 12.4 12.4 27.6 13.3
5 42.9 13.3 11.4 12.4 14.3 26.7 11.4
Noroeste de minas 1 42.1 10.5 5.3 26.3 31.6 10.5 31.6
2 26.3 15.8 31.6 15.8 42.1 36.8 26.3
3 31.6 42.1 26.3 0.0 10.5 5.3 31.6
4 0.0 15.8 15.8 26.3 15.8 36.8 10.5
5 0.0 15.8 21.1 31.6 0.0 10.5 0.0
Norte de minas 1 57.3 1.1 11.2 7.9 61.8 30.3 5.6
2 23.6 2.2 11.2 11.2 25.8 29.2 19.1
3 7.9 11.2 11.2 15.7 10.1 20.2 25.8
4 6.7 40.4 19.1 23.6 2.2 6.7 28.1
5 4.5 44.9 47.2 41.6 0.0 13.5 21.3
Oeste de minas 1 15.9 50.0 40.9 31.8 6.8 13.6 36.4
2 9.1 25.0 20.5 20.5 27.3 20.5 22.7
3 13.6 25.0 22.7 25.0 20.5 38.6 22.7
4 31.8 0.0 9.1 6.8 29.5 15.9 15.9
5 29.5 0.0 6.8 15.9 15.9 11.4 2.3
Sul/sudoeste de minas 1 6.2 32.2 26.7 23.3 6.8 18.5 26.0
2 11.0 43.8 26.7 24.7 11.6 23.3 28.1
3 27.4 19.9 26.0 16.4 19.9 19.9 17.1
4 28.8 3.4 12.3 16.4 34.2 16.4 17.1
5 26.7 0.7 8.2 19.2 27.4 21.9 11.6
Triângulo mineiro/alto 1 19.7 28.8 39.4 25.8 22.7 13.6 57.6
paranaíba 2 19.7 30.3 28.8 31.8 24.2 16.7 24.2
3 19.7 34.8 16.7 19.7 31.8 12.1 13.6
4 24.2 6.1 7.6 19.7 13.6 30.3 3.0
5 16.7 0.0 7.6 3.0 7.6 27.3 1.5
Vale do mucuri 1 43.5 0.0 17.4 4.3 13.0 26.1 4.3
2 17.4 0.0 8.7 17.4 30.4 21.7 17.4
(Continued)
Frontiers in Public Health | www.frontiersin.org 11 April 2021 | Volume 9 | Article 586670Campos et al. Vulnerability for the COVID-19
TABLE 3 | Continued
Mesoregions and groups Indicators (%)
Demographic Social Economic Healthcare Population Epidemiological General
infrastructure at risk
3 17.4 8.7 13.0 17.4 39.1 30.4 21.7
4 21.7 13.0 17.4 26.1 13.0 8.7 8.7
5 0.0 78.3 43.5 34.8 4.3 13.0 47.8
Vale do rio doce 1 16.7 4.9 9.8 11.8 7.8 19.6 3.9
2 26.5 5.9 19.6 12.7 20.6 22.5 6.9
3 18.6 7.8 11.8 25.5 20.6 15.7 17.6
4 24.5 42.2 36.3 28.4 26.5 24.5 27.5
5 13.7 39.2 22.5 21.6 24.5 17.6 44.1
Zona da mata 1 6.3 12.7 14.8 19.0 7.0 21.1 9.2
2 16.9 19.0 11.3 21.1 12.0 11.3 14.1
3 30.3 26.1 24.6 19.0 19.7 22.5 19.0
4 23.9 26.8 32.4 21.8 19.0 20.4 30.3
5 22.5 15.5 16.9 19.0 42.3 24.6 27.5
TABLE 4 | Results of the multi-criteria decision analysis according to the population size of municipalities in the state of Minas Gerais and their vulnerability classification,
in accordance with the grouping of indicators used in the multi-criteria decision analysis for COVID-19.
Cities by population size Total of Groups Indicators (%)
cities
Demographic Social Economic Healthcare Population Epidemiological General
infrastructure at risk
Small size (until 25 thousand 705 1 23.3 12.9 16.2 11.1 18.6 24.3 17.0
inhabitants) 2 22.7 19.9 20.0 20.0 18.9 21.7 18.2
3 22.8 22.3 21.7 21.3 20.6 21.8 21.1
4 20.7 22.8 21.1 23.5 20.0 20.1 21.1
5 10.5 22.1 21.0 24.1 22.0 12.1 22.6
Medium size (25–100 thousand 115 1 6.1 45.2 32.2 56.5 26.1 0.0 31.3
inhabitants) 2 9.6 23.5 20.0 24.3 26.1 15.7 27.8
3 8.7 11.3 13.9 13.9 16.5 14.8 14.8
4 20.9 8.7 17.4 4.3 20.9 24.3 18.3
5 54.8 11.3 16.5 0.9 10.4 45.2 7.8
Large size (more than 100 33 1 0.0 84.8 54.5 78.8 30.3 0.0 45.5
thousand inhabitants) 2 0.0 12.1 21.2 6.1 24.2 0.0 33.3
3 0.0 3.0 6.1 15.2 21.2 0.0 15.2
4 3.0 0.0 6.1 0.0 18.2 3.0 3.0
5 97.0 0.0 12.1 0.0 6.1 97.0 3.0
have been raised about possible underreporting of cases, which education acts as an aggravation of diseases, and the region
further aggravates the state’s situation, thus making government that is able to provide more appropriately these resources to
intervention urgent (7). the population ensures better conditions to prolong life (56).
The factors of comorbidities and age, which compose the Importantly, a greater longevity is also accompanied by an
population at risk indicators, were raised during the pandemic increase in the elderly population, which is more affected by
in order to draw a well-defined profile of people more susceptible chronic diseases, and with regard to COVID-19, these diseases
to the complications of COVID-19. Both in Wuhan, China (54) act as complicating factors of the clinical condition. Thus, as
and in the Italian states (55), respiratory and cardiac diseases, reported by this study, the worst social and health infrastructure
as well as neoplasms, diabetes and advanced age are considered indicators in the Norte de Minas may be associated with lower
factors for complications of the clinical condition and of higher longevity, hence leading the northern portion of the State to
mortality. In this sense, access to health infrastructure and have fewer people in the risk group (57). On the other hand,
Frontiers in Public Health | www.frontiersin.org 12 April 2021 | Volume 9 | Article 586670Campos et al. Vulnerability for the COVID-19 the Zona da Mata is better assisted, which leads its population Besides to the evident differences revealed by the indicators to be longer-lived and, consequently, to have a higher number between the mesoregions of Minas Gerais, data also exhibited of people more susceptible to the health complications caused differences between the municipalities grouped by population by COVID-19. size, with emphasis on the numerical predominance of small Another pivotal issue is that coping with the COVID- municipalities. In this sense, the analysis performed in the 19 pandemic involves changes in the health system and also present study is essential to better understand the possible requires political decisions that affect the management of chronic particularities of these municipalities in the face of the pandemic, non-communicable diseases, as well as patients’ adherence to highlighting the need to formulate specific strategies and public treatment, especially those from less favored social classes (58). policies according to the size of the population. Furthermore, the pandemic scenario increases patients’ fear of The high transmissibility of SARS-COV-2 in large urban seeking health services, which can increase mortality from events centers with population agglomerations results in a rapid and related to the chronic illness (59). Based on the identification exponential increase in the number of cases and deaths from of this regional vulnerability profile, it is possible to outline the entry of the virus into the population (65). In fact, the public policies that address the major diseases associated with the rapid increase in the absolute number of cases requires the worsening of the clinical condition of patients with COVID-19, development of containment measures and, in some cases, as well as specialized care for the elderly, markedly more affected when applied with due urgency, relative success is achieved. by the condition. However, the pandemic is not restricted to large municipalities, With regard to epidemiological aspects, greater vulnerability but also reaches medium-sized and small areas, consolidating the was found in the metropolitan mesoregions of Metropolitana internalization of the disease, which in Brazil reaches more than de Belo Horizonte, Triângulo Mineiro/Alto Paranaíba and Zona 90% of the municipalities (6, 67). da Mata and, in a lesser extent, in the Norte de Minas and The smaller cities did not have large absolute number of Vale do Mucuri. In this sense, the observance of the great cases and deaths compared to the others, but when investigating impact of the mesoregions further south and southeast of the the proportion measures, including incidence, lethality and state becomes relevant when considering that these places are mortality, as performed by this work, it is clear that several small located on the border with the states of São Paulo and Rio municipalities were in a serious situation. Thus, the exposed and de Janeiro, which concentrate the highest number of cases in disseminated absolute data of these cities do not cause as much Brazil. Besides that, the lower socioeconomic development in the impact on the population and public managers as they should, north of Minas Gerais favors the scenario of underreporting of making containment measures, such as social distance, take time cases in the state, which can be associated with a large north- to be employed or adhered by the population and managers. south discrepancy in the numbers found. Thus, social distance This scenario is particularly worrying for the small should be considered through reliable measures, including travel municipalities that were, for the most part, more vulnerable, restrictions or even the institution of lockdown, which have especially in relation to health infrastructure and financial proven effective in countries such as China, South Korea, Iran, resources (68). A large portion of these ones reported few ICU Italy, France and the United States (60). In addition to these beds, few or no respirators and a reduced number of health measures, others widely used worldwide must be promulgated professionals, leading to a high lethality of the disease, since the with greater avidity in the most affected municipalities, including basic care conditions of the most serious cases of COVID-19 are awareness about the use of personal protective equipment, social not guaranteed (45). distance, closing schools and business buildings, quarantine, Based on the regionalization process defined by the Minas cleaning and disinfection and increase in the number of tests Gerais Health Regionalization Master Plan, these small (19, 61–64). municipalities should be assisted by medium and large-sized Considering the joint analysis of all indicators, the lower cities, enabling access to medium and high complexity services in vulnerability of Triângulo Mineiro and Alto Paranaíba was severe cases of the disease (27). However, the reality of the state proven, with better social, economic, population at risk and of Minas Gerais does not meet this proposal, as the assessment health infrastructure indicators. Thus, the highest human demonstrated several discontinuities and inequalities in all development indexes, in addition to a diverse and historically indicators of the state. Alarmingly, the small municipalities are integrated economy to the State of São Paulo, associated with isolated in the middle of the pandemic, without support from a higher presence of young people and the concentration of the medium-sized and large municipalities and without enough hospital resources, integrate factors to reduce vulnerability to resources to improve their own health infrastructure (66, 68). COVID- 19 (65, 66). Similarly, the findings also reported the Municipalities listed to offer this support face the overcrowding greatest vulnerability in Vale do Mucuri, followed by Vale do Rio of beds and the lack of respirators (25). Doce. In these areas, the economy is fragile, basically composed Importantly, some indicators that could contribute to the of the primary sector. Education and sanitation indicators are mapping of the vulnerability of Minas Gerais to COVID- remarkably low and there is a predominance of higher age 19 were not included due to the absence of data related to groups (65). Additionally, the few existing hospital resources are the municipalities, hence hindering the tabulation. The data concentrated especially in the municipalities of Teófilo Otoni included also had a difference in the dates on which they and Governador Valadares, not reaching all the surrounding were made available, since some are only accessed by the 2010 municipalities (66). demographic census conducted by IBGE. Another limitation Frontiers in Public Health | www.frontiersin.org 13 April 2021 | Volume 9 | Article 586670
Campos et al.                                                                                                                                 Vulnerability for the COVID-19

is also related to the database available for consultation, since                         measures are needed to contain the spread of the disease in the
various indicators may be out of date, especially in small                                state as a whole, not just in the most economically important
municipalities where the registration process does not occur or                           regions. For this, the problem of capillarity of the state related
is not done properly, showing the presence of under-notification                          to social, economic and health indicators must be solved, so that
of cases. Nevertheless, it is important to use these data to evaluate                     everyone has a similar capacity to fight the pandemic. As a result,
the vulnerability considering the risk of worsening disease, since                        the state will not only benefit from combating the COVID-19
this article intends to measure the capacity of the cities to contain                     pandemic, but also from combating all inequalities that have been
COVID-19 and its complications.                                                           consolidated in Minas Gerais and directly affect the quality of life
    In addition, in the data tabulation process for MCDA, one                             of the population in the less-assisted regions.
of the steps consists in defining weights for the different data
included, herein determining which ones would have different                              DATA AVAILABILITY STATEMENT
intensities of influence. However, the present study chose to keep
all data with the same weight owing to the lack of evidence,                              The datasets presented in this study can be found in online
showing which factors would have a higher or lower influence                              repositories. The names of the repository/repositories
in the pandemic and the difficulty of stipulating the proportion                          and accession number(s) can be found in the
of this influence. Therefore, the maps and the findings of this                           article/Supplementary Material.
study should be used only as an instrument of guidance for public
policies with other existing tools, and not as the only resource.                         AUTHOR CONTRIBUTIONS
Also, a segmented analysis may be performed by category of
indicators in order to avoid possible differences in the influence                        SO contributed to the conception of the study. SO and IC
of indicators in the compilation of the final result.                                     contributed to the acquisition, analysis and interpretation of
    From the vulnerability analysis performed, it is clear that the                       data, contributed to the statistical analysis, interpretation of data,
demands of the municipalities of Minas Gerais in the context                              and creation of table and figures. VA, KC, and JL participated
of COVID-19 are different, varying according to the region in                             in revising it critically for important intellectual content for
which they are located and their population size. Thus, a public                          discussion topic. All the authors co-wrote the paper and give final
policy planned for the state will have totally different applicability                    approval to the version to be submitted.
and effectiveness depending on the region or municipality in
question. Therefore, a more segmented analysis of the state                               SUPPLEMENTARY MATERIAL
should be conducted, as proposed by this work, in order to
identify the particularities of each municipality and mesoregion                          The Supplementary Material for this article can be found
in the search for interventions that have an effect in a faster                           online at: https://www.frontiersin.org/articles/10.3389/fpubh.
and more practical way, as the context requires. In this scenario,                        2021.586670/full#supplementary-material

REFERENCES                                                                                 8. Ayres JRCM, França Júnior I, Calazans G, Salleti H. Vulnerabilidade e
                                                                                              prevenção em tempos de aids. In: Barbosa R, Parker R, editors. Sexualidade
 1. Jiang F, Deng L, Zhang L, Cai Y, Cheung CW, Xia Z. Review of the clinical                 Pelo Avesso: Direitos, Identidades e Poder. Rio de Janeiro: Relume Dumará
    characteristics of coronavirus disease 2019 (COVID-19). J Gen Intern Med.                 (1999). p. 50–71.
    (2020) 35:1545–9. doi: 10.1007/s11606-020-05762-w                                      9. Sánchez AIM, Bertolozzi MR. Pode o conceito de vulnerabilidade
 2. Hui DS, Azhar EI, Madani TA, Ntoumi F, Kock R, Dar O, et al. The continuing               apoiar a construção do conhecimento em Saúde Coletiva? Ciênc
    2019-nCoV epidemic threat of novel coronaviruses to global health: the latest             Saúde      Colet.    (2007)    12:319.     doi:    10.1590/S1413-81232007000
    2019 novel coronavirus outbreak in Wuhan, China. Int J Infect Dis. (2020)                 200007
    91:264–6. doi: 10.1016/j.ijid.2020.01.009                                             10. Gomes LFAM, Araya MCG, Carignano C. Tomada de Decisão em Cenários
 3. Petrosillo N, Viceconte G, Ergonul O, Ippolito G, Petersen E. COVID-19,                   Complexos: Introdução aos Métodos Discretos do Apoio Multicritério à Decisão.
    SARS and MERS: are they closely related? Clin Microbiol Infect. (2020)                    São Paulo: Pioneira Thomson Learning. (2004). p. 126.
    26:729–34. doi: 10.1016/j.cmi.2020.03.026                                             11. Brazilian Institute of Geography and Statistics. Estimativas Populacionais dos
 4. Kolifarhood G, Aghaali M, Saadati HM, Taherpour N, Rahimi S, Izadi N, et                  Municípios em 2019. (2019). Available online at: https://sidra.ibge.gov.br/
    al. Epidemiological and clinical aspects of Covid-19; a narrative review. Arch            tabela/6579 (accessed June 22, 2020).
    Acad Emerg Med. (2020) 8:1.                                                           12. Brazilian Institute of Geography and Statistics. Censo Demográfico de 2010:
 5. Shereen MA, Khan S, Kazmi A, Bashir N, Siddique R. COVID-19 infection:                    Características da População e dos Domicílios - Resultados do Universo. (2011).
    origin, transmission, and characteristics of human coronaviruses. J Adv Res.              Available online at: https://biblioteca.ibge.gov.br/visualizacao/periodicos/93/
    (2020) 24:91–8. doi: 10.1016/j.jare.2020.03.005                                           cd_2010_caracteristicas_populacao_domicilios.pdf (accessed June 22, 2020).
 6. Brasil. Ministério da Saúde: Situação Epidemiológica da COVID-19. (2021).             13. Diniz AMA, Batella WB. O Estado de minas gerais e suas regiões: um
    Available online at: https://www.gov.br/saude/pt-br (accessed February 11,                resgate histórico das principais propostas oficiais de regionalização. Soc Nat.
    2021).                                                                                    (2005) 17:59–77.
 7. Alves THE, de Souza TA, Silva AS, Ramos NA, de Oliveira SV. Underreporting            14. You H, Wu X, Guo X. Distribution of COVID-19 morbidity rate in
    of death by COVID-19 in Brazil’s second most populous state. medRxiv.                     association with social and economic factors in Wuhan, China: implications
    (2020) Available online at: https://www.medrxiv.org/content/10.1101/2020.                 for urban development. Int J Environ Res Public Health. (2020) 17:3417.
    05.20.20108415v1 (accessed July 3, 2020).                                                 doi: 10.3390/ijerph17103417

Frontiers in Public Health | www.frontiersin.org                                     14                                               April 2021 | Volume 9 | Article 586670
You can also read