SURVEILLANCE METRICS OF SARS-COV-2 TRANSMISSION IN CENTRAL ASIA: LONGITUDINAL TREND ANALYSIS
←
→
Page content transcription
If your browser does not render page correctly, please read the page content below
JOURNAL OF MEDICAL INTERNET RESEARCH                                                                                                               Post et al

     Original Paper

     Surveillance Metrics of SARS-CoV-2 Transmission in Central
     Asia: Longitudinal Trend Analysis

     Lori Ann Post1, PhD; Elana T Benishay2, BSc; Charles B Moss3, PhD; Robert Leo Murphy4, MD; Chad J Achenbach5,
     MD, MPH; Michael G Ison5, MD, MSc; Danielle Resnick6, PhD; Lauren Nadya Singh1, MPH; Janine White1, MA;
     Azraa S Chaudhury2, BA; Michael J Boctor2, BSc; Sarah B Welch1, MPH; James Francis Oehmke1, PhD
     1
      Buehler Center for Health Policy and Economics, Feinberg School of Medicine, Northwestern University, Chicago, IL, United States
     2
      Feinberg School of Medicine, Northwestern University, Chicago, IL, United States
     3
      Institute of Food and Agricultural Sciences, University of Florida, Gainsville, FL, United States
     4
      Institute for Global Health, Feinberg School of Medicine, Northwestern University, Chicago, IL, United States
     5
      Divison of Infectious Disease, Feinberg School of Medicine, Northwestern University, Chicago, IL, United States
     6
      International Food Policy Research Institute, Washington, DC, United States

     Corresponding Author:
     Lori Ann Post, PhD
     Buehler Center for Health Policy and Economics
     Feinberg School of Medicine
     Northwestern University
     420 E Superior
     Chicago, IL, 60611
     United States
     Phone: 1 203 980 7107
     Email: lori.post@northwestern.edu

     Abstract
     Background: SARS-CoV-2, the virus that caused the global COVID-19 pandemic, has severely impacted Central Asia; in
     spring 2020, high numbers of cases and deaths were reported in this region. The second wave of the COVID-19 pandemic is
     currently breaching the borders of Central Asia. Public health surveillance is necessary to inform policy and guide leaders;
     however, existing surveillance explains past transmissions while obscuring shifts in the pandemic, increases in infection rates,
     and the persistence of the transmission of COVID-19.
     Objective: The goal of this study is to provide enhanced surveillance metrics for SARS-CoV-2 transmission that account for
     weekly shifts in the pandemic, including speed, acceleration, jerk, and persistence, to better understand the risk of explosive
     growth in each country and which countries are managing the pandemic successfully.
     Methods: Using a longitudinal trend analysis study design, we extracted 60 days of COVID-19–related data from public health
     registries. We used an empirical difference equation to measure the daily number of cases in the Central Asia region as a function
     of the prior number of cases, level of testing, and weekly shift variables based on a dynamic panel model that was estimated using
     the generalized method of moments approach by implementing the Arellano-Bond estimator in R.
     Results: COVID-19 transmission rates were tracked for the weeks of September 30 to October 6 and October 7-13, 2020, in
     Central Asia. The region averaged 11,730 new cases per day for the first week and 14,514 for the second week. Infection rates
     increased across the region from 4.74 per 100,000 persons to 5.66. Russia and Turkey had the highest 7-day moving averages in
     the region, with 9836 and 1469, respectively, for the week of October 6 and 12,501 and 1603, respectively, for the week of
     October 13. Russia has the fourth highest speed in the region and continues to have positive acceleration, driving the negative
     trend for the entire region as the largest country by population. Armenia is experiencing explosive growth of COVID-19; its
     infection rate of 13.73 for the week of October 6 quickly jumped to 25.19, the highest in the region, the following week. The
     region overall is experiencing increases in its 7-day moving average of new cases, infection, rate, and speed, with continued
     positive acceleration and no sign of a reversal in sight.
     Conclusions: The rapidly evolving COVID-19 pandemic requires novel dynamic surveillance metrics in addition to static
     metrics to effectively analyze the pandemic trajectory and control spread. Policy makers need to know the magnitude of transmission

     https://www.jmir.org/2021/2/e25799                                                                     J Med Internet Res 2021 | vol. 23 | iss. 2 | e25799 | p. 1
                                                                                                                          (page number not for citation purposes)
XSL• FO
RenderX
JOURNAL OF MEDICAL INTERNET RESEARCH Post et al
rates, how quickly they are accelerating, and how previous cases are impacting current caseload due to a lag effect. These metrics
applied to Central Asia suggest that the region is trending negatively, primarily due to minimal restrictions in Russia.
(J Med Internet Res 2021;23(2):e25799) doi: 10.2196/25799
KEYWORDS
SARS-CoV-2 surveillance; second wave; wave two; global COVID-19 surveillance; Central Asia public health surveillance;
Central Asia COVID-19; Central Asia surveillance metrics; dynamic panel data; generalized method of moments; Central Asia
econometrics; Central Asia SARS-CoV-2; Central Asia COVID-19 surveillance system; Central Asia COVID-19 transmission
speed; Central Asia COVID transmission acceleration; COVID-19 transmission deceleration; COVID-19 transmission jerk;
COVID-19 7-day lag; SARS-CoV-2; Arellano-Bond estimator, generalized method of moments; GMM; Armenia; Azerbaijan;
Cyprus; Faeroe Islands; Georgia; Gibraltar; Kazakhstan; Kosovo; Kyrgyzstan; Macedonia; Russia; Tajikistan Turkey; Turkmenistan;
Uzbekistan; COVID-19; surveillance; longitudinal; trend; trend analysis; monitoring; public health; infectious disease; transmission;
risk; management; policy; prevention
[10], contributing to low life expectancy in Russia [11,12].
Introduction Central Asia has one of the highest prevalence rates of tobacco
Background misuse [13]. Misuses of alcohol, tobacco, and other substances
represent both direct and indirect COVID-19 risk factors.
On December 29, 2019, 4 cases of “pneumonia of unknown Drinking alcohol, smoking, and misusing substances increases
etiology” were reported in Wuhan, Hubei Province, China [1]. a person’s risk of being infected with SARS-CoV-2 and having
What began as 4 isolated cases escalated into a global pandemic worse outcomes if infected [14-17]. Moreover, persons who are
of SARS-CoV-2, the virus that causes COVID-19. To date, the self-isolating are at higher risk of substance use disorders
caseload has reached 68,645,081 confirmed cases, and 1,564,496 [18-20]. Substance use disorders also contribute to increases
deaths have been confirmed globally [2]. Nations have been chronic disease [21-23]. During past epidemics, reduced access
greatly impacted by the pandemic, which has resulted in to medical care for individuals with serious illness, such as HIV
significant morbidity and mortality, food insecurity, and an or tuberculosis, resulted in more deaths from complications due
economic recession that has not bottomed out. Global leaders to a lack of health care resources [24,25].
are struggling to balance disease control with salvaging their
plummeting economies in the face of a global pandemic [3]. Food and Water Security
This study aims to examine where and when SARS-CoV-2 was Progress in food security [26] has stalled in Central Asia in
transmitted in Central Asia within the context of a global recent years, with growth in malnourished and undernourished
pandemic by delving into the environmental, sociocultural, and populations [27]. Malnourishment is a function of poverty
public health characteristics of COVID-19. For the purposes of [28,29].
this study, we use the World Bank’s definition of Central Asia,
which includes Armenia, Azerbaijan, Cyprus, Faeroe Islands, Food insecurity is linked to environmental conditions caused
Georgia, Gibraltar, Kazakhstan, Kosovo, Kyrgyzstan, by overuse of the Aral Sea, which has been depleted by 90%
Macedonia, Russia, Tajikistan, Turkey, Turkmenistan, and since 1960 to irrigate large areas of land [30,31]. Safe water is
Uzbekistan [4]. not available for 22 million people (31% of the population)
throughout Kazakhstan, Kyrgyzstan, Uzbekistan, Tajikistan,
History of Central Asia and Turkmenistan. The majority of the affected individuals live
Central Asia is largely composed of nation states that are former in rural areas, where there are limited sewer connections and
Soviet Union member countries. The Union of Soviet Socialist septic tanks [32]. People living near the highly polluted Aral
Republics (USSR) was dissolved in 1991 after controlling the Sea have higher levels of tuberculosis, anemia, and cancer, and
region for 68 years, following a coup d’état during President they may be at higher risk of debilitating SARS-CoV-2 infection
Gorbachev’s administration. The former Soviet Union left a [33].
lasting legacy in the former national republics [5]. The USSR Beyond access to food, obesity is becoming more pervasive
shifted from a centralized government and systems to [34] as Central Asian foods mirror the “Western diet” of high
independent states. Many essential institutions, such as national fat and low grains [26]. Traditional dishes have high contents
currency systems and military forces, were developed from the of sodium, likely due to the “Silk Road” pattern in which
ground up. Many of these fledgling nations failed to achieve countries along the former Silk Road, a trade route through
democracies, which led to more chaos and conflict. The “colored Central Asia established in the second century BC [35,36], use
revolutions” from 1999-2005, a series of mass protests and riots, large quantities of salt for food preservation [37]. Obesity also
lead to the overthrow of the semiauthoritarian regimes in Serbia, contributes to chronic metabolic diseases and is associated with
Georgia, Ukraine, and Kyrgyzstan [6]. worse outcomes in those infected with SARS-CoV-2 [38].
Public health systems in these new nations in Central Asia faced Current Politics
many challenges, including endemic infectious diseases [7]
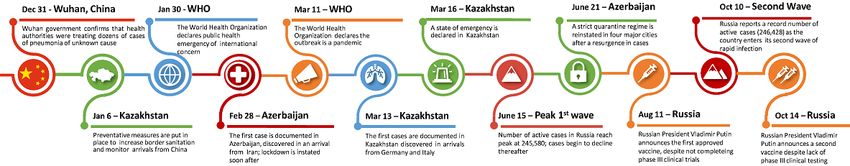
such as tuberculosis, HIV, and substance use disorders [8,9]. Because Kazakhstan and China share a border, preventative
Alcohol poisoning is relatively common in the former USSR measures in Kazakhstan were established as early as January
https://www.jmir.org/2021/2/e25799 J Med Internet Res 2021 | vol. 23 | iss. 2 | e25799 | p. 2
(page number not for citation purposes)
XSL• FO
RenderXJOURNAL OF MEDICAL INTERNET RESEARCH Post et al
6, 2020, enforcing increased border sanitation and monitoring health regulator was the first in the world to approve a
arrivals from China [39]. The first cases of COVID-19 in SARS-CoV-2 vaccine for mass use [56]. This approval has been
Kazakhstan, discovered in people arriving from Germany and criticized as unsafe because the standard phase III clinical trials
Italy, were recorded on March 13. A state of emergency was for new drugs were not completed at the time of his
announced on March 16; schools converted to remote learning, announcement [57]. While Russia’s first approved vaccine,
and quarantines were established in some areas as early as known as “Sputnik V,” was still undergoing phase III trials, on
March 19 [39]. October 14, President Putin announced the approval of a second
SARS-CoV-2 vaccine [58]. Without adequate testing, we do
Many countries in the region have had disruptions in the labor
not know the possible detrimental side effects of these vaccines,
market. The oil economies in Kazakhstan and Azerbaijan have
which may undermine attempts by the international community
been negatively impacted [40]. Tajikistan has experienced rising
to provide safe immunization [56].
unemployment [29], and the poverty rate has risen across Central
Asia [41-46]. Other than vaccine efforts, Russia has not implemented
significant public health measures. During the first wave of
State governments have attempted to minimize the impact of
infections in March 2020, no financial support was given to
the virus; complaints about lack of adequate personal protective
small or medium-sized businesses despite instructions for
equipment in Russia were suppressed [47], medical authorities
employees to stay home on paid leave [59]. However, in
who gave public health advice in Turkey were criminally
mid-April, it was announced that over 100 billion rubles (US
investigated [48], and the oppressive Turkmenistan government
$1.325 billion) would be allocated to support small and
denied the existence of even a single case of SARS-CoV-2 [49].
medium-sized businesses [54]. The number of active cases in
In the electoral authoritarian regime of Azerbaijan, lockdown Russia reached a peak of 245,580 on June 15 and then began
was established immediately following the first confirmed case to decline [60]. With the second wave of infections in October
of SARS-CoV-2 on February 28. The capital of Azerbaijan after loosening restrictions, Russia saw a spike in cases and
instated highly restrictive rules and shut down its border with reported the fourth highest number of SARS-CoV-2 cases
the Islamic Republic of Iran, where cases were spreading worldwide, behind the United States, India, and Brazil [61].
quickly, the next day [50]. Russia reported a record number of 29,039 active cases on
December 6 [60]. Despite record numbers of daily cases, with
In Azerbaijan, violations of the quarantine mandate were
26,097 new cases on December 8 for a total of 2,541,199 cases,
punishable by fines, custodial restraint, and prison time [51].
protective measures continued to be rolled back. While gloves
Severe rules were briefly in place; people aged over 65 years
and masks are required in the Moscow metro, citizens must
were prohibited from leaving their homes [50], and citizens
register their telephone number before entering a bar or
were required to send an SMS text message to a government
nightclub; moreover, museums are closed, international flights
telephone number to request permission to leave their home for
are gradually being reinstated, and students in first through fifth
up to three hours. The government inactivated the cellular
grade are returning to school [62]. As early as July, the mayor
service of political rivals so that they could not request
of Moscow announced that wearing masks would no longer be
permission to leave their residences and thus were confined to
required outdoors as new COVID-19 cases dwindled in the
their homes [51]. The pandemic has been exploited as a means
capital [54]. Figure 1 shows the timeline of the COVID-19
to restrict individual human rights in other countries as well;
pandemic from December 2019 to October 2020 in Central
government access to private cell phone data was allowed in
Asia.
Armenia [52], and protests were restricted in Russia [53]. In
both Uzbekistan and Tajikistan [54], penalties were introduced Without an effective vaccine to prevent COVID-19, Central
for the spread of false information about the virus through the Asian leaders require an effective SARS-CoV-2 surveillance
media. system that enables their governments to make safe and
informed decisions [63-70]. Public health departments [71-76]
While Azerbaijan initially slowed the spread of the virus [55]
plus several universities [77] and media outlets [78,79] are
and relaxed restrictions in May, the strict quarantine regime
tracking the novel coronavirus using raw data regarding the
was reinstated in four major cities on June 21, 2020, after a
number of new infections, testing, positivity, basic reproduction
surge in cases.
number (R0), and deaths, among other measures, such as local
Shocking the international community, Russian President hospital capacity.
Vladimir Putin announced on August 11 that their country’s
Figure 1. Timeline of the COVID-19 pandemic in Central Asia.
https://www.jmir.org/2021/2/e25799 J Med Internet Res 2021 | vol. 23 | iss. 2 | e25799 | p. 3
(page number not for citation purposes)
XSL• FO
RenderXJOURNAL OF MEDICAL INTERNET RESEARCH Post et al
To that end, the objective of our research was to use a faster than, the same as, or slower than in the previous weeks.
longitudinal trend analysis study design in concert with dynamic This resulted in a dynamic panel model that was estimated using
panel modeling and method of moments approaches to correct the generalized method of moments approach by implementing
for existing surveillance data limitations [80,81]. Specifically, the Arellano-Bond estimator in R (R Project) [85].
we measured significant weekly shifts in the increase, decrease,
Arellano-Bond estimation of difference equations has several
or plateaued transmission of SARS-CoV-2. Our study measured
statistical advantages: (1) it enables statistical examination of
the underlying causal effect from the previous week that
the predictive ability of a model and the validity of the model
persisted through the current week, with a 7-day persistence
specification; (2) it corrects for autocorrelation and
rate to explain a clustering or declustering effect. The 7-day
heteroscedasticity; (3) it has good properties for handling data
persistence represents an underlying disease transmission wave,
with a small number of time periods and large number of states;
where a large number of transmissions that resulted in a large
and (4) it corrects for omitted variables and provides a statistical
number of infections on 1 day then “echoes” forward into a
test of correction validity. With these advantages, the method
large number of new transmissions and hence a large number
is applicable to ascertaining and statistically validating changes
of new cases in the next 7 days. An example of the 7-day lag
in the evolution of the pandemic within a period of ≤1 week,
would be large sporting events in the United Kingdom that drew
such as changes in the reproduction rate. See Oehmke et al
large crowds over an extended period of time even after cases
[80,81] for a detailed discussion of the methods. Finally, we
were confirmed in the country. Other potential “super-spreader”
calculated these indicators to inform public health leaders of
events occurred in Turkmenistan, when a mass cycling rally
where to take corrective action at a local level. China enjoyed
was held on April 7 to celebrate World Health Day [82]. In
great success at controlling the pandemic by closing down
summary, we measured negative and positive shifts in the
smaller geographical regions, preserving the larger economy
transmission of SARS-CoV-2 or its acceleration and deceleration
and preventing other adverse outcomes from a national
rates. We measured negative and positive shifts in the
quarantine.
transmission of SARS-CoV-2 as well as the speed, acceleration
or deceleration, and jerk rates along with the 7-day persistence,
which do not suffer from sampling bias. For details, see Oehmke
Results
et al [80,81]. Our surveillance metric will provide public health Country Regression Results
surveillance data to inform governments that are making
decisions regarding disease control, mitigation strategies, and We analyzed the 12 countries that are included in the Central
reopening policies as they continue to manage this Asia region as defined by the World Bank. The results of the
unprecedented situation. associated regression supporting the weekly surveillance metrics
are captured in Table 1. The Wald statistic for regression was
Methods significant (χ27=14,217, P.99) and failed to reject
This study relies on a longitudinal trend analysis of data
the validity of overidentifying restrictions.
collected from the Foundation for Innovative New Diagnostics
(FIND) [83]. FIND compiles data from multiple sources across As shown in Table 1, the 1-day lag coefficient is positive and
individual websites, statistical reports, and press releases. Data significant (1.075, PJOURNAL OF MEDICAL INTERNET RESEARCH Post et al
Table 1. Arellano-Bond dynamic panel data modeling of the number of daily infections reported by country in Central Asia from September 30 to
October 13, 2020.
Variable Values P value
1-day lag coefficient 1.075JOURNAL OF MEDICAL INTERNET RESEARCH Post et al
Table 3. Static surveillance metrics for the week of October 7-13, 2020.
Country New Cumulative 7-day mov- Infection New deaths, Cumulative 7-day moving aver- Death rate
COVID-19 COVID-19 ing average rate (per n deaths, n age of the death rate (per 100,000
cases, n cases, n of new cases 100,000 per- persons)
sons)
Armenia 745 57,566 640.43 25.19 6 1032 6.00 0.20
Azerbaijan 277 42,381 207.14 2.76 3 612 1.71 0.03
Cyprus 83 2130 36.29 6.92 0 25 0.29 0.00
Georgia 569 12,841 513.71 15.29 9 102 6.29 0.24
Kazakhstan 83 108,984 88.86 0.45 22 1768 3.14 0.12
Kosovo 98 16,345 65.14 5.46 1 649 2.00 0.06
Kyrgyzstan 343 49,871 296.00 5.31 2 1092 3.71 0.03
North Macedonia 80 21,193 299.57 3.84 3 800 4.57 0.14
Russia 13,690 1,318,783 12,500.86 9.48 240 22,834 182.14 0.17
Tajikistan 37 10,297 40.43 0.40 0 79 0.14 0.00
Turkey 1632 338,779 1603.14 1.96 62 8957 57.71 0.07
Uzbekistan 323 61,642 328.43 0.96 2 511 3.14 0.01
Table 4. Novel surveillance metrics for the week of September 30 to October 6, 2020.
Country Speeda Accelerationb Jerkc 7-day persistence effect on speedd
Armenia 15.4 0.4 0.3 –0.6
Azerbaijan 1.2 0.1 0 –0.1
Cyprus 1.6 0 –0.1 –0.1
Georgia 13.0 0.9 –0.2 –0.4
Kazakhstan 0.4 0 0 0
Kosovo 2.5 –0.2 –0.1 –0.1
Kyrgyzstan 2.8 0 –0.2 –0.1
North Macedonia 9.0 0.8 0.5 –0.3
Russia 6.8 0.3 0.1 –0.3
Tajikistan 0.4 0 0.0 0
Turkey 1.8 0 0.0 –0.1
Uzbekistan 1.3 –0.1 0.0 –0.1
a
Speed: daily positives per 100,000 persons (weekly average of new daily cases per 100,000 persons).
b
Acceleration: day-to-day change in the number of positives per day (weekly average per 100,000 persons).
c
Jerk: week-over-week change in acceleration per 100,000 persons.
d
7-day persistence effect on speed: number of new cases per day per 100,000 persons.
https://www.jmir.org/2021/2/e25799 J Med Internet Res 2021 | vol. 23 | iss. 2 | e25799 | p. 6
(page number not for citation purposes)
XSL• FO
RenderXJOURNAL OF MEDICAL INTERNET RESEARCH Post et al
Table 5. Novel surveillance metrics for the week of October 7-13, 2020.
Country Speeda Accelerationb Jerkc 7-day persistence effect on speedd
Armenia 21.7 1.6 0.7 –0.8
Azerbaijan 2.1 0.2 0.2 –0.1
Cyprus 3.0 0.6 0.4 –0.1
Georgia 13.8 0.1 0.5 –0.7
Kazakhstan 0.5 0 0 0
Kosovo 3.6 0.5 0.3 –0.1
Kyrgyzstan 4.6 0.4 0.2 –0.1
North Macedonia 14.4 –1.0 –1.6 –0.5
Russia 5.2 0.1 0.0 –0.2
Tajikistan 8.7 0.2 0.0 –0.4
Turkey 0.4 0 0.0 0
Uzbekistan 1.9 0 0.0 –0.1
a
Speed: daily positives per 100,000 persons (weekly average of new daily cases per 100,000 persons).
b
Acceleration: day-to-day change in the number of positives per day (weekly average per 100,000 persons).
c
Jerk: week-over-week change in acceleration per 100,000 persons.
d
7-day persistence effect on speed: number of new cases per day per 100,000 persons.
Table 6. Comparison of 1-day persistence in the four countries in Central Asia with positive significant positive accelerations for the week of October
6, 2020.
Country 1-day persistence
Week of September 30 Week of October 6
Armenia 16.1 21.5
Georgia 13.0 16.5
North Macedonia 8.8 14.8
Russia 7.0 9.1
Table 7. Most populous countries in Central Asia as of 2020.
Country Population as of 2020, n
Russia 145,953,632
Turkey 84,621,255
Uzbekistan 33,469,203
Kazakhstan 18,776,707
Russia and Turkey had the highest 7-day moving averages in Russia and Turkey also had the highest 7-day moving averages
the region, at 9836 and 1469, respectively, for the week of of deaths in the region, with Russia at 157.57 per 100,000
October 6, and 12,501 and 1603, respectively, for the week of persons for the week of October 6 and Turkey at 60.43.
October 13 (Tables 2 and 3). In terms of infection rate, Together, they accounted for approximately 90% of the deaths
accounting for population, Russia was at 7.95 per 100,000 reported in the region. Up to October 13, the region had reported
persons and Turkey was at 1.81 for the week of October 06. 38,461 cumulative deaths. For the week of 10/06, North
The countries that had the highest infection rates in the region Macedonia and Armenia had the highest death rates per 100,000
included Georgia, at 14.76 per 100,000 persons, and Armenia, persons in the region, at 0.38 and 0.20, respectively. Armenia
at 13.73. For the following week, the infection rate in Armenia maintained a death rate of 0.20 per 100,000 persons the
jumped to the highest in the region, at 25.19 per 100,000 following week. Georgia had the highest death rate the week
persons, while Georgia had a very slight increase to 15.29. of 10/13 at 0.24 per 100,000 persons, up from 0.11 the previous
Kazakhstan had the lowest infection rate in the region, at 0.36 week.
per 100,000 persons for the week of October 6.
https://www.jmir.org/2021/2/e25799 J Med Internet Res 2021 | vol. 23 | iss. 2 | e25799 | p. 7
(page number not for citation purposes)
XSL• FO
RenderXJOURNAL OF MEDICAL INTERNET RESEARCH Post et al
The 1-day persistence is an indicator of a clustering effect where which increased to 14.4. The region overall had an increase in
an event on a particular day causes an increase in the number speed from 4.2 to 5.2.
of cases on adjoining days. As shown in Table 6, the 1-day
Speed is best used in conjunction with acceleration and jerk,
persistence was highest in Armenia at 16.1, and it increased to
which can provide further insight into potential pandemic
21.5 the following week. North Macedonia saw a large increase
trajectory changes. Four countries in the region had significant
from 8.8 to 16.5, with Georgia and Russia seeing smaller
positive accelerations for the week of October 6: Georgia at 0.9,
increases from 13.0 to 14.8 and 7.0 to 9.1, respectively.
North Macedonia at 0.8, Armenia at 0.4, and Russia at 0.3.
Largely consistent with infection rates, Armenia, Georgia, and North Macedonia, Armenia, and Russia also had positive jerks.
North Macedonia had the highest speed or average of new daily During the following week, in addition to the highest speed,
cases per 100,000 persons. During the week of October 6, Armenia had the highest acceleration and jerk in the region.
Armenia had a speed of 15.4, increasing to 21.7 the following Figure 2 shows shows weekly trends of SARS-CoV-2 in Central
week. Georgia had a speed of 13.0, which increased slightly the Asia [86], and additional trends can be found in Multimedia
following week to 13.8. North Macedonia had a speed of 9.0, Appendices 1-5.
Figure 2. Weekly SARS-CoV2 trends in Central Asia [86].
cases, cumulative cases, deaths, and 7-day moving averages.
Discussion These metrics provide a view of the current state of the
Principal Results pandemic but are unable to provide any insight into the change
in the speed of the pandemic over time or potential shifts in its
COVID-19 poses a significant threat to the Central Asian region, trajectory, evolving from controlled spread to rapid growth or
which is largely composed of former Soviet republics. These vice versa. These metrics also provide limited utility in
countries continue to suffer from food insecurity, high levels comparing countries to each other and in analyzing countries
of poverty, and variation in health care quality and access as with smaller populations. Novel metrics such as speed,
the region continues on its journey of transitioning from a acceleration, and jerk help contextualize static metrics and
centralized Soviet medical system. The population also suffers provide a view of trajectory over time, enabling potential
from multiple endemic infections, such as HIV/AIDS and anticipation of how the pandemic will evolve in the future.
tuberculosis. Russia and Turkey comprise the bulk of the
population in Central Asia, and these countries are facing Considering the static and dynamic metrics, it is apparent that
growing burdens of chronic disease and some of the highest the Central Asian region is trending negatively. The region saw
obesity rates in Europe. Due to the combination of these factors, an increase in 7-day moving average of new cases, infection
the region is vulnerable to negative outcomes from the rate, and speed for the week of October 13 compared to the
COVID-19 pandemic. To date, the region has seen variations week of October 6, with continued positive acceleration. This
in policy intervention to control the spread of COVID-19 and trend is largely driven by Russia and Turkey, which together
mitigate outbreaks. Some countries, such as Kazakhstan and encompass over 70% of the region’s population and showed
Azerbaijan, imposed strict and early lockdowns, while others, the highest 7-day moving averages in the region. Russia has the
such as Russia, imposed more limited interventions. fourth highest speed in the region and continues to experience
positive acceleration.
Metrics tracking the progression of COVID-19 in Central Asia
to date have largely been static, including measures such as new Kazakhstan, the fourth most populous country in the region,
had the lowest infection rate for the week of October 6. This is
https://www.jmir.org/2021/2/e25799 J Med Internet Res 2021 | vol. 23 | iss. 2 | e25799 | p. 8
(page number not for citation purposes)
XSL• FO
RenderXJOURNAL OF MEDICAL INTERNET RESEARCH Post et al
likely due to a continued emphasis on policy interventions to then to attempt to measure those model parameters [88], which
curb the spread of COVID-19. Authorities in Kazakhstan took involves contact tracing to determine the spread of the disease
some of the earliest precautions to prevent infections and [89-92]. With an incubation period of up to 14 days [93],
continue to strictly enforce pandemic mitigation measures, modeling this spread can take months. Early estimates of
including halting the easing of restrictions due to the global COVID-19 were developed using the method by Lipsitch et al
spike in COVID-19 cases in recent weeks. [94], which was used for contact tracing in Wuhan and Italy;
however, the statistical properties were weak [95-100]. Zhao et
Turkey, while contributing a significant portion of the total
al [96] estimated the serial interval distribution and R0 based
cases in the region due to its population size, has maintained
relatively low infection rates of 1.81 and 1.96 per 100,000 on only 6 pairs of cases, which is insufficient to understand the
persons for the weeks of October 6 and 13, respectively. Turkey transmission of COVID-19 [101]. This results in relaxing of
has taken significant precautions to mitigate the spread of the the assumptions in these models, such as disaggregating the
virus, and authorities continue to enforce rigorous mask wearing population by geography and modeling within-geography and
and social distancing guidelines along with local quarantines across-geography personal interactions [102]. Martcheva [103]
when necessary. developed a dynamic model from several contagion models and
their possible dynamics [104,105]. They are limited to the
Armenia is experiencing uncontrolled spread of COVID-19, statistical inference of parameter values from actual data [106].
with an infection rate of 13.73 per 100,000 persons for the week
of October 6 quickly jumping to 25.19, the highest in the region, Novel surveillance metrics allow for a more nuanced analysis
the following week. The pandemic speed, consistent with the of the COVID-19 pandemic and together with static metrics,
infection rate trajectory, increased from 15.4 to 21.7, with an can enable policymakers to make informed decisions to control
acceleration increase from 0.4 to 1.6. This change is likely due the spread of the pandemic and prevent further outbreaks. Novel
to the recent lifting of the COVID-19 state of emergency, which dynamic metrics include speed, acceleration, jerk, and 7-day
allowed the resumption of in-person schooling and international persistence, and they provide potential insight into how the
flights, among other activities. pandemic will evolve in the future.
After Armenia, Georgia and Russia had the highest infection The analysis of Central Asia using static and novel surveillance
rates in the region for the week of October 13. Russia continues metrics suggests that the region is precariously positioned and
to resist implementing interventions to curb the spread of trending negatively. Russia, the largest country by population,
COVID-19, with no mask mandates, capacity caps, or nightlife continues to have high infection rates and one of the highest
restrictions. In addition to the significant focus on developing speeds of infection. With no sign of increasing restrictions, it
an effective vaccine, there has been limited intervention to is unlikely that this trend will reverse and that outbreaks in the
manage the spread of COVID-19 in Russia. This policy stance region will be controlled.
is impacting the trajectory of the region, which is trending Limitations
negatively with no sign of a reversal in sight.
Our data are limited by reporting methods across individual
Conclusion countries. Some countries, such as Turkmenistan, refuse to
The rapid evolution, novel outbreaks, and frequently fluctuating acknowledge COVID-19 cases. Variation in testing and
trajectory of COVID-19 cannot be adequately assessed using infrastructure may impact the number of cases reported by other
static public health measures alone. Static measures, including countries. The data are reported at a national level, which does
the number of new COVID-19 cases, number of cumulative not enable any subnational analysis.
COVID-19 cases, 7-day moving average of new cases, rate of Comparison to Prior Work
infection, number of new deaths, number of cumulative deaths,
This study is part of a broader research program at Northwestern
7-day moving average of number of deaths, and death rates,
Feinberg School of Medicine (The Global SARS-CoV-2
provide a current view of the state of the pandemic. However,
Surveillance Project: Policy, Persistence, & Transmission).
these measures do not provide any insight into how the trajectory
Novel surveillance metrics, including speed, acceleration, jerk,
of the pandemic may change over time.
and 7-day persistence, have been developed by this research
Generally, the approach to modeling the spread of COVID-19 program and are being applied to all global regions.
is to assume there is an underlying contagion model [87] and
Acknowledgments
This publication was made possible through support provided by Feed the Future through the US Agency for International
Development under the terms of Contract No. 7200LA1800003. The opinions expressed herein are those of the authors and do
not necessarily reflect the views of the US Agency for International Development.
Conflicts of Interest
None declared.
https://www.jmir.org/2021/2/e25799 J Med Internet Res 2021 | vol. 23 | iss. 2 | e25799 | p. 9
(page number not for citation purposes)
XSL• FO
RenderXJOURNAL OF MEDICAL INTERNET RESEARCH Post et al
Multimedia Appendix 1
Weekly Cental Asia SARS-CoV-2 statistics by country.
[PNG File , 154 KB-Multimedia Appendix 1]
Multimedia Appendix 2
Weekly Central Asia 7-day persistence map.
[PNG File , 372 KB-Multimedia Appendix 2]
Multimedia Appendix 3
Weekly Central Asia statistics.
[PNG File , 199 KB-Multimedia Appendix 3]
Multimedia Appendix 4
Weekly Central Asia jerk map.
[PNG File , 359 KB-Multimedia Appendix 4]
Multimedia Appendix 5
Weekly Central Asia acceleration jerk map.
[PNG File , 434 KB-Multimedia Appendix 5]
References
1. Li Q, Guan X, Wu P, Wang X, Zhou L, Tong Y, et al. Early transmission dynamics in Wuhan, China, of novel
coronavirus-infected pneumonia. N Engl J Med 2020 Mar 26;382(13):1199-1207 [FREE Full text] [doi:
10.1056/NEJMoa2001316] [Medline: 31995857]
2. COVID-19 Dashboard by the Center for Systems Science and Engineering (CSSE) at Johns Hopkins University (JHU).
Johns Hopkins Coronavirus Resource Center. URL: https://coronavirus.jhu.edu/map.html [accessed 2020-12-09]
3. McKee M, Stuckler D. If the world fails to protect the economy, COVID-19 will damage health not just now but also in
the future. Nature Medicine. 2020 ;26(5):640-642.
4. The World Bank in Europe and Central Asia. The World Bank. URL: https://www.worldbank.org/en/region/eca [accessed
2020-08-10]
5. Collapse of the Soviet Union. Encyclopaedia Britannica. URL: https://www.britannica.com/event/
the-collapse-of-the-Soviet-Union#ref1258663 [accessed 2021-01-25]
6. D'Anieri P. Explaining the success and failure of post-communist revolutions. CPCS 2006;39(3):331-350. [doi:
10.1016/j.postcomstud.2006.06.002]
7. Adambekov S, Kaiyrlykyzy A, Igissinov N, Linkov F. Health challenges in Kazakhstan and Central Asia. J Epidemiol
Community Health 2016;70(1):104-108. [Medline: 26254293]
8. Schluger NW, El-Bassel N, Hermosilla S, Terlikbayeva A, Darisheva M, Aifah A, et al. Tuberculosis, drug use and HIV
infection in Central Asia: an urgent need for attention. Drug Alcohol Depend 2013 Nov;132 Suppl 1:S32-S36. [doi:
10.1016/j.drugalcdep.2013.07.012] [Medline: 23928052]
9. Altice FL, Azbel L, Stone J, Brooks-Pollock E, Smyrnov P, Dvoriak S, et al. The perfect storm: incarceration and the
high-risk environment perpetuating transmission of HIV, hepatitis C virus, and tuberculosis in Eastern Europe and Central
Asia. Lancet 2016 Sep;388(10050):1228-1248. [doi: 10.1016/s0140-6736(16)30856-x]
10. Stickley A, Leinsalu M, Andreev E, Razvodovsky Y, Vågerö D, McKee M. Alcohol poisoning in Russia and the countries
in the European part of the former Soviet Union, 1970 2002. Eur J Public Health 2007 Oct 27;17(5):444-449. [doi:
10.1093/eurpub/ckl275] [Medline: 17327281]
11. Leon DA, Chenet L, Shkolnikov VM, Zakharov S, Shapiro J, Rakhmanova G, et al. Huge variation in Russian mortality
rates 1984–94: artefact, alcohol, or what? Lancet 1997 Aug;350(9075):383-388. [doi: 10.1016/s0140-6736(97)03360-6]
12. Nemtsov A. Alcohol-related human losses in Russia in the 1980s and 1990s. Addiction 2002 Nov;97(11):1413-1425. [doi:
10.1046/j.1360-0443.2002.00262.x] [Medline: 12410782]
13. Wadhwa D. Men smoke 5 times more than women. World Bank Blogs. 2019 May 23. URL: https://blogs.worldbank.org/
opendata/
men-smoke-5-times-more-women#:~:text=Overall%2C%20smoking%20is%20most%20prevalent,by%20gender%20is%20more%20extreme
[accessed 2020-08-11]
14. Stockwell T, Andreasson S, Cherpitel C, Chikritzhs T, Dangardt F, Holder H, et al. The burden of alcohol on health care
during COVID-19. Drug Alcohol Rev 2021 Jan;40(1):3-7 [FREE Full text] [doi: 10.1111/dar.13143] [Medline: 32835427]
https://www.jmir.org/2021/2/e25799 J Med Internet Res 2021 | vol. 23 | iss. 2 | e25799 | p. 10
(page number not for citation purposes)
XSL• FO
RenderXJOURNAL OF MEDICAL INTERNET RESEARCH Post et al
15. Saengow U, Assanangkornchai S, Casswell S. Alcohol: a probable risk factor of COVID-19 severity. Addiction 2021 Jan
12;116(1):204-205 [FREE Full text] [doi: 10.1111/add.15194] [Medline: 32688440]
16. Spagnolo PA, Montemitro C, Leggio L. New Challenges in Addiction Medicine: COVID-19 Infection in Patients With
Alcohol and Substance Use Disorders-The Perfect Storm. Am J Psychiatry 2020 Sep 01;177(9):805-807. [doi:
10.1176/appi.ajp.2020.20040417] [Medline: 32660296]
17. Hamer M, Kivimäki M, Gale CR, Batty GD. Lifestyle risk factors, inflammatory mechanisms, and COVID-19 hospitalization:
A community-based cohort study of 387,109 adults in UK. Brain Behav Immun 2020 Jul;87:184-187 [FREE Full text]
[doi: 10.1016/j.bbi.2020.05.059] [Medline: 32454138]
18. Volkow N. Collision of the COVID-19 and Addiction Epidemics. Ann Intern Med 2020 Jul 07;173(1):61-62 [FREE Full
text] [doi: 10.7326/M20-1212] [Medline: 32240293]
19. Hochstatter KR, Akhtar WZ, Dietz S, Pe-Romashko K, Gustafson DH, Shah DV, et al. Potential Influences of the COVID-19
Pandemic on Drug Use and HIV Care Among People Living with HIV and Substance Use Disorders: Experience from a
Pilot mHealth Intervention. AIDS Behav 2020 Jul 23 [FREE Full text] [doi: 10.1007/s10461-020-02976-1] [Medline:
32705370]
20. Biddle N, Edwards B, Gray M, Sollis K. Alcohol consumption during the COVID-19 period: May 2020. ANU Centre for
Social Research and Methods. 2020 May. URL: https://csrm.cass.anu.edu.au/sites/default/files/docs/2020/6/
Alcohol_consumption_during_the_COVID-19_period.pdf [accessed 2021-01-25]
21. Frishman WH, Del Vecchio A, Sanal S, Ismail A. Cardiovascular manifestations of substance abuse: part 2: alcohol,
amphetamines, heroin, cannabis, and caffeine. Heart Dis 2003;5(4):253-271. [doi: 10.1097/01.hdx.0000080713.09303.a6]
[Medline: 12877759]
22. Wu L, Zhu H, Ghitza UE. Multicomorbidity of chronic diseases and substance use disorders and their association with
hospitalization: Results from electronic health records data. Drug Alcohol Depend 2018 Nov 01;192:316-323 [FREE Full
text] [doi: 10.1016/j.drugalcdep.2018.08.013] [Medline: 30312893]
23. Degenhardt L, Charlson F, Ferrari A, Santomauro D, Erskine H, Mantilla-Herrara A, et al. The global burden of disease
attributable to alcohol and drug use in 195 countries and territories, 1990–2016: a systematic analysis for the Global Burden
of Disease Study 2016. Lancet Psychiatry 2018 Dec;5(12):987-1012. [doi: 10.1016/s2215-0366(18)30337-7]
24. COVID-19: Avoiding a ‘second tragedy’ for those with TB. Médecins Sans Frontières. 2020 Mar 23. URL: https://www.
msf.org/covid-19-how-avoid-second-tragedy-those-tuberculosis [accessed 2020-08-09]
25. Fossat M. In remote Kyrgyzstan, COVID-19 puts a strain on the health system. Médecins Sans Frontières. 2020 Jul 22.
URL: https://www.msf.org/kyrgyzstan-covid-19-strains-health-system [accessed 2020-08-09]
26. Sedik D. Europe and Central Asia - Regional overview of food insecurity. Food and Agriculture Organizations of the United
Nations. 2017. URL: http://www.fao.org/3/a-i6877e.pdf [accessed 2021-01-25]
27. Europe and Central Asia Regional Overview of Food Security and Nutrition. Food and Agriculture Organization of the
United Nations. 2019. URL: http://www.fao.org/3/ca7153en/CA7153EN.pdf [accessed 2021-01-25]
28. The State of Food Security and Nutrition in the World 2019. Food and Agriculture Organization of the United Nations.
2019. URL: https://docs.wfp.org/api/documents/WFP-0000106760/download/?_ga=2.37517920.1134316896.
1611609114-2001096053.1611609114 [accessed 2021-01-25]
29. William SA. Economic and Social Impacts of COVID-19: Updates from the Listening to Tajikistan Survey. World Bank.
2020 Jul 13. URL: https://www.worldbank.org/en/news/factsheet/2020/07/13/
economic-and-social-impacts-of-covid-19-update-from-listening-to-tajikistan [accessed 2020-08-05]
30. Sapkota A. Water reuse, food production and public health: Adopting transdisciplinary, systems-based approaches to achieve
water and food security in a changing climate. Environ Res 2019 Apr;171:576-580. [doi: 10.1016/j.envres.2018.11.003]
[Medline: 30477872]
31. Micklin P. The Aral Sea disaster. Annu Rev Earth Planet Sci 2007 May;35(1):47-72. [doi:
10.1146/annurev.earth.35.031306.140120]
32. Burunciuc L. Improving water and sanitation in Central Asia requires determination and shared commitment. World Bank
Blogs. 2019 Dec 24. URL: https://blogs.worldbank.org/europeandcentralasia/
improving-water-and-sanitation-central-asia-requires-determination-and-shared [accessed 2020-08-03]
33. Ataniyazova OA. COVID-19: High risk groups for COVID-19 and challenges for medical universities. Asian Pac J Envi
& Cancer 2020 Jul 17;3(S1):21-23. [doi: 10.31557/apjec.2020.3.s1.21-23]
34. Azam R, Idrees A. Economic growth, obesity and global burden of disease: an exploration. GCU Economic Journal
2019;LII(1&2):67-106.
35. Comas D, Calafell F, Mateu E, Pérez-Lezaun A, Bosch E, Martínez-Arias R, et al. Trading genes along the silk road:
mtDNA sequences and the origin of central Asian populations. Am J Hum Genet 1998 Dec;63(6):1824-1838 [FREE Full
text] [doi: 10.1086/302133] [Medline: 9837835]
36. Kuzmina E. In: Mair VH, editor. The Prehistory of the Silk Road. Philadelphia, PA: University of Pennsylvania Press;
2008.
37. Powles J, Fahimi S, Micha R, Khatibzadeh S, Shi P, Ezzati M, Global Burden of Diseases Nutrition and Chronic Diseases
Expert Group (NutriCoDE). Global, regional and national sodium intakes in 1990 and 2010: a systematic analysis of 24 h
https://www.jmir.org/2021/2/e25799 J Med Internet Res 2021 | vol. 23 | iss. 2 | e25799 | p. 11
(page number not for citation purposes)
XSL• FO
RenderXJOURNAL OF MEDICAL INTERNET RESEARCH Post et al
urinary sodium excretion and dietary surveys worldwide. BMJ Open 2013 Dec 23;3(12):e003733 [FREE Full text] [doi:
10.1136/bmjopen-2013-003733] [Medline: 24366578]
38. Krause M, Gerchman F, Friedman R. Coronavirus infection (SARS-CoV-2) in obesity and diabetes comorbidities: is heat
shock response determinant for the disease complications? Diabetol Metab Syndr 2020 Jul 16;12(1):63 [FREE Full text]
[doi: 10.1186/s13098-020-00572-w] [Medline: 32690985]
39. Maukayeva S, Karimova S. Epidemiologic character of COVID-19 in Kazakhstan: A preliminary report. North Clin Istanb
2020;7(3):210-213 [FREE Full text] [doi: 10.14744/nci.2020.62443] [Medline: 32478290]
40. Global Economic Prospects: Europe and Central Asia. World Bank. 2020 Jun. URL: https://www.worldbank.org/en/region/
eca/brief/global-economic-prospects-europe-and-central-asia [accessed 2020-08-05]
41. Azamat AI, Izvorski IV, Rahardja S. Kazakhstan Economic Update: Navigating the Crisis. World Bank. 2020 Jul 22. URL:
https://www.worldbank.org/en/country/kazakhstan/publication/economic-update-summer-2020 [accessed 2020-08-04]
42. Sumner A, Hoy C, Ortiz-Juarez E. Estimates of the Impact of COVID-19 on Global Poverty. UNU-WIDER. 2020 Apr.
URL: https://www.wider.unu.edu/sites/default/files/Publications/Working-paper/PDF/wp2020-43.pdf [accessed 2021-01-25]
43. Valensisi G. COVID-19 and global poverty. Food and Agriculture Organization of the United Nations. 2020. URL: http:/
/www.fao.org/3/ca8824en/CA8824EN.pdf [accessed 2021-01-25]
44. Nogales R, Oldiges C, Dirksen J, Alkire S. Multidimensional Poverty and COVID-19 Risk Factors: A Rapid Overview of
Interlinked Deprivations across 5.7 Billion People. Oxford Poverty & Human Development Initiative. 2020. URL: https:/
/ophi.org.uk/wp-content/uploads/B53_Covid-19_vs3-2_2020_online.pdf [accessed 2021-01-25]
45. Zar HJ, Dawa J, Fischer GB, Castro-Rodriguez JA. Challenges of COVID-19 in children in low- and middle-income
countries. Paediatr Respir Rev 2020 Sep;35:70-74 [FREE Full text] [doi: 10.1016/j.prrv.2020.06.016] [Medline: 32654854]
46. Dutta P, Andrews C, de MA, Clay T, Chaudhary S. Economic Inclusion for the Poorest and COVID-19: Adaptation and
Early Priorities for Medium- and Longer-Term Recovery. World Bank. 2020 Jun 18. URL: https://reliefweb.int/sites/
reliefweb.int/files/resources/77523_0.pdf [accessed 2021-01-25]
47. Russia: Health Workers Face Retaliation for Speaking Out. Human Rights Watch. 2020 Jun 15. URL: https://www.hrw.org/
news/2020/06/15/russia-health-workers-face-retaliation-speaking-out [accessed 2020-08-09]
48. Turkey: Probes Over Doctors’ Covid-19 Comments. Human Rights Watch. 2020 Jun 10. URL: https://www.hrw.org/news/
2020/06/10/turkey-probes-over-doctors-covid-19-comments [accessed 2020-08-09]
49. Turkmenistan Denies Apparent Covid-19 Outbreak. Human Rights Watch. 2020 Jun 07. URL: https://www.hrw.org/news/
2020/06/27/turkmenistan-denies-apparent-covid-19-outbreak [accessed 2020-08-09]
50. Huseynov V. Azerbaijan hopes to minimize ramifications of coronavirus crisis?Analysis. The Jamestown Foundation. 2020
Apr 16. URL: https://jamestown.org/program/azerbaijan-hopes-to-minimize-ramifications-of-coronavirus-crisis/ [accessed
2021-01-25]
51. Samadov B. Azerbaijan—COVID-19 and a Divided Opposition. The COVID-19 Pandemic in the South Caucasus. 2020
May. URL: https://www.research-collection.ethz.ch/bitstream/handle/20.500.11850/415805/CAD115.
pdf?sequence=2&isAllowed=y [accessed 2021-01-25]
52. Armenia: Law Restricts Privacy Amid COVID-19 Fight. Human Rights Watch. 2020 Apr 03. URL: https://www.hrw.org/
news/2020/04/03/armenia-law-restricts-privacy-amid-covid-19-fight [accessed 2020-08-09]
53. Aitkhozhina D. Most Covid-19 restrictions lifted, but Moscow is not open for protest. Human Rights Watch. 2020 Jul 22.
URL: https://www.hrw.org/news/2020/07/22/most-covid-19-restrictions-lifted-moscow-not-open-protest [accessed
2020-08-09]
54. IFPRI’s COVID-19 policy response (CPR) portal: Identifying trends and implications for food systems. Nigeria Strategy
Support Program. 2020 May 20. URL: http://nssp.ifpri.info/2020/05/20/
ifpris-covid-19-policy-response-cpr-portal-identifying-trends-and-implications-for-food-systems/ [accessed 2021-01-25]
55. Azerbaijan Monthly Economic Update. World Bank Group. 2020 Jul. URL: http://pubdocs.worldbank.org/en/
443481594846767557/AZ-Monthly-Economic-Update-July-2020.pdf [accessed 2020-08-04]
56. Callaway E. Russia's fast-track coronavirus vaccine draws outrage over safety. Nature 2020 Aug;584(7821):334-335. [doi:
10.1038/d41586-020-02386-2] [Medline: 32782400]
57. Zimmer C. ‘This Is All Beyond Stupid.’ Experts Worry About Russia’s Rushed Vaccine. New York Times. 2020 Aug 11.
URL: https://www.nytimes.com/2020/08/11/health/russia-covid-19-vaccine-safety.html [accessed 2020-08-14]
58. Neuman S. Putin Announces Approval Of A 2nd Unproven Coronavirus Vaccine. NPR. 2020 Oct 14. URL: https://www.
npr.org/sections/coronavirus-live-updates/2020/10/14/923785152/
russias-putin-announces-approval-of-a-second-unproven-coronavirus-vaccine [accessed 2020-01-25]
59. Sherwin E. Russia's 'corona-holidays' leave small businesses in freefall. DW. 2020 Apr 03. URL: https://p.dw.com/p/3aQXo
[accessed 2020-10-19]
60. WorldOMeter. Russia. Worldometer. URL: https://www.worldometers.info/coronavirus/country/russia/ [accessed 2020-10-19]
61. Sherwin E. Coronavirus: Russia tightens restrictions, but avoids lockdown. DW. 2020 Oct 16. URL: https://p.dw.com/p/
3k2V8 [accessed 2021-01-25]
62. Coronavirus in Russia: The Latest News. The Moscow Times. URL: https://www.themoscowtimes.com/2020/10/19/
coronavirus-in-russia-the-latest-news-oct-19-a69117 [accessed 2020-10-19]
https://www.jmir.org/2021/2/e25799 J Med Internet Res 2021 | vol. 23 | iss. 2 | e25799 | p. 12
(page number not for citation purposes)
XSL• FO
RenderXJOURNAL OF MEDICAL INTERNET RESEARCH Post et al
63. Teutsch SM. Considerations in Planning a Surveillance System. In: Principles & Practice of Public Health Surveillance.
Oxford, UK: Oxford Scholarship Online; 2010:18-28.
64. Teutsch S, Churchill R. Principles and Practice of Public Health Surveillance. Oxford, UK: Oxford University Press; 2000.
65. Teutsch SM, Thacker SB. Planning a public health surveillance system. Epidemiological bulletin 1995;16(1):1.
66. Thacker S, Berkelman R. Public health surveillance in the United States. Epidemiol Rev 1988;10(1):164-190. [doi:
10.1093/oxfordjournals.epirev.a036021] [Medline: 3066626]
67. Thacker S, Choi K, Brachman P. The surveillance of infectious diseases. JAMA 1983 Mar 04;249(9):1181-1185. [Medline:
6823080]
68. Thacker S, Stroup D. Future directions for comprehensive public health surveillance and health information systems in the
United States. Am J Epidemiol 1994 Sep 01;140(5):383-397. [doi: 10.1093/oxfordjournals.aje.a117261] [Medline: 8067331]
69. Thacker S, Stroup D. Public Health Surveillance and Health Services Research. In: Armenian HK, Shapiro S, editors.
Epidemiology and Health Services. New York, NY: Oxford University Press; 1998:61-82.
70. Thacker SB, Stroup DF, Parrish RG, Anderson HA. Surveillance in environmental public health: issues, systems, and
sources. Am J Public Health 1996 May;86(5):633-638. [doi: 10.2105/ajph.86.5.633] [Medline: 8629712]
71. Coronavirus Disease 2019 (COVID-19). US Centers for Disease Control and Prevention. URL: https://www.cdc.gov/
coronavirus/2019-ncov/index.html [accessed 2021-01-25]
72. Global Surveillance for human infection with coronavirus disease (COVID-19). World Health Organization. URL: https:/
/apps.who.int/iris/handle/10665/330857 [accessed 2021-01-25]
73. EU level surveillance of COVID-19. European Center for Disease Prevention and Control. URL: https://www.ecdc.europa.eu/
en/covid-19/surveillance [accessed 2021-01-25]
74. COVID-19 Surveillance Dashboard. African Union. URL: https://au.int/en/covid19 [accessed 2021-01-25]
75. Hannah RE, Diana B, Edouard M, Joe H, Bobbie M, Charlie G, et al. Coronavirus Pandemic (COVID-19) – the data. Our
World in Data. URL: https://ourworldindata.org/coronavirus-data [accessed 2020-08-14]
76. COVID-19 Situation Dashboard. European Centre for Disease Prevention and Control. URL: https://qap.ecdc.europa.eu/
public/extensions/COVID-19/COVID-19.html [accessed 2021-01-25]
77. Coronavirus Resource Center. Johns Hopkins University of Medicine. URL: https://coronavirus.jhu.edu/ [accessed
2021-01-25]
78. Coronavirus Outbreak. Bloomberg. URL: https://www.bloomberg.com/coronavirus [accessed 2021-01-25]
79. US Coronavirus Cases and Deaths: Track COVID-19 data daily by state and county. USA Facts. URL: https://usafacts.org/
visualizations/coronavirus-covid-19-spread-map/ [accessed 2021-01-25]
80. Oehmke J, Moss C, Singh L, Oehmke T, Post L. Dynamic Panel Surveillance of COVID-19 Transmission in the United
States to Inform Health Policy: Observational Statistical Study. J Med Internet Res 2020 Oct 05;22(10):e21955 [FREE Full
text] [doi: 10.2196/21955] [Medline: 32924962]
81. Oehmke J, Oehmke T, Singh L, Post L. Dynamic Panel Estimate-Based Health Surveillance of SARS-CoV-2 Infection
Rates to Inform Public Health Policy: Model Development and Validation. J Med Internet Res 2020 Sep 22;22(9):e20924
[FREE Full text] [doi: 10.2196/20924] [Medline: 32915762]
82. Abdurasulov A. Coronavirus: Why has Turkmenistan reported no cases? BBC. 2020 Apr 07. URL: https://www.bbc.com/
news/world-asia-52186521 [accessed 2020-08-14]
83. SARS-CoV-2 Test Tracker. Foundation for Innovative New Diagnostics. URL: https://www.finddx.org/covid-19/test-tracker/
[accessed 2020-10-14]
84. FINDCov19TrackerData. GitHub. URL: https://github.com/dsbbfinddx/FINDCov19TrackerData [accessed 2021-01-25]
85. Hansen LP. Large Sample Properties of Generalized Method of Moments Estimators. Econometrica 1982 Jul;50(4):1029.
[doi: 10.2307/1912775]
86. Post L. Global SARS-CoV-2 Surveillance Policy, Persistence, and Transmission - Central Asia. Tableau Public. 2020 Oct
22. URL: https://public.tableau.com/profile/lori.post#!/vizhome/
GlobalSARS-CoV-2SurveillancePolicyPersistenceandTransmission-CentralAsia/Story [accessed 2021-01-26]
87. Iacopini I, Petri G, Barrat A, Latora V. Simplicial models of social contagion. Nat Commun 2019 Jun 06;10(1):2485 [FREE
Full text] [doi: 10.1038/s41467-019-10431-6] [Medline: 31171784]
88. Stock JH. Data gaps and the policy response to the novel coronavirus. National Bureau of Economic Research. 2020. URL:
https://www.nber.org/system/files/working_papers/w26902/w26902.pdf [accessed 2021-01-25]
89. Desjardins M, Hohl A, Delmelle E. Rapid surveillance of COVID-19 in the United States using a prospective space-time
scan statistic: Detecting and evaluating emerging clusters. Appl Geogr 2020 May;118:102202 [FREE Full text] [doi:
10.1016/j.apgeog.2020.102202] [Medline: 32287518]
90. Shi F, Wang J, Shi J, Wu Z, Wang Q, Tang Z, et al. Review of Artificial Intelligence Techniques in Imaging Data Acquisition,
Segmentation, and Diagnosis for COVID-19. IEEE Rev Biomed Eng 2021;14:4-15. [doi: 10.1109/rbme.2020.2987975]
91. Naudé W. Artificial Intelligence against COVID-19: An early review. IZA Institute of Labor Economics. 2020 Apr. URL:
http://ftp.iza.org/dp13110.pdf [accessed 2021-01-25]
92. Tang Z, Zhao W, Xie X, Zhong Z, Shi F, Liu J, et al. Severity assessment of coronavirus disease 2019 (COVID-19) using
quantitative features from chest CT images. ArXiv. Preprint posted online on March 26, 2020 [FREE Full text]
https://www.jmir.org/2021/2/e25799 J Med Internet Res 2021 | vol. 23 | iss. 2 | e25799 | p. 13
(page number not for citation purposes)
XSL• FO
RenderXJOURNAL OF MEDICAL INTERNET RESEARCH Post et al
93. Interim clinical guidance for management of patients with confirmed coronavirus disease (COVID-19). Centers for Disease
Control and Prevention. 2020 Jun 30. URL: https://stacks.cdc.gov/view/cdc/89980 [accessed 2021-01-25]
94. Lipsitch M, Cohen T, Cooper B, Robins JM, Ma S, James L, et al. Transmission dynamics and control of severe acute
respiratory syndrome. Science 2003 Jun 20;300(5627):1966-1970 [FREE Full text] [doi: 10.1126/science.1086616] [Medline:
12766207]
95. Lipsitch M, Swerdlow DL, Finelli L. Defining the epidemiology of COVID-19 — studies needed. N Engl J Med 2020 Mar
26;382(13):1194-1196. [doi: 10.1056/nejmp2002125]
96. Zhao S, Gao D, Zhuang Z, Chong MKC, Cai Y, Ran J, et al. Estimating the serial interval of the novel coronavirus disease
(COVID-19): A statistical analysis using the public data in Hong Kong from January 16 to February 15, 2020. Research
Square. Preprint posted online on May 27, 2020 [FREE Full text] [doi: 10.21203/rs.3.rs-18805/v3]
97. Gatto M, Bertuzzo E, Mari L, Miccoli S, Carraro L, Casagrandi R, et al. Spread and dynamics of the COVID-19 epidemic
in Italy: Effects of emergency containment measures. Proc Natl Acad Sci USA 2020 May 12;117(19):10484-10491 [FREE
Full text] [doi: 10.1073/pnas.2004978117] [Medline: 32327608]
98. You C, Deng Y, Hu W, Sun J, Lin Q, Zhou F, et al. Estimation of the time-varying reproduction number of COVID-19
outbreak in China. Int J Hyg Environ Health 2020 Jul;228:113555 [FREE Full text] [doi: 10.1016/j.ijheh.2020.113555]
[Medline: 32460229]
99. Sanche S, Lin YT, Xu C, Romero-Severson E, Hengartner N, Ke R. High contagiousness and rapid spread of severe acute
respiratory syndrome coronavirus 2. Emerg Infect Dis 2020 Jul;26(7):1470-1477 [FREE Full text] [doi:
10.3201/eid2607.200282] [Medline: 32255761]
100. Giordano G, Blanchini F, Bruno R, Colaneri P, Di Filippo A, Di Matteo A, et al. Modelling the COVID-19 epidemic and
implementation of population-wide interventions in Italy. Nat Med 2020 Jun 22;26(6):855-860 [FREE Full text] [doi:
10.1038/s41591-020-0883-7] [Medline: 32322102]
101. Nishiura H, Linton N, Akhmetzhanov A. Serial interval of novel coronavirus (COVID-19) infections. Int J Infect Dis 2020
Apr;93:284-286 [FREE Full text] [doi: 10.1016/j.ijid.2020.02.060] [Medline: 32145466]
102. Lai C, Shih T, Ko W, Tang H, Hsueh P. Severe acute respiratory syndrome coronavirus 2 (SARS-CoV-2) and coronavirus
disease-2019 (COVID-19): The epidemic and the challenges. Int J Antimicrob Agents 2020 Mar;55(3):105924 [FREE Full
text] [doi: 10.1016/j.ijantimicag.2020.105924] [Medline: 32081636]
103. Martcheva M, Castillo-Chavez C. Diseases with chronic stage in a population with varying size. Mathematical Biosciences
2003 Mar;182(1):1-25. [doi: 10.1016/s0025-5564(02)00184-0]
104. Chen L. Persistent spatial patterns of interacting contagions. Phys. Rev. E 2019 Feb 14;99(2):022308. [doi:
10.1103/physreve.99.022308]
105. Kwuimy CAK, Nazari F, Jiao X, Rohani P, Nataraj C. Nonlinear dynamic analysis of an epidemiological model for
COVID-19 including public behavior and government action. Nonlinear Dyn 2020 Jul 16;101(3):1-15 [FREE Full text]
[doi: 10.1007/s11071-020-05815-z] [Medline: 32836814]
106. Li X, Yang J, Martcheva M. Age Structured Epidemic Modeling. New York, NY: Springer; 2019.
Abbreviations
FIND: Foundation for Innovative New Diagnostics
R0: basic reproduction number
USSR: Union of Soviet Socialist Republics
Edited by G Eysenbach; submitted 16.11.20; peer-reviewed by A Seidmann; comments to author 07.12.20; revised version received
09.12.20; accepted 20.01.21; published 03.02.21
Please cite as:
Post LA, Benishay ET, Moss CB, Murphy RL, Achenbach CJ, Ison MG, Resnick D, Singh LN, White J, Chaudhury AS, Boctor MJ,
Welch SB, Oehmke JF
Surveillance Metrics of SARS-CoV-2 Transmission in Central Asia: Longitudinal Trend Analysis
J Med Internet Res 2021;23(2):e25799
URL: https://www.jmir.org/2021/2/e25799
doi: 10.2196/25799
PMID:
©Lori Ann Post, Elana T Benishay, Charles B Moss, Robert Leo Murphy, Chad J Achenbach, Michael G Ison, Danielle Resnick,
Lauren Nadya Singh, Janine White, Azraa S Chaudhury, Michael J Boctor, Sarah B Welch, James Francis Oehmke. Originally
published in the Journal of Medical Internet Research (http://www.jmir.org), 03.02.2021. This is an open-access article distributed
https://www.jmir.org/2021/2/e25799 J Med Internet Res 2021 | vol. 23 | iss. 2 | e25799 | p. 14
(page number not for citation purposes)
XSL• FO
RenderXYou can also read


