Measuring Stress in Health Professionals Over the Phone Using Automatic Speech Analysis During the COVID-19 Pandemic: Observational Pilot Study
←
→
Page content transcription
If your browser does not render page correctly, please read the page content below
JOURNAL OF MEDICAL INTERNET RESEARCH                                                                                                           König et al

     Original Paper

     Measuring Stress in Health Professionals Over the Phone Using
     Automatic Speech Analysis During the COVID-19 Pandemic:
     Observational Pilot Study

     Alexandra König1, PhD; Kevin Riviere2, MD; Nicklas Linz3, MSc; Hali Lindsay4, MSc; Julia Elbaum2, MD; Roxane
     Fabre2, MSc; Alexandre Derreumaux5, MSc; Philippe Robert5, MD, PhD
     1
      Stars Team, Institut national de recherche en informatique et en automatique, Valbonne, France
     2
      Département de Santé Publique, Centre Hospitalier Universitaire de Nice, Université Côte d’Azur, Nice, France
     3
      ki elements, Saarbrücken, Germany
     4
      German Research Center for Artificial Intelligence (DFKI), Saarbrücken, Germany
     5
      CoBteK (Cognition-Behaviour-Technology) Lab, La Fédération de Recherche Interventions en Santé, Université Côte d’Azur, Nice, France

     Corresponding Author:
     Alexandra König, PhD
     Stars Team
     Institut national de recherche en informatique et en automatique
     2004 Route des Lucioles, 06902
     Sophia Antipolis
     Valbonne, 06200
     France
     Phone: 33 +33652021156
     Email: alexandra.konig@inria.fr

     Abstract
     Background: During the COVID-19 pandemic, health professionals have been directly confronted with the suffering of patients
     and their families. By making them main actors in the management of this health crisis, they have been exposed to various
     psychosocial risks (stress, trauma, fatigue, etc). Paradoxically, stress-related symptoms are often underreported in this vulnerable
     population but are potentially detectable through passive monitoring of changes in speech behavior.
     Objective: This study aims to investigate the use of rapid and remote measures of stress levels in health professionals working
     during the COVID-19 outbreak. This was done through the analysis of participants’ speech behavior during a short phone call
     conversation and, in particular, via positive, negative, and neutral storytelling tasks.
     Methods: Speech samples from 89 health care professionals were collected over the phone during positive, negative, and neutral
     storytelling tasks; various voice features were extracted and compared with classical stress measures via standard questionnaires.
     Additionally, a regression analysis was performed.
     Results: Certain speech characteristics correlated with stress levels in both genders; mainly, spectral (ie, formant) features, such
     as the mel-frequency cepstral coefficient, and prosodic characteristics, such as the fundamental frequency, appeared to be sensitive
     to stress. Overall, for both male and female participants, using vocal features from the positive tasks for regression yielded the
     most accurate prediction results of stress scores (mean absolute error 5.31).
     Conclusions: Automatic speech analysis could help with early detection of subtle signs of stress in vulnerable populations over
     the phone. By combining the use of this technology with timely intervention strategies, it could contribute to the prevention of
     burnout and the development of comorbidities, such as depression or anxiety.

     (J Med Internet Res 2021;23(4):e24191) doi: 10.2196/24191

     KEYWORDS
     stress detection; speech; voice analysis; COVID-19; phone monitoring; computer linguistics

     https://www.jmir.org/2021/4/e24191                                                                    J Med Internet Res 2021 | vol. 23 | iss. 4 | e24191 | p. 1
                                                                                                                         (page number not for citation purposes)
XSL• FO
RenderX
JOURNAL OF MEDICAL INTERNET RESEARCH König et al
and reduced speech rate [18-20]. A recent study investigated
Introduction the use of speech parameters extracted from audio recordings
In December 2019 in the Chinese city of Wuhan, a new to differentiate patients suffering from posttraumatic stress
coronavirus pneumonia, COVID-19, emerged. The pathogen disorder from healthy controls [21].
involved is SARS-CoV-2. Here, we will refer to the pathology Thus, the detection of subtle events in the voice may offer a
as COVID-19. COVID-19 has spread very rapidly in China but window into assessing the impact of stress in situations where
also in many other countries [1]. On March 11, 2020, the World circumstances make it difficult to monitor stress directly but
Health Organization declared that the COVID-19 outbreak had need to be addressed urgently [22].
become a pandemic [2].
In this work, we aim to investigate the use of a rapid and remote
According to previous studies on SARS or Ebola epidemics, measure of stress levels in health professionals working during
the onset of a sudden and immediately fatal disease could put the COVID-19 outbreak, utilizing the automatic analysis of
extraordinary pressure on health care professionals [3]. Increased their speech behavior during a short phone call conversation.
workloads, physical exhaustion, inadequate personal equipment,
nosocomial transmission, and the need to make ethically difficult Firstly, speech samples of health care professionals were
decisions about rationing care can have dramatic effects on their collected over the phone during the COVID-19 pandemic, and
physical and mental well-being. Their resilience may be further various voice features were extracted and compared with
compromised by isolation and loss of social support, risk or classical stress measures. Secondly, based on the extracted
loss of friends and relatives, and radical, often worrying changes features, scores from the completed stress scale that were
in working methods. Health care workers are, therefore, obtained by participants were predicted. The purpose of this
particularly vulnerable to mental health problems, including pilot study was to assess whether this technological method
fear, anxiety, depression, and insomnia [4,5]. Initial results could be of interest to support early screening of subtle signs
estimate that 23% and 22% of health care workers experienced of stress.
depression and anxiety, respectively, during the COVID-19
pandemic [6]. Methods
Paradoxically, health care workers do not tend to seek Participants
professional help, and stress-related symptoms are often not Health care professionals were recruited through outreach
immediately reported: “burnout, stress, and anxiety will have telephone calls. They worked during the COVID-19 outbreak
to wait.” Most of the time there will not even be a demand for in the local university hospital center of Nice, France, in either
care. Early implicit stress detection is of great importance in private practices or as independent workers in the
this population and would allow for timely intervention Provence-Alpes-Côte d’Azur region. They could occupy any
strategies in order to prevent escalation and complete function in these structures. The only criterion for noninclusion
occupational burnout. was the subjects’ refusal to participate in the study. Inclusion
To measure stress in clinical practice, various scales and of participants was carried out from May 5 to June 7, 2020.
questionnaires are available, such as the Perceived Stress Scale The study was approved by the Ethical Board for
(PSS) [7], the Stressful Life Event Questionnaire [8], the Stress noninterventional studies of the University Côte d’Azur, France
Overload Scale [9], and the Trier Inventory for Chronic Stress (approval 2020-58). Participants were given all the information
[10]. However, the present health crisis pushed research teams about the study prior to the call so they could give informed
to investigate the use of new technological tools in this specific consent. For those interested, the option for a follow-up call
population. One possible avenue is the use of automatic speech with a clinician was provided.
analysis allowing extraction of voice features during standard
consultation or over a simple phone call. Procedure
Psychological stress induces multiple effects on the body, The telephone calls were made by psychiatrists (n=3) or
including increased muscle tension, increased breathing rate, psychologists (n=1) belonging to the Cognition Behavior
and changes in salivation rate, which may, in turn, affect vocal Technology research team and the memory clinic of the
production [11,12]. Under psychological stress, voice pitch (ie, University Côte d’Azur. Calls lasted about 15 minutes and were
the acoustic correlate of fundamental frequency [F0]) usually composed of the following:
increases, as it is inversely related to the rate of vocal fold 1. An informative part explaining the reasons for the call and
vibration, which stretches under stress and becomes tenser its structure and how the study is conducted. The
together with an increase in subglottal pressure and vocal participant’s consent was requested to continue and to
intensity [13,14]. Indeed, an increase in voice pitch is the most proceed with a recording of his or her voice.
commonly reported finding in studies examining speech under 2. The Motivation Stress Affect (MSA) questionnaire. The
stress. However, stress can also affect other voice parameters, MSA questionnaire is a self-administered questionnaire
such as an increase in speech prosody [11,13]. In depression, composed of 11 questions that must be answered by “yes”
the analysis of speech characteristics has recently attracted or “no.” The first five questions assess motivation [23], the
considerable research attention [15-17]. Studies revealed that next two questions assess depression, and the last four
patients show flattened affect, reduced speech variability, questions assess stress [24].
monotonicity in pitch and loudness, increased pause duration,
https://www.jmir.org/2021/4/e24191 J Med Internet Res 2021 | vol. 23 | iss. 4 | e24191 | p. 2
(page number not for citation purposes)
XSL• FO
RenderXJOURNAL OF MEDICAL INTERNET RESEARCH König et al
3. Three open standardized questions: neutral, positive, and 2. Formant characteristics represent the dominant components
negative storytelling. In order to capture natural speech, of the speech spectrum and convey information about the
but within a limited time frame, the participant was asked acoustic resonance of the vocal tract and its use. These
to talk about something emotionally neutral (ie, describe markers are often indicative of articulatory coordination
where he or she is), to talk about a negative event in his or problems in motor speech control disorders.
her life, and, finally, to talk about a positive event in his or 3. Source characteristics that are related to the source of voice
her life. Each answer should have lasted about 1 minute production, the airflow through the glottal speech
and was recorded in a secure and encrypted way. It was not production system. These features make operational
specified whether the event had to be experienced during irregularities in the movement of the vocal fold (eg, voice
COVID-19; thus, it was open to the participant to recall quality measurements).
whatever event first came to mind. These free-speech tasks 4. Temporal characteristics include measures of the proportion
were used in previous studies [18,25] and allowed for a of speech (eg, duration of pauses and duration of speech
greater range of induced emotional effects, potentially segments), speech segment connectivity, and overall speech
sensitive to signs of stress and depression. The comparison rate.
of speech features between neutral and emotionally loaded
Features were extracted using Python 3.7 (Python Software
questions may give insight into the affective state of
Foundation) [27] and free and publicly available packages. For
participants.
4.
the temporal features, the My-Voice Analysis [28] package was
The PSS. This scale [7] is a hetero-questionnaire composed
used. This package was built off of the speech analysis research
of 10 questions to be answered by “never,” “almost never,”
tool praat [29]. Temporal features were actualized as the speech
“sometimes,” “quite often,” or “often.”
5.
rate, syllable count, rate of articulation, speaking duration, total
An open listening part aimed at exploring certain points in
duration, and ratio of speaking to nonspeaking. This package
greater depth in order to refine the clinical needs.
6.
was also used to extract prosodic features, namely the F0 values:
Decision and advice. Following the above steps, the
mean, standard deviation, minimum, maximum, and upper and
psychiatrist or psychologist offered or did not offer
lower quartiles. The F0 value is the representation of what is
psychological follow-up depending on whether he or she
known as the pitch.
considered that the patient was at risk of developing or had
a mood or anxiety disorder. He or she may also have offered Formant features were calculated using the Python Speech
advice on intervention strategies (eg, relaxation, yoga, Features library [30]. To characterize this aspect of speech, the
physical activity, and national call platform for original sound recording was refit according to a series of
psychological support for caregivers). transformations commonly used for speech recognition that
yield a better representation of the sound called the
Materials mel-frequency cepstrum (MFC). From this new representation
To perform the phone calls for this study, the phone version of of the sound form, the first 14 coefficients of the MFC were
the DELTA application [26] was used. The DELTA solution extracted. The MFC values were extracted given that they
allows for the use of a dedicated interface in the form of an iOS describe the spectral shape of the audio file, generally with
app to make phone calls and locally record these calls on the diminishing returns in terms of how informative they are, which
internal memory of an iPad. The phone calls were made directly is why we only considered the first 14 coefficients. If we were
with the iPad and through its internal microphone. to select a greater number of MFC values, it would result in a
These recordings were then automatically transmitted—the iPad potentially needlessly more complex machine learning model
had to be connected to the internet—to the DELTA application using less informative features.
programming interface (API) for analysis of acoustic and From each of these waves, the mean, variance, skewness, and
semantic parameters. Once the analysis was complete, the results kurtosis were calculated for the energy (static coefficient),
were displayed directly on the DELTA interface. The recordings velocity (first differential), and acceleration (second differential).
were made locally on the phone, the connection between the
interface and the DELTA API was secure and encrypted, and The Librosa package [31] was used to calculate the mean,
the recordings were destroyed from the DELTA servers once maximum, minimum, and standard deviation of the root mean
the analysis was complete and the results sent to the square value, centroid, bandwidth, flatness, zero-crossing rate,
experimenter. loudness, and flux of the spectrogram, or the visualization of
the recording.
Analysis
The source characteristics were extracted using the
Audio features were extracted directly and automatically from Signal_Analysis package, version 0.1.26, to extract the
the recorded audio signals of the three open standardized micromovements of the sound wave: harmonics-to-noise ratio
questions (see item #3 in the Procedure section). Characteristics (HNR), jitter, shimmer, and glottal pulses. Jitter and shimmer
were extracted from four main areas: are two features of vocal signals that describe the frequency
1. Prosodic characteristics, on long-term variations in variation from cycle to cycle of the sound wave and the
perceived stress and speech rhythm. Prosodic features also waveform amplitude, respectively [32,33]. While jitter rises
measure alterations in personal speech style (eg, perceived with the growing lack of control of vocal cord vibration, higher
pitch and speech intonation). shimmer is coupled with increased breathiness. HNR is the ratio
between periodic components and nonperiodic components that
https://www.jmir.org/2021/4/e24191 J Med Internet Res 2021 | vol. 23 | iss. 4 | e24191 | p. 3
(page number not for citation purposes)
XSL• FO
RenderXJOURNAL OF MEDICAL INTERNET RESEARCH König et al
constitute a voiced speech segment [34]. These components with the extracted vocal features to determine the error rate for
correspond to the vibration from vocal cords and glottal noise, predicting the participants’ stress scores.
respectively.
Speech features vary naturally between males and females due
Results
to differences in the length of the vocal tract. These differences Participants
have been leveraged in gender classification through speech
analysis based on pitch and formant frequencies [35], HNR In total, 89 French-speaking health professionals, aged between
[36], linear predictive components, and mel-frequency cepstral 20 and 74 years, accepted the outreach phone calls and their
coefficients (MFCCs) [37]. Previous work found differences in speech samples were recorded and analyzed. Their demographic
speech depending on gender in the effects of depression and characteristics are presented in Table 1.
the effectiveness of classifiers for its detection [38]. This is why The mean age of the participants was 40.53 years (SD 14.19).
this study considers males and females separately. The mean stress score on the PSS was 22.43 (SD 7.16) and on
Statistical Analysis the MSA questionnaire was 2.92 (SD 2.09). The majority of
the participants scored below 26 on the PSS but above 0 on the
The data collected were described using mean and standard MSA questionnaire. Results on the PSS and on the MSA stress
deviation for quantitative variables, and frequency and scale were proportional. We found that 27% (24/89) of the
percentage for qualitative variables. Demographic recorded health professionals experienced intense stress, and
characteristics, such as age and gender, were compared between 28% (25/89) experienced occasional stress. Only 16% (14/89)
different groups of caregivers using a chi-square test for of the participants requested a follow-up. The stress level was
qualitative variables (eg, gender) and an analysis of variance gender dependent, with females reporting higher stress levels.
performed for quantitative variables (eg, age). Similarly, the For males, stress levels tended to drop with age. Figure 1 shows
data measured for voice and scores were compared between a distribution of the total stress scores across genders. The total
different groups of caregivers. The normality of the collected stress scores in the female group are more dispersed than in the
data was tested using a Shapiro test. In order to test the male group and are generally higher. A total of 14 out of 88
relationship between the different voice measures and the (16%) participants (11/57, 19% of all females; 3/31, 10% of all
measured scores, Spearman correlations were used. In addition, males) asked for a follow-up call. Their mean PSS score (mean
to test the link between the voice measures and the therapist’s 31.78, SD 7.40) and mean MSA scale score (mean 5.57, SD
decision, Student t tests or Wilcoxon-Mann-Whitney tests were 1.34) were significantly higher than for those who did not ask
performed. A P value of less than .05 was considered significant. for a follow-up, whose mean PSS score was 20.60 (SD 5.63)
The analyses were performed using the free statistical software and mean MSA scale score was 2.38 (SD 1.8).
RStudio 4.0.0 [39]. Further, regression analyses were performed
https://www.jmir.org/2021/4/e24191 J Med Internet Res 2021 | vol. 23 | iss. 4 | e24191 | p. 4
(page number not for citation purposes)
XSL• FO
RenderXJOURNAL OF MEDICAL INTERNET RESEARCH König et al
Table 1. Descriptive statistics for participant characteristics (N=89).
Characteristic Participants, n (%) P valuea
Total (N=89) Male (n=31) Female (n=58)
Gender 89 (100) 31 (35) 58 (65) N/Ab
Education (years) (n=81) .03
0 66 (74) 23 (74) 43 (74)
MSA motivation scale score .47
0 30 (34) 12 (39) 18 (31)
>0 59 (66) 19 (61) 40 (69)
MSA depression scale score .32
0 57 (64) 22 (71) 35 (60)
>0 32 (36) 9 (29) 23 (40)
Follow-up request (n=88) .36
No 74 (84) 28 (90) 46/57 (81)
Yes 14 (16) 3 (10) 11/57 (19)
a
Chi-square test or Fisher exact test.
b
N/A: not applicable; the P value was not calculated for gender.
Figure 1. Stress score distribution across genders.
https://www.jmir.org/2021/4/e24191 J Med Internet Res 2021 | vol. 23 | iss. 4 | e24191 | p. 5
(page number not for citation purposes)
XSL• FO
RenderXJOURNAL OF MEDICAL INTERNET RESEARCH König et al
Correlations variables and not their raw values, we could omit the
First, vocal and nonvocal features were analyzed in relation to normalization step. We considered absolute values of the
the stress level. The data set was quite small and, therefore, correlation coefficient for feature scoring. Results are presented
rather than training a classifier, we performed correlation in Table 2.
analysis between the features computed for each speech task The main speech parameters correlating with stress levels in
and the reported stress level. Further, only extracted speech both genders were spectral (ie, formant) features, namely the
features were considered; a priori, nonmeaningful features, like MFCCs. These features characterize the spectrum of speech,
ID, were removed. which is the frequency distribution of the speech signal at a
We performed a selection of the top k features based on their specific time. MFCCs were derived by computing a spectrum
descriptive power for the target variable total stress score. Vocal of the log-magnitude mel-spectrum of the audio segment. The
features might be gender dependent. Therefore, we performed lower coefficients represent the vocal tract filter and the higher
a selection of top features for male and female data sets coefficients represent periodic vocal fold sources [18].
separately. We used Spearman correlation, since we had both Moreover, in males’ prosodic characteristics, such as the F0,
ordinal and continuous features: the target total stress score is and in females with the positive storytelling, pitch ranges were
ordinal. Since Spearman correlation uses only the ranks of the associated with stress levels.
Table 2. Correlation between stress levels and speech features.
Top 10 features for each data set Task Spearman correlation
Female data set
MFCCa3 acceleration skewness Positive story 0.49
MFCC2 mean Neutral story 0.44
Pitch range Positive story 0.44
MFCC3 acceleration skewness Negative story 0.43
MFCC2 mean Positive story 0.44
MFCC5 acceleration kurtosis Negative story –0.42
MFCC2 mean Negative story 0.43
MFCC5 velocity kurtosis Negative story –0.40
MFCC3 acceleration skewness Neutral story 0.39
MFCC5 velocity kurtosis Negative story 0.39
Male data set
Upper quartile F0b Neutral story –0.54
Pronunciation posteriori probability score percentage Positive story –0.50
Energy acceleration mean Positive story 0.52
Mean F0 Neutral story –0.51
MFCC9 kurtosis Positive story 0.41
MFCC9 variance Positive story –0.44
Upper quartile F0 Negative story –0.47
MFCC4 acceleration mean Positive story –0.40
Upper quartile F0 Positive story –0.47
MFCC12 acceleration skewness Neutral story –0.42
a
MFCC: mel-frequency cepstral coefficient; the numbers following MFCC are part of the feature names presenting their location on a spectrum.
b
F0: fundamental frequency.
For female participants, correlation analyses between negative, specific. Thus, for each task there is a different set of features
positive, and neutral features and the target feature total stress associated with stress level.
score were performed. Among the top 5 features, we have
For male participants, the selection was performed analogously.
MFCC acceleration skewness, which correlates with the stress
The top features are task specific as well, and they differ from
level by 0.45 and 0.37 in the positive and neutral tasks,
the features for the female data set. In this sample, we obtained
respectively. The other features among top 5 features are task
more negatively correlating features than for the female data
https://www.jmir.org/2021/4/e24191 J Med Internet Res 2021 | vol. 23 | iss. 4 | e24191 | p. 6
(page number not for citation purposes)
XSL• FO
RenderXJOURNAL OF MEDICAL INTERNET RESEARCH König et al
set; this meant that features, for instance, related to F0 of low physiological sensors or audio sources using SVM has also been
value (mean F0 in the neutral story with –0.51, upper quartile previously reported to give high model performance [46-48].
F0 in the negative and positive story with –0.47, and upper In recent studies, both SVM and random forest provided notably
quartile F0 in the neutral story with –0.54) are associated with high prediction and classification strength for stress detection
high stress scores. In general, low values represent a smaller using various speech features [49-51].
pitch range.
The caret package from R, version 3.4.2 (The R Foundation),
Regression was used for data training and validation. A 10-fold
Stress scores were regressed against measurements for positive, cross-validation was performed and performance was evaluated
neutral, and negative tasks. Similarly, the regression for tasks using the mean absolute error (MAE): the average of the
of different sentiments was performed for groups of female and absolute difference between the predicted and actual values
male participants to allow for possible impacts of gender on from our models for all participants. The score ranges from 0
stress levels. For the regressors, we used linear, support vector to infinity, where a score closer to 0 indicates a better-fitting
machine (SVM), and random forest regressors to predict the model.
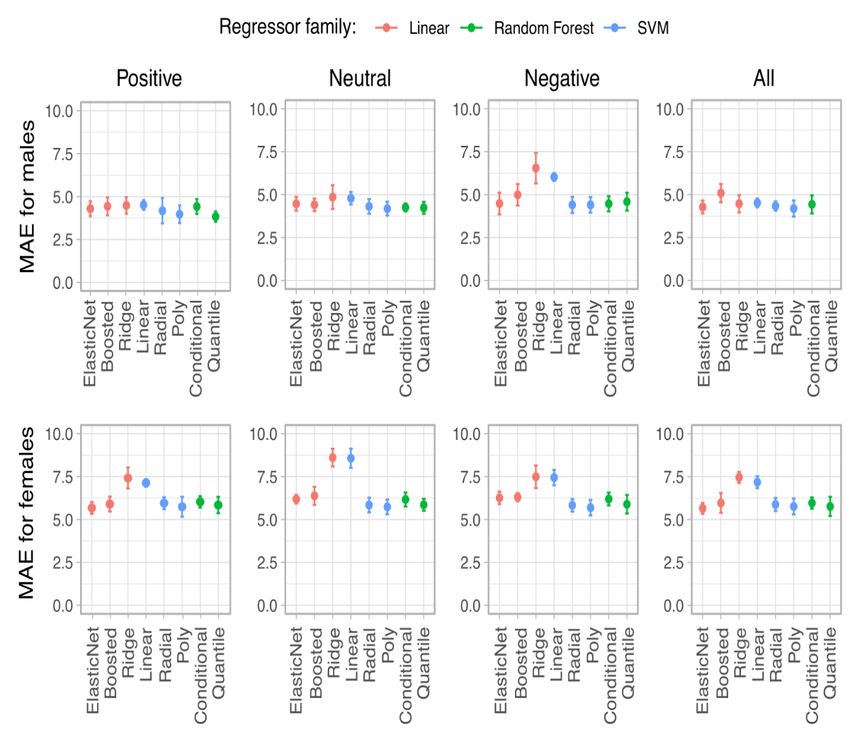
stress scores. The prediction of total stress scores using all or a subset of tasks
The first regression approximated the stress score by estimating among male or female subjects was carried out using various
coefficients for each feature in the training data, where greater baseline regression models, whose performances were evaluated
coefficients indicate a greater influence over the predicted value. by the plots in Figure 2, where the MAE values are presented
Linear regression models are fast, highly interpretable, and on the y-axis. Overall, the prediction strength in males was
commonly used for prediction of stress scores from audio better than in females for all sentiments, as shown by a trend
features and speech analysis, according to previous studies of lower errors (lowest MAE for males was 3.84; lowest MAE
[40-42]. The random forest regressor created a number of for females was 5.56). It is notable that stress score regression
decision trees that were constructed based on random sampling models based on negative tasks in males and neutral tasks in
from the training data; each tree then attempted to determine females performed relatively poorly compared to other tasks.
the best way to predict the scores given the data it received. For both male and female participants, using positive tasks for
Each decision tree outputted a predicted value and the mode regression yielded equivalent or better results than using all
value was selected. Decision tree methods have shown high tasks, suggesting that a subset of tasks could be employed for
accuracy with good interpretability in similar studies where accurate and less time-consuming prediction of stress scores.
vocal and linguistic features were employed for detection of An overview of the lowest scores for each testing scenario is
emotions, social signals, and mental health problems [43-45]. presented in Table 3.
The SVM regressor took each set of features and projected them All regression models outperformed their respective baseline
as a vector onto a space and attempted to find the optimal way MAE values (4.46 and 6.35 in males and females, respectively).
to separate the data. The stress score was then based on the Linear models and the SVM regressor were the most precise
distance from that separator. Stress modeling with inputs from for the prediction of total stress scores in general.
https://www.jmir.org/2021/4/e24191 J Med Internet Res 2021 | vol. 23 | iss. 4 | e24191 | p. 7
(page number not for citation purposes)
XSL• FO
RenderXJOURNAL OF MEDICAL INTERNET RESEARCH König et al
Figure 2. Performances of different computerized regression models in predicting stress levels based on vocal features. Boosted: boosted linear model;
ElasticNet: mix of L1 and L2 regularized linear regression; MAE: mean absolute error; Poly: support vector machine with polynomial basis function
kernel; Quantile: quantile regression forest; Radial: support vector machine with radial basis function kernel; SVM: support vector machine.
Table 3. The lowest scores for each testing scenario.
Participant Positive tasks Neutral tasks Negative tasks
group
MAEa (SD) Model MAE (SD) Model MAE (SD) Model
All 5.31 (0.25) ElasticNetb 5.25 (0.28) QuantileRFc 5.34 (0.35) PolySVMd
Male 3.84 (0.43) QuantileRF 4.40 (0.37) BoostedLMe 4.37 (0.43) PolySVM
Female 5.56 (0.41) ElasticNet 5.84 (0.42) RadialSVMf 5.68 (0.45) PolySVM
a
MAE: mean absolute error.
b
ElasticNet: mix of L1 and L2 regularized linear regression.
c
QuantileRF: quantile regression forest.
d
PolySVM: support vector machine with polynomial basis function kernel.
e
BoostedLM: boosted linear model.
f
RadialSVM: support vector machine with radial basis function kernel.
https://www.jmir.org/2021/4/e24191 J Med Internet Res 2021 | vol. 23 | iss. 4 | e24191 | p. 8
(page number not for citation purposes)
XSL• FO
RenderXJOURNAL OF MEDICAL INTERNET RESEARCH König et al
an increase in F0 and intensity with presumed levels of stress
Discussion [55,57,58]. Our findings seem consistent with the majority of
Principal Findings acoustic studies, pointing to F0 as one important marker of
stress levels.
The purpose of this study was to investigate the potential of
using automatic speech analysis for the detection of stress in However, most correlations we found were with resonance (ie,
health care professionals during the current COVID-19 formant) parameters, which are involved in the quality of sound
pandemic. This would potentially lead to earlier and timely shaping and vowel and consonant pronunciation and are
prevention among this high-risk population. Firstly, speech produced by the muscle activity involved in the shaping of the
samples were collected over the phone, and various voice resonant cavities of the vocal tract system [59]. These
features were extracted and compared with classical stress parameters are less documented in regard to stress. The MFCC,
measures. Secondly, based on the extracted features, scores in particular, can be indicative of breathiness in the voice [60].
obtained by participants on the completed stress scale were Interestingly, one study found a circadian pattern in MFCCs
predicted. due to sleep deprivation. For this, voice perturbations were
compared with classical sleep measures [61] and correlations
The main outcome of this study was the demonstration of this were found between fatigue scores and MFCCs. This might
approach’s feasibility under the given context, as all participants eventually explain our results, as most participants also reported
were cooperative and appreciated the initiative of rapidly signs of fatigue during the interviews.
applying this existing technology to this specific use case.
Moreover, from phone call recordings, a number of vocal Another study examined speech in students under exam stress
correlates of stress have been identified, namely in the area of and a few days later; in this case, heart rate was measured to
spectral features (ie, MFCC) as well as prosodic features such control for the actual stress levels. Under stress, students’ heart
as F0, which seem to be the most commonly reported features rates increased, F0 and F0 SD increased, first formant (F1) and
in well-controlled trials [11]. Stress scores could be predicted second formant (F2) frequencies increased, and MFCCs
based on speech features with relatively small errors. decreased in relation to baseline levels [62].
Spectral features characterize the speech spectrum; the frequency It can be hypothesized that given our recorded population who
distribution of the speech signal at a specific time indicates reported relatively mild to moderate levels of stress, rather subtle
information in some high-dimensional representation [18]. The changes in voice parameters were found and, therefore, weaker
features capture information regarding changes in muscle tension correlations were observed. However, it is important to underline
and control and have consistently been observed to change with that changes in features that we found to be sensitive to stress
a speaker’s mental state. A few depression studies reported a levels were gender dependent but not necessarily task dependent.
relative shift in energy with increasing depression severity They were most likely too small to be detectable by the human
[52,53]. ear but were captured by the automatic speech analysis. We
assume that by applying this technology to regular check-up
Another result we obtained was that most identified vocal calls with people experiencing high stress levels, such as health
features were task dependent as well as gender dependent. care professionals, very early signs of stress can be detected in
Interestingly, in the female group, MFCC features seemed to their voices, allowing for timely preventive strategies.
be associated with stress levels during all tasks, meaning that
it did not matter what participants were talking about; as long Regression models using vocal features performed relatively
as sufficient speech was captured, meaningful information could well in predicting stress scores, namely in the positive story
be extracted and subtle signs of stress level could be detected. task for both genders (MAE of 5.31). It shows that the
On the other hand, in the male data set, the upper quartile F0 technology could capture indicative patterns from even a short
appeared as a task-independent feature sensitive to stress levels. amount of time, possibly even from one task, to recognize
Overall, in the male data set, we observed more features with tendencies of stress levels in a fragile but healthy population;
a negative correlation than we did for the female data set. this represents a promising rapid tool for prediction of stress
scores.
Voice production can be divided into three processes: breathing,
phonation, and resonance stress [54]. For the second process, Strengths of This Study
phonation, the vocal folds must close and open again to create This study is a first step into the early identification of stress in
vibration. The frequency rate of these pulses determines the F0 an at-risk population, such as caregivers, who do not directly
of the vocal source contributing to the perceived pitch of the express their psychological suffering. We can imagine extending
sound. this technique to other fragile populations for early screening
Previous research showed that increased muscle tension tends of stress, such as teenagers who are victims of school harassment
to be caused by stress [55,56], resulting in a tensing of the vocal or women who are victims of abuse, where timely management
folds, which, in turn, most likely causes a raising of F0. A recent could potentially prevent the development of comorbidities,
review on voice analysis in stress [22] stated that the parameter such as depression and anxiety. Moreover, patient populations
F0 has been considered as a “universal stress indicator,” whereas who have difficulty expressing their problems, such as those
increased levels of F0 might be linked with acute bottom-up with autism spectrum disorder or dementia, could benefit from
processes of sympathetic arousal. Similar studies of analysis of this technology.
phone call recordings during situational stress situations revealed
https://www.jmir.org/2021/4/e24191 J Med Internet Res 2021 | vol. 23 | iss. 4 | e24191 | p. 9
(page number not for citation purposes)
XSL• FO
RenderXJOURNAL OF MEDICAL INTERNET RESEARCH König et al
Generally, remote psychological counseling is controversial. Finally, the obtained correlations can be considered as rather
Nevertheless, it is becoming necessary due to current economic, moderate, which makes it difficult to draw any strong
social, and health constraints, but has been received by conclusions. A larger data set, ideally of a longitudinal nature,
professionals and patients with mixed feelings. Indeed, the with more precise characterization of the speakers is needed in
nonverbal part of communication is lost and the dynamics of order to verify whether the correlating features represent real
interaction are not the same. However, contrary to these markers of stress.
preconceived ideas, we have noticed during this work that it is
easier for certain participants to open up and speak about
Future Perspective
personal issues during these interviews in a liberating manner, For future work, we propose to perform this analysis on a larger
similar to a confessional. Not being in the physical presence of data set and to build a prediction model. In case of an
the listener may facilitate personal expression, with less fear of insufficient number of observations per stress level, the number
being judged. This aspect is very interesting during a screening of stress levels can be reduced by binning. Binning can also be
because it considerably accelerates the process of detection and carried out on characteristic values.
diagnosing of psychological symptoms. Further studies with acoustic measurements and stress
Weaknesses of the Study questionnaires at regular time intervals would allow for the
analysis of the kinetics of the markers and a better perception
This project has been rapidly implemented, initially with an
of their sensitivity and specificity. In addition, adding clinical
approach of qualitative and quantitative data analysis, that
measurements of psychiatric symptoms, such as the Diagnostic
should contribute to the early and timely assistance of health
and Statistical Manual of Mental Disorders, Fifth Edition [63],
professionals during the COVID-19 pandemic. The staff
would make it possible to perceive whether one of the markers
members available to participate in the study were limited.
is predictive of an anxiety or depression disorder. The use of
Patient selection was done on a voluntary basis. It is conceivable
the tool could be combined with the delivery of preventive
that the population studied were more concerned about their
strategies, such as physical exercises, adaptation of diet,
state of psychological suffering and, therefore, potentially had
psychotherapy, meditation, or the use of symptomatic
a selection bias.
treatments, and it could be employed at the same time for the
Although the voice recordings were made in the middle of the evaluation of the obtained effects. However, in order to produce
interview without this time being precisely stated, it is possible a real-world application of this technology, larger validation
that some patients may have suspected this, which could have studies have to be performed to demonstrate clinical
been anxiety provoking and skewed our results. Recording meaningfulness by comparing its performance to standardized
throughout the interview for parameters not affected by the tasks measurement tools.
would provide more data and more robust results.
Acknowledgments
This research was supported by a grant from the Fondation GSF (Groupe Services France) Jean Louis Noisiez and the Association
Innovation Alzheimer. Thanks to all of the professional health care workers who agreed to participate in this study.
Authors' Contributions
AK, KR, JE, and PR designed and conducted the study. AD contributed as technical support to this study. NL, HL, and RF
analyzed the data. KR, AK, NL, HL, and PR drafted the manuscript. All authors have read and agreed to the published version
of the manuscript.
Conflicts of Interest
NL is an employee and shareholder of ki elements UG.
References
1. Pneumonia of unknown cause – China. World Health Organization. 2020 Jan 05. URL: https://www.who.int/csr/don/
05-january-2020-pneumonia-of-unkown-cause-china/en/ [accessed 2020-01-05]
2. WHO announces COVID-19 outbreak a pandemic. World Health Organization. 2020 Mar 12. URL: https://www.euro.who.int/
en/health-topics/health-emergencies/coronavirus-covid-19/news/news/2020/3/who-announces-covid-19-outbreak-a-pandemic
[accessed 2020-03-12]
3. Liu X, Kakade M, Fuller CJ, Fan B, Fang Y, Kong J, et al. Depression after exposure to stressful events: Lessons learned
from the severe acute respiratory syndrome epidemic. Compr Psychiatry 2012 Jan;53(1):15-23 [FREE Full text] [doi:
10.1016/j.comppsych.2011.02.003] [Medline: 21489421]
4. Lung F, Lu Y, Chang Y, Shu B. Mental symptoms in different health professionals during the SARS attack: A follow-up
study. Psychiatr Q 2009 Jun;80(2):107-116. [doi: 10.1007/s11126-009-9095-5] [Medline: 19247834]
https://www.jmir.org/2021/4/e24191 J Med Internet Res 2021 | vol. 23 | iss. 4 | e24191 | p. 10
(page number not for citation purposes)
XSL• FO
RenderXJOURNAL OF MEDICAL INTERNET RESEARCH König et al
5. Wu P, Fang Y, Guan Z, Fan B, Kong J, Yao Z, et al. The psychological impact of the SARS epidemic on hospital employees
in China: Exposure, risk perception, and altruistic acceptance of risk. Can J Psychiatry 2009 May;54(5):302-311 [FREE
Full text] [doi: 10.1177/070674370905400504] [Medline: 19497162]
6. Pappa S, Ntella V, Giannakas T, Giannakoulis VG, Papoutsi E, Katsaounou P. Prevalence of depression, anxiety, and
insomnia among healthcare workers during the COVID-19 pandemic: A systematic review and meta-analysis. Brain Behav
Immun 2020 Aug;88:901-907 [FREE Full text] [doi: 10.1016/j.bbi.2020.05.026] [Medline: 32437915]
7. Cohen S, Kamarck T, Mermelstein R. A global measure of perceived stress. J Health Soc Behav 1983 Dec;24(4):385-396.
[Medline: 6668417]
8. Roohafza H, Ramezani M, Sadeghi M, Shahnam M, Zolfagari B, Sarafzadegan N. Development and validation of the
stressful life event questionnaire. Int J Public Health 2011 Aug;56(4):441-448. [doi: 10.1007/s00038-011-0232-1] [Medline:
21327856]
9. Amirkhan J. Stress overload: A new approach to the assessment of stress. Am J Community Psychol 2012 Mar;49(1-2):55-71.
[doi: 10.1007/s10464-011-9438-x] [Medline: 21538152]
10. Petrowski K, Paul S, Albani C, Brähler E. Factor structure and psychometric properties of the trier inventory for chronic
stress (TICS) in a representative German sample. BMC Med Res Methodol 2012 Apr 01;12:42 [FREE Full text] [doi:
10.1186/1471-2288-12-42] [Medline: 22463771]
11. Giddens CL, Barron KW, Byrd-Craven J, Clark KF, Winter AS. Vocal indices of stress: A review. J Voice 2013
May;27(3):390.e21-390.399. [doi: 10.1016/j.jvoice.2012.12.010] [Medline: 23462686]
12. Pisanski K, Nowak J, Sorokowski P. Individual differences in cortisol stress response predict increases in voice pitch during
exam stress. Physiol Behav 2016 Sep 01;163:234-238. [doi: 10.1016/j.physbeh.2016.05.018] [Medline: 27188981]
13. Kirchhübel C, Howard DM, Stedmon AW. Acoustic correlates of speech when under stress: Research, methods and future
directions. Int J Speech Lang Law 2011 Sep 13;18(1):75-98. [doi: 10.1558/ijsll.v18i1.75]
14. Hollien H. Vocal fold dynamics for frequency change. J Voice 2014 Jul;28(4):395-405. [doi: 10.1016/j.jvoice.2013.12.005]
[Medline: 24726331]
15. Sobin C, Sackeim HA. Psychomotor symptoms of depression. Am J Psychiatry 1997 Jan;154(1):4-17. [doi:
10.1176/ajp.154.1.4] [Medline: 8988952]
16. Schrijvers D, Hulstijn W, Sabbe BG. Psychomotor symptoms in depression: A diagnostic, pathophysiological and therapeutic
tool. J Affect Disord 2008 Jul;109(1-2):1-20. [doi: 10.1016/j.jad.2007.10.019] [Medline: 18082896]
17. Bylsma LM, Morris BH, Rottenberg J. A meta-analysis of emotional reactivity in major depressive disorder. Clin Psychol
Rev 2008 Apr;28(4):676-691. [doi: 10.1016/j.cpr.2007.10.001] [Medline: 18006196]
18. Cummins N, Scherer S, Krajewski J, Schnieder S, Epps J, Quatieri TF. A review of depression and suicide risk assessment
using speech analysis. Speech Commun 2015 Jul;71:10-49. [doi: 10.1016/j.specom.2015.03.004]
19. Nilsonne A. Speech characteristics as indicators of depressive illness. Acta Psychiatr Scand 1988 Mar;77(3):253-263. [doi:
10.1111/j.1600-0447.1988.tb05118.x] [Medline: 3394527]
20. Leff J, Abberton E. Voice pitch measurements in schizophrenia and depression. Psychol Med 1981 Nov;11(4):849-852.
[doi: 10.1017/s0033291700041349] [Medline: 7323240]
21. Marmar CR, Brown AD, Qian M, Laska E, Siegel C, Li M, et al. Speech-based markers for posttraumatic stress disorder
in US veterans. Depress Anxiety 2019 Jul;36(7):607-616 [FREE Full text] [doi: 10.1002/da.22890] [Medline: 31006959]
22. Van Puyvelde M, Neyt X, McGlone F, Pattyn N. Voice stress analysis: A new framework for voice and effort in human
performance. Front Psychol 2018;9:1994 [FREE Full text] [doi: 10.3389/fpsyg.2018.01994] [Medline: 30515113]
23. Robert P, Lanctôt KL, Agüera-Ortiz L, Aalten P, Bremond F, Defrancesco M, et al. Is it time to revise the diagnostic criteria
for apathy in brain disorders? The 2018 international consensus group. Eur Psychiatry 2018 Oct;54:71-76 [FREE Full text]
[doi: 10.1016/j.eurpsy.2018.07.008] [Medline: 30125783]
24. Yesavage JA, Brink T, Rose TL, Lum O, Huang V, Adey M, et al. Development and validation of a geriatric depression
screening scale: A preliminary report. J Psychiatr Res 1982 Jan;17(1):37-49. [doi: 10.1016/0022-3956(82)90033-4]
25. König A, Linz N, Zeghari R, Klinge X, Tröger J, Alexandersson J, et al. Detecting apathy in older adults with cognitive
disorders using automatic speech analysis. J Alzheimers Dis 2019 Jun 18;69(4):1183-1193. [doi: 10.3233/jad-181033]
26. ki:elements. URL: https://ki-elements.de [accessed 2020-11-01]
27. Van Rossum G, Drake FL. Python 3 Reference Manual. Scotts Valley, CA: CreateSpace; 2009:1-242.
28. Shahab S. My-Voice Analysis. GitHub. 2020. URL: https://github.com/Shahabks/my-voice-analysis [accessed 2020-11-01]
29. Boersma P. PRAAT, a system for doing phonetics by computer. Glot International. Vol 5, No. 9/10. 2001. URL: https:/
/www.researchgate.net/profile/Paul-Boersma-2/publication/
208032992_PRAAT_a_system_for_doing_phonetics_by_computer/links/53d77c1c0cf29f55cfb4d26b/
PRAAT-a-system-for-doing-phonetics-by-computer.pdf [accessed 2021-04-07]
30. Lyons J. python_speech_features. GitHub. 2020 Jan 14. URL: https://github.com/jameslyons/python_speech_features
[accessed 2020-11-01]
31. librosa 0.8.0. Python Package Index. 2020 Jul 21. URL: https://pypi.org/project/librosa/ [accessed 2020-11-01]
32. Kreiman J, Gerratt BR. Perception of aperiodicity in pathological voice. J Acoust Soc Am 2005 Apr;117(4 Pt 1):2201-2211.
[doi: 10.1121/1.1858351] [Medline: 15898661]
https://www.jmir.org/2021/4/e24191 J Med Internet Res 2021 | vol. 23 | iss. 4 | e24191 | p. 11
(page number not for citation purposes)
XSL• FO
RenderXJOURNAL OF MEDICAL INTERNET RESEARCH König et al
33. Michaelis D, Fröhlich M, Strube HW, Kruse E, Story B, Titze IR. Some simulations concerning jitter and shimmer
measurement. In: Proceedings of the 3rd International Workshop on Advances in Quantitative Laryngoscopy, Voice and
Speech Research. 1998 Jun Presented at: 3rd International Workshop on Advances in Quantitative Laryngoscopy, Voice
and Speech Research; 1998; Aachen, Germany p. 744-754.
34. Murphy PJ, Akande OO. Cepstrum-based estimation of the harmonics-to-noise ratio for synthesized and human voice
signals. In: Proceedings of the International Conference on Nonlinear Analyses and Algorithms for Speech Processing.
2005 Apr Presented at: International Conference on Nonlinear Analyses and Algorithms for Speech Processing; April
19-22, 2005; Barcelona, Spain p. 150-160. [doi: 10.1007/11613107_13]
35. Childers D, Wu K. Gender recognition from speech. Part II: Fine analysis. J Acoust Soc Am 1991 Oct;90(4 Pt 1):1841-1856.
[doi: 10.1121/1.401664] [Medline: 1755877]
36. Heffernan K. Evidence from HNR that/s/is a social marker of gender. Toronto Working Papers in Linguistics 2004;23:71-84
[FREE Full text]
37. Wu K, Childers DG. Gender recognition from speech. Part I: Coarse analysis. J Acoust Soc Am 1991 Oct;90(4 Pt
1):1828-1840. [doi: 10.1121/1.401663] [Medline: 1960278]
38. Low LA, Maddage MC, Lech M, Sheeber LB, Allen NB. Detection of clinical depression in adolescents’ speech during
family interactions. IEEE Trans Biomed Eng 2011 Mar;58(3):574-586. [doi: 10.1109/tbme.2010.2091640]
39. The Comprehensive R Archive Network. URL: https://cran.r-project.org/ [accessed 2020-11-01]
40. Gillespie S, Moore E, Laures-Gore J, Farina M, Russell S, Logan YL. Detecting stress and depression in adults with aphasia
through speech analysis. In: Proceedings of the 2017 IEEE International Conference on Acoustics, Speech and Signal
Processing (ICASSP). 2017 Presented at: 2017 IEEE International Conference on Acoustics, Speech and Signal Processing
(ICASSP); March 5-9, 2017; New Orleans, LA p. 5140-5144. [doi: 10.1109/icassp.2017.7953136]
41. van den Broek EL, van der Sluis F, Dijkstra T. Telling the story and re-living the past: How speech analysis can reveal
emotions in post-traumatic stress disorder (PTSD) patients. In: Sensing Emotions. Dordrecht, the Netherlands: Springer;
2010:153-180.
42. Muaremi A, Arnrich B, Tröster G. Towards measuring stress with smartphones and wearable devices during workday and
sleep. Bionanoscience 2013;3:172-183 [FREE Full text] [doi: 10.1007/s12668-013-0089-2] [Medline: 25530929]
43. Hasan M, Rundensteiner E, Agu E. Emotex: Detecting emotions in twitter messages. In: Proceedings of the 2014 ASE
Bigdata/Socialcom/Cybersecurity Conference. 2014 Presented at: 2014 ASE Bigdata/Socialcom/Cybersecurity Conference;
May 27-31, 2014; San Francisco, CA p. 1-10 URL: https://web.cs.wpi.edu/~emmanuel/publications/PDFs/C30.pdf
44. Gosztolya G, Busa-Fekete R, Tóth L. Detecting autism, emotions and social signals using AdaBoost. In: Proceedings of
the 14th Annual Conference of the International Speech Communication Association. 2013 Presented at: 14th Annual
Conference of the International Speech Communication Association; August 25-29, 2013; Lyon, France p. 220-224 URL:
https://www.isca-speech.org/archive/archive_papers/interspeech_2013/i13_0220.pdf
45. Howes C, Purver M, McCabe R. Linguistic indicators of severity and progress in online text-based therapy for depression.
In: Proceedings of the Workshop on Computational Linguistics and Clinical Psychology: From Linguistic Signal to Clinical
Reality. 2014 Presented at: Workshop on Computational Linguistics and Clinical Psychology: From Linguistic Signal to
Clinical Reality; June 27, 2014; Baltimore, MA p. 7-16 URL: https://www.aclweb.org/anthology/W14-3202.pdf [doi:
10.3115/v1/w14-3202]
46. Al-Shargie F, Tang TB, Badruddin N, Kiguchi M. Towards multilevel mental stress assessment using SVM with ECOC:
An EEG approach. Med Biol Eng Comput 2018 Jan;56(1):125-136. [doi: 10.1007/s11517-017-1733-8] [Medline: 29043535]
47. Rabaoui A, Davy M, Rossignol S, Ellouze N. Using one-class SVMs and wavelets for audio surveillance. IEEE Trans Inf
Forensics Secur 2008 Dec;3(4):763-775. [doi: 10.1109/tifs.2008.2008216]
48. Chang C, Chang C, Zheng J, Chung P. Physiological emotion analysis using support vector regression. Neurocomputing
2013 Dec;122:79-87. [doi: 10.1016/j.neucom.2013.02.041]
49. Soury M, Devillers L. Stress detection from audio on multiple window analysis size in a public speaking task. In: Proceedings
of the 2013 Humaine Association Conference on Affective Computing and Intelligent Interaction. 2013 Presented at: 2013
Humaine Association Conference on Affective Computing and Intelligent Interaction; September 2-5, 2013; Geneva,
Switzerland p. 529-533. [doi: 10.1109/acii.2013.93]
50. Sysoev M, Kos A, Pogačnik M. Noninvasive stress recognition considering the current activity. Pers Ubiquitous Comput
2015 Aug 26;19(7):1045-1052 [FREE Full text] [doi: 10.1007/s00779-015-0885-5]
51. Gjoreski M, Gjoreski H, Lutrek M, Gams M. Automatic detection of perceived stress in campus students using smartphones.
In: Proceedings of the 2015 International Conference on Intelligent Environments. 2015 Presented at: 2015 International
Conference on Intelligent Environments; July 15-17, 2015; Prague, Czech Republic p. 132-135. [doi: 10.1109/IE.2015.27]
52. Cummins N, Epps J, Ambikairajah E. Spectro-temporal analysis of speech affected by depression and psychomotor
retardation. In: Proceedings of the 2013 IEEE International Conference on Acoustics, Speech and Signal Processing. 2013
Presented at: 2013 IEEE International Conference on Acoustics, Speech and Signal Processing; May 26-31, 2013; Vancouver,
BC p. 7542-7546. [doi: 10.1109/ICASSP.2013.6639129]
53. Cummins N, Epps J, Sethu V, Breakspear M, Goecke R. Modeling spectral variability for the classification of depressed
speech. In: Proceedings of the 14th Annual Conference of the International Speech Communication Association. 2013
https://www.jmir.org/2021/4/e24191 J Med Internet Res 2021 | vol. 23 | iss. 4 | e24191 | p. 12
(page number not for citation purposes)
XSL• FO
RenderXJOURNAL OF MEDICAL INTERNET RESEARCH König et al
Presented at: 14th Annual Conference of the International Speech Communication Association; August 25-29, 2013; Lyon,
France p. 857-861 URL: https://citeseerx.ist.psu.edu/viewdoc/download?doi=10.1.1.654.9966&rep=rep1&type=pdf
54. Kreiman J, Sidtis D. Foundations of Voice Studies: An Interdisciplinary Approach to Voice Production and Perception.
Hoboken, NJ: John Wiley & Sons; 2011.
55. Streeter L, Macdonald NH, Apple W, Krauss RM, Galotti KM. Acoustic and perceptual indicators of emotional stress. J
Acoust Soc Am 1983 Apr;73(4):1354-1360. [doi: 10.1121/1.389239] [Medline: 6853847]
56. Scherer KR, Grandjean D, Johnstone T, Klasmeyer G, Bänziger T. Acoustic correlates of task load and stress. In: Proceedings
of the 7th International Conference on Spoken Language Processing. 2002 Presented at: 7th International Conference on
Spoken Language Processing; September 16-20, 2002; Denver, CO p. 1-4 URL: https://www.isca-speech.org/archive/
archive_papers/icslp_2002/i02_2017.pdf
57. Ruiz R, Absil E, Harmegnies B, Legros C, Poch D. Time- and spectrum-related variabilities in stressed speech under
laboratory and real conditions. Speech Commun 1996 Nov;20(1-2):111-129. [doi: 10.1016/s0167-6393(96)00048-9]
58. Jessen M. Einfluss von Stress auf Sprache und Stimme: Unter besondere Berücksichtigung polizeidienstlicher Anforderungen.
Idstein, Germany: Schulz-Kirchner Verlag; 2006:1-218.
59. Gopalan K, Wenndt S, Cupples EJ. An analysis of speech under stress using certain modulation features. In: Proceedings
of the 25th Annual Conference of the IEEE Industrial Electronics Society. 1999 Presented at: 25th Annual Conference of
the IEEE Industrial Electronics Society; November 29-December 3, 1999; San Jose, CA p. 1193-1197. [doi:
10.1109/iecon.1999.819381]
60. Hillenbrand J, Houde RA. Acoustic correlates of breathy vocal quality: Dysphonic voices and continuous speech. J Speech
Hear Res 1996 Apr;39(2):311-321. [doi: 10.1044/jshr.3902.311] [Medline: 8729919]
61. Greeley HP, Friets E, Wilson JP, Raghavan S, Picone J, Berg J. Detecting fatigue from voice using speech recognition. In:
Proceedings of the IEEE International Symposium on Signal Processing and Information Technology. 2006 Presented at:
IEEE International Symposium on Signal Processing and Information Technology; August 27-30, 2006; Vancouver, BC
p. 567-571. [doi: 10.1109/ISSPIT.2006.270865]
62. Sigmund M. Introducing the database ExamStress for speech under stress. In: Proceedings of the 7th Nordic Signal Processing
Symposium. 2006 Presented at: 7th Nordic Signal Processing Symposium; June 7-9, 2006; Reykjavik, Iceland p. 290-293.
[doi: 10.1109/NORSIG.2006.275258]
63. American Psychiatric Association. Diagnostic And Statistical Manual Of Mental Disorders, Fifth Edition. Arlington, VA:
American Psychiatric Association Publishing; 2013.
Abbreviations
API: application programming interface
F0: fundamental frequency
F1: first formant
F2: second formant
GSF: Groupe Services France
HNR: harmonics-to-noise ratio
MAE: mean absolute error
MFC: mel-frequency cepstrum
MFCC: mel-frequency cepstral coefficient
MSA: Motivation Stress Affect
PSS: Perceived Stress Scale
SVM: support vector machine
Edited by G Eysenbach; submitted 28.09.20; peer-reviewed by A Khaleghi, S D'Arcy, E van der Velde; comments to author 24.10.20;
revised version received 13.11.20; accepted 17.03.21; published 19.04.21
Please cite as:
König A, Riviere K, Linz N, Lindsay H, Elbaum J, Fabre R, Derreumaux A, Robert P
Measuring Stress in Health Professionals Over the Phone Using Automatic Speech Analysis During the COVID-19 Pandemic:
Observational Pilot Study
J Med Internet Res 2021;23(4):e24191
URL: https://www.jmir.org/2021/4/e24191
doi: 10.2196/24191
PMID: 33739930
https://www.jmir.org/2021/4/e24191 J Med Internet Res 2021 | vol. 23 | iss. 4 | e24191 | p. 13
(page number not for citation purposes)
XSL• FO
RenderXYou can also read