On the assimilation of environmental tracer observations for model-based decision support - HESS
←
→
Page content transcription
If your browser does not render page correctly, please read the page content below
Hydrol. Earth Syst. Sci., 24, 1677–1689, 2020
https://doi.org/10.5194/hess-24-1677-2020
© Author(s) 2020. This work is distributed under
the Creative Commons Attribution 4.0 License.

On the assimilation of environmental tracer observations for
model-based decision support
Matthew J. Knowling1 , Jeremy T. White1 , Catherine R. Moore1 , Pawel Rakowski2 , and Kevin Hayley3
1 GNS Science, Lower Hutt, New Zealand
2 Hawke’sBay Regional Council, Napier, New Zealand
3 Groundwater Solutions Ltd, Melbourne, Australia

Correspondence: Matthew J. Knowling (mjknowling@gmail.com)

Received: 21 August 2019 – Discussion started: 18 September 2019
Revised: 29 February 2020 – Accepted: 12 March 2020 – Published: 8 April 2020

Abstract. It has been advocated that history matching nu-         in forecasts; these biases are a result of an imperfect model’s
merical models to a diverse range of observation data types,      inability to properly and directly assimilate the rich informa-
particularly including environmental tracer concentrations        tion content of the tritium observations. The findings of this
and their interpretations and derivatives (e.g., mean age),       study challenge the advocacy of the increasing use of trac-
constitutes an effective and appropriate means to improve         ers, and of diverse data types more generally, whenever en-
model forecast reliability. This study presents two regional-     vironmental model data assimilation is undertaken with im-
scale modeling case studies that directly and rigorously as-      perfect models. This study also highlights the need for im-
sess the value of discrete tritium concentration observations     proved imperfect-model data assimilation strategies. While
and tritium-derived mean residence time (MRT) estimates in        these strategies will likely require increased model complex-
two decision-support contexts; “value” is measured herein         ity (including advanced discretization, processes and param-
as both the improvement (or otherwise) in the reliability of      eterization) to allow for appropriate assimilation of rich and
forecasts through uncertainty variance reduction and bias         diverse data types that operate across a range of spatial and
minimization as a result of assimilating tritium or tritium-      temporal scales commensurate with a forecast of manage-
derived MRT observations. The first case study (Heretaunga        ment interest, it is critical that increased model complexity
Plains, New Zealand) utilizes a suite of steady-state and tran-   does not preclude the application of formal data assimilation
sient flow models and an advection-only particle-tracking         and uncertainty quantification techniques due to model insta-
model to evaluate the worth of tritium-derived MRT esti-          bility and excessive run times.
mates relative to hydraulic potential, spring discharge and
river–aquifer exchange flux observations. The worth of MRT
observations is quantified in terms of the change in the un-
certainty surrounding ecologically sensitive spring discharge     1   Introduction
forecasts via first-order second-moment (FOSM) analyses.
The second case study (Hauraki Plains, New Zealand) em-           Numerical models used to provide water resources manage-
ploys paired simple–complex transient flow and transport          ment decision support are often subjected to data assimilation
models to evaluate the potential for assimilation-induced bias    through history matching (or “calibration”). This is due to the
in simulated surface-water nitrate discharge to an ecologi-       large information deficit accompanying the development of
cally sensitive estuary system; formal data assimilation of       these models and the potential for the history-matching pro-
tritium observations is undertaken using an iterative ensem-      cess to lead to an increased reliability of simulated outputs
ble smoother. The results of these case studies indicate that,    of management interest (herein referred to as “forecasts”)
for the decision-relevant forecasts considered, tritium obser-    through variance reduction. Modeling for the purpose of de-
vations are of variable benefit and may induce damaging bias      cision support is the context in which the remainder of the
                                                                  paper is framed.

Published by Copernicus Publications on behalf of the European Geosciences Union.
1678                                               M. J. Knowling et al.: Model tracer-data assimilation for decision support

   It is widely advocated that the assimilation of multiple          lation problem can result in severely biased results (e.g., Do-
types of state observations (i.e., “diverse data”) is benefi-        herty and Christensen, 2011; Knowling et al., 2019; White
cial in “constraining” models. In other words, as more data          et al., 2020).
are used for history matching, and the more diverse those               The largely unknown ability of an imperfect regional-scale
data are, the more reliable of the forecasts become. This is         model to simultaneously assimilate diverse data types that
an intuitive stance arising from direct application of Bayes’        operate over different spatial and temporal scales – and how
equation and from the recognized rich information content of         these imperfections may affect model-based decision support
diverse data types; this intuition is supported by many stud-        in some contexts – serves as the motivation for the current
ies (e.g., Sanford et al., 2004; Michael and Voss, 2009; Ginn        study. To the best of the authors’ knowledge, this is the first
et al., 2009; Li et al., 2009; Gusyev et al., 2013; Hansen et al.,   study to explore the benefit or otherwise of the assimilation
2013). For example, Hunt et al. (2006) demonstrated the              of tracer data into imperfect models in terms of both forecast
importance of unconventional observations including lake–            bias and variance.
aquifer exchange fluxes, the depth of lake isotope plume and            A subtle, yet very important, distinction should be made at
groundwater travel times in achieving “well-constrained pa-          this point. There is no doubting that diverse data types, in par-
rameter values” (e.g., acceptable posterior variance) through        ticular environmental tracers, have contributed significantly
history matching a regional-scale groundwater model.                 to the understanding of catchment processes and properties
   History matching to environmental tracer observations, in         (e.g., Kirchner et al., 2001; André et al., 2005; Stewart and
particular, is a widely regarded mechanism for improving the         Thomas, 2008; McDonnell et al., 2010; Morgenstern et al.,
reliability of forecasts. In a review of approaches for model-       2010; Han et al., 2012; Leray et al., 2012; Siade et al., 2018).
ing environmental tracers in groundwater systems, Turnadge           However, as discussed, this study focuses instead on the role
and Smerdon (2014) state that age data have been useful              of (imperfect) models in two selected decision-support con-
for constraining models; in particular, “simulation of envi-         texts and how the assimilation of environmental tracers in
ronmental tracer transport that explicitly accounts for the          particular affects their utility in these contexts, i.e., by in-
accumulation and decay of tracer mass, has proven to be              creasing (or otherwise) the reliability of forecasts.
highly beneficial in constraining numerical models”. Zell               Herein, we focus specifically on the ramifications of as-
et al. (2018) showed the relative importance of water level,         similating the information contained within tritium con-
stream discharge and environmental tracers (including tri-           centration observations and tritium-derived mean residence
tium, chlorofluorocarbons – CFCs and SF6) in the condi-              time (MRT) observations for model-based decision support
tioning of groundwater travel time forecasts. They reported          concerning low flow and nutrient transport at the regional
that, overall, tracer data were of considerable benefit in terms     scale in hydrological environments where young groundwa-
of forecast uncertainty reduction. In a recent review paper,         ter components are decision relevant. Tritium is a popular
Schilling et al. (2019) state that assimilation of concentra-        tracer for the identification of relatively young-age ground-
tion observations through surface-water–groundwater flow             waters (i.e., < 70 years old), for the following reasons:
model history matching “harbors huge potential”, based on            (i) unlike CFCs, tritium is not affected by microbial degrada-
the findings of previous studies, while the assimilation of          tion or contamination and (ii) unlike SF6, it is not affected by
tracer-derived residence time observations in these models           potential subsurface sources (e.g., Morgenstern and Daugh-
also often help significantly (where an appropriate approach         ney, 2012; Cartwright and Morgenstern, 2012; Beyer et al.,
is adopted; e.g., Sanford, 2011; Zuber et al., 2011).                2014).
   However, the extent to which the assimilation of diverse             The objective of this study is twofold. First, we investi-
data types (including environmental tracers) is beneficial has       gate the theoretical worth of tritium-derived MRT observa-
previously been investigated only from a somewhat theoreti-          tions relative to other observation data types. This investiga-
cal standpoint, i.e., neglecting the effects of model error. Di-     tion is performed using a case study (Heretaunga Plains, New
rect evaluation of the likelihood term of Bayes’ theorem is          Zealand) that adopts first-order second-moment (FOSM)
predicated on a “perfect” simulator to appropriately condi-          techniques; our analysis focuses on the relative worth of
tion uncertain model parameters through data assimilation.           MRT observations in terms of changes in the uncertainty as-
In real-world modeling contexts, however, the presence of            sociated with spring discharge forecasts at various locations
model error can invalidate even the most rigorous data as-           that are of management interest due to their ecological signif-
similation techniques (e.g., Doherty and Welter, 2010; White         icance. This first case study employs advective-only particle-
et al., 2014; Oliver and Alfonzo, 2018). Therefore, when an          tracking modeling approach to simulate MRT.
imperfect simulator is used in a data assimilation framework,           Second, we explore the use of discrete tritium concentra-
extreme care must be taken to assure that the model imper-           tion observations in data assimilation in the context of a con-
fections do not corrupt (through biased first moments or un-         trolled model simplification experiment as a means to un-
derestimated second moments) the forecast posterior distri-          derstand what, if any, ill effects may be induced by using
butions. A number of recent works have shown that the fail-          these information-rich data types in a simplified (i.e., imper-
ure to appropriately frame the imperfect-model data assimi-          fect) model. This exploration is performed using a second

Hydrol. Earth Syst. Sci., 24, 1677–1689, 2020                                      www.hydrol-earth-syst-sci.net/24/1677/2020/
M. J. Knowling et al.: Model tracer-data assimilation for decision support                                                    1679

case study that employs a recently presented paired simple–                tionship between field observations of spring discharge
complex model analysis (White et al., 2020). The paired                    and groundwater levels.
model analysis is used herein to allow for the identification
of possible (and otherwise undetectable) bias and uncertainty          – The coastal boundary condition is represented using the
underestimation surrounding forecasts of nutrient load to an             (head-dependent flux) general-head boundary package.
ecologically sensitive estuary system. This second case study            The general-head stage is specified using a density-
simulates (tritium and nitrate) tracer concentrations directly           corrected mean sea level (e.g., Morgan et al., 2012).
– using a full advective–dispersive modeling approach that             – Groundwater abstraction rates, based on observed and
also accounts for first-order reaction rates.                            estimated data, are represented using the (specified flux)
                                                                         well package.
2     First case study                                                 For a more detailed description of the Heretaunga Plains
                                                                     models, the reader is referred to Rakowski and Knowling
The first case study serves to investigate the ability of tritium-   (2018).
derived MRT observations to constrain ecologically sensitive
spring discharge forecasts (i.e., the “worth” of these observa-      2.2   Forecasts
tions) using a model of the groundwater system of the Here-
taunga Plains (New Zealand; Fig. 1). The model was con-              We focus on the following forecasts due to their ecological
structed primarily for the purposes of groundwater allocation        significance and their potential to be impacted by groundwa-
management decision support.                                         ter abstraction:
                                                                       – spring discharge rate during summer at two locations
2.1    The model                                                         (one in the central Heretaunga Plains and one in the up-
                                                                         per reaches of the catchment) (Fig. 1)
The model comprises 302 rows and 501 columns (uniform
100 m × 100 m horizontal grid discretization). Two layers are          – spring discharge rate during winter at the central Here-
used for flow simulations, whereas six layers are used to gen-           taunga Plains location (Fig. 1).
erate more vertically detailed cell-by-cell flow budgets for
particle-tracking simulations. MODFLOW-2005 (Harbaugh,               2.3   Observations for assimilation
2005) is used to simulate groundwater flow under steady-
state and transient conditions. Separate simulations are con-        Data assimilation is undertaken notionally via FOSM tech-
ducted for data assimilation and forecasting purposes span-          niques using the following observations:
ning different time periods (and temporal resolutions) of in-          – 6167 groundwater levels (comprising time-averaged
terest (e.g., separate transient flow simulations are conducted          water levels; absolute and deviation-from-mean annual,
using annual stress periods for the period 1980–2015 and us-             monthly and daily water levels; long-term differences in
ing monthly stress periods for the periods 1997–1999 and                 water level; and vertical head differences);
2011–2015). MODPATH (Pollock, 2012) is used to simulate
advection-only (i.e., neglecting diffusion, dispersion and re-         – 92 surface-water–groundwater fluxes (time-averaged
tardation) reverse particle tracking, thereby providing a ba-            and transient river gain and loss fluxes and spring dis-
sis for assimilating tritium-derived MRT estimates (Fig. 1).             charge fluxes, obtained using a range of techniques in-
Specifically, the mean particle exit time corresponding to               cluding flow gauging, electrical conductivity and tem-
each observation location is compared with tritium-derived               perature surveys, water isotopic analyses, etc.; Wilding,
MRT estimates (e.g., Sanford, 2011; Gusyev et al., 2014).                2017); and
   Relevant aspects of the model are the following:
                                                                       – 52 groundwater MRT estimates derived from tritium
    – Land-surface recharge estimates, derived from a daily              concentrations using lumped-parameter models. Specif-
      soil water balance modeling assessment (Rajanayaka                 ically, a combination of exponential piston-flow models
      and Fisk, 2018), are specified using the (specified flux)          (EPMs) and binary-mixing models (BMMs) (that com-
      recharge package.                                                  prise two EPMs) were used. BMMs were employed for
                                                                         wells where long time series data are available for mul-
    – The interaction between groundwater and surface wa-                tiple tracers and where an adequate fit to different tracer
      ter (including rivers, streams and springs) is simulated           signals could not be obtained on the basis of a single
      using the (head-dependent flux) river package. Time-               EPM. Relative EPM mixing fractions were specified on
      varying river stage values are specified for the three             the basis of aquifer confinement conditions and well
      main rivers in the region based on observed values.                screen length (mixing fractions of 80 %–95 % were ap-
      River bed conductance values are varied seasonally to              plied for wells with a long screen in unconfined con-
      reflect in an approximate manner the non-linear rela-              ditions, whereas mixing fractions of 50 %–60 % were

www.hydrol-earth-syst-sci.net/24/1677/2020/                                       Hydrol. Earth Syst. Sci., 24, 1677–1689, 2020
1680 M. J. Knowling et al.: Model tracer-data assimilation for decision support
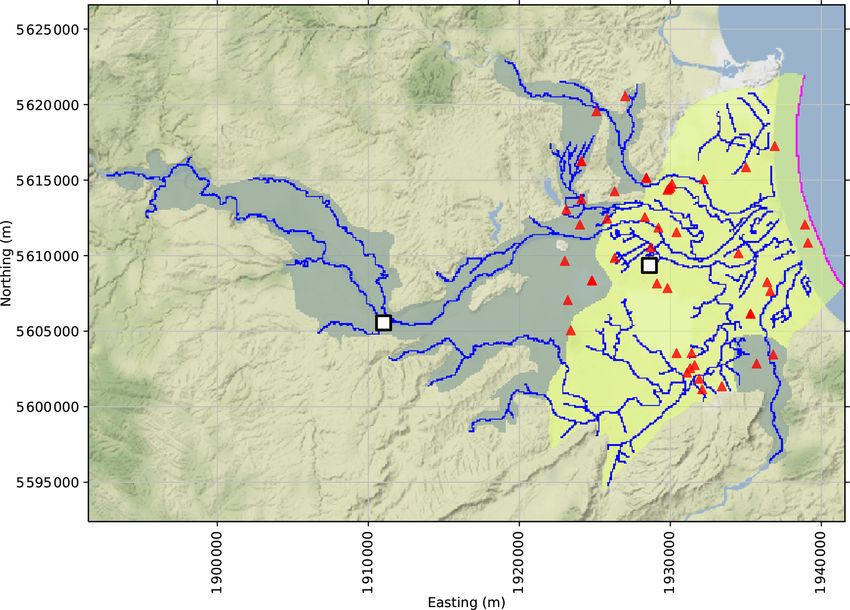
Figure 1. Heretaunga Plains model schematic, including the river boundary conditions (blue lines), top-layer confinement status (unconfined
areas shaded blue and confined areas shaded yellow) and the coastal general-head boundary (magenta line). The location of groundwater
tritium-derived MRT observations are shown as red triangles. The location of forecasts – spring discharge rates during summer and winter –
are shown as white markers.
applied for wells with shorter screens in confined con- The theoretical underpinnings of FOSM-based uncertainty
ditions). The reader is referred to Morgenstern et al. quantification and data-worth assessment and details related
(2018) for more details. to its application herein are presented in Appendix A.
Aspects that are relevant to the application of FOSM
A highly parameterized approach was adopted (e.g., Hunt
herein include:
et al., 2007; Knowling et al., 2019), involving a total of
822 uncertain parameters. Spatially distributed parameteri- – The prior parameter covariance matrix 6 θ was spec-
zation of hydraulic conductivity (horizontal and horizontal– ified as a block-diagonal matrix whereby geostatisti-
vertical anisotropy ratio), effective porosity, specific storage cal correlation between pilot-point-based spatially dis-
and specific yield is achieved using pilot points (e.g., Do- tributed parameters is represented through the use of an
herty, 2003). Spatially distributed river bed and boundary exponential variogram with a range of approximately
conductance parameters are defined on a reach and zone ba- 10 000 m and a sill proportional to the expected prior
sis, respectively. We refer the reader to the Supplement for variance (the range of the square root of the diagonal
more information. elements of 6 θ ; i.e., the standard deviation of prior pa-
rameter uncertainty is given in the Supplement). Non-
2.4 Uncertainty quantification and data-worth
spatially and non-temporally distributed parameters are
exploration
assumed to be uncorrelated and therefore occupy diag-
Here we employ FOSM techniques (e.g., Tarantola, 2005; onal matrix elements only.
Doherty, 2015) to investigate the theoretical worth of var-
ious observation data types in terms of the their influence – The Jacobian matrix J was populated using 1 % two-
on the uncertainty variance surrounding forecasts following point derivative increments.
data assimilation. Application of FOSM in this context re-
quires only consideration of the relative differences in esti- – The diagonal elements of the epistemic noise covariance
mated forecast variance as a result of conditioning on dif- matrix 6 (see Appendix A) was specified on the basis
ferent observation data types. The use of FOSM in relative of observation “weights” adjusted in such a way that
contexts has been shown to be especially robust (e.g., Daus- the measurement objective function equals the number
man et al., 2010; Herckenrath et al., 2011; Knowling et al., of non-zero weighted observations, in order to approxi-
2019). mate epistemic noise (i.e., the combined impact of ran-
Hydrol. Earth Syst. Sci., 24, 1677–1689, 2020 www.hydrol-earth-syst-sci.net/24/1677/2020/M. J. Knowling et al.: Model tracer-data assimilation for decision support 1681
dom measurement errors and model simplification er- tions. This is generally in contrast to the more unique infor-
rors) based on model residuals (e.g., Doherty, 2015). mation contained within spring discharge observations.
2.5 Results
3 Second case study
For the summer–spring discharge forecast in the central
Heretaunga Plains, MRT observations display a worth that The second case study serves to evaluate how assimilating
is considerably less than that of spring discharge observa- discrete groundwater tritium concentration observations may
tions during the summer months (i.e., when lower flows per- affect the robustness of forecasts in the context of a con-
sist) and transient head observations (Fig. 2a). This is not trolled model simplification experiment, where the simplifi-
surprising given that the forecast and the summer–spring cation is related to model vertical discretization (we refer the
discharge observations are of the same type and represent reader to White et al., 2020, for an exploration of the appro-
the same temporal condition, and transient head observa- priateness of reduced-discretization models in decision sup-
tions are plentiful (5704), spanning different time periods at port more generally). In contrast to the first case study, which
annual, monthly and daily resolutions. The worth of MRT focused on the theoretical worth of derived tritium observa-
observations is greater than winter–spring discharge obser- tions in terms of changes in forecast variance, this case study
vations, indicating a higher relevance of the spatially and proceeds with repeated data assimilation in a paired simple–
temporally integrated information contained within MRT ob- complex model analysis both with and without assimilating
servations for this low-flow-related prediction compared to tritium observations. Through these paired-model analyses,
the higher-frequency and higher-magnitude signals captured any potential biases or underestimation of variances arising
within spring discharge observations during winter. from the assimilation of tritium observations with a sim-
Similar results from a relative perspective are apparent plified model can be exposed. A linked hydrologic-nutrient
for the summer–spring discharge forecast in the upper por- transport model of the Hauraki Plains (New Zealand) (Fig. 3)
tion of the Heretaunga Plains. That is, transient head ob- is used as a basis for the model simplification experiment.
servations and spring discharge observations during summer
3.1 The model
are of the highest worth, followed by observations of time-
averaged heads, MRT and winter–spring discharge (Fig. 2b) The linked hydrologic-nutrient transport model simulates
– for reasons described above. The greater worth of MRT ob- groundwater and surface-water flow using MODFLOW-
servations for this forecast compared to the summer–spring NWT (Niswonger et al., 2011); advective and dispersive
discharge forecast located down gradient indicates that this transport of nitrate and tritium in the groundwater and
forecast is more sensitive to (uncertain) model parameters surface-water system is simulated using the MT3D-USGS
that are conditioned through assimilating MRT observations. model (Bedekar et al., 2016). Denitrification and radioactive
This is due to the fact that the forecast is located where the tritium decay processes are simulated using first-order reac-
aquifer is unconfined and receives rainfall and river recharge: tion rates. The model is described in detail in White (2018),
these recharge rates are informed by MRT observations and and the vertical-discretization simplification analysis is de-
have a large influence on the forecast. scribed in detail in White et al. (2020).
For the winter–spring discharge forecast, the worth of Herein, we focus on a single forecast: the cumulative load
MRT observations is lower than that of other observations of nitrate discharging from the surface-water system to the
(Fig. 2c). This indicates a low relevance of the spatially Firth of Thames – an ecologically sensitive estuary system
and temporally integrated information contained in MRT – over a 10-year projection scenario involving present-day
observations with respect to a forecast concerning higher- (2018) flow and transport model forcing conditions. This
frequency and higher-magnitude signals. This is also sup- forecast aggregates flow paths across the entire model do-
ported by the relatively low worth of the time-averaged main (i.e., it represents the only nitrate-flux sink of the sys-
head observations due to the temporally integrated nature of tem). This forecast is referred to herein as the “Firth fore-
these quantities. As expected, a significantly greater worth cast”.
of spring discharge observations during winter is evident for
this forecast due to the unique and directly relevant infor- 3.2 Data assimilation and uncertainty quantification
mation content associated with discharge observations that
capture high-flow transience signals. As described in White et al. (2020), data assimilation was
Across the three forecasts, a significantly larger worth is undertaken via history matching three versions of the model,
evident when MRT observations are added to the observa- each with a different vertical-discretization scheme; his-
tion dataset compared to when MRT observations are re- tory matching was performed using the iterative ensemble
moved from the observation dataset (red versus blue; Fig. 2). smoother PESTPP-IES (White, 2018).
This indicates that correlation occurs between the informa- History matching was conducted using 100 stochastic pa-
tion contained within MRT observations and other observa- rameter realizations. An ensemble size of 100 was deemed
www.hydrol-earth-syst-sci.net/24/1677/2020/ Hydrol. Earth Syst. Sci., 24, 1677–1689, 20201682 M. J. Knowling et al.: Model tracer-data assimilation for decision support
Figure 2. Worth of different observation groups (%DW) with respect to forecasts: (a) spring discharge flux during summer in the central
Heretaunga Plains, (b) spring discharge flux during summer in the upper portion of the Heretaunga Plains and (c) spring discharge flux during
winter in the central Heretaunga Plains (see Fig. 1 for locations). The %DW value is quantified as both the increase in forecast uncertainty
variance following the removal of an observation group available for conditioning (red) and the decrease in forecast uncertainty variance
following the addition of an observation group available for conditioning (blue) (see Appendix A). Note the different scales on the y axes.
sufficient to avoid underutilization of observation data (i.e., for more information on parameterization and construc-
“underfitting”) based on an exploration of the solution-space tion of prior parameter covariance matrices.
dimensionality using a subspace analysis (Moore and Do-
herty, 2005; see the Supplement and Knowling et al., 2019, – Observation data for assimilation. The history-
for more details). Following history matching, the 10-year matching experiments included 20 tritium concentration
projection scenario was evaluated with the 100 history- observations from the groundwater system (Fig. 3; see
matched realizations (effectively a 100-member sample of also the Supplement for observation locations per model
the posterior distribution). From the resulting 100 scenario layer). Other observations such as long-term averaged
evaluations, a posterior probability density function (PDF) groundwater levels and surface-water flows and tran-
of the First forecast was constructed. sient surface-water and groundwater nitrate concentra-
The reader is referred to White (2018) and White et al. tions were also used for history matching (see the Sup-
(2020) for a full description of the Hauraki Plains model data plement for observation locations).
assimilation process; a brief overview is nevertheless pro-
vided as follows: As shown in White et al. (2020), the reduced-discretization
(one-layer and two-layer) model posterior PDFs for the Firth
forecast display significant bias compared to the correspond-
– Model parameterization. Spatially distributed param- ing seven-layer model posterior PDF (Fig. 4a, d, g). In White
eterization of (horizontal and vertical) hydraulic con- et al. (2020), it was hypothesized that the tritium observations
ductivity, effective porosity, recharge rate, first-order were giving rise to the apparent bias in the one-layer and
denitrification rate, initial concentration and dispersiv- two-layer posterior PDFs through the phenomenon of (in-
ity is achieved using a combination of cell-based and appropriate) parameter compensation (e.g., Clark and Vrugt,
zone-based multipliers. The nitrate loading rate and ab- 2006; White et al., 2014) arising from history-matching mod-
straction well rate are parameterized using cell-by-cell els with simplified model vertical discretization. Herein, we
and well-based multipliers, respectively. Streamflow- test this hypothesis by conditioning all three uniquely dis-
routing (SFR) elements are parameterized on a stream- cretized models again, but without using the discrete tritium
segment basis. This parameterization approach gives observations, and then by comparing the resulting posterior
rise to a problem dimensionality of 141 268, 50 180 PDFs to the corresponding PDFs in White et al. (2020). Any
and 29 050 for the seven-layer, two-layer and one-layer apparent difference in the posterior PDFs for the Firth fore-
model history-matching experiments, respectively. We cast is therefore directly attributable to the exclusion of the
refer the reader to White (2018) and White et al. (2020) tritium observations during history matching.
Hydrol. Earth Syst. Sci., 24, 1677–1689, 2020 www.hydrol-earth-syst-sci.net/24/1677/2020/M. J. Knowling et al.: Model tracer-data assimilation for decision support 1683
is largely in contrast to the case where data assimilation is
undertaken without the tritium observations, which leads to
much more subtle differences in posterior PDFs across the
uniquely discretized models (Fig. 4b, e, h).
The bias apparent in the posterior difference PDFs for
the reduced-layer models relative to the seven-layer model
(Fig. 4c, f, i) is directly attributable to the use of tritium ob-
servations in the data assimilation process. The difference
between the Firth forecast PDFs resulting from data assim-
ilation with and without tritium is most pronounced for the
one-layer model (Fig. 4i). In this case, excluding tritium ob-
servations from the history-matching results in a decrease in
simulated nitrate discharge of 2×10⁷ to 4×10⁷ kg – approx-
imately a 40 % decrease in simulated mean nitrate discharge.
We attribute the apparent one-layer PDF bias to the loss of
simulated vertical flow and associated deeper groundwater
flow paths. Briefly, this occurs due to the aggregation of nu-
merical discretization effects – the flow paths of a coarser-
layer model will be a smoother and averaged representation
of those derived from a finer-layer model. While these deeper
flow paths are not important for simulating the nitrate trans-
port cycle (given the relatively high denitrification rates in the
Hauraki system), it is apparently important for assimilating
the tritium concentration observations.
The biases identified reflect the sensitivity of the Firth
Figure 3. Hauraki Plains model extent (red dashed line), layer-one
inactive area (shaded) and surface-water network (blue lines). The forecast to uncertain parameters that were conditioned by tri-
terminal surface-water reaches that discharge to the Firth of Thames tium concentration observations. This occurs due to the spa-
are shown as blue triangles. The location of groundwater tritium tially integrated nature of the Firth nitrate-load forecast and
measurements are shown as magenta dots. because the tritium observations provide insight into spatially
and temporally averaged recharge and lateral flux rates in the
upgradient portion of the domain, where most of the surface-
3.3 Results water–groundwater exchange occurs.
The process of history matching with and without available
groundwater tritium concentration observations yields sub- 4 Discussion and conclusions
stantial differences in the posterior PDFs of the Firth fore-
cast (Fig. 4). In the case of the seven-layer “complex model” This study explores the ramifications of assimilating tri-
(Fig. 4a, b), excluding the tritium observations results in a tium concentration and tritium-derived interpretation ob-
posterior PDF with a larger second moment and a slightly servations, specifically in the context of two examples of
larger first moment compared to including tritium observa- decision-support modeling. The benefit or otherwise of tri-
tions for history matching; the difference between the Firth tium data in other contexts such as site system character-
forecast posterior PDFs with and without assimilating tritium ization and understanding and conceptual-model develop-
observations is between 0 and 2 × 10⁷ kg of nitrate (Fig. 4c). ment is therefore not the focus of the current study; this
The larger second moment of the posterior PDF when ex- study is concerned with a model’s ability to “predict” (in two
cluding tritium observations represents an intuitive and ex- decision-support contexts) rather than “explain” (observed
pected outcome: using fewer observations for parameter con- system behavior), as contrasted by Shmueli (2010).
ditioning through history matching should (theoretically) re- The first case study presented herein serves to demon-
sult in a larger posterior variance for the forecasts that depend strate that assimilating the rich information contained within
on those parameters. tritium-derived MRT observations may be of variable worth
Herein, for the purposes of identifying bias, the seven- in terms of improving the reliability of forecasts, especially
layer model is considered to represent the best-available es- where MRT observations are correlated with other available
timate of the Firth forecast. Using this construct, we see that state observations (e.g., where hydraulic data are widespread,
there are significant differences in posterior PDFs across the given the apparent spatially and temporally integrated infor-
uniquely discretized models arising from data assimilation mation content of MRT observations, as supported by Ginn
that included the tritium observations (Fig. 4a, d, g). This et al., 2009). Moreover, the worth of MRT observations is
www.hydrol-earth-syst-sci.net/24/1677/2020/ Hydrol. Earth Syst. Sci., 24, 1677–1689, 20201684 M. J. Knowling et al.: Model tracer-data assimilation for decision support Figure 4. Comparison of posterior probability density functions (PDFs) for the Firth forecast. The left column (a, d, g) allows for the identification of bias as a result of both model simplification and tritium (Tr) assimilation. By comparing to the middle column (b, e, h), model simplification-induced bias can be separated from that induced by assimilating tritium observations. The isolation of tritium assimilation- induced bias evident with different simplified models is shown in the right column (c, f, i). Including tritium observations in the conditioning of the one-layer and two-layer models (g, d) yields significant bias compared to the seven-layer PDF (a). However, if tritium observations are excluded from conditioning, the one-layer and two-layer PDFs (h, e) have considerably less bias compared to the corresponding seven-layer PDF (b). The differences in the PDFs (c, f, i) show that the tritium observations have the greatest biasing effect on the Firth forecast for the one-layer model. shown to vary between forecasts in such a way that reflects presented herein would generally be larger for forecasts that the underlying physics represented by the model (e.g., the are dependent on both uncertain hydraulic and transport pa- MRT observations are of greatest worth for forecasts that rameters (e.g., particle travel times). This is notwithstand- are located where the aquifer is receiving recharge); these ing that the uncertainty variance for such forecasts may be physics dictate the “information flow” rather than the spa- larger given the additional source of uncertainty associated tial proximity of the MRT observations and the forecast. The with porosity. These findings are nevertheless highly relevant forecast-specific nature of observation worth has also been in that MRT observations are widely used and often regarded reported previously (e.g., Dausman et al., 2010; Fienen et al., to be of benefit in constraining uncertain model parameters 2010; White et al., 2016). The worth of MRT observations more generally (Schilling et al., 2019). relative to various hydraulic potential and discharge observa- The second case study serves to demonstrate that as- tions across the different forecasts are, in general terms, sim- similating tritium concentration observations with simplified ilar to those reported by Hunt et al. (2006), Masbruch et al. (i.e., imperfect) numerical models may induce significant (2014), Oehlmann et al. (2015), and Zell et al. (2018) (espe- bias in forecasts; this is bias that is undetectable without a cially when considering the discussion point in the following simple–complex model pair (e.g., Doherty and Christensen, paragraph). 2011; White et al., 2014; Knowling et al., 2019). The forecast While the particle-tracking model used in the first case bias revealed in the second case study occurs as a result of the study provides a mechanism for MRT observations to in- vertical-discretization simplified model’s inability to appro- form uncertain model parameters, including aquifer porosity priately assimilate the rich information content of the tritium (which is otherwise uninformed by other historical field ob- observations. Generally, the observed pattern of simplifica- servations), it is important to note that the forecasts are insen- tion and the resulting forecast bias implies that as the simpli- sitive to porosity. That is, the information contained within fication of the model increases, the dangers of assimilating MRT observations is spread between parameters that both rich and diverse data types also grows. This result is highly do and do not play a role in constraining forecasts – effec- relevant to decision-support modeling practitioners, since all tively “diluting” the information available for conditioning. numerical models are gross simplifications of real environ- It is therefore expected that the worth of MRT observations mental systems that they attempt to simulate. We refer the Hydrol. Earth Syst. Sci., 24, 1677–1689, 2020 www.hydrol-earth-syst-sci.net/24/1677/2020/
M. J. Knowling et al.: Model tracer-data assimilation for decision support                                                   1685

reader to Knowling et al. (2019) and White et al. (2020) for       also support the potential for the transferability in our find-
a broader exploration of the consequences of model sim-            ings and recommendations to data assimilation in other envi-
plification (in the form of parameterization reduction and         ronmental modeling contexts.
vertical-discretization coarsening, respectively) in terms of          If diverse and information-rich data such as tritium
the decision-relevant forecast bias–variance trade-off and its     and MRT observations are available and data assimilation
implications for management decision making more gener-            through history matching is deemed necessary and/or appro-
ally.                                                              priate, then a targeted modeling approach is needed that iden-
   Collectively, these results suggest that the assimilation       tifies which of these data are relevant to the forecast. This is
of tritium and tritium-derived observations through history        critical to avoiding the ill effects of model error in the con-
matching with an imperfect model should be strategic and           text of decision-support modeling (e.g., White et al., 2014;
approached with caution. It is recommended that these              Knowling et al., 2019), as well as avoiding unnecessary com-
information-rich observations should not indiscriminately be       plexity (through processes and parameters) needed to simu-
incorporated in a data assimilation framework, given that this     late the equivalent values of the diverse data for assimilation
study has shown that such an approach (i) may be of variable       purposes, which may greatly increase the computational cost
apparent benefit, depending on the forecast being made, and        of the modeling analysis.
(ii) when using imperfect models, which may produce far                It should be noted, however, that even when the forecast is
worse forecast outcomes than those that would have been ar-        well “aligned” with observation data (i.e., the forecast is de-
rived at without assimilating these observations at all. This      pendent on parameters residing in the solution space), some
recommendation is similar to those by Brynjarsdóttir and           degree of parameter compensation will inevitably occur; all
O’Hagan (2014) and He et al. (2018). We consider this rec-         models are gross simplifications, and therefore model param-
ommendation to be in stark contrast to what we believe is a        eters do not perfectly represent real-world properties (e.g.,
common view among practitioners that “calibrating to more          Clark and Vrugt, 2006; White et al., 2014). However, if the
data improves the model and its predictions”; we therefore         data used for assimilation are commensurate with the fore-
consider this recommendation to be of significant implication      casts, then the ill effects of model error may be expected to
to decision-support environmental modeling practitioners.          be negligible (e.g., Doherty and Christensen, 2011; Watson
   Furthermore, we expect the above-mentioned issues asso-         et al., 2013).
ciated with imperfect-model data assimilation to be relevant           The above findings and recommendations suggest that
and largely transferrable to the assimilation of other environ-    there is a significant need to develop improved strategies
mental tracers, other information-rich observations and di-        to assimilate diverse observation types including tracer con-
verse data types more generally. This is because we consider       centration and tracer interpretation observations in numeri-
the primary barrier to the appropriate assimilation of tritium     cal models for decision support. Such strategies will likely
observation data encountered in the second case study to be        require increased model complexity (including advanced
fundamental challenges associated with extracting appropri-        discretization, process representation and parameterization)
ate information from spatially discrete concentration obser-       such that information-rich and diverse data types that operate
vations when using upscaled or simplified representations of       across a range of spatial and temporal scales commensurate
hydraulic properties within a regional-scale model that sim-       with a given forecast can be properly assimilated.
ulates tracer concentrations using the advection–dispersion            However, an important and challenging compromise will
equation (e.g., Zheng and Gorelick, 2003; Riva et al., 2008).      be encountered: the need for enough model complexity to
To the extent that simulated outputs corresponding to ob-          appropriately assimilate rich and diverse observations while
served tracer concentrations are sensitive to model details        simultaneously ensuring that this level of complexity does
or parameters that are “missing” in a simplified model (e.g.,      not preclude the application of formal data assimilation and
White et al., 2014), parameter compensation will occur (e.g.,      uncertainty quantification techniques due to the associated
Clark and Vrugt, 2006). To the extent that the forecast of         numerical instability and excessive run times. The naviga-
management interest is dependent on these biased parameter         tion of this trade-off is central to effective and efficient
estimates, the forecast will also become biased, potentially       decision-support modeling practice. In the meantime, tracer-
leading to resource mismanagement. The ubiquitous nature           data model assimilation should involve processing or trans-
of model error and the challenges in appropriately account-        forming of concentrations into quantities that may be more
ing for differences in, e.g., representative spatial scales be-    useful and may guard against ill effects of history matching
tween field observations and model-derived quantities, sug-        imperfect models (e.g., by integrating observations in space
gests that the ill effects identified in this study such as bias   and time) (e.g., Rasa et al., 2013; Knowling et al., 2019;
induced by history matching are not unique to the specifics        White et al., 2020).
of our study (e.g., consideration of tritium as a tracer). The
similar findings and recommendations of Brynjarsdóttir and
O’Hagan (2014) and He et al. (2018) in the disciplines of
statistics and petroleum reservoir engineering, respectively,

www.hydrol-earth-syst-sci.net/24/1677/2020/                                     Hydrol. Earth Syst. Sci., 24, 1677–1689, 2020
1686                                                 M. J. Knowling et al.: Model tracer-data assimilation for decision support

Appendix A: First-order second-moment (FOSM)
methodology
                                                                       σs2 = y T 6 θ y                                            (A2)
This section provides a description of the FOSM approach
used in the first case study to quantify uncertainty variance          and
and assess data worth.
  The covariance matrix of uncertain model parameters 6 θ              σ 2s = y T 6 θ y.                                          (A3)
can be approximated using the Schur complement as follows
                                                                          The worth of data, expressed as a percentage, is given by
(Golub and Van Loan, 1996; Tarantola, 2005):
                  h             i−1                                                  2
                                                                                    σ±obs      2
                                                                                          − σbase
6 θ = 6 θ − 6 θ J J6 θ JT + 6
                  T
                                    J6 θ ,                    (A1)     %DW =          2        2
                                                                                                    × 100,                        (A4)
                                                                                  min σbase , σ±obs
where 6 θ is the prior parameter covariance matrix, which                        2
                                                                       where σ±obs    is the increase or decrease in forecast uncer-
is specified based on expert knowledge pertaining to site sys-         tainty variance as a result of the removal or addition of one
tem characteristics; 6  is the epistemic observation noise co-        or more observations or observation groups used for parame-
variance matrix (often assumed to have non-zero diagonal el-                                                 2
                                                                       ter conditioning, respectively, and σbase is either the forecast
ements only), which includes the effects of model structural           uncertainty calculated on the basis of all observation data or
errors and measurement errors; and J is the Jacobian ma-               zero observation data, depending on whether data worth is
trix of partial first derivatives (i.e., sensitivities) of simulated   being quantified by adding or removing observations.
model outputs with respect to parameters. The Schur comple-               Herein, we quantify %DW as a result of both the removal
ment can be considered a linearized form of Bayes’ equation            and addition of observation groups. We primarily focus on
to estimate the second moment of the parameter and fore-               %DW values based on the removal of an observation group
cast posterior distribution (e.g., Goldstein and Wooff, 2007;          from an otherwise full observation dataset available for as-
Christensen and Doherty, 2008; Dausman et al., 2010).                  similation, given that these values reflect the unique (i.e.,
   Equation (A1) assumes a linear relation between model               uncorrelated) information content of observations. However,
parameters and simulated outputs (i.e., the sensitivities en-          the difference between %DW values arising from these dif-
capsulated within the J matrix are independent of the param-           ferent data-worth quantification approaches is used herein to
eter values θ). It also assumes that parameter and epistemic           comment on the level of information uniqueness or redun-
uncertainty distributions are Gaussian (i.e., normal).                 dancy within observation groups.
   While the posterior parameter and forecast uncertainty                 It is important to note that each FOSM-based data-worth
variances yielded by FOSM may only be approximate (de-                 assessment is conducted with respect to a single forecast
pending on the validity of the linear assumption), the com-            (notwithstanding that we evaluate the worth of different ob-
putational efficiency with which a large number of different           servation data with respect to a number of different fore-
number of conditioning “experiments” can be performed is               casts). We consider this to be a side benefit of this approach,
unparalleled; these experiments facilitate the rapid evaluation        especially given the need for decision-support modeling to
of the worth of different types of observations to reduce fore-        be undertaken in a forecast-targeted manner, as discussed re-
cast variance. In addition, a number of studies have shown             cently by White (2017).
support for its usage especially in a relative second-moment
sense (e.g., Dausman et al., 2010; Herckenrath et al., 2011;
Knowling et al., 2019).
   The prior and posterior uncertainty variance surrounding
a forecast σs2 can be expressed by mapping uncertainty from
parameter to forecast “space”. This is achieved by computing
the sensitivity of the forecast to model parameters, compris-
ing the vector y (i.e., a row of J). That is

Hydrol. Earth Syst. Sci., 24, 1677–1689, 2020                                            www.hydrol-earth-syst-sci.net/24/1677/2020/
M. J. Knowling et al.: Model tracer-data assimilation for decision support 1687
Data availability. The data files, scripts and software used herein Christensen, S. and Doherty, J.: Predictive error dependencies
are available upon request from GNS Science. when using pilot points and singular value decomposition in
groundwater model calibration, Adv. Water Resour., 31, 674–
700, https://doi.org/10.1016/j.advwatres.2008.01.003, 2008.
Supplement. The supplement related to this article is available on- Clark, M. P. and Vrugt, J. A.: Unraveling uncertainties in
line at: https://doi.org/10.5194/hess-24-1677-2020-supplement. hydrologic model calibration: Addressing the problem of
compensatory parameters, Geophys. Res. Lett., 33, L06406,
https://doi.org/10.1029/2005GL025604, 2006.
Author contributions. MJK, JTW and CRM contributed to the con- Dausman, A., Doherty, J., Langevin, C., and Sukop, M.: Quantify-
cept. MJK and JTW undertook the modeling analyses. MJK pre- ing data worth toward reducing predictive uncertainty, Ground
pared the paper with input from JTW and CRM. PR and KH con- Water, 48, 729–740, 2010.
tributed to the underlying Heretaunga Plains models. Doherty, J. and Christensen, S.: Use of paired simple and
complex models to reduce predictive bias and quan-
tify uncertainty, Water Resour. Res., 47, W12534,
https://doi.org/10.1029/2011WR010763, 2011.
Competing interests. The authors declare that they have no conflict
Doherty, J. and Welter, D.: A Short Exploration of
of interest.
Structural Noise, Water Resourc. Res., 46, W05525,
https://doi.org/10.1029/2009WR008377, 2010.
Doherty, J. E.: Ground water model calibration using pilot points
Acknowledgements. The authors wish to thank Ty Ferre, Chris Tur- and regularization, Ground Water, 41, 170–177, 2003.
nadge and the anonymous reviewer for their helpful comments. Doherty, J. E.: PEST and its utility support software, Theory, Wa-
termark Numerical Publishing, Brisbane, Australia, 2015.
Fienen, M. N., Doherty, J. E., Hunt, R. J., and Reeves, H. W.: Us-
Financial support. This research has been supported by the Min- ing prediction uncertainty analysis to design hydrologic monitor-
istry of Business Innovation and Employment, as part of both the ing networks: Example applications from the Great Lakes water
Te Whakaheke o te Wai and Smart Models for Aquifer Management availability pilot project, U.S. Geological Survey Scientific In-
research programs (grant nos. C05X1803 and CONT-41982-ETR- vestigation Report 2010-5159, Middleton, WI, USA, p. 44, 2010.
GNS, respectively), with co-funding from Hawke’s Bay Regional Ginn, T. R., Haeri, H., Massoudieh, A., and Foglia, L.: Notes on
Council and Waikato Regional Council. Groundwater Age in Forward and Inverse Modeling, Transport
Porous Med., 79, 117–134, https://doi.org/10.1007/s11242-009-
9406-1, 2009.
Review statement. This paper was edited by Fabrizio Fenicia and Goldstein, M. and Wooff, D.: Bayes linear statistics, theory and
reviewed by Ty P. A. Ferre and one anonymous referee. methods, John Wiley & Sons, Chichester, UK, 2007.
Golub, G. and Van Loan, C.: Matrix Computations, Johns Hop-
kins Studies in the Mathematical Sciences, Johns Hopkins Uni-
versity Press, available at: http://books.google.com/books?id=
mlOa7wPX6OYC (last access: 20 July 2019), 1996.
References Gusyev, M. A., Toews, M., Morgenstern, U., Stewart, M., White,
P., Daughney, C., and Hadfield, J.: Calibration of a tran-
André, L., Franceschi, M., Pouchan, P., and Atteia, O.: Us- sient transport model to tritium data in streams and simula-
ing geochemical data and modelling to enhance the under- tion of groundwater ages in the western Lake Taupo catch-
standing of groundwater flow in a regional deep aquifer, ment, New Zealand, Hydrol. Earth Syst. Sci., 17, 1217–1227,
Aquitaine Basin, south-west of France, J. Hydrol., 305, 40–62, https://doi.org/10.5194/hess-17-1217-2013, 2013.
https://doi.org/10.1016/j.jhydrol.2004.08.027, 2005. Gusyev, M. A., Abrams, D., Toews, M. W., Morgenstern, U., and
Bedekar, V., Morway, E., Langevin, C., and Tonkin, M.: MT3D- Stewart, M. K.: A comparison of particle-tracking and solute
USGS version 1: A U.S. Geological Survey release of MT3DMS transport methods for simulation of tritium concentrations and
updated with new and expanded transport capabilities for use groundwater transit times in river water, Hydrol. Earth Syst.
with MODFLOW, U.S. Geological Survey Techniques and Sci., 18, 3109–3119, https://doi.org/10.5194/hess-18-3109-2014,
Methods 6-A53, Reston, VA, USA, p. 69, 2016. 2014.
Beyer, M., Morgenstern, U., and Jackson, B.: Review of techniques Han, D. M., Song, X. F., Currell, M. J., and Tsujimura, M.: Us-
for dating young groundwater (< 100 years) in New Zealand, J. ing chlorofluorocarbons (CFCs) and tritium to improve concep-
Hydrol., 53, 93–111, 2014. tual model of groundwater flow in the South Coast Aquifers
Brynjarsdóttir, J. and O’Hagan, A.: Learning about physical param- of Laizhou Bay, China, Hydrol. Process., 26, 3614–3629,
eters: The importance of model discrepancy, Inverse Probl., 30, https://doi.org/10.1002/hyp.8450, 2012.
114007, https://doi.org/10.1088/0266-5611/30/11/114007, 2014. Hansen, A. L., Refsgaard, J. C., Christensen, B. S. B., and
Cartwright, I. and Morgenstern, U.: Constraining ground- Jensen, K. H.: Importance of including small-scale tile drain
water recharge and the rate of geochemical processes discharge in the calibration of a coupled groundwater-surface
using tritium and major ion geochemistry: Ovens catch- water catchment model, Water Resour. Res., 49, 585–603,
ment, southeast Australia, J. Hydrol., 475, 137–149, https://doi.org/10.1029/2011WR011783, 2013.
https://doi.org/10.1016/j.jhydrol.2012.09.037, 2012.
www.hydrol-earth-syst-sci.net/24/1677/2020/ Hydrol. Earth Syst. Sci., 24, 1677–1689, 20201688 M. J. Knowling et al.: Model tracer-data assimilation for decision support
Harbaugh, A. W.: MODFLOW-2005, the U.S. Geological Survey Moore, C. and Doherty, J. E.: Role of the calibration process in
modular ground-water model – the Ground-Water Flow Process, reducing model predictive error, Water Resour. Res., 41, 1–14,
U. S. Geological Survery, Reston, VA, USA, vol. 6, 2005. 2005.
He, J., Reynolds, A. C., Tanaka, S., Wen, X.-H., and Kamath, J.: Morgan, L. K., Werner, A. D., and Simmons, C. T.: On the in-
Calibrating Global Uncertainties to Local Data: Is the Learning terpretation of coastal aquifer water level trends and water bal-
Being Over-Generalized?, Society of Petroleum Engineers, SPE ances: A precautionary note, J. Hydrol., 470–471, 280–288,
Annual Technical Conference and Exhibition, 24–26 September https://doi.org/10.1016/j.jhydrol.2012.09.001, 2012.
2018, Dallas, Texas, USA, https://doi.org/10.2118/191480-MS, Morgenstern, U. and Daughney, C. J.: Groundwater age for
2018. identification of baseline groundwater quality and impacts of
Herckenrath, D., Langevin, C. D., and Doherty, J. E.: Predic- land-use intensification – The National Groundwater Monitor-
tive uncertainty analysis of a saltwater intrusion model us- ing Programme of New Zealand, J. Hydrol., 456–457, 79–93,
ing null-space Monte Carlo, Water Resour. Res., 47, W05504, https://doi.org/10.1016/j.jhydrol.2012.06.010, 2012.
https://doi.org/10.1029/2010WR009342, 2011. Morgenstern, U., Stewart, M. K., and Stenger, R.: Dat-
Hunt, R. J., Feinstein, D. T., Pint, C. D., and Anderson, M. P.: The ing of streamwater using tritium in a post nuclear bomb
importance of diverse data types to calibrate a watershed model pulse world: continuous variation of mean transit time
of the Trout Lake Basin, Northern Wisconsin, USA, J. Hydrol., with streamflow, Hydrol. Earth Syst. Sci., 14, 2289–2301,
321, 286–296, https://doi.org/10.1016/j.jhydrol.2005.08.005, https://doi.org/10.5194/hess-14-2289-2010, 2010.
2006. Morgenstern, U., Begg, J., van der Raaij, R., Moreau, M., Martin-
Hunt, R. J., Doherty, J., and Tonkin, M. J.: Are Models Too Sim- dale, H., Daughney, C., Franzblau, R., Stewart, M., Knowling,
ple? Arguments for Increased Parameterization, Groundwater, M., Toews, M., Trompetter, V., Kaiser, J., and Gordon, D.: Here-
45, 254–262, https://doi.org/10.1111/j.1745-6584.2007.00316.x, taunga Plains aquifers: groundwater dynamics, source and hy-
2007. drochemical processes as inferred from age, chemistry, and sta-
Kirchner, J. W., Feng, X., and Neal, C.: Catchment-scale ad- ble isotope tracer data, GNS Science Report; Lower Hutt, New
vection and dispersion as a mechanism for fractal scaling Zealand, https://doi.org/10.21420/G2Q92G, 2018.
in stream tracer concentrations, J. Hydrol., 254, 82–101, Niswonger, R., Panday, S., and Ibaraki, M.: MODFLOW-NWT, A
https://doi.org/10.1016/S0022-1694(01)00487-5, 2001. Newton formulation for MODFLOW-2005, U.S. Geological Sur-
Knowling, M. J., White, J. T., and Moore, C. R.: Role vey Techniques and Methods 6-A37, Reston, VA, USA, p. 44,
of model parameterization in risk-based decision support: 2011.
An empirical exploration, Adv. Water Resour., 128, 59–73, Oehlmann, S., Geyer, T., Licha, T., and Sauter, M.: Reducing the
https://doi.org/10.1016/j.advwatres.2019.04.010, 2019. ambiguity of karst aquifer models by pattern matching of flow
Leray, S., de Dreuzy, J.-R., Bour, O., Labasque, T., and and transport on catchment scale, Hydrol. Earth Syst. Sci., 19,
Aquilina, L.: Contribution of age data to the characteri- 893–912, https://doi.org/10.5194/hess-19-893-2015, 2015.
zation of complex aquifers, J. Hydrol., 464–465, 54–68, Oliver, D. S. and Alfonzo, M.: Calibration of imperfect mod-
https://doi.org/10.1016/j.jhydrol.2012.06.052, 2012. els to biased observations, Comput. Geosci., 22, 145–161,
Li, H., Brunner, P., Kinzelbach, W., Li, W., and Dong, X.: https://doi.org/10.1007/s10596-017-9678-4, 2018.
Calibration of a groundwater model using pattern informa- Pollock, D. W.: User guide for MODPATH version 6 – A particle-
tion from remote sensing data, J. Hydrol., 377, 120–130, tracking model for MODFLOW: U.S. Geological Survey Tech-
https://doi.org/10.1016/j.jhydrol.2009.08.012, 2009. niques and Methods, version 6. edn., U.S. Dept. of the Interior,
Masbruch, M., Gardner, P., and Brooks, L.: Hydrology and numer- U.S. Geological Survey, Reston, Va, USA, 2012.
ical simulation of groundwater movement and heat transport in Rajanayaka, C. and Fisk, L.: Irrigation water demand & land
Snake Valley and surrounding areas, Juab, Millard, and Beaver surface recharge assessment for Heretaunga Plains, Hawke’s
Counties, Utah, and White Pine and Lincoln Counties, Nevada, Bay Regional Council, C16053. Aqualinc Research Limited,
U. S. Geological Survey Scientific Investigations Report 2014- Christchurch, New Zealand, 2018.
5103, Reston, VA, USA, https://doi.org/10.3133/sir20145103, Rakowski, P. and Knowling, M.: Heretaunga aquifer system
2014. groundwater model: Development report, Hawke’s Bay Regional
McDonnell, J. J., McGuire, K., Aggarwal, P., Beven, K. J., Biondi, Council Report No. RM18-14 – 4997, Napier, New Zealand,
D., Destouni, G., Dunn, S., James, A., Kirchner, J., Kraft, P., 2018.
Lyon, S., Maloszewski, P., Newman, B., Pfister, L., Rinaldo, Rasa, E., Foglia, L., Mackay, D. M., and Scow, K. M.: Ef-
A., Rodhe, A., Sayama, T., Seibert, J., Solomon, K., Soulsby, fect of different transport observations on inverse modeling
C., Stewart, M., Tetzlaff, D., Tobin, C., Troch, P., Weiler, M., results: case study of a long-term groundwater tracer test
Western, A., Wörman, A., and Wrede, S.: How old is streamwa- monitored at high resolution, Hydrogeol. J., 21, 1539–1554,
ter? Open questions in catchment transit time conceptualiza- https://doi.org/10.1007/s10040-013-1026-8, 2013.
tion, modelling and analysis, Hydrol. Process., 24, 1745–1754, Riva, M., Guadagnini, A., Fernandez-Garcia, D., Sanchez-Vila,
https://doi.org/10.1002/hyp.7796„ 2010. X., and Ptak, T.: Relative importance of geostatistical and
Michael, H. A. and Voss, C. I.: Estimation of regional- transport models in describing heavily tailed breakthrough
scale groundwater flow properties in the Bengal Basin curves at the Lauswiesen site, J. Contam. Hydrol., 101, 1–13,
of India and Bangladesh, Hydrogeol. J., 17, 1329–1346, https://doi.org/10.1016/j.jconhyd.2008.07.004, 2008.
https://doi.org/10.1007/s10040-009-0443-1, 2009. Sanford, W.: Calibration of models using groundwater age, Hydro-
geol. J., 19, 13–16, 2011.
Hydrol. Earth Syst. Sci., 24, 1677–1689, 2020 www.hydrol-earth-syst-sci.net/24/1677/2020/You can also read