Effect of X-ray free-electron laser-induced shockwaves on haemoglobin microcrystals delivered in a liquid jet
←
→
Page content transcription
If your browser does not render page correctly, please read the page content below
ARTICLE
                  https://doi.org/10.1038/s41467-021-21819-8                 OPEN

                  Effect of X-ray free-electron laser-induced
                  shockwaves on haemoglobin microcrystals
                  delivered in a liquid jet
                  Marie Luise Grünbein1, Alexander Gorel1, Lutz Foucar1, Sergio Carbajo2, William Colocho 2, Sasha Gilevich2,
                  Elisabeth Hartmann1, Mario Hilpert 1, Mark Hunter 2, Marco Kloos1,4, Jason E. Koglin2,5, Thomas J. Lane2,6,
                  Jim Lewandowski2, Alberto Lutman 2, Karol Nass 1,7, Gabriela Nass Kovacs1, Christopher M. Roome1,
1234567890():,;

                  John Sheppard2, Robert L. Shoeman1, Miriam Stricker 1,8, Tim van Driel2, Sharon Vetter2, R. Bruce Doak1,
                  Sébastien Boutet 2, Andrew Aquila 2, Franz Josef Decker2, Thomas R. M. Barends1,
                  Claudiu Andrei Stan 3 ✉ & Ilme Schlichting 1 ✉

                  X-ray free-electron lasers (XFELs) enable obtaining novel insights in structural biology. The
                  recently available MHz repetition rate XFELs allow full data sets to be collected in shorter
                  time and can also decrease sample consumption. However, the microsecond spacing of MHz
                  XFEL pulses raises new challenges, including possible sample damage induced by shock
                  waves that are launched by preceding pulses in the sample-carrying jet. We explored this
                  matter with an X-ray-pump/X-ray-probe experiment employing haemoglobin microcrystals
                  transported via a liquid jet into the XFEL beam. Diffraction data were collected using a shock-
                  wave-free single-pulse scheme as well as the dual-pulse pump-probe scheme. The latter,
                  relative to the former, reveals significant degradation of crystal hit rate, diffraction resolution
                  and data quality. Crystal structures extracted from the two data sets also differ. Since our
                  pump-probe attributes were chosen to emulate EuXFEL operation at its 4.5 MHz maximum
                  pulse rate, this prompts concern about such data collection.

                  1 Max  Planck Institute for Medical Research, Jahnstrasse 29, Heidelberg, Germany. 2 SLAC National Accelerator Laboratory, Menlo Park, CA, USA.
                  3 Department   of Physics, Rutgers University Newark, Newark, NJ, USA. 4Present address: European XFEL GmbH, Schenefeld, Germany. 5Present address: Los
                  Alamos National Laboratory, Los Alamos, NM, USA. 6Present address: Center for Free-Electron Laser Science, DESY, Hamburg, Germany. 7Present address:
                  Paul Scherrer Institut, Villigen, Switzerland. 8Present address: Department of Statistics, University of Oxford, Oxford, UK. ✉email: claudiu.stan@rutgers.edu;
                  ilme.schlichting@mpimf-heidelberg.mpg.de

                  NATURE COMMUNICATIONS | (2021)12:1672 | https://doi.org/10.1038/s41467-021-21819-8 | www.nature.com/naturecommunications                                    1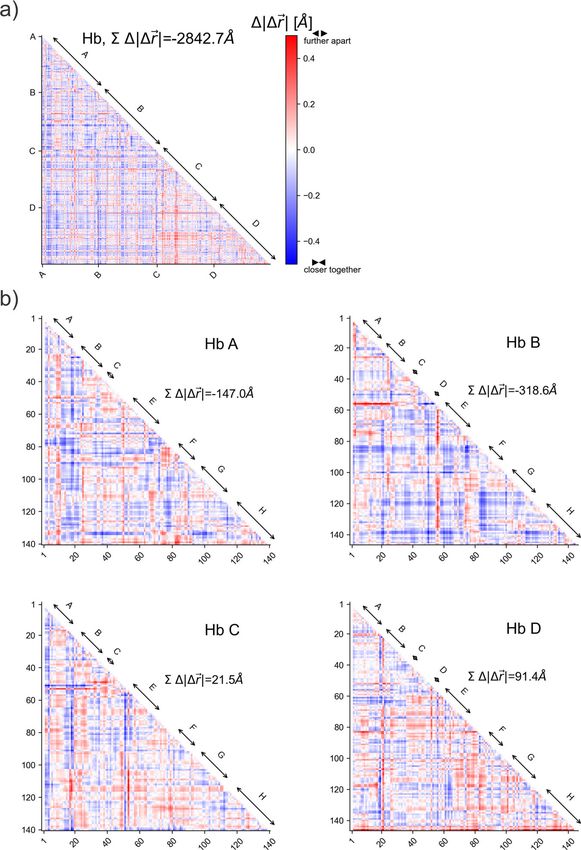
ARTICLE                                                                   NATURE COMMUNICATIONS | https://doi.org/10.1038/s41467-021-21819-8

X
        -ray free-electron lasers (XFELs) are the brightest X-ray                Protein structures often contain cavities for ligands, cofactors
        sources currently available and so well suited to investi-            or water molecules. These, as well as loosely folded loops or
        gating weakly scattering objects, such as nanocrystals1,2             water-mediated structural interactions, are important for the
and single noncrystalline particles, such as viruses3. Moreover the           structural flexibility intrinsic to protein functionality. Such
femtosecond duration of XFEL pulses matches chemical time-                    “packing defects” and also the large solvent channels in protein
scales, allowing the dynamics of matter to be studied in a time-              crystals render proteins and their crystals sensitive to applied
resolved manner4–6 and enabling characterization of highly                    pressure23,25–27. The identification of potential ligand binding
radiation-sensitive objects7–9. However, the undisputed benefits               pockets in protein structures is often an important step in rational
of XFELs for structural biology are tied to unique experimental               drug design, with the size and shape of cavities determining
challenges: upon forming a diffraction image, the XFEL pulse                  putative binding site volumes28. XFELs have been advocated to
annihilates its target, a process dubbed “diffraction before                  accelerate structure-based drug discovery29. Clearly, XFEL shock-
destruction”10. XFEL diffraction data must hence be collected                 induced structural changes may complicate this task and thwart
serially (serial femtosecond crystallography, or SFX) for which               valid structural interpretation.
rates of sample replenishment, detector readout and X-ray pulse                  The first SFX experiments at EuXFEL demonstrated that SFX
arrival must be compatible. The first generation of non-                       data collection is possible at 1.1 MHz repetition rate. Specifically,
superconducting XFELs delivers X-ray pulses at 10–120 Hz.                     no significant differences were observed for diffraction data col-
Proven techniques of sample replenishment at these rates include              lected using the first X-ray pulse in a pulse train compared to that
delivery in either low11 or high12,13 viscosity free-stream micro-            of subsequent pulses19,20,30. These experiments were conducted
jets, and presentation of sample via rapidly translatable fixed                during the early stages of accelerator operation; the EuXFEL
mounts14–16. Low (aqueous)-viscosity microjets are typically only             design specification of 4.5 MHz repetition rate17 was not avail-
a few microns in diameter and consequently they generate very                 able. Thus it has not yet been established whether diffraction data
little X-ray background scattering. This is highly advantageous,              collected at 4.5 MHz is unaffected by shockwaves.
but the small jet diameter is inexorably tied to high jet speed. At              Here, we describe a time-resolved X-ray pump X-ray
first-generation XFEL pulse rates (120 Hz and below), most of the              probe SFX experiment, performed at the Linac Coherent Light
sample (>99%) in such jets flows past the scattering point in                  Source (LCLS) in Menlo Park, USA, to test the effect of a
between XFEL pulses, unprobed and therefore wasted. At MHz                    shockwave launched bythe first (pump) X-ray pulse on micro-
pulse rates, in contrast, the jet displacement between XFEL pulses            crystals further upstream in a liquid microjet, as probed by the
just suffices to flush the damaged jet section downstream. Little or            second (probe) X-ray pulse at the upstream point after a 122.5 ns
no sample is wasted. For this reason, but also to satisfy increasing          delay. In addition to collecting X-ray pump X-ray probe SFX data
demands on XFEL beam time, high-repetition rate XFELs have                    of haemoglobin microcrystals, we also collected diffraction data
been awaited eagerly.                                                         using a single pulse, in which case shockwave damage is neces-
    The European XFEL (EuXFEL) in Germany is the first XFEL to                 sarily precluded. We compare the quality of the diffraction data,
operate at MHz repetition rates17. Designed to provide up to                  as well as the crystal structures determined using the single-pulse
27,000 pulses per second (delivered in ten pulse trains per second            and pump–probe data, respectively. Our findings have implica-
at a 4.5 MHz repetition rate within each train), this increases the           tions for the anticipated 4.5 MHz repetition rate of EuXFEL.
number of pulses per second by a factor of 225 or more compared
to previous XFELs. To exploit this increase, rapid sample delivery
is essential and exactly this is provided by low viscosity, small             Results and discussion
diameter, high-speed liquid microjets18–21 as produced by a gas               Experimental design. The design repetition rate of EuXFEL is
dynamic virtual nozzle (GDVN)11. However, the intense XFEL                    4.5 MHz within each pulse train, corresponding to a pulse-to-
pulse that makes SFX possible also isochorically raises the energy            pulse separation of 222 ns (ref. 17). Temporal XFEL pulse
density abruptly and enormously within a microscopic portion of               separations of this magnitude are available at the LCLS using a
the jet. As shown in a publication by Stan et al.22, this leads to            “two-bunch” mode to produce closely spaced pulse pairs, in
complete vaporization of a jet segment at the point of irradiation.           which two pulses can be separated from 0.35 ns up to hundreds of
Shockwaves are launched, propagating supersonically along the                 nanoseconds31. These pulse pairs are delivered at the usual 120
jet stream and outrunning the explosive gap that opens up behind              Hz repetition rate of the LCLS. In addition, the pulses can be
them. Associated with the shock front is a nanosecond-duration                offset spatially along a sample-carrying liquid microjet. Pulse-pair
pressure jump of roughly 0.1–1 GPa (1–10 kbar), which suffices to              operation comes at the cost of higher instability in XFEL photon
induce protein unfolding23. Moreover, the upstream shock                      and pulse energies, but is ideally suited to explore whether one
necessarily intercepts sample being carried downstream towards                XFEL pulse can influence the diffraction quality or observed
the XFEL scattering point. Accordingly, there are two critical                structure of protein microcrystals, as subsequently probed by a
issues for MHz data collection using liquid jets: (i) the formation           following pulse. The pulse-pair spacing and offset can be set to
of the jet gap precludes subsequent XFEL measurements until a                 directly emulate the anticipated 4.5 MHz operation of EuXFEL.
contiguous jet has been re-established at the interaction point.                 We performed an X-ray pump/X-ray probe experiment (LR76
Since the gap is finite in extent and eventually flushes down-                  February 2018) at the LCLS in the microfocus chamber of the
stream at the jet speed, the jet will always heal in time for the             coherent X-ray imaging (CXI) end station32. Using GDVN
next exposure if the jet is fast enough. (ii) The shock wave pro-             injection, haemoglobin microcrystals were directed into the X-ray
pagating upstream along the jet may damage or change24 the                    interaction region within a liquid microjet (diameter ~5 μm,
sample species carried by the jet (microcrystals in case of SFX;              speed ~50 m s−1). The jet was first exposed to the pump pulse
molecules in case of small-angle X-ray scattering (SAXS) or                   and then, after a chosen time delay Δt, to the probe pulse. To
spectroscopy). The spatiotemporal extent of these processes                   ensure that the probe pulse fully avoided the explosive gap
and the severity of the damage they induce in samples can                     induced by the pump pulse, the probe beam was vertically dis-
limit the maximum rate at which unblemished serial XFEL data                  placed Δx = 5 μm upstream along the jet axis (towards the
can be collected. Understanding of these issues is critical                   GDVN nozzle; Fig. 1). Since a microcrystal-carrying liquid jet can
for establishing the maximally usable repetition rates at MHz                 alter its position and shape significantly even on 100 ns
rate XFELs.                                                                   timescales, it was important to experimentally monitor and

2                 NATURE COMMUNICATIONS | (2021)12:1672 | https://doi.org/10.1038/s41467-021-21819-8 | www.nature.com/naturecommunications
NATURE COMMUNICATIONS | https://doi.org/10.1038/s41467-021-21819-8 ARTICLE
a b
1000
800
Probe 600
Δt
400
Pump
200
shock
wave
0
0 200 400 600 800 1000
Jet flow Filter Detector
Fig. 1 Experimental setup. a Haemoglobin microcrystals were injected into the XFEL beam using a gas dynamic virtual nozzle injector11. The first ~30 fs
X-ray pulse (photon energy above the iron K-edge (7.112 keV) and a pulse energy of up to ~0.1 mJ, average value 0.03 mJ) was used as a pump,
isochorically heating the jet and launching a shockwave (depicted in grey) that propagates upstream and downstream of the interaction region. The shock
wave propagates at supersonic speeds and outruns the explosive gap formed in the jet. The scattered X-rays were absorbed by a thin iron filter and did not
reach the detector. After 122.5 ns a sample segment upstream of the pump pulse was hit by a second ~30 fs X-ray pulse (photon energy just below the iron
K-edge and a pulse energy of ~0.9 mJ), which was displaced by ~5 µm towards the nozzle. In this case, the scattered X-rays passed through the iron filter,
reaching the detector. The setup differs from previous two-colour X-ray pump/X-ray probe experiments33,34 due to the displacement of the pump pulse.
b Femtosecond snapshot image of the jet a few nanoseconds after the probe pulse had interacted with the jet. Explosions induced by the pump (orange
arrow) and probe (blue arrow) pulse are clearly visible. Although present in the jet, the shockwaves are not visible in the camera images. In jets this small,
the optical path difference induced by shock compression does not suffice to observe the shock. A movie showing consecutive pump–probe pairs hitting
the jet is available as Supplementary Movie 1. The jet instabilities (wiggling) are ascribed to the presence of crystals in the jet. These instabilities are largely
absent in homogeneous (crystal-free) jets and become more pronounced with increasing crystal concentration.
exclude such instances. We therefore characterized the liquid jet Effect of the X-ray pump pulse on haemoglobin SFX data. We
shortly after interaction with the probe pulse by use of acquired 342,609 and 138,453 detector images for the
femtosecond snapshot imaging to identify those shots, in which pump–probe and single-pulse setups, from which we identified
(i) the pump pulse hit the jet and (ii) the jet shape was such as to 43,003 and 25,742 crystal hits (defined as ≥10 diffraction spots/
support shockwave propagation upstream to the probe position image), respectively. Thus, the average hit rate dropped from 19%
(Supplementary Methods, and Supplementary Figs. 1 and 2). in the single-pulse reference data set to 13% in the pump–probe
Only these diffraction images were then used for subsequent data data set (Fig. 2a). Since the hit rate was calculated prior to the
reduction and analysis. To separate the diffraction patterns of the filtering analysis, it includes hits in which jet shape does not
pump and probe X-ray pulses, their photon energies were set support shock wave propagation. A valid concern is therefore that
respectively to ~40 eV above and below the iron K-absorption the drop in hit rate might be caused by poor beam-jet alignment,
edge (~7.11 keV). A thin iron foil placed in front of the CSPAD either by shooting into the jet gap or by otherwise missing the jet.
detector then transmitted the probe pulse, but blocked the pump However, the experiment was designed to observe two distinct
pulse33,34 (Fig. 1). The pulse energy of the combined pump and gaps (Fig. 1 and Supplementary Movie 1), which generally rules
probe pulses (each ~ 30 fs long) was ~0.9 mJ at the XFEL source. out making gaps that are too large (see also ref. 36). Nevertheless,
To emulate EuXFEL operation at 4.5 MHz, the spatial offset of explosions of irregularly shaped jets are more complicated and
our probe beam from the pump beam must be taken into account cannot be predicted based on what we know about XFEL
in choosing the delay time Δt. Since a shockwave-induced explosions. Thus, it cannot be excluded that the decrease in
pressure jump decays as a function of distance travelled35, the crystal hit rate at higher pump pulse energies is not solely due to a
germane quantity is the distance a GDVN jet travels between 4.5 decrease in crystal quality, an additional factor may be the
MHz pulses, which depends on the jet speed. Assuming that jets increasing jet disruption. While it is possible that the X-ray flu-
of at least 50 m s−1 are needed to flush the explosive gap at 4.5 ence differs between the two data collection modes, the pointing
MHz operation, the required time delay is 122.5 ns. With this jet did not (Supplementary Fig. 3). The difference in hit rates sug-
speed and delay, our 5 μm offset pump/probe measurements gests that 6% of the crystals in the pump–probe data were
correspond to 4.5 MHz EuXFEL operation with a 50 m s−1 jet damaged to such an extent that their diffraction patterns no
probed by the non-offset EuXFEL beam (Supplementary Note 1). longer qualified as hits (i.e.,ARTICLE NATURE COMMUNICATIONS | https://doi.org/10.1038/s41467-021-21819-8
a b
33 2.7 2.1
0.26
35 5.8
0.22 1.6
15
0.25
0.20 2.9
3.4
0.18 0.24
36 7.0
Indexing rate
0.16 34 1.8
Hit rate
0.23
36
0.14 2.8
71
35 58 0.22
0.12 38
35
36
0.10 0.21 1.4
0.08 20 7.1
0.20
98 96 94 92 90 88 86 84 82 80 98 96 94 92 90 88 86 84 82 80
Run Run
Fig. 2 Hit and indexing rates in pump–probe and probe-only runs. a Hit rate as a function of run number for single-pulse (circles) and pump–probe
(crosses) runs. The hit rate was calculated as the number of hits divided by the number of shots comprising a run. The average value of the hit rate is 13%
in the pump–probe data set and 19% in the single-pulse data set. All hits prior to filtering were taken into account (43,003 hits for the pump–probe and
25,742 hits for the single-pulse data set). The number above each data point indicates the number (in thousands) of X-ray shots per run. b Indexing rate as
a function of run number for single-pulse (circles) and pump–probe (crosses) runs. The indexing rate was calculated as the number of indexed hits divided
by the total number of hits in a run. The average indexing rate was 24% in the pump–probe data set and 23% in the probe-only data set, leading to 3531
and 5541 indexed images in the pump–probe and single-pulse data set, respectively. Only hits satisfying the diode signal and jet image filtering conditions
(see “Methods” section) were taken into account. The number above each data point indicates the number (in thousands) of indexed hits per run. For two
runs (run 80 and 85), the jet imaging time delay varied and the jet images could thus not be analysed as to whether a shock wave had been launched that
could successfully propagate to the jet segment to be probed. Therefore, all hits from these runs were excluded from the analysis and the post-filtering
indexing rate is not defined.
respectively (Fig. 2b). Determination of the unit cell constants for We do observe an enhanced degradation in data quality,
the pump–probe data was complicated by the fact that only the specifically a decrease in resolution, as a function of pump
average photon energy of each pulse pair could be measured (see pulse energy (Fig. 3). However, the energies of pump and probe
Supplementary Note 2). We therefore adopted the most pulses are strongly anti-correlated, resulting in a decrease of
conservative assumption, namely that the unit cell lengths were probe pulse energy (causing lower resolution due to lower signal-
not affected by the pump pulse, and used the same unit cell to-noise ratios) with increasing pump pulse energy (lower
dimensions for the single-pulse and pump–probe data. Observed resolution due to damage). To draw an unambiguous conclusion,
structural changes are then solely due to differences in the this effect must be disentangled from the damage effect. Due to
diffraction intensity modulations and not to modified sampling of the scarcity of data at high pump pulse energies, the effect of
reciprocal space. increasing pump pulse energy on diffraction resolution hence
The high-resolution limit of strong Bragg spots (signal-to-noise remains inconclusive (Supplementary Note 4 and Supplementary
ratio I/σ(I) ≥ 4) of our haemoglobin pump–probe data dropped Fig. 12). However, related X-ray pump/X-ray probe experiments
on average by ~0.3 Å compared to the single-pulse data (Fig. 3a). using lysozyme microcrystals showed a clear increase of the
This resolution drop on individual images is consistent across crystal degradation with higher pump pulse energy36.
comparable probe pulse energies (Fig. 3b), and thus not caused by
the slightly different probe pulse energy distributions (Supple-
Effect of the X-ray pump pulse on the haemoglobin structure.
mentary Figs. 4 and 5). Consistent with the decrease in resolution
The damaging effect of a pump-pulse-induced shockwave, as
in the individual images, the integrated diffraction intensities also
indicated by reduced diffraction quality of our haemoglobin
show a clear drop in data quality metrics vs. resolution (Rsplit, I/σ
microcrystals, is consistent with a stochastic rearrangement of the
(I), CC1/2), and consequently a reduction in the overall resolution
crystallized molecules or unit cells affecting the order of
of the data set (Table 1 and Supplementary Fig. 6). These results
the crystalline lattice. In addition, however, the shock wave may
imply a significant degradation in diffraction from haemoglobin
change the protein structure and this we also analyzed. Because
microcrystals in the pump–probe data set. Since radiation
the number of our diffraction images and the resolution of our
damage inflicted by the pump pulse can be excluded as an
data is limited (see Table 1) and because the magnitude of the
underlying cause (see Supplementary Note 3, Supplementary
structural changes are likely small, we employed a “boot-
Figs. 7–11 and Supplementary Software 1), degradation due to the
strap” resampling procedure to ensure that the observed struc-
shock wave is the most likely explanation. The magnitude of the
tural differences are statistically robust (see “Methods” section
shock wave depends on pump pulse energy and so we would
and ref. 4 for a relevance of the structural differences). Hae-
expect to observe increased damage at higher pump pulse energy.
moglobin consists of two α- and two β-subunits, each containing
4 NATURE COMMUNICATIONS | (2021)12:1672 | https://doi.org/10.1038/s41467-021-21819-8 | www.nature.com/naturecommunicationsNATURE COMMUNICATIONS | https://doi.org/10.1038/s41467-021-21819-8 ARTICLE
a b
3.5
0.7 710 pp
Normalized occurrence
3.4 sp
0.6 1985
3.3 746
85
Resolution [Å]
0.5 3.2 5
0.4 3.1 1018 2091
0.3 1435 690
3.0 262
0.2 2.9
0.1 2.8
0.0
2.0 2.5 3.0 3.5 4.0 4.5 5.0 5.5 0 1 2 3 4 5 6 7
Resolution [Å] Probe pulse energy [a.u.]
Fig. 3 Resolution of the single-pulse and pump–probe SFX data. a Normalized histogram of the resolution of all indexed hits of the pump–probe (orange)
and single-pulse reference (blue) data set. The median resolution of all indexed hits is 3.3 Å in the pump–probe case and 3.0 Å for the single-pulse
reference data. b Diffraction resolution of the pump–probe (orange) and the single-pulse (blue) data set as a function of probe pulse energy. Indexed
haemoglobin diffraction patterns were binned according to the probe pulse energy measured by the X-ray sensitive photo diode masked with an Fe foil of
same thickness as the Fe filter in front of the CSPAD detector. The median resolution of all indexed diffraction images contained in one probe pulse energy
bin is plotted. The error bars correspond to the error of the mean per bin. The number next to each data point indicates the number of indexed diffraction
patterns within a given bin. For all probe pulse energies, the resolution of the pump–probe data is consistently lower than the resolution of the single-pulse
reference data, indicating that the observed effect is not caused by a difference in changing probe pulse energy conditions between the two data sets
(Supplementary Fig. 4). Equalization of probe pulse energy distributions (Supplementary Methods) between the two data sets leads to the same
conclusion (Supplementary Fig. 5). The resolution limit (a, b) corresponds to the highest resolution value of an indexed diffraction peak with a signal-to-
noise ratio of I/σ(I) ≥ 4.
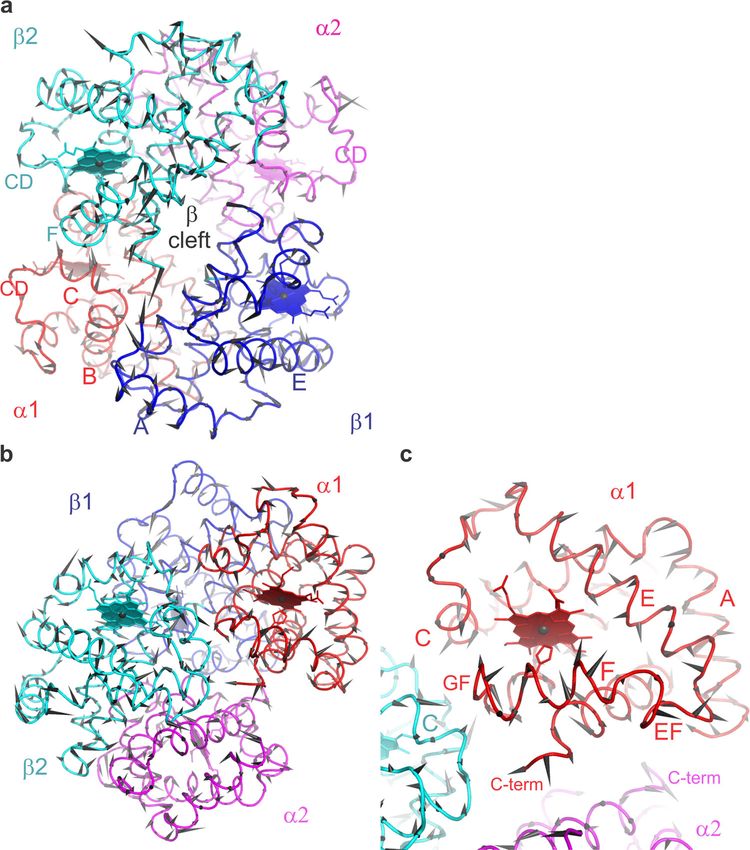
a covalently bound haem cofactor, arranged as a dimer of α/β meaningful analysis (Supplementary Movie 5), in particular in
dimers. The four alpha-helical subunits (α1β1α2β2) enclose a large view of the larger positional uncertainty of side chain compared
central water-filled channel that affords leeway to accommodate to main chain atoms. The solvent accessible (Richards’) volume of
the large changes in the quaternary structure between the liganded the central channel does not seem to change significantly
R-state and unliganded T-state haemoglobin37. When overlaying (Supplementary Movie 5). Spectroscopic studies on carbonmo-
the structures derived from the single-pulse and pump–probe noxy myoglobin have shown a shock-induced redshift of the
data, respectively, small but significant differences in the peptide Soret band followed by an extended blue edge24. The resolution of
backbone become apparent (Fig. 4 and Supplementary Movies 2– the Hb.CO pump–probe data is not high enough to allow the
4). Importantly, many of the changes are correlated along helices detailed analysis of the haem coordination.
and connecting loops, with several amino acid residues being In conclusion, we observe small but significant differences in
displaced in a similar direction. This may explain an increase in the structures as determined from the single-pulse and the
the fraction of residues involved in turns in structures derived pump–probe data sets. Confidence in these observations is
from the pump/probe data, as opposed to single-pulse data (see heightened by the fact that the effective error bars on the observed
Supplementary Table 1). Correlated structural displacements correlated structural changes are much smaller than those for
include, for example, a movement of the E- (α1) and F helices (β1) individual atoms (see also the “Methods” section on “Data
towards the haem; a compressive movement of the end of the E processing and structure solution”, as well as ref. 4). Our
helix, the EF corner and the beginning of the F helix; of the AB conservative approach of fixing the unit cell constants likely
corner (region between the A- and B helices) towards the E helix underestimates the structural changes.
(β1); and of the CD corner (α1) towards the EF corner (β2) (Fig. 4
and Supplementary Movies 2–4). Analysis of the changes in
Implications for data collection at the EuXFEL. Our X-ray
pairwise distances between all Cα atoms4,38 with respect to the
pump/X-ray probe experiments show that shockwaves generated
single-pulse data not only implies a collective movement of the
by femtosecond X-ray pulses focused to micron-sized focal spots
helices and the loop regions, but also a compaction of the mole-
induce significant changes on protein crystals transported in a
cule (Fig. 5 and Supplementary Fig. 13a). This is also reflected in
micron-sized liquid jet, affecting the order of the crystal lattice, as
small but significant changes in the radius of gyration (Supple-
well as the protein structure. In contrast, previous studies per-
mentary Fig. 13b).
formed at EuXFEL at 1.1 MHz repetition rate observed no such
Collective structural changes can be both isotropic (compres-
signs of shock-induced damage in SFX experiments19,20,30,47,48.
sive) and anisotropic (conformational)39. In general the com-
The critically different experimental characteristics of those pre-
pressibility of proteins is small40,41, but a compaction of cavities
vious measurements are longer effective time delays (~220 ns in
has been reported for several proteins in static high-pressure
our case vs. ~910 ns at 1.1 MHz (refs. 19,20,30)); higher photon and
experiments42–44. It is thus interesting to analyse whether or not
pulse energies and a higher jet speed (up to 100 m s−1) in some
shock exposure affects the central channel and cavity volumes in
instances20,30. As an overall result of these differences, the sample
Hb.CO45,46. However, extracting channel and cavity volumes is
probed in the 1.1 MHz measurements was subjected to sig-
not straightforward, in particular for large macromolecular
nificantly lower pressure pulses. The lack of shock damage
complexes: small changes of side chain conformations can result
observation for the 1.1 MHz experiments19,20,30,47,48 can be
in significant differences in cavity volumes. This is the case for
explained by the rapid attenuation of the shock as it travels along
some of the cavities in our Hb.CO structures, preventing
the jet. Compared to our experiment, much lower shock-induced
NATURE COMMUNICATIONS | (2021)12:1672 | https://doi.org/10.1038/s41467-021-21819-8 | www.nature.com/naturecommunications 5ARTICLE NATURE COMMUNICATIONS | https://doi.org/10.1038/s41467-021-21819-8
Table 1 Data and refinement statistics calculated for probe-only and pump–probe data.
Analysis approach Same resolution limits imposed Automatically determined high-resolution limits
Data set Single-pulse pump–probe Single-pulse (all) Single-pulse pump–probe Single-pulse (all)
# diffraction images used 3500 3500 5500 3500 3500 5500
Space group P212121 P212121 P212121 P212121 P212121 P212121
Cell dimensions (Å, °) 55.7 158.1 67.7 55.4 157.8 67.4 55.7 158.1 67.7 55.7 158.1 67.7 55.4 157.8 67.4 55.7 158.1 67.7
90.0 90.0 90.0 90.0 90.0 90.0 90.0 90.0 90.0 90.0 90.0 90.0 90.0 90.0 90.0 90.0 90.0 90.0
# indexed 3500 3500 5500 3500 3500 5500
Resolution (Å) 27.85–2.50 27.42–2.50 28.48–2.50 28.48–2.53 27.42–2.77 28.48–2.54
(2.57–2.50) (2.57–2.50) (2.57–2.50) (2.60–2.53) (2.77–2.84) (2.61–2.54)
I/σ(I) 2.1 (1.0) 2.0 (0.5) 2.4 (1.2) 2.1 (1.0) 2.5 (1.0) 2.4 (1.2)
Rsplit (%) 48.3 (105.7) 40.1 (235.3) 40.0 (91.4) 48.1 (100.3) 36.9 (115.7) 39.7 (89.6)
CC1/2 0.705 (0.172) 0.857 (0.107) 0.8 (0.294) 0.702 (0.233) 0.851 (0.307) 0.798 (0.317)
CC* 0.909 (0.542) 0.961 (0.44) 0.943 (0.674) 0.908 (0.615) 0.959 (0.686) 0.942 (0.694)
Completeness (%) 99.9 (99.7) 99.8 (99.7) 100.0 (99.9) 99.9 (100.0) 99.8 (99.7) 100.0 (100.0)
Multiplicity 18.2 (12.4) 16.4 (11.0) 28.1 (19.1) 18.4 (12.3) 18.3 (11.8) 28.6 (18.9)
Wilson B (Å2) 47.4 59.0 48.3 48.2 61.2 49.2
Refinement
Unit cell parameters: a b c, α β γ (Å,°) 55.7 158.1 67.7, 90.0 90.0 90.0
Images used 3500 3500 5500
Resolution (Å) 28.48–2.53 27.42–2.77 28.48–2.54
No. reflections 19541 14810 19339
Rwork/Rfree 0.22757/ 0.18841/0.27316 0.20701/0.27266
0.28826
No. atoms
Protein 4332 4332 4332
Ligands 172 (4 haems) 172 (4 haems) 172 (4 haems)
8 (4 COs) 8 (4 COs) 8 (4 COs)
Water 38 38 38
B-factors (Å2)
Chain A (haem A) 42.1 (35.7) 52.4 (47.1) 41.3 (35.5)
Chain B (haem B) 46.4 (41.6) 57.8 (53.2) 46.3 (42.4)
Chain C (haem C) 50.3 (40.9) 59.9 (53.4) 49.5 (40.4)
Chain D (haem D) 56.1 (45.5) 68.5 (57.4) 55.5 (45.2)
Water 41.4 49.6 42.7
R.m.s deviations
Bond lengths (Å) 0.007 0.008 0.007
Bond angles (°) 1.490 1.608 1.549
Percentage of residues in Ramachandran plot region
Preferred 95.4 93.8 94.6
Allowed 4.1 5.5 4.7
Disallowed 0.5 0.7 0.7
PDB code 7AET 7AEV 7AEU
Values are given for either applying the same or automatically determined resolution limits, respectively, for the probe-only and pump/probe data. The first/fourth columns show the statistics of the
probe data, the second/fifth for the pump/probe data using the same number of images and the third/six column the statistics of the single-pulse data, using all images available. All diffraction images
that passed the filtering set were included in this analysis, irrespective of the probe pulse energy. For the automatic resolution determination, each data set was divided into 20 resolution bins, and I/σ(I)
was calculated for each bin. The resolution of the bin where this value was still >1.0 was taken as the high-resolution limit.
pressures are therefore expected for the longer distances of dataNATURE COMMUNICATIONS | https://doi.org/10.1038/s41467-021-21819-8 ARTICLE Fig. 4 Structural comparison of the single-pulse and pump–probe Hb.CO structures. The displacement between respective Cα positions is indicated by black arrows. The magnitude of the displacement is illustrated by the length of the arrows (multiplied by a factor of 10). a, b Different orientations of the haemoglobin tetramer. The fact that clusters of arrows point in similar directions shows that the displacements are correlated both within and between secondary structure elements. To ease visualization of the displacements, Supplementary Movie 4 shows a morph between the two structures. The proximal histidines are shown as sticks. c A magnified view of the α1 subunit (similar orientation as in b). Correlated displacements of the F helix towards the haem are clearly visible. a, b, c The alpha subunits are shown in red and magenta, beta subunits in blue and cyan. Helices are labelled by capital letters (A, B, C…), loops between helices by the two letters corresponding to the respective helices (e.g., EF loop region connecting the E and F helices); haem planes are depicted as filled planes. will likely be required for collecting undamaged data at 4.5 MHz On XFEL-induced shock effects. As detrimental as shockwaves repetition rate. may be for collecting structurally valid native data, X-ray XFEL-induced shockwaves may be relevant not just to triggered shocks could also open a novel experimental crystalline samples, but also to XFEL scattering from solutions regime for nanosecond time-resolved studies of, for example, of proteins or other molecules49. While SFX experiments are pressure-induced phase transitions in liquids; pressure-induced typically conducted in thin microjets (diameter 3–5 μm), most protein unfolding; and pressure-induced pH jumps to trigger spectroscopy experiments50–52 employ large diameter Rayleigh chemical reactions on rapid timescales. A sub-microsecond (0.7 jets (~30–100 μm) as do also many SAXS and wide-angle solution μs) pressure jump instrument, described a few years ago53, scattering experiments50. Again unknown balances remain to be achieved pressure jumps of 0.25 GPa (2.5 kbar). The first investigated: larger jets are generally slower, likely requiring experiments with this instrument showed refolding times of 2.1 μs EuXFEL operation at
ARTICLE                                                                     NATURE COMMUNICATIONS | https://doi.org/10.1038/s41467-021-21819-8

Fig. 5 Distance matrices showing the relative displacement of Cα–Cα pairs when comparing structures determined using the single-pulse data and the
pump–probe data. Red indicates an increase of the distance, blue a decrease. The blue features dominate in the plot of the haemoglobin tetramer (a), as
well as in the plots of the α1 (HbA) and β1 (HbB) subunits (b) indicating a clear compaction of the structure (see Supplementary Fig. 13). In contrast the α2
(HbC) and β2 (HbD) subunits slightly expand (b). Compaction and expansion are also clearly apparent from the sum of the relative changes. Correlated
movements of secondary structure elements can be observed in the plots as extended streaks of blue or red colour (e.g., parts of the α1-A helix move
closer to the core of the α1 subunit, similarly part of the β1 EF loop and the F helix move closer to the β1core, etc.).

important regime, the nanosecond timescale has remained largely                 crystal damage in MHz XFEL experiments (and thus the
unexplored, limiting our understanding of the fast initial steps in             suitable XFEL repetition rate) involves a number of as yet
folding or unfolding. This experimental gap might conceivably be                unknown factors, including (i) the sensitivity of a particular
closed by X-ray pump/X-ray probe experiments, as described                      sample to shock damage, (ii) the reversibility of the shock
herein.                                                                         damage (in repetitive measurements, recovery must occur before
   In conclusion, we here describe the first experimental                        a following measurement can be made) and (iii) the
evidence for shockwave-induced sample degradation and con-                      additivity of shock damage (whether crystals survive a single
comitant protein structural changes in MHz SFX experiments.                     shock, yet deteriorate under repeated shocks). Ultimately, these
More experiments and simulations must be performed to                           properties and parameters of shock-induced damage will
understand the underlying dynamics of shockwave interaction                     determine the maximum repetition rate for data collection of
with material transported in the jet. The degree of shock-induced               native samples at MHz XFELs (see also Supplementary Note 6

8                   NATURE COMMUNICATIONS | (2021)12:1672 | https://doi.org/10.1038/s41467-021-21819-8 | www.nature.com/naturecommunications
NATURE COMMUNICATIONS | https://doi.org/10.1038/s41467-021-21819-8                                                                                         ARTICLE

and ref. 36). Although it is difficult to extrapolate the structural                      which the pump pulse signal was smaller than the mean pump pulse signal of all
changes observed in haemoglobin microcrystals to other samples,                          shots plus ~1.5 times its standard deviation did not exhibit any visible pump pulse
                                                                                         signal and were used for analysis.
shock-induced damage at 4.5 MHx XFEL operation will likely be                                Images of the jet, recorded a few nanoseconds after impact of the probe pulse
a matter of concern in other systems.                                                    onto the jet, were analyzed for each pump–probe shot to determine if the pump
                                                                                         pulse launched a shock wave affecting sample interrogated by the X-ray probe
                                                                                         pulse. For this purpose, a custom-written python script analyzed jet shape,
Methods                                                                                  determining location and size of gaps in the jet, as well as the size of the jet
Crystallization and injection. Hb.CO was crystallized as follows15: human oxy
                                                                                         projected onto the horizontal plane. The latter indicates whether the angle of the jet
haemoglobin A (Hb.O2) was purified from expired units of human blood (type A)
                                                                                         to the X-ray beam axis has changed or whether the jet had a different diameter
as described56,57, and then converted to the carbonmonoxy complex. To this end, a
                                                                                         (which impacts the magnitude and the decay of shockwaves). The location and size
three-neck flask was equipped with a magnetic stirring bar, two gas inlets with stop
                                                                                         of gaps in the jet help reveal if the pump pulse interacted with the jet, and whether
cocks and a rubber stopper, and charged with the HbO2 solution. Upon repeated
                                                                                         it launched a shock wave that could propagate to the jet region probed by the
cycles of evacuation (5–10 min) and flushing with CO using a Schlenk line, the
                                                                                         second X-ray pulse. Even if the pump pulse hit the jet, the desired propagation of
tomato red protein solution turned raspberry red. Neither sodium dithionite nor
                                                                                         the shock wave through the jet is precluded if the pump pulse strikes downstream
toluene was added. Long rod-shaped Hb.CO crystals grew in a CO saturated
                                                                                         of the jet break-up point. This situation can be identified based on the location of
atmosphere at room temperature within a few days upon mixing solutions of Hb.
                                                                                         gaps in the jet. For shock analysis, only those indexed hits were used that do not
CO (~2 mM in water) and precipitant (3.2 M NaH2PO4/3.2 M K2HPO4 in a 2:1
                                                                                         show any abnormal jet morphology (projected jet size within one standard
ratio) in a ratio of 1:2.5. Crystals were milled by filtration through a tandem array
                                                                                         deviation of the median projected size within a given run), in which one or two
of 100–20–10 μm stainless steel filters, resulting in microcrystals of ~5 × 5 × 10 μm.
                                                                                         gaps due to pump or pump and probe pulse are clearly visible (a gap due to the
The Hb.CO microcrystalline slurry (~15% (v/v) settled crystalline material) was
                                                                                         probe pulse does not necessarily need to exist as long as the probe pulse leads to an
injected by means of a GDVN at ~50 ± 5 m s−1 producing 4–5 μm diameter jets.
                                                                                         indexable diffraction pattern recorded by the detector) and in which the jet is fully
                                                                                         continuous upstream of the pumped segment (thus allowing propagation of the
Jet imaging and speed determination. The liquid jet was imaged from an off-axis          shock wave upstream). A more detailed protocol of this filtering procedure is
perspective (orthogonal to both X-rays and jet flow direction) using a 50× infinity        described in the Supplementary Methods. The same filtering effect (ensuring that a
corrected objective (SL Plan Apo, Mitutoyo) in combination with a 200 mm tube            shock wave had been launched by the pump pulse) as obtained by filtering on the
lens and a camera (Opal 1000, Adimec). The magnification of the image was 0.11            jet images can be achieved by filtering based on the detector images, if these are
μm pix−1, and the optical resolution was measured with a resolution target               saved by a fast detector for all pump and probe pulses like for example at
(Extreme USAF resolution target, Ready Optics) to be better than 700 nm. To              EuXFEL48.
obtain sharp images without motion blur, frequency-doubled light pulses (400 nm)
from the femtosecond laser system at CXI32 were employed to illuminate the jet.
Laser and camera were triggered to record images of the jet at chosen time delays        Data processing and structure solution. Online data analysis was performed
relative to the X-ray pulses. For all data contained in this analysis, images were       with CASS59. A diffraction pattern was considered a hit if it contained ≥10 peaks.
taken within a few nanoseconds after the second X-ray pulse, thus imaging the            To evaluate the resolution of single diffraction images at a given signal-to-noise
effect of the first two pulses on the jet.                                                threshold x, custom-written python scripts evaluated the best resolution of all
    Due to their small diameter (~5 μm), the optical path difference induced by the      indexed reflections with I/σ(I) ≥ x. The detector metrology was optimized in two
shock compression is smaller in our jets than in previously imaged jets (14–30 μm        steps: after optimization of the detector panel alignment (see ref. 4) the distance
diameter)22,35 and the shocked region does not deflect the illumination light             between the detector and the XFEL interaction zone was optimized by a parameter
sufficiently to make the shocks visible. Accordingly the shockwaves in our jets           grid search minimizing the root mean square deviation between reflections and
could not directly be imaged reliably.                                                   diffraction peaks, as measured by the geoptimiser tool from the CrystFEL software
    The centre of the XFEL-induced gap in the jet moves downstream with the              suite, version 0.8.0 (refs. 60,61). Diffraction peaks were identified by CrystFEL from
speed of the jet. To track the movement of gaps over time, the centre of the gap y       calibrated detector images that had passed filtering using the gradient search after
was measured at two different imaging time delays t1 and t2. Jet speed is then           Zaefferer, with the following peak detection parameters: --threshold=70 --min-
obtained as the distance between the gap centres at both time delays, divided by the     snr=5 --min-gradient=10000 --tolerance=10,10,10,2 --median-filter=16. Indexing
temporal separation of the two imaging delays: v = (y(t1) − y(t2))/(t1 − t2).            and integration of the filtered diffraction images were performed with CrystFEL
                                                                                         using the xgandalf, dirax and mosflm indexers with the no-cell-combinations
Data collection. The experiment was performed at the CXI instrument at the               option. The indexed data set was merged using process_hkl from the CrystFEL
LCLS. Two pulses separated by 122.5 ns interrogated the liquid jet. The two pulses       software suite without scaling or partiality correction. The Hb.CO pump-only and
were focused to two points vertically separated by 5 μm, with the first (pump) pulse      pump–probe data were phased by molecular replacement with PHASER62 using
intersecting the liquid jet further downstream than the second (probe) pulse             PDB entry 6HAL as the search model15, and refined using alternating cycles of
(Fig. 1). The beam size was ~1.5 × 1.5 μm² (FWHM) for both pulses. The photon            rebuilding in COOT63,64 and refinement in REFMAC5 (ref. 65). For both probe-
energies of the pump and probe X-ray pulse (~0.9 mJ combined pulse energy, pulse         only and pump–probe structures a final round of refinement using identical
duration ~30 fs) were set to ~40 eV above and below the iron K-absorption edge           parameters was performed, to ensure comparability. Moreover, the same (probe-
(~7.11 keV), respectively. A 25 μm thick iron foil in front of the CSPAD detector        only) unit cell parameters were imposed during refinement of all structures because
absorbed the pump but not the probe pulse33,34 (Fig. 1) such that only diffraction       of uncertainties in the probe photon energy during the pump–probe experiment.
patterns generated by the probe pulse were recorded.                                     Data and model statistics are given in Table 1, the quality of the computed electron
    The two-bunch mode exhibits large fluctuations in the pulse energies, and is          density map is shown in Supplementary Fig. 14. The structures were used as
also more susceptible to photon energy drifts than the commonly used SASE                starting models for the refinement of the data using a resampling method to
single-pulse mode58. The LCLS gas detector cannot resolve pulse energies with            estimate the coordinate uncertainties34. In this case, we used bootstrapping, and
nanosecond time resolution. To ensure that the two pulses have the expected              prepared 100 resampled data sets by randomly drawing images with replacement
photon energies and to enable analysis of the data as a function of pump and probe       from the pool of available images for a data set until the same number of images
pulse energies, we used diagnostics based on two fast photodiodes (Hamamatsu             was reached as was available for the original data set. Against these resampled data
MSM, 30 ps response time) picking up X-rays scattered by a Kapton foil. The diode        sets, 100 structures were then refined using REFMAC, starting with rigid body
signal was recorded synchronously with the CSPAD data. One diode was covered             refinement of all four monomers, and finally restrained refinement of all atomic
with a 25 μm Fe foil like the detector. The non-masked diode measured the relative       positions and B-factors. The standard deviation of the ensemble-averaged boot-
pulse energy of each pulse, evaluated as the integrated signal of each pulse.            strapped structures gives the mean error of the coordinates; the structures deter-
Comparison with the signal of the masked diode allowed checking whether the              mined using the original sets of diffraction images (i.e., without resampling) are
pump pulse photon energy was indeed above the Fe K-edge, thus not erroneously            within two sigma from the corresponding averaged positions, i.e., within the 90%
contributing to the measured diffraction signal due to the probe pulse.                  confidence level. These structures were used for the detailed analysis, with the
                                                                                         bootstrapped ensembles yielding the positional errors of the respective coordinates.
                                                                                         The structural differences between the pump-only and pump–probe data were
Data filtering conditions. Prior to further analysis, diffraction data was filtered        visualized using the modevector.py script from Pymol66, as described pre-
with respect to the two diode signals to exclude data in which diode signals were        viously43,67. Channel and cavity volumes were analysed with CastP3.0 (ref. 68) and
affected by electronic noise. To exclude noisy shots, the standard deviation of the      3V46. The magnitude of the observed structural changes between the single-pulse
voltage trace was calculated over a time interval preceding the arrival of pulses, and   and pump–probe structures (both those determined using all images and the
shots were excluded if this was larger than the mean of the standard deviations of       ensemble-averaged ones), respectively, is small (r.m.s.d. 0.11 Å for 552 aligned
noise-less traces plus three times the corresponding standard deviation. For             residues). This is similar to the expected coordinate error given by the average
pump–probe data, the diode signals were also analysed to exclude hits where the          displacement/atom in the ensemble-averaged structures (0.12 Å over 4550 atoms).
pump pulse signal on the masked diode was high, potentially indicating (partial)         However, many of the changes are correlated along secondary structure elements.
leakage of the pump photon energy below the Fe K-edge. To find this threshold, the        This decreases the effective error bars on the observed correlated changes, making
full trace of the diode signal was plotted for different pump pulse signals. Hits in     them much smaller than those for individual atoms (see also ref. 4). It is unlikely

NATURE COMMUNICATIONS | (2021)12:1672 | https://doi.org/10.1038/s41467-021-21819-8 | www.nature.com/naturecommunications                                                     9
ARTICLE NATURE COMMUNICATIONS | https://doi.org/10.1038/s41467-021-21819-8
that the effects observed in our experiments are caused by radiation damage: due to 24. Dlott, D. D. Ultrafast spectroscopy of shock waves in molecular materials.
the vertical displacement of the pump and the probe interaction region on the jet, Annu. Rev. Phys. Chem. 50, 251–278 (1999).
jet segments probed by the second pulse were not illuminated directly by the first 25. Gao, M. et al. On the origin of microtubules’ high-pressure sensitivity.
pulse (see Supplementary Note 3). Biophys. J. 114, 1080–1090 (2018).
26. Kharakoz, D. P. Protein compressibility, dynamics, and pressure. Biophys. J.
Reporting summary. Further information on research design is available in the Nature 79, 511–525 (2000).
Research Reporting Summary linked to this article. 27. Ascone, I. et al. Isothermal compressibility of macromolecular crystals and
macromolecules derived from high-pressure X-ray crystallography. J. Appl.
Cryst. 43, 407–416 (2010).
Data availability 28. Weisel, M., Proschak, E., Kriegl, J. M. & Schneider, G. Form follows function:
Coordinates have been deposited with the PDB 7AET, 7AEU, 7AEV, the indexed images shape analysis of protein cavities for receptor-based drug design. Proteomics 9,
are deposited at CXIDB.org69, ID 143; https://doi.org/10.11577/1616145 . Other data are 451–459 (2009).
available from the authors upon reasonable request. 29. Cheng, R. K. Y., Abela, R. & Hennig, M. X-ray free electron laser:
opportunities for drug discovery. Essays Biochem. 61, 529–542 (2017).
30. Yefanov, O. et al. Evaluation of serial crystallographic structure determination
Code availability
within megahertz pulse trains. Struct. Dyn. 6, 064702 (2019).
Analysis scripts are available from the authors upon request.
31. Decker, F.-J., Bane, K. L. F., Colocho, W. S., Lutman, A. A. & Sheppard, J. C.
Recent Developments and Plans for Two Bunch Operation with up to 1 μs
Received: 13 October 2020; Accepted: 15 February 2021; Separation at LCLS. https://doi.org/10.18429/JACoW-FEL2017-TUP023. in
International Free Electron Laser Conference (eds Bishofberger, K., Carlsten, B.
& Schaa, V. R.) (JACoW, Santa Fe, NM, USA, 2017).
32. Liang, M. N. et al. The coherent X-ray imaging instrument at the linac
coherent light source. J. Synchrotron Radiat. 22, 514–519 (2015).
33. Ferguson, K. R. et al. Transient lattice contraction in the solid-to-plasma
References transition. Sci. Adv. 2, e1500837 (2016).
1. Chapman, H. N. et al. Femtosecond X-ray protein nanocrystallography. 34. Nass, K. et al. Structural dynamics in proteins induced by and probed with X-
Nature 470, 73–77 (2011). ray free-electron laser pulses. Nat. Commun. 11, 1814 (2020).
2. Colletier, J. P. et al. De novo phasing with X-ray laser reveals mosquito 35. Blaj, G. et al. Generation of high-intensity ultrasound through shock
larvicide BinAB structure. Nature 539, 43–47 (2016). propagation in liquid jets. Phys. Rev. Fluids 4, 043401 (2019).
3. Seibert, M. M. et al. Single mimivirus particles intercepted and imaged with an 36. Grünbein, M. L. et al. Observation of shock-induced protein crystal damage
X-ray laser. Nature 470, 78–81 (2011). during megahertz serial femtosecond crystallography. Phys. Rev. Res. 3,
4. Barends, T. R. et al. Direct observation of ultrafast collective motions in CO 013046 (2021).
myoglobin upon ligand dissociation. Science 350, 445–450 (2015). 37. Yuan, Y., Tam, M. F., Simplaceanu, V. & Ho, C. New look at hemoglobin
5. Pande, K. et al. Femtosecond structural dynamics drives the trans/cis allostery. Chem. Rev. 115, 1702–1724 (2015).
isomerization in photoactive yellow protein. Science 352, 725–729 (2016). 38. Seno, Y. & Go, N. Deoxymyoglobin studied by the conformational normal
6. Coquelle, N. et al. Chromophore twisting in the excited state of a mode analysis. I. Dynamics of globin and the heme-globin interaction. J. Mol.
photoswitchable fluorescent protein captured by time-resolved serial Biol. 216, 95–109 (1990).
femtosecond crystallography. Nat. Chem. 10, 31–37 (2018). 39. Urayama, P., Phillips, G. N. Jr. & Gruner, S. M. Probing substates in sperm
7. Kern, J. et al. Simultaneous femtosecond X-ray spectroscopy and diffraction of whale myoglobin using high-pressure crystallography. Structure 10, 51–60
photosystem II at room temperature. Science 340, 491–495 (2013). (2002).
8. Hirata, K. et al. Determination of damage-free crystal structure of an X-ray- 40. Gross, M. & Jaenicke, R. Proteins under pressure. The influence of high
sensitive protein using an XFEL. Nat. Methods 11, 734–736 (2014). hydrostatic pressure on structure, function and assembly of proteins and
9. Suga, M. et al. Native structure of photosystem II at 1.95 A resolution viewed protein complexes. Eur. J. Biochem. 221, 617–630 (1994).
by femtosecond X-ray pulses. Nature 517, 99–103 (2015). 41. Paci, E. & Velikson, B. On the volume of macromolecules. Biopolymers 41,
10. Neutze, R., Wouts, R., van der Spoel, D., Weckert, E. & Hajdu, J. Potential for 785–797 (1997).
biomolecular imaging with femtosecond X-ray pulses. Nature 406, 752–757 42. Nagae, T. et al. High-pressure-induced water penetration into 3-
(2000). isopropylmalate dehydrogenase. Acta Crystallogr. D68, 300–309 (2012).
11. Weierstall, U., Spence, J. C. H. & Doak, R. B. Injector for scattering 43. Yamada, H., Nagae, T. & Watanabe, N. High-pressure protein crystallography
measurements on fully solvated biospecies. Rev. Sci. Instr. 83, 035108 (2012). of hen egg-white lysozyme. Acta Crystallogr. D71, 742–753 (2015).
12. Weierstall, U. et al. Lipidic cubic phase injector facilitates membrane protein 44. Nagae, T., Yamada, H. & Watanabe, N. High-pressure protein crystal
serial femtosecond crystallography. Nat. Commun. 5, 3309 (2014). structure analysis of Escherichia coli dihydrofolate reductase complexed with
13. Botha, S. et al. Room-temperature serial crystallography at synchrotron X-ray folate and NADP(). Acta Crystallogr. D 74, 895–905 (2018).
sources using slowly flowing free-standing high-viscosity microstreams. Acta 45. Binkowski, T. A., Naghibzadeh, S. & Liang, J. CASTp: computed atlas of
Crystallogr. D 71, 387–397 (2015). surface topography of proteins. Nucleic Acids Res. 31, 3352–3355 (2003).
14. Roedig, P. et al. Room-temperature macromolecular crystallography using a 46. Voss, N. R. & Gerstein, M. 3V: cavity, channel and cleft volume calculator and
micro-patterned silicon chip with minimal background scattering. J. Appl. extractor. Nucleic Acids Res. 38, W555–W562 (2010).
Crystallogr. 49, 968–975 (2016). 47. Pandey, S. et al. Time-resolved serial femtosecond crystallography at the
15. Doak, R. B. et al. Crystallography on a chip - without the chip: sheet-on-sheet European XFEL. Nat. Methods 17, 73–78 (2020).
sandwich. Acta Crystallogr. D74, 1000–1007 (2018). 48. Gorel, A. et al. Shock damage analysis in serial femtosecond crystallography
16. Grünbein, M. L. & Kovacs, G. N. Sample delivery for serial crystallography at data collected at MHz X-ray free-electron lasers. Crystals 10, 1145 (2020).
free-electron lasers and synchrotrons. Acta Crystallogr. D75, 178–191 (2019). 49. Cozzi, P. G., Gualandi, A., Mengozzi, L. & Manoni, E. Iron(2+), tris(2,2′‐
17. Decking, W. et al. First operation of a MHz-repetition-rate hard X-ray free- bipyridine‐N,N′)‐, Dibromide, (OC‐6‐11). Encyclopedia of Reagents for
electron laser driven by a superconducting linear accelerator. Nat. Photonics Organic Synthesis (Wiley Online Library, 2016).
14, 391–397 (2020). 50. Khakhulin, D. et al. Ultrafast X-ray photochemistry at European XFEL:
18. Grünbein, M. L., Shoeman, R. L. & Doak, R. B. Velocimetry of fast capabilities of the femtosecond X-ray experiments (FXE) instrument. Appl.
microscopic liquid jets by nanosecond dual-pulse laser illumination for Sci. 10, 995 (2020).
megahertz X-ray free-electron lasers. Opt. Express 26, 7190–7203 (2018). 51. Lemke, H. T. et al. Femtosecond X-ray absorption spectroscopy at a hard X-
19. Grünbein, M. L. et al. Megahertz data collection from protein microcrystals at ray free electron laser: application to spin crossover dynamics. J. Phys. Chem.
an X-ray free-electron laser. Nat. Commun. 9, 3487 (2018). A 117, 735–740 (2013).
20. Wiedorn, M. O. et al. Megahertz serial crystallography. Nat. Commun. 9, 4025 52. Kunnus, K. et al. A setup for resonant inelastic soft x-ray scattering on liquids
(2018). at free electron laser light sources. Rev. Sci. Instrum. 83, 123109 (2012).
21. Wiedorn, M. O. et al. Rapid sample delivery for megahertz serial 53. Dumont, C., Emilsson, T. & Gruebele, M. Reaching the protein folding speed
crystallography at X-ray FELs. IUCrJ 5, 574–584 (2018). limit with large, sub-microsecond pressure jumps. Nat. Methods 6, 515–519
22. Stan, C. A. et al. Liquid explosions induced by X-ray laser pulses. Nat. Phys. (2009).
12, 966–971 (2016). 54. Liu, Y., Prigozhin, M. B., Schulten, K. & Gruebele, M. Observation of complete
23. Roche, J. & Royer, C. A. Lessons from pressure denaturation of proteins. J. R. pressure-jump protein refolding in molecular dynamics simulation and
Soc. Interface 15, 20180244 (2018). experiment. J. Am. Chem. Soc. 136, 4265–4272 (2014).
10 NATURE COMMUNICATIONS | (2021)12:1672 | https://doi.org/10.1038/s41467-021-21819-8 | www.nature.com/naturecommunicationsYou can also read


