Diel patterns in stream nitrate concentration produced by in-stream processes
←
→
Page content transcription
If your browser does not render page correctly, please read the page content below
Biogeosciences, 18, 4705–4715, 2021
https://doi.org/10.5194/bg-18-4705-2021
© Author(s) 2021. This work is distributed under
the Creative Commons Attribution 4.0 License.

Diel patterns in stream nitrate concentration produced
by in-stream processes
Jan Greiwe, Markus Weiler, and Jens Lange
Hydrology, University of Freiburg, Friedrichstraße 39, 79098 Freiburg, Germany

Correspondence: Jan Greiwe (jan.greiwe@hydrology.uni-freiburg.de)

Received: 18 November 2020 – Discussion started: 26 November 2020
Revised: 6 July 2021 – Accepted: 17 July 2021 – Published: 18 August 2021

Abstract. Diel variability in stream NO−   3 concentration rep-      1   Introduction
resents the sum of all processes affecting NO−     3 concentra-
tion along the flow path. Being able to partition diel NO−      3
                                                                     In-stream processing of nutrients can significantly influence
signals into portions related to different biochemical pro-          loads and concentrations transported to receiving ecosystems
cesses would allow calculation of daily rates of such pro-           (Peterson et al., 2001; Roberts and Mulholland, 2007). Nutri-
cesses that would be useful for water quality predictions. In        ents are repeatedly taken up and released again by organisms
this study, we aimed to identify distinct diel patterns in high-     during downstream transport, a concept known as “nutrient
frequency NO−   3 monitoring data and investigated the origin
                                                                     spiraling” (Ensign and Doyle, 2006). Depending on the rates
of these patterns. Monitoring was performed at three loca-           of nutrient uptake and release, in-stream nutrient processing
tions in a 5.1 km long stream reach draining a 430 km2 catch-        may reduce the risk of harmful eutrophication (Birgand et
ment. Monitoring resulted in 355 complete daily recordings           al., 2007). Among the different nutrients, nitrate (NO−  3 ) is of
on which we performed a k-means cluster analysis. We com-            special interest since it usually represents the largest fraction
pared travel time estimates to time lags between monitoring          in dissolved inorganic nitrogen and is today easily detectable
sites to differentiate between in-stream and transport control       using in situ optical spectrometer probes. At the same time,
on diel NO−   3 patterns. We found that travel time failed to
                                                                     water quality management requires knowledge of NO−         3 pro-
explain the observed lags and concluded that in-stream pro-          cessing rates to predict how rapidly NO−    3  inputs are   trans-
cesses prevailed in the creation of diel variability. Results        formed and attenuated. This is particularly relevant in light
from the cluster analysis showed that at least 70 % of all           of a changing climate and a predicted reduction of summer
diel patterns reflected shapes typically associated with pho-        flow (Austin and Strauss, 2011; Mosley, 2015; Hellwig et al.,
toautotrophic NO−   3 assimilation. The remaining patterns sug-
                                                                     2017).
gested that other processes (e.g., nitrification, denitrification,      Similar to other solutes, e.g., dissolved oxygen (DO) or
and heterotrophic assimilation) contributed to the formation         carbon dioxide (CO2 ), NO−    3 concentrations can exhibit diel
of diel NO−  3 patterns. Seasonal trends in diel patterns sug-
                                                                     (i.e., 24 h) patterns. However, the increasing body of high-
gest that the relative importance of the contributing processes      frequency NO−   3 monitoring data from optical in situ probes
varied throughout the year. These findings highlight the po-         shows that such diel patterns are not ubiquitous. Some
tential in high-frequency water quality monitoring data for a        streams consistently exhibit strong diel patterns (Heffernan
better understanding of the seasonality in biochemical pro-          and Cohen, 2010), while others do so only during certain
cesses.                                                              seasons (Rusjan and Mikoš, 2010; Aubert and Breuer, 2016;
                                                                     Schwab, 2017; Rode et al., 2016), and still others do not
                                                                     show diel patterns at all (Duan et al., 2014). Biochemical
                                                                     processes influencing NO−    3 concentration include NO3 de-
                                                                                                                                 −

                                                                     pletion via denitrification (Mulholland et al., 2009) and both
                                                                     autotrophic (Lupon et al., 2016b) and heterotrophic (Middel-
                                                                     burg and Nieuwenhuize, 2000; Luque-Almagro et al., 2011)

Published by Copernicus Publications on behalf of the European Geosciences Union.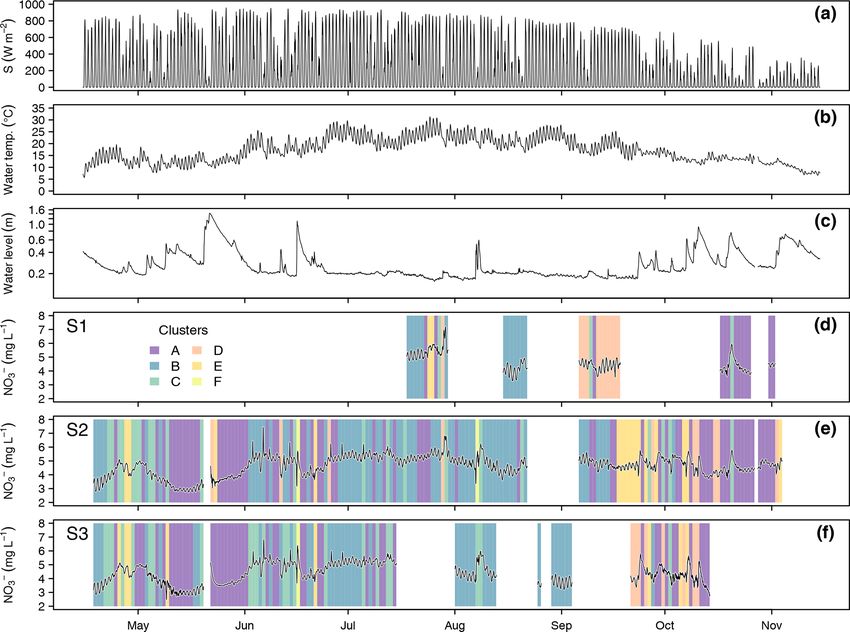
4706                                                                J. Greiwe et al.: Diel patterns in stream nitrate concentration

assimilation, as well as production via mineralization and
subsequent nitrification. Previous studies have suggested that
diel variation in stream NO−  3 concentration is mainly related
to in-stream photoautotrophic uptake (Nimick et al., 2011;
Burns et al., 2019). Due to photosynthetic light requirements,
photoautotrophs take up NO−     3 mostly during the day (Mul-
holland et al., 2006), which causes minimum and maximum
NO− 3 concentrations to typically occur in the late afternoon
and in the early morning (prior to sunrise), respectively.
However, there is evidence that diel variation may not be
influenced by photoautotrophic uptake alone. In many sys-
tems, diel variability has also been found in rates of nitrifica-
tion and denitrification (Laursen and Seitzinger, 2004; Dunn
et al., 2012; Scholefield et al., 2005), e.g., due to changing
oxygen levels in sediments (Christensen et al., 1990).
   In flowing waters, biochemical processes are superposed
by downstream transport. Therefore, the solute signal mea-
sured at a specific location integrates over all conditions and         Figure 1. Location of monitoring points along the stream reach and
events that water parcels were previously exposed to. As a re-          land use in the contributing catchment.
sult, the benthic footprint, i.e., the upstream area influencing
concentrations at the measurement point, depends on flow
velocity and solute turnover rate. While gaseous solutes like           2     Methods
DO may quickly equilibrate with the atmosphere, upstream
discontinuities in non-gaseous solutes like NO−    3 (e.g., trib-       2.1    Study site
utary confluxes, lakes or reservoirs, wastewater inputs from
point sources) may persist further downstream (Hensley and              The studied stream reach is located in the lower course of
Cohen, 2016). In open systems with unknown input sig-                   the river Elz in southwest Germany between the munici-
nals, it is therefore unclear whether diel concentration pat-           palities of Emmendingen and Riegel (Fig. 1). At our study
terns are produced by conditions in the investigated stream             site, the river Elz drains an area of approximately 430 km2
or stem from upstream sources from which they are trans-                of which 66 % is forest and 21 % is grassland. The frac-
ported downstream (Pellerin et al., 2009). We will refer to             tion of cropland is below 2 %. The river contains several
the first case as in-stream control and to the second case as           weirs and receives inflows from a small wastewater treat-
transport control. In this sense, we use the term “in stream” to        ment plant approximately 25 km upstream of the study site.
refer to average properties of a reasonably long stream reach           Yet, most wastewater of the upstream catchment is trans-
and its immediate surroundings including biochemical con-               ferred to a large treatment plant located further downstream.
ditions in the stream and in the hyporheic zone as well as              The monitored stream section spans a distance of 5.1 km and
diffuse groundwater interaction.                                        is divided into two reaches with different morphology. The
   In the present study, we analyze high-frequency NO−    3 data        upper reach (2.7 km) is characterized by a uniform gravel
observed at three monitoring sites delimiting two reaches in            bed, which is straightened and protected against erosion by
the lower course of the river Elz in southwest Germany. We              regularly spaced groundsills. The lower reach (2.4 km) was
aim to investigate (1) whether there are diel patterns in NO−  3        subject to extensive revitalization including flood dam re-
concentration, (2) whether these patterns are subject to in-            location and installation of a near-natural meandering river
stream or transport control, and (3) how they are related to            course. Revitalization measures were completed in 2016 and
environmental conditions and potential drivers. In order to             since then natural dynamics have controlled river morphol-
address these questions, we performed a cluster analysis on             ogy. Both reaches are characterized by largely open canopies
NO− 3 recordings. We differentiated between in-stream and               and shallow (usually below 0.4 m) water depths, which al-
transport control by comparing travel time estimates to time            lows light to reach the streambed. However, in the down-
lags between concentration signals at adjacent monitoring               stream reach water depths are more variable, exceeding 1.5 m
sites. Finally, we compared environmental conditions among              at some locations. As a consequence, flow velocities are also
clusters and determined correlations between the concentra-             more variable in the downstream reach. Both reaches are
tion rates of change and potential drivers of biochemical pro-          scarcely colonized by macrophytes and filamentous algae. A
cesses.                                                                 visible biofilm was observed on the gravel bed, particularly
                                                                        in the second half of the growing season. There are no obvi-
                                                                        ous influxes along the two stream reaches, except for a minor
                                                                        tributary in the upstream reach (Fig. 1).

Biogeosciences, 18, 4705–4715, 2021                                                         https://doi.org/10.5194/bg-18-4705-2021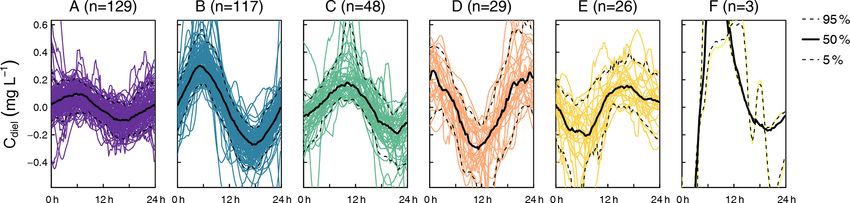
J. Greiwe et al.: Diel patterns in stream nitrate concentration                                                             4707

2.2     Data collection                                           centration (Cdiel ), to ensure that the resulting clusters rep-
                                                                  resented variability in diel cycles and not in NO−    3 back-
Concentration of NO−   3 was measured at 15 min intervals at      ground concentrations. Diel (residual) concentrations were
the three monitoring sites (S1, S2, S3) using UV–vis spec-        obtained by subtracting a 24 h centered moving average from
trometer probes (spectro::lyser, s::can Messtechnik GmbH,         the measured concentrations (Cobs ) and smoothed by apply-
Vienna, Austria) from April to November in 2019. As only          ing a moving average of 2 h. One feature of the k-means
two spectrometer probes were available, one probe was peri-       method that introduces some degree of subjectivity is the de-
odically repositioned so that input and output concentrations     termination of the number of clusters k. We therefore tested
of either the upper or the lower stream reach were measured.      k values between 2 and 20 and determined the best partition
In addition, every 2 weeks grab samples were collected at         by both an assessment of explanatory benefit per additional
eight locations along the studied stream reach, including the     cluster, also known as the “elbow method”, and by visual
probe locations, to provide a local calibration for probe mea-    inspection of clusters. The elbow method was not clearly in-
surements (Fig. S1 in the Supplement) and to assess lon-          dicative as no sharp bend was observed. Instead, we visually
gitudinal concentration evolution between monitoring sites.       found an optimum number of six clusters, since higher val-
Samples were analyzed using ion chromatography (Dionex            ues of k did not produce new clusters in terms of timing but
ICS-1100, Thermo Fisher Scientific Inc., USA). Stream tem-        rather caused further splitting of existing clusters by ampli-
perature (T ) and water levels (h) were continuously recorded     tude. As a measure for longitudinal stability of diel patterns,
at the downstream site S3 (TD-Diver, Van Essen Instruments,       we calculate the fraction of days on which diel patterns at
Netherlands) at 15 min intervals. Discharge was calculated        the upstream and downstream monitoring sites of each reach
using a rating curve based on two salt dilution measurements      were assigned to the same cluster.
by the regional water authority and one additional salt dilu-
tion measurement during higher water levels on 15 Novem-          2.3.2   In-stream vs. transport control on diel NO−
                                                                                                                    3
ber 2019 (> 70 % of recorded water levels). In the latter di-             patterns
lution measurement, we injected 33 kg of NaCl at site S1 to
cover both reaches. We used global irradiance (S) data from       In order to differentiate between in-stream and transport con-
a nearby climate station (< 10 km, Fig. 1) as a measure of        trol on diel NO− 3 patterns, we determined time lags between
sunlight intensity.                                               adjacent monitoring sites by cross-correlation analysis and
                                                                  compared these to estimated solute travel time. If diel NO−   3
2.3     Data analysis                                             variation originated from some upstream source and subse-
                                                                  quent downstream transport, time lags between sites should
2.3.1    Identification of patterns in stream NO−
                                                3                 correspond to solute travel times. In contrast, if diel patterns
         concentration                                            were produced by in-stream processes more or less simul-
                                                                  taneously at all points along the flow path, we expected the
Patterns in NO−  3 concentration may also vary on the sea-        time lag to be zero in most instances. Cross-correlation anal-
sonal, daily, and spatial scales. We assessed seasonal rela-      ysis is a standard method to determine time lags between sig-
tionships of absolute NO−                               −
                          3 concentrations and diel NO3 vari-     nals (Derrick and Thomas, 2004). It is based on the idea that
ability with environmental conditions by determining Spear-       the strength of a correlation between two signals changes
man rank correlations of daily means of Cobs and daily NO−   3    according to a temporal shift. The shift that maximizes the
amplitudes with global irradiance (S), water temperature (T ),    strength of the correlation is considered the time lag between
and water level (h). We used k-means cluster analysis to          the signals. This method works best if the two signals have a
identify diel patterns in stream NO− 3 concentrations as done     similar shape; i.e., they are strongly correlated at an optimal
previously by Aubert and Breuer (2016). This method par-          lag. We therefore determined time lags only for days when
titions a data set into a pre-defined number of k clusters by     the correlation coefficient r between upstream and down-
iteratively minimizing the within-cluster sum of squares. We      stream sites exceeded 0.75. This was true for 29 out of 42
used the algorithm by Hartigan and Wong (1979) that is im-        completely recorded days in the upper reach and 92 out of
plemented in the “stats” R package (R Core Team, 2019).           121 complete days at the lower reach.
The input to this algorithm is a matrix whose rows repre-            Time lags were compared to two independent estimates of
sent elements to be partitioned (days in the present case) and    solute travel time: mean tracer travel time (τa ) and nominal
whose columns represent the dimensions according to which         water residence time (τn ) according to Kadlec (1994). While
the elements are compared. In the present case, these dimen-      τa is the first moment of the tracer residence time distribu-
sions correspond to the time of day of the measurements           tion and was determined from the breakthrough curves of our
(n = 96 at a measurement interval of 15 min). More infor-         salt dilution measurements, τn is the ratio of reach volume
mation about the method can be found in Tan et al. (2019).        and discharge. In contrast to τa , which requires tracer data
    The k-means analysis was done on the diel portion of the      as an input and could only be determined for our own dilu-
solute concentration signal, hereafter referred to as diel con-   tion measurement (raw data of low flow measurements was

https://doi.org/10.5194/bg-18-4705-2021                                                  Biogeosciences, 18, 4705–4715, 2021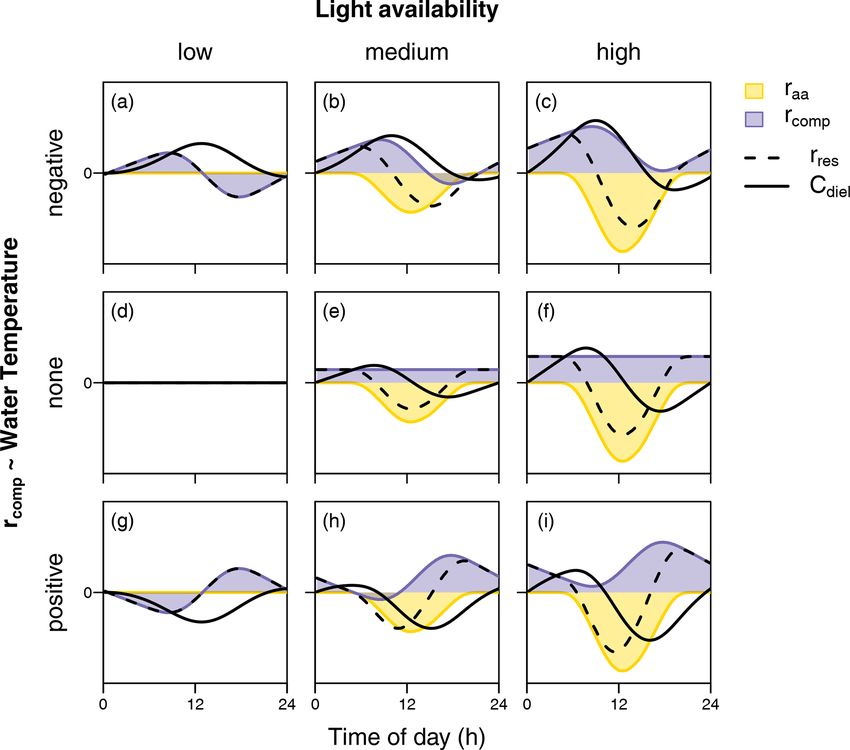
4708                                                                  J. Greiwe et al.: Diel patterns in stream nitrate concentration

not available from the regional water authority), τn was cal-             7.44 mg L−1 (Fig. 3). Mean values and standard devia-
culated continuously from water level recordings and chan-                tions at the three monitoring sites were 4.64 ± 0.66 mg L−1
nel width. As discharge, water depth, and channel width vary              (S1), 4.63 ± 0.73 mg L−1 (S2), and 4.36 ± 0.75 mg L−1 (S3).
along the stream reach, we decided to account for variabil-               Considering only days with complete upstream and down-
ity in channel geometry and flow conditions by estimating a               stream observations, i.e., comparing averages of the same
range of likely travel times based on channel width. Channel              day, NO−  3 concentration significantly increased between S1
widths were estimated from aerial imagery and ranged from                 and S2 (from 4.61 to 4.86 mg L−1 , p < 0.001, n = 42) and
20 to 25 m in the lower sub-reach and from 15 to 20 m in the              significantly decreased between S2 and S3 (from 4.54 to
upper sub-reach. Time lags obtained from cross-correlation                4.40 mg L−1 , p < 0.001, n = 121) (Fig. S2). Daily averages
were tested for difference from zero using t tests and for dif-           of NO−  3 were negatively correlated with water level (ρ =
ference from travel time estimates using paired t tests.                  −0.34, p < 0.001), positively correlated with water temper-
                                                                          ature (ρ = 0.53, p < 0.001), and uncorrelated with global ir-
2.3.3    Characterization of clusters                                     radiance (ρ = 0.01, p = 0.93). The overall negative correla-
                                                                          tion between NO−   3 and water level was dominated by large
In order to characterize the clusters, we compared environ-               floods in May and June. Particularly in the second half of the
mental parameters during the occurrence of the respective                 study period, e.g., in early August (S2 and S3) and late Octo-
clusters. In particular, we assessed daily means of NO−                   ber (S1 and S2), NO−   3 concentrations increased in response
                                                                3
concentration, water levels (hmean ), and water temperature               to floods (Fig. 3). Daily NO−  3 amplitudes were not corre-
(Tmean ) as well as the daily maximum solar irradiance (Smax ).           lated with water level (ρ = −0.03, p = 0.76), water temper-
Differences between clusters were statistically assessed us-              ature (ρ = 0.11, p = 0.22), or global irradiance (ρ = −0.07,
ing analysis of variance (ANOVA) and Tukey honestly sig-                  p = 0.21).
nificant difference (HSD) tests as implemented in the “stats”                The cluster analysis resulted in six clusters that clearly dif-
R package (R Core Team, 2019).                                            fered in terms of amplitude and timing of minimum and max-
   The relationships between clusters and potential drivers               imum concentrations (Fig. 2). A total of 69.6 % of the days
were investigated by calculating daily Spearman rank cor-                 were attributed to the clusters A (n = 128) and B (n = 119),
relations between Cdiel and the diel course of the drivers. As            which both reached peak concentration in the early morn-
potential drivers we considered global irradiance (S), water              ing and minimum concentration in the late afternoon, but the
temperature (T ), and discharge, with the latter represented by           daily amplitude was higher in cluster B. The remaining clus-
water level (h). These environmental parameters are usually               ters were characterized by peaks around midday (cluster C,
considered to influence the rate of biogeochemical processes,             n = 48), in the afternoon (cluster D, n = 28), and around
i.e., the rate of change of NO−     3 concentration rather than           midnight (cluster E, n = 26). The last cluster (cluster F,
instantaneous NO−    3  concentration.   Laboratory experiments           n = 3) did not include enough days for a proper characteriza-
have shown such behavior for the effect of light on NO−         3         tion. Average time of the daily concentration maxima in clus-
uptake rates of algae (Grant, 1967) or the effect of temper-              ters A to E was 04:33, 05:32, 10:18, 16:44, and 23:33 CET,
ature on denitrification rate (Pfenning and McMahon, 1997).               respectively. The respective average times of daily minima
We therefore assessed correlations between drivers and the                were 17:46, 17:36, 21:39, 06:06, and 11:58 CET.
first derivative (δCdiel ) of the diel concentration signal Cdiel .          In terms of cluster occurrence, a largely similar seasonal
This corresponds to the way biochemical processes are im-                 pattern was apparent at all monitoring sites, despite different
plemented in some recent solute models (Hensley and Co-                   numbers of recorded days (Fig. 3). Cluster A dominated in
hen, 2016; Grace et al., 2015). However, changes in water                 May and again in October and was replaced by cluster B dur-
level may affect NO−   3 concentrations both indirectly, e.g., by         ing the summer months from June to September. Both clus-
influencing hyporheic exchange and biochemical processes                  ters usually formed continuous blocks of several days. Clus-
therein (Trauth and Fleckenstein, 2017), and directly, since              ter C occurred occasionally throughout the season but pref-
additional flow components may be enriched or depleted                    erentially in early summer, while clusters D and E mainly
in NO−  3 compared to pre-event water. In the case of water               occurred in fall. On most days (62.0 %), diel NO−      3 record-
level, we therefore calculated correlations with both Cdiel and           ings at the upstream and downstream monitoring sites were
δCdiel .                                                                  attributed to the same cluster, i.e., these patterns were longi-
                                                                          tudinally stable. However, longitudinal stability differed be-
3     Results                                                             tween stream reaches (50.0 % in the upper and 66.1 % in
                                                                          the lower reach) and among clusters. Cluster A was most
3.1     Variability of diel patterns in space and time                    stable (84.2 %, n = 57), while clusters B (62.3 %, n = 53)
                                                                          and C (61.9 %, n = 21) were close to the average. Cluster D
Data collection at the three monitoring sites resulted in                 (28.6 %, n = 14) and cluster E (12.5 %, n = 16) turned out to
352 complete diel NO− 3 recordings. Throughout the sea-                   be comparatively unstable.
son, stream NO−3  concentrations ranged between 2.47 and

Biogeosciences, 18, 4705–4715, 2021                                                          https://doi.org/10.5194/bg-18-4705-2021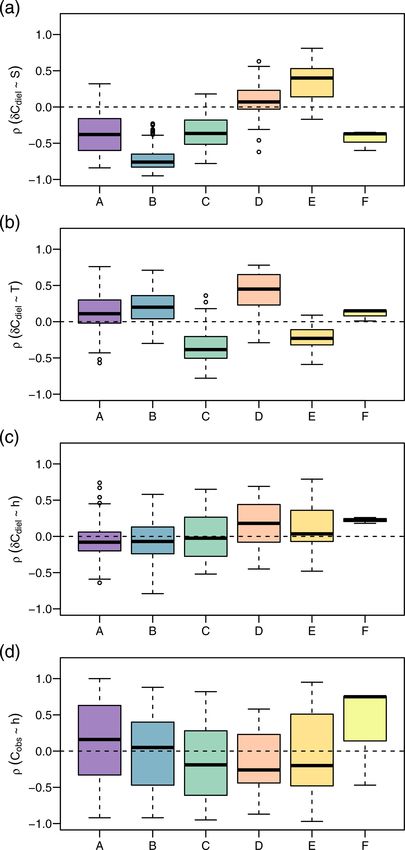
J. Greiwe et al.: Diel patterns in stream nitrate concentration                                                                           4709

Figure 2. Clusters found in diel residuals of NO−3 concentration (Cdiel ). Capital letters above panels are cluster names ordered alphabetically
according to cluster size. Black lines indicate median diel patterns, and dashed lines indicate the 5th and 95th percentiles. Note that Cdiel
reflects deviations from the 24 h floating average so that negative values do not imply that negative concentrations were observed.

Figure 3. Global irradiance (a), water temperature (b), and water level (c) at S3 as well as NO− 3 concentration and cluster occurrence at the
monitoring sites S1 (d), S2 (e), and S3 (f). Background colors in (d) to (f) indicate to which cluster the corresponding day was assigned.

3.2   In-stream vs. transport control on diel patterns                    between zero and the travel time estimates but were signifi-
                                                                          cantly different from both zero (p < 0.001, both reaches) and
                                                                          minimum travel time (p < 0.001, both reaches). In the lower
The time lags between diel NO−   3 signals at adjacent moni-              reach, lags formed an evenly distributed point cloud. Within
toring sites were usually shorter than the solute travel times            this cloud, clusters D, E, and F only appear at above-median
between the stations. The salt dilution measurement resulted              flows. In the upper reach, time lags were concentrated to-
in a discharge of 2.0 m3 s−1 and travel time (τa ) estimates of           wards the extremes, i.e., either close to zero or close to travel
2.0 h in the upper reach and 2.3 h in the lower reach (Fig. 4).           time estimates. Days with below-median stream flow were
Estimates of nominal residence time (τn ) increased with de-              mainly assigned to cluster B and those above median stream
creasing stream flows. The fact that the independently deter-             flow to cluster A.
mined τa was included in the range of τn showed that the
estimated travel times were plausible. In both reaches, the
time lags between the concentration signals roughly ranged

https://doi.org/10.5194/bg-18-4705-2021                                                             Biogeosciences, 18, 4705–4715, 2021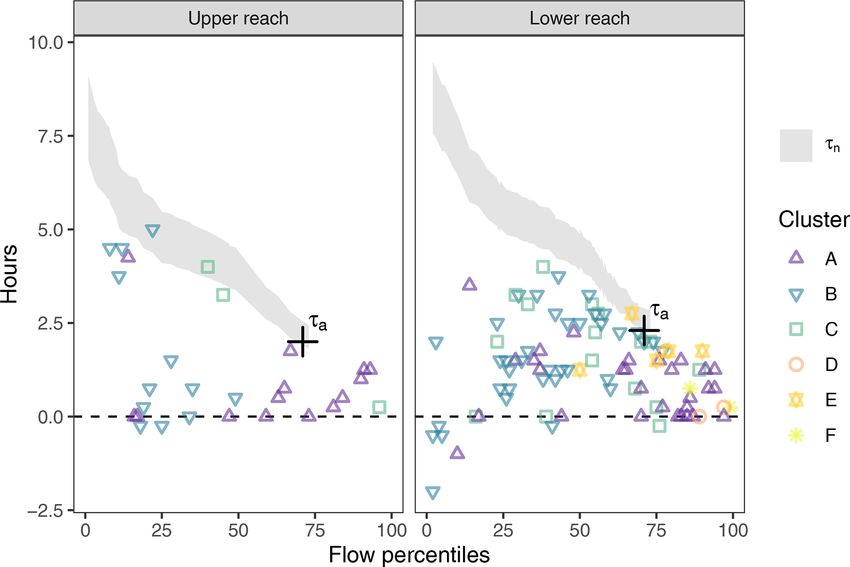
4710 J. Greiwe et al.: Diel patterns in stream nitrate concentration
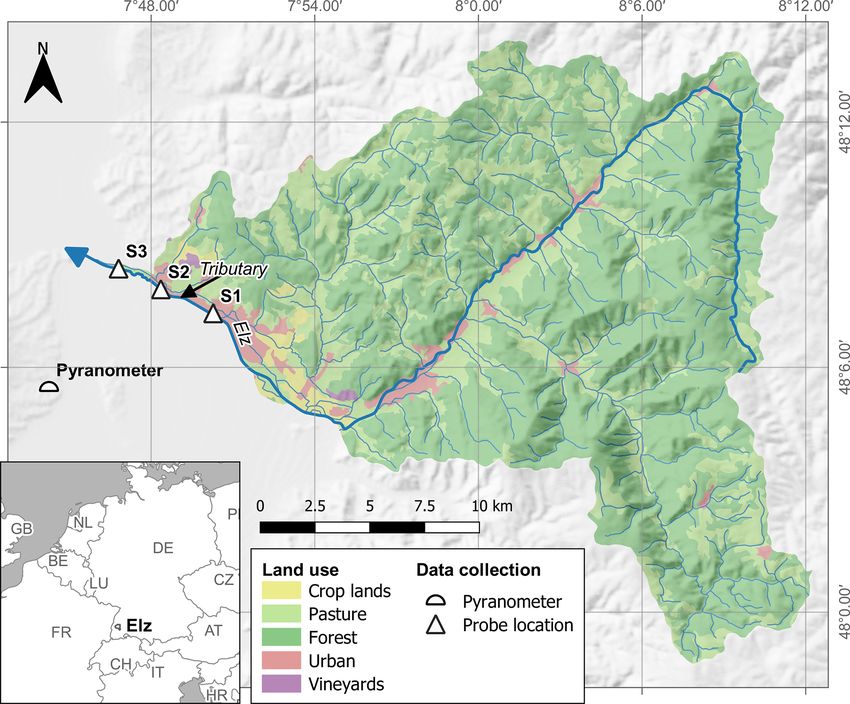
Figure 4. Time lag between diel NO− 3 signals at adjacent moni-
toring points (colored symbols) compared to the tracer travel time
(τa , black cross) and the range of nominal travel time estimates (τn ,
shaded area). No travel times were estimated when discharge ex-
ceeded the validity range of the rating curve. The figure only shows
lags determined from signals with a corresponding cross-correlation
coefficient above 0.75 (84.0 % of the days). Points falling below
the shaded areas indicate in-stream control on diel NO− 3 patterns,
whereas points within the range of travel time estimates suggest
transport control.
3.3 Characterization of clusters
We found clear differences in the distribution of daily means
of environmental parameters among clusters (Fig. 5). The
following characterization of the clusters refers to signif-
icant differences (p < 0.05) according to the Tukey HSD
test applied to an ANOVA on the cluster data. Cluster A
overall presented the lowest NO− 3 concentrations (median Figure 5. Environmental conditions during occurrence of clusters.
4.36 mg L−1 ), which differed from those during clusters B The panels show daily average NO− 3 concentration (a), daily max-
(median 4.87 mg L−1 ) and C (median 4.88 mg L−1 ). Clus- imum of global irradiance (b), daily average water temperature (c),
ter A also showed the lowest water temperature (median and daily average water level (d). Lowercase letters above boxplots
14.1 ◦ C) and elevated water levels (median 41.9 cm) com- were assigned to groups that do not differ significantly according to
pared to clusters B and C. Cluster B was characterized by analyses of variance (ANOVA) and Tukey tests.
the highest global irradiance (median 825.0 W m−2 ), highest
water temperature (21.7 ◦ C), and lowest water levels (median
21.2 cm). Disregarding cluster F with only three data points, S was positive in cluster D, negative in clusters A and C,
the difference in water temperature was significant for all re- and strongly negative in cluster B. Moderate correlations of
maining clusters. Global irradiance in cluster B differed from δCdiel and T were found in cluster C (negative) and cluster E
all clusters but C. Water level differed with all clusters but C (positive). Correlations of δCdiel with h were weak, and the
and E. Cluster C occurred during very similar conditions as differences among clusters were less pronounced than with S
cluster B and only differed from cluster B in terms of water and T . The relationship of Cobs and h was very variable and
temperature (median 16.4 ◦ C). The two clusters D and E were included both strongly positive and negative correlations.
characterized by lower global irradiance than clusters B and
C and did not differ from one another. Cluster F consisted 4 Discussion
of only 3 d, but all of these represented water levels (median
77.2 cm) hardly ever observed in the remaining clusters. 4.1 General patterns
In addition to different environmental conditions, we iden-
tified different relationships with potential drivers of diel cy- In our data, we found patterns in NO− 3 concentration both
cles among clusters (Fig. 6). The correlation of δCdiel and on the diel and on the seasonal scale. On the seasonal scale,
Biogeosciences, 18, 4705–4715, 2021 https://doi.org/10.5194/bg-18-4705-2021J. Greiwe et al.: Diel patterns in stream nitrate concentration 4711
est on days with high metabolic activity (Rode et al., 2016;
Heffernan and Cohen, 2010), daily amplitudes did not show
correlations with daily averages of light intensity, water tem-
perature, or water level. The fact that longitudinal stability
varied among clusters suggests that less stable clusters (e.g.,
D and E) indicated either a shift in in-stream conditions be-
tween monitoring sites or external controls on diel patterns,
e.g., transport.
Variability in NO− 3 concentration may also be influenced
by lateral inputs, including tributaries and groundwater inter-
action. The only surface tributary within the studied stream
reach was between S1 and S2. It was initially considered neg-
ligible and therefore not accounted for. However, snap shot
sampling on a hot day during low-flow conditions revealed
nitrate concentration twice as high as in the main stream.
Consequently, it is possible that the tributary influenced av-
erage NO− 3 levels. It may also be subject to its own diel NO3
−
fluctuations. Yet, the influence on patterns in the main stream
must have been small as diel patterns were usually longitu-
dinally stable, i.e., the same upstream (S1) and downstream
(S2) of the tributary.
It is also possible that diffuse groundwater influx influ-
enced average NO− 3 concentration at the monitoring sites. In
fact, NO− 3 levels in regional groundwater wells were higher
than in stream water in the proximity of the upper reach and
lower than in stream water along the lower reach (Fig. S3).
Although the overall flow direction of groundwater was par-
allel to the stream, groundwater inputs might explain the
increase in average NO− 3 concentration from S1 to S2 and
subsequent decrease from S2 to S3 (Fig. S2). Previous re-
search identified diffuse groundwater inputs as a consider-
able challenge for determining mass balances using paired
high-frequency probes (Kunz et al., 2017). Due to these dif-
Figure 6. Daily Spearman correlations of the NO− ficulties, we were unable to separate the effects of diffuse
3 signal with po-
tential drivers by cluster. The panels show correlation strength of groundwater inputs from a potential effect of increased NO− 3
diel concentration change rate with global irradiance (a), diel con- removal in the lower reach due to the revitalization measures.
centration change rate with water temperature (b), diel concentra-
tion change rate with water level (c), and observed concentration 4.2 Interpretation of diel patterns
with water level (d).
The comparison of time lags between monitoring sites with
travel time revealed that lags were usually too small to be
a weak negative correlation of NO− 3 and water level indi- produced by transport alone, but higher than expected in the
cated that flow events tended to dilute NO− 3 concentrations. case of pure in-stream control (Fig. 4). The presence of time
However, particularly after the low-flow period in summer, lags may thus be caused by an interaction of transport and
NO− 3 increased during discharge events, an observation that in-stream processes. Simulating the longitudinal evolution of
is often explained by the mobilization of previously accumu- NO− 3 concentration downstream of a constant source, Hens-
lated NO− 3 in soils (Burns et al., 2019; Lange and Haensler, ley and Cohen (2016) found that timing of NO− 3 extremes
2012). The fact that NO− 3 was correlated with stream temper- was variable in the proximity of the source. With increas-
ature but not with global irradiance may be a consequence ing travel distance, however, NO− 3 concentration converged
of a more intense seasonal pattern in water temperature than into a stable signal solely defined by in-stream processes. De-
in irradiance, since we started our monitoring campaign in pending on the position of observation points along such a
late spring when daily irradiance peaks were already close stream reach, one may find time lags like those observed in
to their seasonal maximum. On the diel scale, we identified our study. Although in our study boundary conditions were
six different NO− 3 patterns that varied seasonally. Although far less constrained than in the simulation of Hensley and
daily NO− 3 amplitudes would usually be expected to be high- Cohen (2016), their results might principally explain our ob-
https://doi.org/10.5194/bg-18-4705-2021 Biogeosciences, 18, 4705–4715, 20214712 J. Greiwe et al.: Diel patterns in stream nitrate concentration
served time lags. Non-zero lags would then indicate that at
the study site NO− 3 concentration had not yet fully converged
and was still partially influenced by transport. Nevertheless,
observed time lags were clearly smaller than estimated travel
times. We therefore conclude that the observed diel NO− 3 pat-
terns were not primarily produced by transport.
In the following, we therefore aim to interpret our findings
based on in-stream processes. In terms of biochemical pro-
cesses, diel NO− 3 variability depends on the time-varying bal-
ance of NO− 3 removal (via assimilation by both heterotrophs
and autotrophs as well as denitrification) and NO− 3 produc-
tion (via mineralization and subsequent nitrification). We do
not regard our interpretations on the controls of the observed
patterns to be complete but rather hypotheses for further re-
search on diel solute patterns to build upon. Considering
the idea of multiple superposed biochemical processes as a
starting point, some assumptions can be made on the diel
course of the processes mentioned above. Photoautotrophic
assimilation depends on the light availability and can be
conceptualized as a function of solar irradiance. In con- Figure 7. Schematic representation of diel courses of assimilation
trast, the degree of diel variability in nitrification, denitrifi- rate (raa ) and a complementary processing rate (rcomp ) required
to produce equilibrium conditions. Black lines show the resulting
cation, and heterotrophic assimilation is less clear. However,
change rate (rres ) and concentration (C). While raa is considered
we generally assume that the rate of microbial metabolism
a function of global irradiance (columns represent different lev-
(besides other influences) increases with temperature. Fig- els of irradiation intensity), rcomp is conceptualized as a function
ure 7 schematically illustrates the diel concentration sig- of stream temperature (rows represent a negative, a–c; no relation-
nals resulting from overlaying the diel courses of light- ship, d–f; and a positive relationship, g–i).
dependent photoautotrophic (raa ) assimilation and a comple-
mentary temperature-dependent processing rate (rcomp ). The
latter represents the combined net effect of heterotrophic as-
similation, nitrification, and denitrification. In particular, we toautotrophic NO− 3 uptake which may be due to reduced light
consider different levels of light intensity (columns in Fig. 7) availability in fall or due to lower water temperatures and
and different types of relationships with temperature (rows higher flow during both periods. The latter may have influ-
in Fig. 7), including positive and negative correlation with enced photoautotrophic NO− 3 uptake via reduced light pene-
temperature as well as constant rcomp . The shapes of raa and tration through a higher water layer, via disruption of stream
rcomp reflect means over all measurements of global irradi- metabolism due to destruction of vegetation by flood events
ance and water temperature, respectively, during the course (Burns et al., 2019).
of the present study. Patterns with a midday maximum such as those observed
Diel NO− 3 patterns with a maximum in the early morn- in cluster C are hard to explain by photoautotrophic assimi-
ing and a minimum in the afternoon are usually explained by lation alone in systems without intense seasonal shading by
photoautotrophic NO− 3 uptake by primary producers (Nimick riparian vegetation (as opposed to e.g. Rusjan and Mikoš,
et al., 2011; Heffernan and Cohen, 2010). This was also the 2010). In Figure 7a, b, c, and f, a decrease in photoau-
largest group of diel patterns in our study, including clusters totrophic assimilation and simultaneous increase in a NO− 3-
A and B, jointly accounting for about 70 % of the data. In our depleting process, negatively related to water temperature,
study, the idea that such diel patterns reflect photoautotrophic cause the daily NO− 3 peak to shift towards midday. This
uptake is supported by a strongly (cluster B) and moderately suggests that either denitrification or heterotrophic assimi-
(cluster A) negative correlation between δCdiel and global ir- lation or both are promoted by stream temperature and drive
radiance. The higher amplitude of cluster B (Fig. 2) may re- the shape of the signal. Diel variability has been observed
sult from either stronger photoautotrophic NO− 3 uptake com- in both denitrification (Christensen et al., 1990; Harrison et
pared to cluster A (Fig. 7e and f) or added effects of in- al., 2005; Cohen et al., 2012) and heterotrophic respiration
tense assimilation and diel variability in the interplay of other (Hotchkiss and Hall, 2014), which is closely linked to het-
NO− −
3 -depleting or NO3 -producing processes (Fig. 7c and i). erotrophic NO− −
3 assimilation. However, peak NO3 depletion
Consequently, the seasonality in cluster occurrence suggests occurs in the afternoon, when oxygen levels are expected
that photoautotrophic NO− 3 uptake was strongest from June to be elevated and unfavorable for anaerobe denitrification
to early September, when cluster B prevailed. In May and (Rysgaard et al., 1994). In addition, it is not clear how deni-
October the dominance of cluster A suggests reduced pho- trification in the lower anoxic sediments could be promoted
Biogeosciences, 18, 4705–4715, 2021 https://doi.org/10.5194/bg-18-4705-2021J. Greiwe et al.: Diel patterns in stream nitrate concentration 4713
by temperature without simultaneously increasing nitrifica- transport of upstream NO− 3 inputs. Most patterns were char-
tion in the upper sediment layers. However, it seems possible acterized by a pre-dawn maximum and an afternoon min-
that the driving force of cluster C was not temperature but imum of varying intensity, and mostly the change rate of
another process with a similar diel pattern. Exudation of al- NO− 3 concentration was negatively correlated with global
gal photosynthate rich in labile organic carbon (Kaplan and irradiance. We therefore conclude that these patterns were
Bott, 1982) may have a similar diel course and stimulate as- primarily produced by photoautotrophic NO− 3 uptake. How-
similation and denitrification by heterotrophs but not nitrifi- ever, we also found indications that other biochemical pro-
cation by autotrophs. Under such conditions, heterotrophic cesses like nitrification and heterotrophic respiration con-
assimilation or denitrification or both may drive diel NO− 3 tributed to the formation of NO− 3 patterns. In-depth interpre-
fluctuation in cluster C. tation and eventually quantification of process rates would
In literature, diel patterns with a NO− 3 peak in the after- require spatially distributed high-frequency information on
noon (cluster D) have been attributed to intense evapotran- stream metabolism, e.g., dissolved oxygen concentrations,
spiration (Aubert and Breuer, 2016; Flewelling et al., 2014; and on different N species. Nevertheless, our analysis sug-
Lupon et al., 2016a). In the present study, evapotranspiration gests that particular combinations of different in-stream pro-
was not measured; however, it did not produce systematic cesses may generate distinct diel NO− 3 patterns. A seasonal
diel fluctuations in water level, and the fluctuations were not shift in patterns may then indicate shifts in the relative im-
correlated with diel NO− 3 signals. Such patterns could also portance of the underlying processes. The clustering method
not be reproduced by overlaying rates of light-dependent and used in this study proved useful for making the data set acces-
temperature-dependent processes (Fig. 7). A satisfactory ex- sible for this kind of analysis and may be used as a blueprint
planation for cluster D is therefore still needed. for the analysis of other stream solutes.
Diel patterns with a midday low (cluster E) could
be the result of low photoautotrophic assimilation and a
temperature-dependent NO− 3 -producing process like nitrifi-
Data availability. The data set is available online (https://doi.org/
cation (Fig. 7g). Diel variability in nitrification is well docu- 10.6094/UNIFR/218991, Greiwe et al., 2021).
mented (Warwick, 1986; Laursen and Seitzinger, 2004; Dunn
et al., 2012), and it seems principally plausible that tempera-
ture promotes nitrification without influencing denitrification Supplement. The supplement related to this article is available on-
in deeper anoxic sediment layers. Another reason for inde- line at: https://doi.org/10.5194/bg-18-4705-2021-supplement.
pendence of nitrification and denitrification may be limita-
tion of heterotrophic denitrification in absence of an organic
Author contributions. JG, JL, and MW planned the monitoring
carbon source.
setup. JG installed and maintained the probes and performed the
These findings suggest that, despite a dominance of pho-
data analysis. JG wrote and revised the manuscript in close cooper-
toautotrophic assimilation, other processes contribute to the ation with JL and MW.
formation of diel NO− 3 patterns in the river Elz. These may be
adverse processes like nitrification on the one hand and den-
itrification and heterotrophic assimilation on the other hand. Competing interests. The authors declare that they have no conflict
The relative importance of these processes varies seasonally of interest.
and is reflected in shifts of diel NO− 3 patterns. Although the
distinct clusters identified in our analysis invite for specula-
tion, in-stream NO− 3 processing is complex, and processes Disclaimer. Publisher’s note: Copernicus Publications remains
overlap and interact, which makes unambiguous interpreta- neutral with regard to jurisdictional claims in published maps and
tion solely based on NO− 3 recordings challenging.
institutional affiliations.
5 Conclusions Acknowledgements. We would like to thank Britta Kattenstroth,
Robin Schwemmle, Felicia Linke, and Phillip Grimm for their
In a 5.1 km stream reach of the river Elz in southwest Ger- help with the installation and maintenance of the monitoring sites.
We also thank the staff of the regional river authority in Riegel
many, we identified diel patterns in stream NO− 3 concentra- (Bernhard Walser), the wastewater treatment plant “Untere Elz”
tion, differentiated between in-stream and transport control,
(Oliver Keuer), and the municipality of Teningen (Rolf Bergmann)
and analyzed how patterns were related to environmental for logistic support.
conditions and potential drivers. We found a set of six clus-
ters representing different characteristic diel NO−3 patterns.
Relatively small temporal shifts between adjacent monitor- Financial support. This study was carried out within the research
ing sites indicated that NO− 3 concentration patterns were project DRIeR (grant no. 7533-25), which was supported by the
predominantly formed by in-stream processes and not by a
https://doi.org/10.5194/bg-18-4705-2021 Biogeosciences, 18, 4705–4715, 20214714 J. Greiwe et al.: Diel patterns in stream nitrate concentration
Wassernetzwerk Baden-Württemberg (Water Research Network) zone of a low-relief, agricultural catchment, Hydrol. Process., 28,
and funded by the Ministerium für Wissenschaft, Forschung und 2150–2158, https://doi.org/10.1002/hyp.9763, 2014.
Kunst Baden-Württemberg (Ministry of Science, Research and the Grace, M. R., Giling, D. P., Hladyz, S., Caron, V., Thompson, R.
Arts of the Land of Baden-Württemberg). M., and Mac Nally, R.: Fast processing of diel oxygen curves:
Estimating stream metabolism with BASE (BAyesian Single-
This open-access publication was funded station Estimation), Limnol. Oceanogr. Methods, 13, e10011,
by the University of Freiburg. https://doi.org/10.1002/lom3.10011, 2015.
Grant, B. R.: The action of light on nitrate and nitrite assimilation by
the marine chlorophyte, Dunaliella tertiolecta (Butcher), J. Gen.
Review statement. This paper was edited by Tom J. Battin and re- Microbiol., 48, 379–389, https://doi.org/10.1099/00221287-48-
viewed by Matt Trentman and three anonymous referees. 3-379, 1967.
Greiwe, J., Lange, J., and Weiler, M.: Data set: Diel patterns in
stream nitrate concentration produced by in-stream processes,
FreiDok Plus [data set], https://doi.org/10.6094/UNIFR/218991,
2021.
References Harrison, J. A., Matson, P. A., and Fendorf, S. E.: Effects of a diel
oxygen cycle on nitrogen transformations and greenhouse gas
Aubert, A. H. and Breuer, L.: New Seasonal Shift in emissions in a eutrophied subtropical stream, Aquat. Sci., 67,
In-Stream Diurnal Nitrate Cycles Identified by Min- 308–315, https://doi.org/10.1007/s00027-005-0776-3, 2005.
ing High-Frequency Data, PloS One, 11, e0153138, Hartigan, J. A. and Wong, M. A.: Algorithm AS 136: A K-
https://doi.org/10.1371/journal.pone.0153138, 2016. Means Clustering Algorithm, App. Stat. J. Roy. St. C, 28, 100,
Austin, B. J. and Strauss, E. A.: Nitrification and denitrifica- https://doi.org/10.2307/2346830, 1979.
tion response to varying periods of desiccation and inunda- Heffernan, J. B. and Cohen, M. J.: Direct and indirect cou-
tion in a western Kansas stream, Hydrobiologia, 658, 183–195, pling of primary production and diel nitrate dynamics in a
https://doi.org/10.1007/s10750-010-0462-x, 2011. subtropical spring-fed river, Limnol. Oceanogr., 55, 677–688,
Birgand, F., Skaggs, R. W., Chescheir, G. M., and Gilliam, J. https://doi.org/10.4319/lo.2010.55.2.0677, 2010.
W.: Nitrogen Removal in Streams of Agricultural Catchments Hellwig, J., Stahl, K., and Lange, J.: Patterns in the linkage of wa-
– A Literature Review, Crit. Rev. Env. Sci. Tec., 37, 381–487, ter quantity and quality during low-flows, Hydrol. Process., 31,
https://doi.org/10.1080/10643380600966426, 2007. 4195–4205, https://doi.org/10.1002/hyp.11354, 2017.
Burns, D. A., Pellerin, B. A., Miller, M. P., Capel, P. D., Tesoriero, Hensley, R. T. and Cohen, M. J.: On the emergence of diel so-
A. J., and Duncan, J. M.: Monitoring the riverine pulse: Applying lute signals in flowing waters, Water Resour. Res., 52, 759–772,
high-frequency nitrate data to advance integrative understanding https://doi.org/10.1002/2015WR017895, 2016.
of biogeochemical and hydrological processes, WIREs Water, Hotchkiss, E. R. and Hall Jr., R. O.: High rates of daytime res-
140, e1348, https://doi.org/10.1002/wat2.1348, 2019. piration in three streams: Use of δ 18 OO2 and O2 to model
Christensen, P. B., Nielsen, L. P., Sørensen, J., and Revsbech, N. P.: diel ecosystem metabolism, Limnol. Oceanogr., 59, 798–810,
Denitrification in nitrate-rich streams: Diurnal and seasonal vari- https://doi.org/10.4319/lo.2014.59.3.0798, 2014.
ation related to benthic oxygen metabolism, Limnol. Oceanogr., Kadlec, R. H.: Detention and mixing in free water wetlands, Ecol.
35, 640–651, https://doi.org/10.4319/lo.1990.35.3.0640, 1990. Eng., 3, 345–380, https://doi.org/10.1016/0925-8574(94)00007-
Cohen, M. J., Heffernan, J. B., Albertin, A., and Martin, J. B.: In- 7, 1994.
ference of riverine nitrogen processing from longitudinal and diel Kaplan, L. A. and Bott, T. L.: Diel fluctuations of DOC generated
variation in dual nitrate isotopes, J. Geophys. Res.-Biogeo., 117, by algae in a piedmont stream1, Limnol. Oceanogr., 27, 1091–
758, https://doi.org/10.1029/2011JG001715, 2012. 1100, https://doi.org/10.4319/lo.1982.27.6.1091, 1982.
Derrick, T. R. and Thomas, J. M.: Time-Series Analysis: The cross- Kunz, J. V., Hensley, R., Brase, L., Borchardt, D., and Rode, M.:
correlation function, Kinesiology Publications, 189–205, 2004. High frequency measurements of reach scale nitrogen uptake in
Duan, S., Powell, R. T., and Bianchi, T. S.: High fre- a fourth order river with contrasting hydromorphology and vari-
quency measurement of nitrate concentration in the able water chemistry (Weiße Elster, Germany), Water Resour.
Lower Mississippi River, USA, J. Hydrol., 519, 376–386, Res., 53, 328–343, https://doi.org/10.1002/2016WR019355,
https://doi.org/10.1016/j.jhydrol.2014.07.030, 2014. 2017.
Dunn, R. J. K., Welsh, D. T., Jordan, M. A., Waltham, N. J., Lemck- Lange, J. and Haensler, A.: Runoff generation following
ert, C. J., and Teasdale, P. R.: Benthic metabolism and nitrogen a prolonged dry period, J. Hydrol., 464–465, 157–164,
dynamics in a sub-tropical coastal lagoon: Microphytobenthos https://doi.org/10.1016/j.jhydrol.2012.07.010, 2012.
stimulate nitrification and nitrate reduction through photosyn- Laursen, A. E. and Seitzinger, S. P.: Diurnal patterns of denitrifica-
thetic oxygen evolution, Estuar. Coast. Shelf S., 113, 272–282, tion, oxygen consumption and nitrous oxide production in rivers
https://doi.org/10.1016/j.ecss.2012.08.016, 2012. measured at the whole-reach scale, Freshwater Biol., 49, 1448–
Ensign, S. H. and Doyle, M. W.: Nutrient spiraling in streams 1458, https://doi.org/10.1111/j.1365-2427.2004.01280.x, 2004.
and river networks, J. Geophys. Res.-Biogeo., 111, G04009, Lupon, A., Bernal, S., Poblador, S., Martí, E., and Sabater,
https://doi.org/10.1029/2005JG000114, 2006. F.: The influence of riparian evapotranspiration on stream
Flewelling, S. A., Hornberger, G. M., Herman, J. S., Mills, A. hydrology and nitrogen retention in a subhumid Mediter-
L., and Robertson, W. M.: Diel patterns in coastal-stream ni-
trate concentrations linked to evapotranspiration in the riparian
Biogeosciences, 18, 4705–4715, 2021 https://doi.org/10.5194/bg-18-4705-2021J. Greiwe et al.: Diel patterns in stream nitrate concentration 4715 ranean catchment, Hydrol. Earth Syst. Sci., 20, 3831–3842, Pfenning, K. S. and McMahon, P. B.: Effect of nitrate, or- https://doi.org/10.5194/hess-20-3831-2016, 2016a. ganic carbon, and temperature on potential denitrification rates Lupon, A., Martí, E., Sabater, F., and Bernal, S.: Green light: in nitrate-rich riverbed sediments, J. Hydrol., 187, 283–295, gross primary production influences seasonal stream N export https://doi.org/10.1016/S0022-1694(96)03052-1, 1997. by controlling fine-scale N dynamics, Ecology, 97, 133–144, R Core Team: R: A language and environment for statistical, R https://doi.org/10.1890/14-2296.1, 2016b. version 3.6.1, R Foundation for Statistical Computing, Vienna, Luque-Almagro, V. M., Gates, A. J., Moreno-Vivián, C., Ferguson, available at: https://www.r-project.org/, last access: 5 July 2019. S. J., Richardson, D. J., and Roldán, M. D.: Bacterial nitrate as- Roberts, B. J. and Mulholland, P. J.: In-stream biotic control similation: gene distribution and regulation, Biochem. Soc. T., on nutrient biogeochemistry in a forested stream, West Fork 39, 1838–1843, https://doi.org/10.1042/BST20110688, 2011. of Walker Branch, J. Geophys. Res.-Biogeo., 112, G04002, Middelburg, J. J. and Nieuwenhuize, J.: Nitrogen uptake by https://doi.org/10.1029/2007JG000422, 2007. heterotrophic bacteria and phytoplankton in the nitrate- Rode, M., Halbedel Née Angelstein, S., Anis, M. R., Bor- rich Thames estuary, Mar. Ecol.-Prog. Ser., 203, 13–21, chardt, D., and Weitere, M.: Continuous In-Stream As- https://doi.org/10.3354/meps203013, 2000. similatory Nitrate Uptake from High-Frequency Sensor Mosley, L. M.: Drought impacts on the water quality of freshwater Measurements, Environ. Sci. Technol., 50, 5685–5694, systems; review and integration, Earth-Sci. Rev., 140, 203–214, https://doi.org/10.1021/acs.est.6b00943, 2016. https://doi.org/10.1016/j.earscirev.2014.11.010, 2015. Rusjan, S. and Mikoš, M.: Seasonal variability of diur- Mulholland, P. J., Hall, R. O., Sobota, D. J., Dodds, W. K., Find- nal in-stream nitrate concentration oscillations under hydro- lay, S. E. G., Grimm, N. B., Hamilton, S. K., McDowell, W. logically stable conditions, Biogeochemistry, 97, 123–140, H., O’Brien, J. M., Tank, J. L., Ashkenas, L. R., Cooper, L. https://doi.org/10.1007/s10533-009-9361-5, 2010. W., Dahm, C. N., Gregory, S. V., Johnson, S. L., Meyer, J. Rysgaard, S., Risgaard-Petersen, N., Niels Peter, S., Kim, J., and L., Peterson, B. J., Poole, G. C., Valett, H. M., Webster, J. R., Lars Peter, N.: Oxygen regulation of nitrification and deni- Arango, C. P., Beaulieu, J. J., Bernot, M. J., Burgin, A. J., Cren- trification in sediments, Limnol. Oceanogr., 39, 1643–1652, shaw, C. L., Helton, A. M., Johnson, L. T., Niederlehner, B. https://doi.org/10.4319/lo.1994.39.7.1643, 1994. R., Potter, J. D., Sheibley, R. W., and Thomasn, S. M.: Ni- Scholefield, D., Le Goff, T., Braven, J., Ebdon, L., Long, T., and trate removal in stream ecosystems measured by 15 N addition Butler, M.: Concerted diurnal patterns in riverine nutrient con- experiments: Denitrification, Limnol. Oceanogr., 54, 666–680, centrations and physical conditions, Sci. Total. Environ., 344, https://doi.org/10.4319/lo.2009.54.3.0666, 2009. 201–210, https://doi.org/10.1016/j.scitotenv.2005.02.014, 2005. Mulholland, P. J., Thomas, S. A., Valett, H. M., Webster, J. Schwab, M.: Long-term, high-frequency analyses of the interplay R., and Beaulieu, J.: Effects of light on NO− 3 uptake in between rainfall-runoff processes, discharge, DOC and nitrate, small forested streams: diurnal and day-to-day variations, J. N. Doctoral dissertation, Albert-Ludwig-Universität, Freiburg, Ger- Am. Benthol. Soc., 25, 583–595, https://doi.org/10.1899/0887- many, 2017. 3593(2006)25[583:EOLONU]2.0.CO;2, 2006. Tan, P.-N., Steinbach, M., Karpatne, A., and Kumar, V.: Introduc- Nimick, D. A., Gammons, C. H., and Parker, S. R.: Diel tion to data mining, Second edition, Pearson, NY NY, 839 pp., biogeochemical processes and their effect on the aqueous 2019. chemistry of streams: A review, Chem. Geol., 283, 3–17, Trauth, N. and Fleckenstein, J. H.: Single discharge events increase https://doi.org/10.1016/j.chemgeo.2010.08.017, 2011. reactive efficiency of the hyporheic zone, Water Resour. Res., 53, Pellerin, B. A., Downing, B. D., Kendall, C., Dahlgren, R. A., 779–798, https://doi.org/10.1002/2016WR019488, 2017. Kraus, T. E. C., Sacramento, J. F., Spencer, R. G. M., and Warwick, J. J.: Diel variation of in-stream nitrification, Water Res., Bergamaschi, B. A.: Assessing the sources and magnitude of 20, 1325–1332, https://doi.org/10.1016/0043-1354(86)90165-X, diurnal nitrate variability in the San Joaquin River (California) 1986. with an in situ optical nitrate sensor and dual nitrate isotopes, Freshwater Biol., 54, 376–387, https://doi.org/10.1111/j.1365- 2427.2008.02111.x, 2009. Peterson, B. J., Wollheim, W. M., Mulholland, P. J., Webster, J. R., Meyer, J. L., Tank, J. L., Marti, E., Bowden, W. B., Valett, H. M., Hershey, A. E., McDowell, W. H., DODDS, W. K., Hamil- ton, S. K., Gregory, S., and Morrall, D. D.: Control of nitrogen export from watersheds by headwater streams, Science, 292, 86– 90, https://doi.org/10.1126/science.1056874, 2001. https://doi.org/10.5194/bg-18-4705-2021 Biogeosciences, 18, 4705–4715, 2021
You can also read