Effect of restricted dissolved oxygen on expression of Clostridium difficile toxin A subunit from E. coli - Nature
←
→
Page content transcription
If your browser does not render page correctly, please read the page content below
www.nature.com/scientificreports

            OPEN           Effect of restricted dissolved
                           oxygen on expression of
                           Clostridium difficile toxin A subunit
                           from E. coli
                           Ashish K. Sharma1, Jenie Phue1,2, Emir Khatipov3,6, Nimish Dalal1,4, Eric D. Anderson5 &
                           Joseph Shiloach1*
                           The repeating unit of the C. difficile Toxin A (rARU, also known as CROPS [combined repetitive
                           oligopeptides]) C-terminal region, was shown to elicit protective immunity against C. difficile and is
                           under consideration as a possible vaccine against this pathogen. However, expression of recombinant
                           rARU in E. coli using the standard vaccine production process was very low. Transcriptome and
                           proteome analyses showed that at restricted dissolved oxygen (DO) the numbers of differentially
                           expressed genes (DEGs) was 2.5-times lower than those expressed at unrestricted oxygen. Additionally,
                           a 7.4-times smaller number of ribosome formation genes (needed for translation) were down-regulated
                           as compared with unrestricted DO. Higher rARU expression at restricted DO was associated with
                           up-regulation of 24 heat shock chaperones involved in protein folding and with the up-regulation
                           of the global regulator RNA chaperone hfq. Cellular stress response leading to down-regulation of
                           transcription, translation, and energy generating pathways at unrestricted DO were associated with
                           lower rARU expression. Investigation of the C. difficile DNA sequence revealed the presence of cell wall
                           binding profiles, which based on structural similarity prediction by BLASTp, can possibly interact with
                           cellular proteins of E. coli such as the transcriptional repressor ulaR, and the ankyrins repeat proteins. At
                           restricted DO, rARU mRNA was 5-fold higher and the protein expression 27-fold higher compared with
                           unrestricted DO. The report shows a strategy for improved production of C. difficile vaccine candidate
                           in E. coli by using restricted DO growth. This strategy could improve the expression of recombinant
                           proteins from anaerobic origin or those with cell wall binding profiles.

                           Clostridium difficile (C. difficile) is an anaerobic bacterial pathogen responsible for diarrhea and pseudomem-
                           branous colitis1,2. The bacteria produces two high molecular weight toxins, toxin A (308 kDa) and toxin B
                           (269 kDa)3,4; both contain a repeating region called rARU (CROPs) (104 kDa) in subunit A and rBRU (70 kDa)
                           in subunit B5,6. Both Toxin A and Toxin B are responsible for clinical symptoms and are candidates for vaccine
                           development7,8. Pfizer’s genetically detoxified vaccine against C difficile is a toxoid mix of Toxin A and Toxin B
                           expressed recombinantly is about to enter clinical trial phase III, and Valneva has a vaccine candidate of recombi-
                           nant fusion protein of truncated portions of Toxin A and Toxin B, which completed a clinical trial phase II, with
                           promising results9–12.
                               In this report, we focused on improving the expression of the repeating unit region (rARU) of the C. difficile
                           toxin A. The importance of rARU was shown in animal models where serum neutralizing antibodies to toxin
                           A conferred immunity to this pathogen and antiserum against nontoxic recombinant peptide, containing the

                           1
                             Biotechnology Core Laboratory, National Institute of Diabetes and Digestive and Kidney Diseases, National
                           Institutes of Health, Bethesda, MD, USA. 2Present address: Center for Biologics Evaluation and Research, U.S. Food
                           and Drug Administration, Silver Spring, MD, USA. 3National Institutes of Health Library, Division of Library Services,
                           Office of Research Services, National Institutes of Health, Bethesda, MD, 20892, USA. 4Biologics manufacturing
                           Science & Technology Bristol-Myers Squibb East Syracuse, New York, NY, 13057, USA. 5Mass Spectrometry Facility,
                           National Institute of Diabetes and Digestive and Kidney Diseases, National Institutes of Health, Bethesda, MD, USA.
                           6
                             Present address: National Institute of Dental and Craniofacial Research, National Institutes of Health, Bethesda,
                           MD, 20817, USA. *email: JosephS@niddk.nih.gov

Scientific Reports |   (2020) 10:3059 | https://doi.org/10.1038/s41598-020-59978-1                                                             1
www.nature.com/scientificreports/                                                               www.nature.com/scientificreports

                           Figure 1. Bioprocess parameters, culture kinetics, rARU production and data processing to identify DEGs.
                           (A) Growth (OD600) and DO profile of rARU expressing recombinant BL21(DE3)Tuner/pRSETb-rARU at
                           unrestricted DO and restricted DO condition; (B) rARU expression in ng/100 µl of extracted intracellular
                           fraction from 1 OD (corrected) culture of 3, 4, and 5 hours of cultures growing at unrestricted DO and restricted
                           DO condition; (C) mRNA fold change estimation of 3, 4, and 5 hours samples; (D) Principal component
                           analysis (PCA) of the microarray data; (E) Volcano plot showing distribution of up- and down-regulation genes
                           at unrestricted and restricted DO conditions with the p-value 0.05 and fold-change −1.5/+1.5 cut-off.

                           repeating units region (rARU), neutralized the enterotoxic and cytotoxic activity of the toxin13,14. This independ-
                           ent repeating unit region was also found to be an efficient carrier for conjugated polysaccharide vaccines15,16, and
                           as a result of this observation, the efficient expression of the subunits of toxins A and B for clinical experiments
                           is needed.
                               The expression of Clostridial proteins in E. coli is poor17,18, and is likely due to high AT content that may form
                           accidental polyadenylation sites that cause truncation of mRNA19,20. In addition, the presence of rarely used
                           codons for arginine (AGA) and leucine (ATA) may affect the completion of the translation and cause the expres-
                           sion of truncated proteins18,21–23. Improved expression was achieved by implementing different strategies such as
                           inserting sequences used frequently in E. coli for ATA and AGA tRNAs18, reducing growth temperature24,25, intro-
                           ducing chaperones, reducing acetate expression, and introducing rare amino acids and codon optimization24,26,27.
                           An overlooked option is the possibility of an interaction between the expressed recombinant proteins and the
                           host cellular machinery (e.g., RNA degradation and inhibition of cell growth caused by the expression of human
                           RNase L containing “ankyrin repeat” motifs in E. coli)28.
                               The issue of lower rARU yield could also be related to the unique sequence and the structural motifs present in
                           the Clostridial DNA. It was recently shown that certain recombinant proteins (e.g., proteins of a different nature
                           like soluble (xylanase and GFP) or inclusion body (Interferon β)) based on cellular localization (e.g., secreted
                           proteins (NprE, XynA, Usp45, TEM-1 β-lactamase), membrane proteins (LmrA and XylP), or lipoproteins (MntA
                           and YcdH)) caused different host cellular responses when overexpressed29,30. It is possible by using next genera-
                           tion sequencing tools to quantify the gene expression profile at different growth and production phases in order to
                           identify changes related to substrate consumption, central carbon metabolism, and energy metabolism based on
                           the sequence and structural features. Here we report that expressing C. difficile rARU from E. coli in a restricted
                           dissolved oxygen (DO) supply condition is 27-fold higher than expression obtained when regular conditions of
                           unrestricted DO are implemented. We hypothesized that the presence of cell wall binding profiles in the rARU is
                           the cause. Log and late-log phase samples from cultivations at restricted and unrestricted DO were investigated
                           by using transcriptomics and proteomics. The information obtained suggests that the cell wall binding segments
                           of the rARU have a role in gene expression by interacting with the cellular E. coli proteins.

                           Results
                           E. coli growth and rARU expression at restricted and unrestricted DO.                      Recombinant E. coli
                           BL21(DE3) containing pRSETb-rARU plasmid, was grown in Modified Terrific Broth containing glycerol, at
                           restricted and unrestricted (30% saturation) DO. At unrestricted DO, the culture reached late-log phase at OD600
                           of ~36 after ~5 hours, while at restricted DO the culture continued to grow and reached an OD600 of ~27 after
                           ~7.5 hours (Fig. 1A). Maximum rARU expression of 4.36 µg/optical density (OD) was obtained when the cells
                           grew in restricted DO, and 0.16 µg/OD when the culture grew at unrestricted DO (Fig. 1B). Transcription levels
                           of rARU at restricted and unrestricted DO are shown in Fig. 1C. After 3 hours of growth, rARU transcription at

Scientific Reports |   (2020) 10:3059 | https://doi.org/10.1038/s41598-020-59978-1                                                             2
www.nature.com/scientificreports/                                                            www.nature.com/scientificreports

                           Figure 2. Distribution of DEGs among the growth phases at restricted and unrestricted DO. (A) DEGs
                           obtained from ANOVA among late-log and log phase samples at restricted DO condition (late-log phase vs log
                           phase) and unrestricted DO condition (late-log phase vs log phase) and enrichment analysis of obtained gene
                           sets. (B) Venn categorization of DEGs and top enriched pathways identified in selected gene sets representing:
                           (a) gene set only down-regulated at unrestricted DO condition; (b) common gene set down-regulated at
                           unrestricted DO and restricted DO condition; (c) gene set down-regulated at unrestricted DO condition but
                           up-regulated at restricted DO; (d) gene set only up-regulated at unrestricted DO condition; (e) gene set only
                           down-regulated at restricted DO; and (f) gene set only up-regulated at restricted DO.

                           restricted DO was only 17% compared with the transcription at unrestricted DO. However, after 4 and 5 hours of
                           growth, it was 500%- and 472%- higher as compared with the unrestricted DO culture.

                           Microarray analysis of gene expression in E. coli producing rARU at restricted and unrestricted
                           DO. Samples in triplicate from E. coli producing rARU were collected from cultures grown at restricted and
                           unrestricted DO for profiling gene expression by microarray. Samples were taken after 3 hours when the cells were
                           at the log phase, and at 5 hours when the cells were at the late-log phase which is when rARU expression stopped
                           (Fig. 1A,B). Principal component analysis (PCA) performed on the microarray showed good correlation among
                           the replicates (Fig. 1D). The PCA data demonstrated that samples collected at log phase from cultures grown in
                           restricted and unrestricted DO were closer to each other, whereas, a significant difference was observed among
                           the late-log phase samples collected from the cultures grown in restricted and unrestricted DO.
                               Gene expression at the late-log phase was compared with gene expression at the log phase at both restricted
                           and unrestricted DO by performing a 1-way ANOVA and the results presented by Volcano plot analysis31.
                           Figure 1E showed a higher distribution of gene expression at unrestricted DO as compared with restricted DO.
                           By implementing filtration cutoff of log2 fold change of ≥1.5 ≤ and by using a p-value of ≤0.05, 3182 DEGs
                           (late-log vs log) were identified at unrestricted DO, and 1286 DEGs were identified at the restricted DO. From the
                           3182 genes identified as differentially expressed at the unrestricted DO, 1564 were up-regulated and 1618 were
                           down-regulated. From the 1286 DEGs identified at the restricted DO concentration, 547 were up-regulated and
                           739 were down-regulated (Supplementary Table 1). The culture grown at restricted DO showed a relatively stable
                           transition from log to late-log phase as the unrestricted DO culture showed a 2.5-times greater number of DEGs
                           in transition from log to late-log phase (Fig. 2A).

                           Gene enrichment of DEGs from venn analysis.                  The up-regulated and down-regulated gene sets from
                           the restricted and unrestricted aeration were analyzed using Venn diagram. When grown at unrestricted DO,
                           1564 DEGs were found to be up-regulated, and of these, 1208 were differentially expressed only in the unre-
                           stricted DO. While 349 of the 1564 DEGs were also found to be up-regulated at restricted DO, only 7 up-regulated
                           DEGs were found to be down-regulated at restricted DO. A significantly lower number of genes were differen-
                           tially expressed uniquely in the restricted DO culture; only 224 were down-regulated and 154 were up-regulated
                           (Fig. 2B).
                                Gene enrichment analysis was conducted on the gene sets extracted from the Venn analysis and only path-
                           ways with a p-value < 0.05 were considered (Supplementary Table 2). The 1208 genes that were up-regulated at
                           unrestricted DO were associated with carbohydrate metabolism, pyruvate metabolism, iron sulfur cluster, sulfur
                           relay system, osmotic stress, and oxidative stress. yggE is a periplasmic protein, which is associated with the
                           inner membrane and found to up-regulate under oxidative stress32. See Supplementary Table 1 for the complete
                           list of pathways with their enrichment scores and p-values as an outcome of gene enrichment analysis. The 349
                           up-regulated DEGs that were identified in both unrestricted and restricted DO were involved in catabolic pro-
                           cesses (e.g., organic acids, amino acids, small molecules), fatty acid metabolism, Tricarboxylic acid cycle (TCA),
                           and amino acid degradation. Seven up-regulated DEGs out of the 1564 were down-regulated in restricted DO. Of
                           these 7, 5 genes were related to membrane formation.
                                From the 1618 differentially down-regulated genes that were identified in the unrestricted DO culture, 1066
                           were down-regulated only in unrestricted DO (and not in the restricted DO). Therefore, it is possible that the

Scientific Reports |   (2020) 10:3059 | https://doi.org/10.1038/s41598-020-59978-1                                                          3
www.nature.com/scientificreports/                                                              www.nature.com/scientificreports

                           lower activities of these DEGs were associated with the lower expression of the protein at unrestricted DO. Most
                           of these 1066 DEGs were related to cellular processes like ribosome formation (52 DEGs with an enrichment
                           score of 26.9), aminoacyl-tRNA biosynthesis (19 DEGs with an enrichment score of 13.2), biosynthesis of amino
                           acids (48 DEGs with an enrichment score of 5.8), RNA polymerase (4 DEGs with an enrichment score of 5.8),
                           energy generating processes such as oxidative phosphorylation (21 DEGs with an enrichment score of 5.8), and
                           protein export (10 DEGs with an enrichment score of 3.5) were significantly down-regulated. This list of 1066
                           DEGs indicated that translation, amino acid biosynthesis, and energy generating processes were affected at the
                           unrestricted DO condition since all these functions were down-regulated.
                               From the same group of 1618 differentially down-regulated genes identified in the unrestricted DO, 508 were
                           down-regulated in both unrestricted and restricted DO cultures. These DEGs were associated with glycerophos-
                           pholipid metabolism (5 DEGs with an enrichment score of 4.9), purine metabolism (8 DEGs with an enrichment
                           score of 3.5), pyrimidine metabolism (6 DEGs with an enrichment score of 2.9), and biosynthesis of secondary
                           metabolites (15 DEGs with an enrichment score of 1.3).
                               Another group of genes from the 1618 differentially down-regulated genes at unrestricted DO were the 44
                           genes up-regulated in the restricted DO. The top pathways associated with this group belonged to the TCA cycle
                           (8 DEGs with an enrichment score of 19.8), carbon metabolism (9 DEGs with an enrichment score of 10.4), oxi-
                           dative phosphorylation (4 DEGs with an enrichment score of 5.5), fatty acid biosynthesis (2 DEGs with an enrich-
                           ment score of 3.9), ribosome formation (4 DEGs with an enrichment score of 3.3), and biosynthesis of secondary
                           metabolites (9 DEGs with an enrichment score of 3.1). This group of 44 genes is an indication that translation and
                           energy generating pathways were down-regulated in the unrestricted DO while the same cellular processes were
                           up-regulated in the restricted DO.
                               From the 1286 DEGs at restricted DO, 547 were up-regulated and 154 of the 547 were exclusively up-regulated
                           in restricted DO. These 154 DEGs were associated with energy generating pathways such as oxidative phospho-
                           rylation (6 DEGs with an enrichment score of 6.4), TCA cycle (3 DEGs with an enrichment score of 3.0), and
                           carbon metabolism (7 DEGs with an enrichment score of 3). From the same 1286 DEGs, 224 that were exclusively
                           down-regulated at the restricted DO were also overrepresented in processes related to ribosome formation (7
                           DEGs with an enrichment score of 5.4), biosynthesis of siderophore group non-ribosomal peptide (2 DEGs with
                           an enrichment score of 4.2), glycerolipid metabolism (2 DEGs with an enrichment score of 3.2), and biosynthesis
                           of secondary metabolites (13 DEGs with an enrichment score of 3.0).

                           Pathway analysis in E. coli producing rARU at restricted and unrestricted DO.                       Pathway anal-
                           ysis of the genes at log and late-log phases of the cultures grown at restricted and unrestricted DO was iden-
                           tified by the microarray. It was conducted by determining the overall gene expression flux through pathways
                           using the omics dashboard tool of EcoCyc33. The differential gene expression was estimated by applying a 1-way
                           ANOVA on samples from log and late-log phases of the restricted and unrestricted DO. After filtering out the
                           non-significant genes, the identified genes were grouped into major and sub-major pathways by EcoCyc.
                               The change in the gene expression at log and late-log phases of cellular functions related to biosynthesis,
                           energy metabolism, central dogma, heat and osmotic stress, and cell structural components at both aeration
                           conditions are shown in Fig. 3. The small dot represents fold change expression values for subsystem or individual
                           genes within the subsystem, while the large dot represents the average (mean) fold change expression values for
                           all the subsystems in that pathway. When the gene expression distribution in the log phase was compared, most
                           pathways behaved similarly at both restricted and unrestricted DO, which matched the correlation shown in the
                           PCA among the principal components of the microarray gene expression profiles.
                               As seen in Fig. 3, the large dots were close to the baseline representing no-significant difference when gene
                           expression of the log phase of restricted and unrestricted DO was compared. However, when the gene expression
                           distribution in the late-log phase was compared, significant differences associated with energy metabolism path-
                           ways were observed. A 4-fold increase in expression of genes associated with the TCA cycle and a 2-fold increase
                           in expression of genes associated with aerobic respiration in late-log restricted DO was observed as compared
                           with the late-log phase at unrestricted DO. At the same time, no significant change in the gene expression of gly-
                           colysis, pentose phosphate pathway (PPP), and fermentation was observed when the restricted and unrestricted
                           DO conditions were compared.
                               However, when processes such as translation, RNA metabolism, protein metabolism, and protein folding/
                           secretion were evaluated, there was an increase in overall gene expression of ~3.5, ~1, ~2 and ~1.5-fold, respec-
                           tively at restricted DO compared with unrestricted DO. Heat stress related genes showed a ~2-fold increase and
                           cell structural component synthesis processes like cell wall, plasma membrane, periplasmic membrane, and outer
                           membrane biosynthesis genes were differentially expressed.

                           Proteomics analysis. Proteomics analysis was performed on the same samples used for the gene expression
                           analysis. The PCA of the proteomics data showed correlation among the three replicates (Supplementary Fig. 1)
                           and were correlated with the sample distribution that was observed from the gene expression data. The proteom-
                           ics data were analyzed with a 1-way ANOVA and used a filtration cutoff of log2 fold change of ≥1.5≤ and p-value
                           of ≤ 0.05. The 167 down-regulated and 45 up-regulated differentially expressed proteins were detected when the
                           culture was transitioned from log to late-log (late-log vs log phase) at unrestricted DO. At restricted DO, 197 dif-
                           ferentially expressed proteins were up-regulated and 34 were down-regulated. The gene expression data were used
                           to identify affected pathways, and the proteomics data were used for confirmation at the protein level of identified
                           key genes. The complete proteomics data is provided in Supplementary Table 3.

                           Sequence feature analysis of rARU. By using ScanProsite34, 31 conserved cell wall binding motifs, each
                           composed of 20 amino acids (QNRFLHLLGKIYYFGNNSKA), were detected in the expressed rARU. BLASTp

Scientific Reports |   (2020) 10:3059 | https://doi.org/10.1038/s41598-020-59978-1                                                           4
www.nature.com/scientificreports/                                                             www.nature.com/scientificreports

                           Figure 3. Overall gene expression distribution flux through major metabolic processes at restricted compared
                           to unrestricted DO. (A) Energy metabolism, (B) Central dogma, (C) Biosynthesis, (D) Heat and osmotic stress,
                           and (E) Structural components. The large dot represents the average (mean) of all data and small dot represents
                           a data value for subsystem or an individual gene (generated with EcoCyc).

                           searches based on these motifs against the Protein Data Bank (PDB) database retrieved several highly similar
                           structures in different microorganisms (Supplementary Table 4). The main BLASTp hits were separated into
                           two types: a) single proteins (e.g., choline binding, dextransucrase, autolysin, and endolysin), and b) clostridium
                           Toxin A or Toxin B. Other hits were structures of toxin fragments bound to molecules such as single domain anti-
                           bodies (e.g., VHH, PA50 Fab), DARPin, the surface protein PspA [Streptococcus pneumoniae R6] (NP_357715.1),
                           and the cell wall protein [Clostridioides difficile 630] (YP_001089224.2).
                               VHH protein, as a known interactant of TcdA, was used to identify proteins in the E. coli that may have similar
                           structures to VHH, and therefore can unexpectedly interact with the recombinant TcdA. Therefore, subsequent
                           BLASTp searches were performed with single domain antibody sequence VHH (accession 4NC0_B) as a query
                           against the UniProtKB/Swiss-Prot (Swiss-Prot) database using DELTA-BLAST algorithm and word size adjusted
                           to 2. These searches retrieved a short fragment of E. coli UlaR protein (accessions P0A9W2.1 and B7UQK0.1)
                           which is a transcription regulator responsible for the utilization of l-ascorbate under anaerobic conditions. By
                           using PSI-BLAST with the A26.8 VHH protein sequence, the following proteins were identified: YahD (accession
                           number: P77736) and ArpA (accession number: P23325) (“ankyrin repeat” proteins), the outer membrane usher
                           protein HtrE (accession P33129.3), Formylglycinamide ribonucleotide amidotransferase (accession Q1R8H7.3),
                           DNA-invertase PinE (accession P03014.2), and Wzc protein (a Tyrosine-protein kinase required for the extracel-
                           lular polysaccharide colanic acid synthesis with relatively weak yet informative homologies).

                           Expression of enhanced green fluorescent protein (eGFP) fused to partial rARU sequence at
                           restricted and unrestricted DO. To assess if the reason for the difference in rARU expression in restricted
                           and unrestricted DO is associated with special properties of the rARU gene, the initial 300 and 600 bp sequence
                           of the rARU gene were fused with the eGFP gene. The resulting constructs were cloned in the pRSETb back-
                           bone creating pRSETb-300rARU + eGFP and pRSETb-600rARU + eGFP. The 300 and 600 bp of the rARU con-
                           tained 3 and 7 cell wall binding motifs respectively. The strain was transformed with the two plasmids and eGFP
                           expression was evaluated at restricted and unrestricted DO. The results in Fig. 4A,B showed that the expres-
                           sion of both fusion constructs was affected by the DO conditions. Expression of the 300rARU + eGFP and the
                           600rARU + eGFP fusion proteins were 1.8- and 1.99-fold higher in the log phase in cells grown at restricted DO
                           as compared with the log phase of cells grown at unrestricted DO. Correspondingly, late-log phase showed 2.8-
                           and 2.7-fold higher expression at restricted DO as compared with the unrestricted DO condition. The fold change
                           protein expression was calculated using IQTL (ImageQuant TL 8.2) image analysis software.

                           Discussion
                           Recombinant rARU from C. difficile was over expressed in E. coli only when the bacteria were grown at restricted
                           DO concentrations. Therefore, an optimized expression was established by supplying the growing culture with
                           2 vvm air that generated restricted DO conditions and supported ~27-fold higher rARU concentrations. The
                           possibility that the restricted DO conditions affected the T7 promoter was ruled out since at these conditions the
                           expression of the T7 RNA polymerase was not affected (Supplementary Figure 3).

Scientific Reports |   (2020) 10:3059 | https://doi.org/10.1038/s41598-020-59978-1                                                          5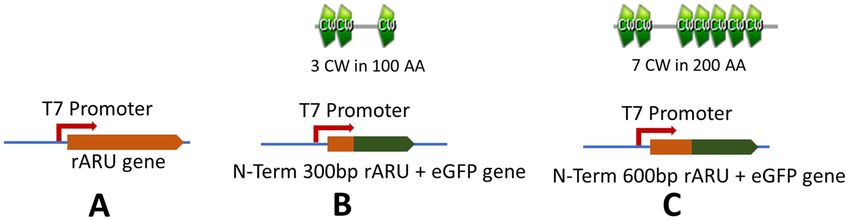
www.nature.com/scientificreports/                                                           www.nature.com/scientificreports

                           Figure 4. SDS-PAGE showing intracellular expression of eGFP and fusion proteins. (A) Log phase samples,
                           300rARU + GFP expression in lane 1 and 2 at restricted DO and unrestricted DO respectively; 600rARU + GFP
                           expression in lane 3 and 4 at restricted and unrestricted DO respectively; (B) Late-log phase samples,
                           300rARU + GFP expression in lane 5 and 6 at restricted DO and unrestricted DO respectively; 600rARU + GFP
                           expression in lane 7 and 8 at restricted and unrestricted DO respectively. The OD of the sample at harvest
                           are mentioned in the table shown in this figure (Sample OD600 during harvest). The marker lane and protein
                           band lanes were cropped from the same gel for clarity of results. The uncropped image of each gel provided in
                           Supplementary Fig. 2.

                           Transcriptomic and proteomic response to restricted and unrestricted DO.                     A larger number of
                           DEGs were down-regulated at unrestricted DO as compared with restricted DO. A total of 1618 DEGs were
                           down-regulated at unrestricted DO and of these, 1066 were down-regulated exclusively at unrestricted DO.
                           Particularly important is the down-regulation of the RNA polymerases (rpoB -5.67-fold, rpoC -4.46-fold, rpoZ
                           -3.39-fold and rpoA -6.58) which are essential for transcription initiation. In contrast, except for rpoD which
                           was down-regulated, rpoA, rpoC, and rpoZ were up-regulated at restricted DO (1.2-fold, 1.0-fold, and 1.31-fold
                           respectively). Since the translation process depends on the availability of ribosomes, amino acids, aminoacyl
                           tRNA, and ATP molecules, it is not surprising that the genes associated with these processes were also differ-
                           entially down-regulated in the unrestricted DO. This group includes 52 DEGs related to ribosome formation,
                           19 related to aminoacyl tRNA biosynthesis, 44 associated amino acid biosynthesis, and 17 involved in oxidative
                           phosphorylation. The down-regulation of genes associated with energy related metabolism, central metabolism,
                           and ribosomal RNA were previously shown to be associated with the cellular stress response (CSR) generated
                           during recombinant protein overexpression35,36. The down-regulation of the above-mentioned processes displays
                           a behavior that supports the lower amount of rARU expressed at unrestricted DO. Previous reports showed that
                           the presence of the rarely used codons of arginine and leucine in clostridial proteins is a possible bottleneck
                           in their translations18,21,22. The aminoacyl tRNA genes for arginine (argS) and leucine (leuS) in late-log phase
                           were up-regulated (f.c.1.9, and 1.67 respectively) at restricted DO condition as compared with unrestricted DO
                           condition.
                               In addition to the down-regulation of the DEGs mentioned above, genes associated with protein folding were
                           also down-regulated at unrestricted DO. This included the 24 heat shock response genes, an indication that,
                           rARU expression was too low to induce protein folding stress. Zhang et al. reported37 that during recombinant
                           protein expression, there is up-regulation of heat shock genes (chaperones and foldases) which are required for
                           proper folding37; however, a high expression of heat shock response genes was observed only when the cells grew
                           at restricted DO thereby indicating folding stress associated with higher rARU expression.
                               In both unrestricted and restricted DO, 508 DEGs were down-regulated and were associated with glycer-
                           ophospholipid, purine, and pyrimidine metabolism, and with the biosynthesis of secondary metabolites. The
                           plsY, glpC, glpQ, glpB, and glpD DEGs from the glycerophospholipid metabolism were down-regulated in

Scientific Reports |   (2020) 10:3059 | https://doi.org/10.1038/s41598-020-59978-1                                                       6
www.nature.com/scientificreports/ www.nature.com/scientificreports
unrestricted DO (−1.84-fold, −4.96-fold, −2.47-fold, −1.62-fold, and −4.99-fold respectively) and in restricted
DO (−1.63-fold, −8.69-fold, −4.97-fold, −2.38-fold, and −7.03-fold respectively). Glycerophospholipids are
essential components of the bacterial cell wall and fatty acid38 as well as for glycerol consumption through the
glycerol-3-phosphate regulon. The finding that the repressor of the glycerol-3-phosphate regulon (glpR) was
up-regulated higher in unrestricted DO (1.28-fold) as compared with restricted DO (1.03-fold) can explain the
higher inhibition of glycerol utilization at unrestricted DO.
Culture grown at restricted DO showed a smooth transition from log to late-log possibly because 2.5 times less
genes were differentially expressed as compared with unrestricted DO growth. Only 224 genes involved in ribo-
some formation, siderophore, and secondary metabolite biosynthesis were down-regulated when the cells grew in
restricted DO. The number of down-regulated ribosome formation related genes were 7.4 times less in restricted
DO compared with unrestricted DO, suggesting a possible reason for the increased translation at restricted
DO. At the same time, 154 DEGs were up-regulated only at restricted DO (Fig. 2) and these genes were associ-
ated with oxidative phosphorylation, TCA cycle, and carbon metabolism. The oxidative phosphorylation genes
sdhA (2.63-fold), cyoD (3.15-fold), sdhC (3.66-fold), cyoA (2.03-fold), and sdhB (1.67-fold) were up-regulated at
restricted DO whereas sdhA (−1.18-fold), cyoD (−1.06-fold), sdhC (−1.27-fold), cyoA (−1.31-fold), and sdhB
(−1.10-fold) were down-regulated at unrestricted DO. As indicated by all the above the transcription, translation,
and energy generating pathways were much more active at restricted DO in comparison with the unrestricted
DO.
Changes in the global regulators. The ArcA/ArcB two-component system involved in sensing oxygen
availability, acts by triggering oxidative response, regulates central carbon metabolism, and suppresses the TCA
cycle under anaerobic conditions39,40. No significant differences in the expression level of arcA and arcB at the two
growth conditions were observed and is an indication that there is no difference in the regulation of the central
carbon metabolism and the TCA cycle at restricted and unrestricted DO.
The global regulator lrp is a leucine-responsive transcriptional regulator which acts by down-regulating nutri-
ent uptake in rich medium41,42. lrp was up-regulated in restricted DO (1.6-fold), thus reducing nutrient uptake
and lowering growth. However, at unrestricted DO, lrp was down-regulated (−2.17-fold) which was associated
with higher glycerol consumption and a higher growth rate. The increase in glycerol consumption was also sup-
ported by the proteomic data which showed up-regulation of glycerol kinase GlpK (2.17-fold) at unrestricted DO
as compared to a 1.07-fold up-regulation at restricted DO condition.
The global regulator csrA affects ppGpp expression through relA, which changes σs behavior to affect the
transcription of stress survival genes and DNA replication43. csrA was found to be up-regulated at unrestricted
DO (2.07-fold higher) than at restricted DO (1.26-fold). Although no changes were observed concerning the relA
expression, there is a possibility that differential expression of csrA can affect various cellular processes by altering
the translation and stability of target molecules such as tRNA and rRNA44. The higher expression of csrA could be
the reason for down-regulating translation (ribosomal, tRNA, and amino acids) and energy-related genes at the
unrestricted DO condition.
The global DNA-binding transcriptional dual regulator fis, was up-regulated at restricted DO (1.92-fold) and
down-regulated at unrestricted DO (−4.27-fold). fis acts by controlling gyrase and changing the expression of
topoisomerase I45 and alleviates stress response, energy, and carbon metabolism processes. fis also up-regulates
processes involved in flagellar biosynthesis and translation (rRNA and tRNA genes)46. Therefore, it is possible that
fis down-regulation is the reason for down-regulating 54 genes associated with translation-related processes at
unrestricted DO. An additional transcriptional regulator that may have a possible role in different DO conditions
is the RNA chaperone hfq. This molecule binds to small RNA and is involved in elongating poly(A) tails and in
stabilizing mRNA47,48. However, there is a possibility that hfq can induce mRNA decay by sRNA mediated regu-
lation, which has been shown to be related to different growth conditions49. hfq was up-regulated (1.34-fold) at
restricted DO thereby potentially enhancing rARU mRNA level, and down-regulated (−1.33-fold) at unrestricted
DO possibly lowering rARU mRNA levels
Cell wall binding motifs in rARU. A ProSite scan showed that the expressed rARU gene
(Supplementary Table 5(S5a)) contained 31 cell wall binding repeats, each composed of 20 amino acids
(QNRFLHLLGKIYYFGNNSKA)50 belonging to the class PS51170 which has a unique structure. So far, only
15 protein sequences were identified to contain a similar cell wall binding repeat profile (Supplementary
Table 5(S5b)). The Blast search showed proteins with similar structures in E. coli that potentially can bind to
rARU (Supplementary Table 4). These were: the transcriptional repressor ulaR, the tyrosine protein kinase Wzc,
the outer membrane Usher protein HtrE, ankyrin proteins (YahD and ArpA), the phosphoribosylformylglycina-
mide synthetase PurL, and the site-specific DNA recombinase PinE. Additional interactions with cellular proteins
are possible due to the presence of the two cysteine residues in rARU, which can form disulfide bridges at high
dissolved oxygen levels.
The possibility that higher expression at restricted DO is likely due to the interaction between cell wall binding
motifs and cellular proteins and was further tested by the fusion of a partial rARU sequence containing cell wall
binding motifs with eGFP. Initially to capture the sequence feature, we fused 600 bp of rARU (with 7 cell wall
binding motifs) N-terminal region to eGFP to see if this affects the protein expression. As a result, the rARU
expression was higher at restricted DO. Then we tried smaller sequence size of 300 bp (with only 3 cell wall
binding motifs), which gave similar results. The expression of eGFP fused to both 300 and 600 bp of rARU at the
N-terminal region was higher at restricted DO. The selected 300 and 600 bp from the rARU N-terminal contained
respectively 3 and 7 cell wall binding repeats (Fig. 5), which was likely responsible for the higher expression at
restricted DO. Although the mechanism behind this interaction is unknown, it is possible that the interaction of
the rARU sequence with cellular proteins triggered a higher expression at restricted DO condition.
Scientific Reports | (2020) 10:3059 | https://doi.org/10.1038/s41598-020-59978-1 7www.nature.com/scientificreports/ www.nature.com/scientificreports
Figure 5. Gene cloning and fusion constructs. (A) pRSETb-rARU (original construct); (B) 300 bp of
N-terminal rARU fused with eGFP gene and cloned in place of rARU in original clone (pRSETb-[N-Term
300 bp rARU + eGFP gene]); (C) 600 bp of N-terminal rARU fused with eGFP gene and cloned in place of
rARU in original clone (pRSETb-[N-Term 600 bp rARU + eGFP gene]).
The interaction of rARU with the transcriptional repressor ulaR may influence the biosynthesis of NADH
and pentoses by affecting the L-ascorbate uptake51. ulaR operates by interaction with L-ascorbate-6-P and by
binding to the intergenic region of ulaA and ulaG and inhibition of the ulaABCDEF operon transcription. UlaR
was down-regulated in the late-log phase (ulaR f.c. −1.03) at restricted DO, which may cause the up regulation
of ulaG. As a result, ulaB, ulaD, ulaE, and ulaF of the ulaABCDEF operon remained active in the late log phase
of restricted DO enabling the cells to efficiently utilize L-ascorbate and support PPP to produce NADH and
pentoses.
The interaction of rARU with the “ankyrin like” proteins of E. coli such as YahD (yahD f.c. 1.25 at log phase
and f.c. 1.09 at late-log phase) and ArpA (arpA f.c. −1.05 at log phase and f.c. 1.54 at late-log phase) could also
interfere with the integrity of the cell membrane and affect cell growth. The “ankyrin repeat” containing proteins
were discovered in mammalian cells and were involved in cell signaling, regulation, and structural integrity.
A previous study on the overexpression of an “ankyrin repeat” containing protein (e.g., RNase L) caused RNA
degradation and inhibition of cell growth in E. coli28. Interestingly, the role of “ankyrin repeat” proteins at sign-
aling and regulatory levels was never explored in E. coli. A list of many other E. coli proteins which may possibly
interact with rARU is provided in Supplementary Table 4. The list includes the Wzc protein (wzc f.c. −1.12 at log
phase and f.c. −1.25 at late-log phase) which is involved in making exopolysaccharide colanic acid (M-antigen)
which increases E. coli’s ability to survive in environmental stresses52. Recently, this ability was shown to be regu-
lated through the master regulator csrA53, which was up-regulated at unrestricted DO in this study. A schematic
representing the state of the major metabolic processes and regulators in E. coli at restricted and unrestricted DO
during rARU expression are presented in Fig. 6.
Conclusion
Recombinant rARU, a partial fragment of Toxin A from the anaerobic bacterium C. difficile, was expressed effi-
ciently from E. coli only at low DO conditions. We observed that rARU transcript accumulation was highest
only when the culture was grown at a restricted DO concentration. It is very likely that this unusual expression
condition is an indication that a special gene sequence and structure of the produced protein are related to the
expression. Therefore, significant production was possible only by applying restricted DO growth strategy. A
possible reason for this special phenomenon was the presence of cell wall binding repeats motifs that allowed
transcription and translation at restricted DO and therefore increased its expression at these conditions. The role
of the heterologous protein sequence in the metabolic toxicity due to overexpression of recombinant proteins was
reported, but no analysis was performed to understand the functional features associated with the sequence and
how it interacted with the host cellular machinery54–56. This report demonstrated a connection between rARU
expression and restricted DO, which presents the possibility of the improved expression of other recombinant
proteins of anaerobic origin or of proteins that are associated with cell wall binding repeat profiles. The imple-
mented restricted DO expression strategy used in this work will likely improve the expression of other similar
proteins in E. coli.
Methods
Bacterial strain and expression vector. E. coli Tuner (DE3) pLacI/TZ56 [F- ompT hsdSB (rB- mB-)
gal dcm lacY1 (DE3) pLacI (CmR)] (Novagen, Madison, WI) was used for the growth and production experi-
ments. Expression plasmid pRSET-B-rARU-KanR containing rARU gene under T7 promoter was transformed
in the E. coli strain. The pRSET-B-rARU plasmid possesses kanamycin resistance along with entire C-terminal
repeating region of toxin A (rARU) (861 amino acids plus 4 amino acids upstream) having a Molecular weight
(MW) of 104 kDa16, along with a 6x His tag at the C-terminal. Both plasmid and strain were provided by TechLab,
Inc. (Blacksburg, VA). Two fusion constructs were designed consisting of partial N-terminal regions (i.e., 300 bp
and 600 bp of rARU with the eGFP). The fusion constructs were renamed as pRSET-B-300rARU + eGFP and
pRSET-B-600rARU + eGFP.
Media and culture conditions. Modified Terrific Broth (TB) media was used throughout the growth
experiments: 24 g/L yeast extract, 12 g/L Tryptone, 12.4 g/L K2HPO4, 2.35 g/L KH2PO4, 0.5 g/L MgSO4·7H2O,
1 ml/L of trace element solution (27 g/L FeCl3·6H2O, 2 g/L ZnCl2·4 H2O, 2 g/L CoCl2·6H2O, 2 g/L NaMoO4·2H2O,
1 g/L CaCl2·2H2O, 1 g/L CuCl2, 0.5 g/L H3BO3, 100 ml/L HCl concentrated57, and 25 mg/L kanamycin, supple-
mented with 15 g/L glycerol as indicated.
Scientific Reports | (2020) 10:3059 | https://doi.org/10.1038/s41598-020-59978-1 8www.nature.com/scientificreports/ www.nature.com/scientificreports
Figure 6. Schematic showing major processes and regulators differentially affected during rARU expression at
restricted and unrestricted DO.
Batch fermentation. Starter culture was grown overnight at 37 °C in 200 ml modified TB medium and
inoculated into 4.0 L medium in a B. Braun bioreactor. The cultures were grown at unrestricted DO and restricted
DO concentrations without addition of Isopropyl β- d-1-thiogalactopyranoside (IPTG). The unrestricted DO
(30%) condition was maintained with a constant supply of 2 vvm air cascaded to agitation, and the restricted DO
conditions were supplied with 2 vvm air and a fixed agitation of 650 rpm. pH was controlled at 7.0 by addition of
2 M NaOH and 10% H2CO3.
Samples for rARU, acetic acid, and total RNA were collected at regular intervals. After centrifugation at
14,000 g for 10 min at 4 °C, the supernatant was kept at −20 °C for glycerol and acetate analysis, and the cell pellets
were quickly frozen by dry ice and stored at −80 °C for RNA extraction. Biomass was monitored by measuring the
OD600. Glycerol and acetate concentration were determined using the Cedex Bio HT Analyzer (Roche, Penzberg,
Germany).
rARU quantification. Culture samples were diluted with 1X PBS to bring the cell concentration to 1.0 OD600
and the diluted culture was centrifuged at 16,000 g for 5 min, the supernatant was removed, and the pellet was fro-
zen at −20 °C. Each cell pellet was thawed and resuspended in 200 μl of lysis buffer (BugBuster Protein Extraction
Reagent, Novagen, Madison, WI). Processed samples were centrifuged at 16,000 g for 20 minutes at 4 °C, and
then supernatant was collected. The ELISA based method using monoclonal antibody conjugated to horseradish
peroxidase of C. difficile Toxin A and B II enzyme immunoassay kit (TechLab, Inc., Blacksburg, VA) was used for
quantitation of rARU in the processed supernatant (Fig. 1B). Purified rARU (List Biological Laboratories, Inc.
Campbell, CA) was used as the standard, and assay plates were read on UV/VIS microplate spectrophotometer
(SpectraMax190 Molecular Devices, Sunnyvale, CA) at 450 nm and 620 nm.
Total RNA purification and northern blot analysis. Total RNA was isolated with MasterPure RNA
Purification Kit (Epicentre Technologies, Madison, WI) which resulted in RNA with a A260/A280 ratio of 1.85–
1.95. To ensure equivalency between individual samples, the 23S and 16S rRNA from each sample were analyzed
by Agilent 2100 Bioanalyzer (Agilent Technologies, Santa Clara, CA) and the rRNA ratio (23S/16S) for all samples
was calculated to be greater than 1.5. The isolated RNA (5 ng/well) was separated using 1% agarose/formaldehyde
denaturing gel at 75 V. The gels were blotted on Nytran Super Charge membrane (11 cm × 14 cm) (Schleicher &
Schuell, Keene, NH) at room temperature (25 °C) in 20 X SSC, and the membranes were fixed by UV-induced
cross-linking. Amplification of DNA fragments of rARU gene were performed using the following primers:
Forward primer: 5′-TGCACCTGCTAATACGGATG-3′; Reverse primer: 5′-GCCATCCAGTAACTGCAACA-3′.
PCR products were purified and labeled with 32P using Ready-To-Go DNA Labelling Beads (Amersham
Pharmacia Biotech, Piscataway, NJ) and were purified by Probe Quant G-50 Micro column (Amersham
Pharmacia Biotech, Piscataway, NJ). Hybridization with 32P-labeled DNA probes was performed with Quickhyb
Scientific Reports | (2020) 10:3059 | https://doi.org/10.1038/s41598-020-59978-1 9www.nature.com/scientificreports/ www.nature.com/scientificreports
solution (Stratagene, La Jolla, CA) as recommended by the manufacturer. Northern blots were repeated in tripli-
cate to verify reproducibility and quantification was performed by phosphor image scanning.
rARU and T7 RNA polymerase mRNA quantitation with qPCR. Total RNA was extracted from
cultures grown at restricted and unrestricted DO conditions. The extracted RNA was converted to cDNA
using maxima first strand cDNA synthesis kit (Thermo Scientific, Waltham, MA). The cDNA was used as
the template for qPCR amplification of the rARU gene transcript and used the following thermocycler steps:
1 cycle: 95 °C for 10 min; 40 cycles: 95 °C for 15 sec, 60 °C for 1 min. The primers used were: Forward primer:
5′-TGCACCTGCTAATACGGATG-3′; and Reverse primer: 5′-GCCATCCAGTAACTGCAACA-3′. The primers
used for the T7 RNA polymerase were: Forward primer: 5′-ACAGCCTTCCAGTTCCTGCAAGAAATCAAG-3
′; and Reverse primer: 5′-CATTTTGGCGGTGTAAGCTAACCATTCCGG-3′. The thermocycler steps used for
the qPCR amplification of T7 RNA polymerase transcript were: 1 cycle: 95 °C for 3 min; 39 cycles: 95 °C for 10 sec,
60 °C for 40 sec.
Transcriptomic profiling with microarray. RNA isolation. culture samples were treated with RNA pro-
tect, the suspension was centrifuged at 5000 rpm for 10 min and the pellet was resuspended in TRIzol reagent
(Life Technologies, Carlsbad, CA) and immediately frozen in dry ice and stored at −80 °C. RNA was extracted
by suspension of the cell pellets in 0.5% SDS, 20 mM NaAc, and 10 mM EDTA and extracted twice with hot acid
phenol: chloroform, followed by 2 additional extractions in phenol: chloroform isoamyl alcohol. Absolute ethanol
was added, the extract stored at −80 °C for 15 min, and then the stored RNA extract was centrifuged at 14,000 g
for 15 min and washed with 70% ethanol and dried. The dried pellet was resuspended in ultrapure water (KD
Medical, Columbia, MD) and was evaluated in a Bioanalyzer (Agilent, Santa Clara, CA) using RNA integrity
number > 8.0 as a metric of sample quality. To avoid batch effect, all samples were extracted at the same time.
™
DNase treatment. The extracted RNA samples were further treated with the TURBO DNase (Invitrogen/
Novex, Carlsbad, CA) to remove trace amount of DNA. The absence of DNA in the samples was confirmed with
qPCR of housekeeping genes, and no amplification was observed up to 25 cycles.
Hybridization and scanning. Microarrays were performed with samples of RNA from log (3 hours) and late-log
(5 hours) growth phases. The DNase treated RNA samples were processed, hybridized on microarray chip,
and scanned at the genomics core facility (University of Maryland School of Medicine, Center for Innovative
Biomedical Resources, Baltimore, MD). Raw data obtained from probe intensities were processed using Partek
Genomics Suite 7.0 software (Partek, St. Louis, MO).
Proteomics with LC/MS/MS. Peptides were obtained from each sample with reduction and alkylation of
cysteines using a detergent approach58. One-third of peptides obtained from each sample were pooled together.
The pool and the remaining sample were loaded (separately) on C8/C18 STAGE tips and subjected to on-column
reductive demethylation59 with each sample receiving one label from the pool and one from the remaining sam-
ple. After elution, the same portion of the pool elute was added to each sample eluate, and these thoroughly
“doped” samples were dried under nitrogen and analyzed as described previously60.
Statistical analysis. Time point samples were processed using biological triplicates from three different
batch runs on different dates. ANOVA was performed to compare transcriptomic profiles among log and late-log
phase samples at unrestricted DO and restricted DO. Significant DEGs were obtained by using filtering criteria of
p-value and fold change cut-off of less than or equal to 0.05 and 1.5 respectively.
Microarray and proteomics data analysis. Raw microarray data were processed and normalized using
Partek Genomics Suite7.0 and annotations for E. coli BL21 were used to identify the gene ID. The normalized
data files were analyzed with PCA to determine the significant differences in the spatial distribution among the
populations of biological replicates from the different samples collected from cultures growing at unrestricted
(30%) and restricted DO conditions.
Twelve samples were processed: three biological replicates from two time points (log and late-log phase)
from each growth condition for both microarray and proteomics studies. Fold change values were calculated
among two different contrasts: 1a) log phase (restricted DO) vs log phase (unrestricted DO), and 1b) late-log
phase (restricted DO) vs late-log phase (unrestricted DO); and 2a) restricted DO condition (late-log phase vs log
phase), and 2b) unrestricted DO (late-log phase vs log phase). Each comparison was performed using ANOVA
to generate fold change values among the two groups (ANOVA estimates the geometric means of the samples in
each group to calculate the fold change for the contrast conditions chosen).
The significant DEGs were identified by applying a filtering criterion of >1.5 andwww.nature.com/scientificreports/ www.nature.com/scientificreports
Structural analysis. ScanProsite was used to detect the motifs in the expressed gene34. Sequence search-
ing was done with Protein BLAST (BLASTp, version 2.8.1) using the web interface at the National Center for
Biotechnology Information (NCBI), National Library of Medicine. BLASTp search parameters were used at the
default setting except that the expect threshold was set to 1 and word size set to 3, and the searches were run
against the Protein Data Bank (PDB) database.
Data availability
The datasets supporting the conclusions of this article are available in the [NCBI Gene Expression Omnibus
(GEO)] database [accession number: GSE131635].
Received: 8 August 2019; Accepted: 6 February 2020;
Published: xx xx xxxx
References
1. Curcio, D., Cane, A., Fernandez, F. A. & Correa, J. Clostridium difficile-associated diarrhea in developing countries: A systematic
review and meta-analysis. Infect Dis Ther 8, 87–103, https://doi.org/10.1007/s40121-019-0231-8 (2019).
2. Burke, K. E. & Lamont, J. T. Clostridium difficile infection: A worldwide disease. Gut Liver 8, 1–6, https://doi.org/10.5009/
gnl.2014.8.1.1 (2014).
3. Di Bella, S., Ascenzi, P., Siarakas, S., Petrosillo, N. & di Masi, A. Clostridium difficile toxins a and b: Insights into pathogenic
properties and extraintestinal effects. Toxins (Basel) 8, https://doi.org/10.3390/toxins8050134 (2016).
4. Kuehne, S. A. et al. The role of toxin a and toxin b in clostridium difficile infection. Nature 467, 711–713, https://doi.org/10.1038/
nature09397 (2010).
5. Barroso, L. A., Moncrief, J. S., Lyerly, D. M. & Wilkins, T. D. Mutagenesis of the clostridium difficile toxin b gene and effect on
cytotoxic activity. Microb Pathog 16, 297–303, https://doi.org/10.1006/mpat.1994.1030 (1994).
6. Alfa, M. J. et al. Characterization of a toxin a-negative, toxin b-positive strain of clostridium difficile responsible for a nosocomial
outbreak of clostridium difficile-associated diarrhea. J Clin Microbiol 38, 2706–2714 (2000).
7. Quemeneur, L. et al. Clostridium difficile toxoid vaccine candidate confers broad protection against a range of prevalent circulating
strains in a nonclinical setting. Infect Immun 86, https://doi.org/10.1128/IAI.00742-17 (2018).
8. Foglia, G., Shah, S., Luxemburger, C. & Pietrobon, P. J. Clostridium difficile: Development of a novel candidate vaccine. Vaccine 30,
4307–4309, https://doi.org/10.1016/j.vaccine.2012.01.056 (2012).
9. Pizarro-Guajardo, M., Chamorro-Veloso, N., Vidal, R. M. & Paredes-Sabja, D. New insights for vaccine development against
clostridium difficile infections. Anaerobe 58, 73–79, https://doi.org/10.1016/j.anaerobe.2019.04.009 (2019).
10. Cole, L. E. et al. Deciphering the domain specificity of c. Difficile toxin neutralizing antibodies. 37, 3892–3901 (2019).
11. Quemeneur, L. et al. Clostridium difficile toxoid vaccine candidate confers broad protection against a range of prevalent circulating
strains in a nonclinical setting. 86, e00742–00717 (2018).
12. Riley, T., Lyras, D. & Douce, G. J. V. Status of vaccine research and development for clostridium difficile. (2019).
13. Marozsan, A. J. et al. Protection against clostridium difficile infection with broadly neutralizing antitoxin monoclonal antibodies. J
Infect Dis 206, 706–713, https://doi.org/10.1093/infdis/jis416 (2012).
14. Giannasca, P. J. et al. Serum antitoxin antibodies mediate systemic and mucosal protection from clostridium difficile disease in
hamsters. Infect Immun 67, 527–538 (1999).
15. Wilkins, T. D., Lyerly, D. M., Moncrief, J. S., Zheng, L. & Phelps, C. (Google Patents, 2004).
16. Pavliakova, D. et al. Clostridium difficile recombinant toxin a repeating units as a carrier protein for conjugate vaccines: Studies of
pneumococcal type 14, escherichia coli k1, andshigella flexneri type 2a polysaccharides in mice. 68, 2161–2166 (2000).
17. Mani, N. & Dupuy, B. Regulation of toxin synthesis in clostridium difficile by an alternative rna polymerase sigma factor. Proc Natl
Acad Sci USA 98, 5844–5849, https://doi.org/10.1073/pnas.101126598 (2001).
18. Spanjaard, R. A., Chen, K., Walker, J. R. & van Duin, J. Frameshift suppression at tandem aga and agg codons by cloned trna genes:
Assigning a codon to argu trna and t4 trna(arg). Nucleic Acids Res 18, 5031–5036 (1990).
19. Zdanovsky, A. G. & Zdanovskaia, M. V. Simple and efficient method for heterologous expression of clostridial proteins. Appl Environ
Microbiol 66, 3166–3173 (2000).
20. Clayton, M. A., Clayton, J. M., Brown, D. R. & Middlebrook, J. L. Protective vaccination with a recombinant fragment of clostridium
botulinum neurotoxin serotype a expressed from a synthetic gene in escherichia coli. Infect Immun 63, 2738–2742 (1995).
21. Mualif, S. A. et al. Engineering and validation of a vector for concomitant expression of rare transfer rna (trna) and hiv-1 nef genes
in escherichia coli. PLoS One 10, e0130446, https://doi.org/10.1371/journal.pone.0130446 (2015).
22. Hatfield, G. W. & Roth, D. A. Optimizing scaleup yield for protein production: Computationally optimized DNA assembly (coda)
and translation engineering. Biotechnol Annu Rev 13, 27–42, https://doi.org/10.1016/S1387-2656(07)13002-7 (2007).
23. Makoff, A. J., Oxer, M. D., Romanos, M. A., Fairweather, N. F. & Ballantine, S. Expression of tetanus toxin fragment c in e. Coli: High
level expression by removing rare codons. Nucleic Acids Res 17, 10191–10202 (1989).
24. Morales, L., Hernandez, P. & Chaparro-Olaya, J. Systematic comparison of strategies to achieve soluble expression of plasmodium
falciparum recombinant proteins in e. Coli. Mol Biotechnol 60, 887–900, https://doi.org/10.1007/s12033-018-0125-0 (2018).
25. Choi, T. J. & Geletu, T. T. High level expression and purification of recombinant flounder growth hormone in e. Coli. J Genet Eng
Biotechnol 16, 347–355, https://doi.org/10.1016/j.jgeb.2018.03.006 (2018).
26. Nannenga, B. L. & Baneyx, F. Reprogramming chaperone pathways to improve membrane protein expression in escherichia coli.
Protein Sci 20, 1411–1420, https://doi.org/10.1002/pro.669 (2011).
27. de Marco, A., Deuerling, E., Mogk, A., Tomoyasu, T. & Bukau, B. Chaperone-based procedure to increase yields of soluble
recombinant proteins produced in e. Coli. BMC Biotechnol 7, 32, https://doi.org/10.1186/1472-6750-7-32 (2007).
28. Pandey, M. & Rath, P. C. Expression of interferon-inducible recombinant human rnase l causes rna degradation and inhibition of
cell growth in escherichia coli. Biochem Biophys Res Commun 317, 586–597, https://doi.org/10.1016/j.bbrc.2004.03.083 (2004).
29. Marciniak, B. C., Trip, H., van-der Veek, P. J. & Kuipers, O. P. Comparative transcriptional analysis of bacillus subtilis cells
overproducing either secreted proteins, lipoproteins or membrane proteins. Microb Cell Fact 11, 66, https://doi.org/10.1186/1475-
2859-11-66 (2012).
30. Sharma, A. K., Mahalik, S., Ghosh, C., Singh, A. B. & Mukherjee, K. J. Comparative transcriptomic profile analysis of fed-batch
cultures expressing different recombinant proteins in escherichia coli. AMB Express 1, 33, https://doi.org/10.1186/2191-0855-1-33
(2011).
31. Li, W. Volcano plots in analyzing differential expressions with mrna microarrays. J Bioinform Comput Biol 10, 1231003, https://doi.
org/10.1142/S0219720012310038 (2012).
32. Kim, S. Y. et al. The gene ygge functions in restoring physiological defects of escherichia coli cultivated under oxidative stress
conditions. Appl Environ Microbiol 71, 2762–2765, https://doi.org/10.1128/AEM.71.5.2762-2765.2005 (2005).
33. Paley, S. et al. The omics dashboard for interactive exploration of gene-expression data. Nucleic Acids Res 45, 12113–12124, https://
doi.org/10.1093/nar/gkx910 (2017).
Scientific Reports | (2020) 10:3059 | https://doi.org/10.1038/s41598-020-59978-1 11You can also read