Analyses of allele-specific gene expression in highly divergent mouse crosses identifies pervasive allelic imbalance
←
→
Page content transcription
If your browser does not render page correctly, please read the page content below
Articles

                                                   Analyses of allele-specific gene expression in highly
                                                   divergent mouse crosses identifies pervasive
                                                   allelic imbalance
                                                   James J Crowley1,10, Vasyl Zhabotynsky1,10, Wei Sun1,2,10, Shunping Huang3, Isa Kemal Pakatci3, Yunjung Kim1,
                                                   Jeremy R Wang3, Andrew P Morgan1,4,5, John D Calaway1,4,5, David L Aylor1,9, Zaining Yun1, Timothy A Bell1,4,5,
                                                   Ryan J Buus1,4,5, Mark E Calaway1,4,5, John P Didion1,4,5, Terry J Gooch1,4,5, Stephanie D Hansen1,4,5,
© 2015 Nature America, Inc. All rights reserved.

                                                   Nashiya N Robinson1,4,5, Ginger D Shaw1,4,5, Jason S Spence1, Corey R Quackenbush1, Cordelia J Barrick1,
                                                   Randal J Nonneman1, Kyungsu Kim2, James Xenakis2, Yuying Xie1, William Valdar1,4, Alan B Lenarcic1,
                                                   Wei Wang3,9, Catherine E Welsh3, Chen-Ping Fu3, Zhaojun Zhang3, James Holt3, Zhishan Guo3,
                                                   David W Threadgill6, Lisa M Tarantino7, Darla R Miller1,4,5, Fei Zou2,11, Leonard McMillan3,11,
                                                   Patrick F Sullivan1,5,7,8,11 & Fernando Pardo-Manuel de Villena1,4,5,11

                                                   Complex human traits are influenced by variation in regulatory DNA through mechanisms that are not fully understood. Because
                                                   regulatory elements are conserved between humans and mice, a thorough annotation of cis regulatory variants in mice could
                                                   aid in further characterizing these mechanisms. Here we provide a detailed portrait of mouse gene expression across multiple
                                                   tissues in a three-way diallel. Greater than 80% of mouse genes have cis regulatory variation. Effects from these variants influence
                                                   complex traits and usually extend to the human ortholog. Further, we estimate that at least one in every thousand SNPs creates a
                                                   cis regulatory effect. We also observe two types of parent-of-origin effects, including classical imprinting and a new global allelic
                                                   imbalance in expression favoring the paternal allele. We conclude that, as with humans, pervasive regulatory variation influences
                                                   complex genetic traits in mice and provide a new resource toward understanding the genetic control of transcription in mammals.

                                                   The genetic basis of most phenotypic variation can be assigned to                    hybrids to detect and quantify statistically significant allelic imbal-
                                                   variation in protein-coding, RNA or regulatory sequences. The                        ance in expression for as many genes as possible.
                                                   importance of regulatory sequence has become increasingly appar-                        Previous publications have examined allelic imbalance in F1 mice
                                                   ent in recent studies comparing divergent taxa and populations 1–4                   using RNA sequencing (RNA-seq) (Supplementary Table 1). Four
                                                   and through the identification of thousands of SNPs that, although                   studies examined brain9–12, one reported multiple tissues4, two
                                                   not predicted to change protein structure, are nonetheless strongly                  used fetal placenta13,14, one used adult liver15 and one used whole
                                                   associated with human diseases and biomedical traits5–8. Here we                     embryo16. However, some of the conclusions of these RNA-seq
                                                   investigated the effects of genetic variation and parental origin on                 studies have been controversial17. A particularly controversial issue is
                                                   gene expression in multiple tissues in laboratory mice. The study                    the number of mouse genes subject to imprinting. Previous consensus
                                                   design maximized the level of genetic variation while concurrently                   estimates placed the number of imprinted genes in mouse at 100–200
                                                   enhancing the capacity to assign transcripts to either one of the two                (ref. 18). An early application of RNA-seq in brain tissue yielded a
                                                   parental alleles. Examination of allele-specific expression (ASE) can                small number of new imprinted transcripts9, but 2 subsequent studies
                                                   be used to detect allelic imbalance in transcription in heterozygous                 claimed identification of >1,300 new imprinted loci10,11, including
                                                   mice, a process that requires genetic or epigenetic variation in cis.                347 autosomal genes with sex-specific imprinting11. A reanalysis did
                                                   Therefore, we designed our experiment to include reciprocal F1                       not replicate these claims12.

                                                   1Department   of Genetics, University of North Carolina at Chapel Hill, Chapel Hill, North Carolina, USA. 2Department of Biostatistics, University of North Carolina
                                                   at Chapel Hill, Chapel Hill, North Carolina, USA. 3Department of Computer Science, University of North Carolina at Chapel Hill, Chapel Hill, North Carolina, USA.
                                                   4Lineberger Comprehensive Cancer Center, University of North Carolina at Chapel Hill, Chapel Hill, North Carolina, USA. 5Carolina Center for Genome Sciences,

                                                   University of North Carolina at Chapel Hill, Chapel Hill, North Carolina, USA. 6Department of Molecular and Cellular Medicine, Texas A&M Health Science Center,
                                                   College Station, Texas, USA. 7Department of Psychiatry, University of North Carolina at Chapel Hill, Chapel Hill, North Carolina, USA. 8Department of Medical
                                                   Epidemiology and Biostatistics, Karolinska Institutet, Stockholm, Sweden. 9Present addresses: Department of Biological Sciences, North Carolina State University,
                                                   Raleigh, North Carolina, USA (D.L.A.) and Department of Computer Science, University of California, Los Angeles, Los Angeles, California, USA (W.W.). 10These
                                                   authors contributed equally to this work. 11These authors jointly supervised this work. Correspondence should be addressed to F.P.-M.d.V. (fernando@med.unc.edu).

                                                   Received 17 September 2014; accepted 26 January 2015; published online 2 March 2015; doi:10.1038/ng.3222

Nature Genetics ADVANCE ONLINE PUBLICATION 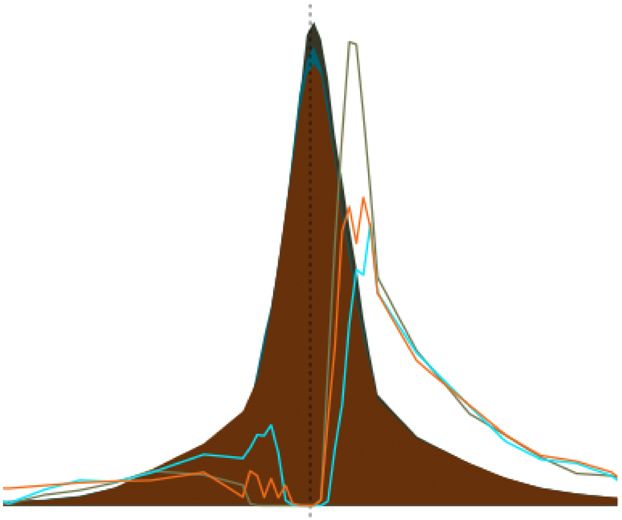
Articles

                                                      In the context of these findings, we sought to improve knowledge of the   indicating that the predominant predictor of gene expression is tis-
                                                   control of gene expression in mouse. To maximize generalizability, we        sue type, even in the presence of extreme genetic diversity and rep-
                                                   studied related but divergent genomes. We selected three inbred mouse        resentation of both sexes. After tissue, the samples partitioned by
                                                   strains (CAST/EiJ, PWK/PhJ and WSB/EiJ) representative of three              strain, then by parent of origin and finally by sex. Microarray data
                                                   subspecies within the Mus musculus species group (M. m. castaneus,           also showed that, across different tissues, strain effects are commonly
                                                   M. m. musculus and M. m. domesticus, respectively). We chose these           shared (Supplementary Fig. 3b), suggesting that regulatory variation
                                                   strains to maximize the level of genetic diversity (for example, 27.7        across diverse tissues often acts in a similar manner. Brain RNA-seq
                                                   million SNPs and 4.6 million indels vary in these strains4), the number      total read counts and microarray intensity values were highly cor-
                                                   of genes with expressed SNPs and/or indels (31,259 of 36,817 Ensembl         related (median r = 0.86, range of 0.84–0.87).
                                                   v37 genes) and the number of such variants per gene (mean of 19.9,              Within each tissue, the overwhelming driver of differential gene
                                                   s.d. of 26.9).                                                               expression was strain; this effect greatly exceeded the effects from
                                                      We conducted all possible pairwise crosses to form a 3 × 3 diallel        parent of origin and sex (Fig. 2). For RNA-seq, the first two principal
                                                   (Fig. 1) and measured gene expression in brain, liver, kidney and            components accounted for ~30% of the total variation in autosomal
                                                   lung with age- and sex-matched biological replicates for each of the         total read count (TReC). The remaining top ten principal components
                                                   nine possible genotypic combinations. We used RNA-seq to measure             were also strongly determined by strain and, to a far lesser extent,
                                                   ASE in brain and microarrays to assess gene expression in brain, liver,      parent of origin and sex, with no notable effects from the barcodes
                                                   kidney and lung. Inclusion of the array data allowed a detailed com-         used for multiplexing (Supplementary Table 3).
                                                   parison of two major platforms for expression analysis, determination           Within each tissue, the three inbred strains formed an equilateral
                                                   of the proportion of genetic effects that are missed by examining a          triangle with the F1 samples located midway between the correspond-
                                                   single tissue and estimation of the degree to which strain, sex and          ing parental strains (Fig. 2). This indicates that there was no overall
© 2015 Nature America, Inc. All rights reserved.

                                                   parent-of-origin effects in brain are reproduced in other tissues.           bias in the alignment of RNA-seq reads to these three equally diver-
                                                      In designing this experiment, we attempted to optimize the dis-           gent genomes. We also determined that the genetic architecture of
                                                   covery of regulatory variation and to address potential pitfalls             regulatory variation in laboratory mice was mostly additive, as the F 1
                                                   (Supplementary Table 2). In particular, we included three genomes            samples would not be located midway between the parental strains if
                                                   instead of two, allowing us to generalize our conclusions, to estimate       dominance and parent-of-origin effects predominated.
                                                   the proportion of variants that have a cis regulatory effect and to assist
                                                   the aims of large-scale projects such as the International Knockout          Cis regulatory variation is pervasive in diverse mice
                                                   Mouse Consortium19, Collaborative Cross20 and Diversity Outbred21.           We found cis regulatory effects for 11,287 autosomal genes (89% of
                                                   We also increased the depth of sequencing and the number of                  testable genes). More than 75% of these genes showed consistent addi-
                                                   replicates and included both sexes to improve power to detect ASE.           tive effects, defined by having an additive TReC effect and an additive
                                                   We developed a new approach to diploid genome alignment to cus-              allele-specific read count (ASReC) effect in the same direction within
                                                   tomized genomes (‘pseudogenomes’)22–24 created from the highest              a cross. For example, Mad1l1 showed allelic imbalance in expression
                                                   quality and most current genomic data available4.                            for all three crosses, indicating that, at the cis level, the PWK/PhJ
                                                      Allelic imbalance in expression for an F1 mouse requires the pres-        allele is stronger than the WSB/EiJ allele, which in turn is stronger
                                                   ence of a genetic or epigenetic regulatory variant acting in cis, as         than the CAST/EiJ allele (Supplementary Fig. 4). Furthermore, this
                                                   trans-acting factors have an equal opportunity to affect both alleles        cis effect is consistent with the differential gene expression of the
                                                   (Supplementary Fig. 1). Regulatory variation in cis causes differential      parental inbreds, and the level of gene expression in the F1 mice can
                                                   expression from the linked allele, which is detected by a statistically      be explained as an additive effect. Some fraction of cis regulatory
                                                   significant imbalance in the ASE derived from each parental allele           variants create strain effects that are undetectable in TReC or incon-
                                                   in an F1 mouse (Supplementary Fig. 2). We observe cis regulatory             sistent between TReC and ASReC, owing to dominance and other
                                                   effects for >80% of all testable genes. We also found that the number        effects. For example, Fos showed allelic imbalance in all F1 mice in a
                                                   of imprinted genes was not substantially different from historical           manner consistent with TReC in the parental inbreds, but the total
                                                   estimates, but we report a new genome-wide parent-of-origin allelic          levels of gene expression in the F1 mice were best explained as an
                                                   imbalance favoring expression of the paternal allele.                        effect of dominance or overdominance (Supplementary Fig. 5). Copy
                                                                                                                                number variation can also lead to inconsistency between TReC and
                                                   RESULTS                                                                      ASReC and result in underestimation of the number of genes with
                                                   Major drivers of differential gene expression in mice                        cis effects.
                                                   We hybridized brain, liver, kidney and lung RNA samples from the
                                                   same mice used for RNA-seq to expression microarrays. Clustering                                                                 Sire

                                                   of gene expression data from 384 microarrays (4 tissues × 96 samples)
                                                   partitioned the samples perfectly by tissue (Supplementary Fig. 3a),
                                                                                                                                                                                    PWK/PhJ
                                                                                                                                                                     CAST/EiJ

                                                                                                                                                                                                  WSB/EiJ

                                                   Figure 1 Diallel crossing scheme and sample sizes. We selected
                                                   three divergent inbred strains representative of three subspecies
                                                   within the M. musculus species group. We generated offspring from all
                                                                                                                                                      CAST/EiJ   5     ,2       6     ,4      6     ,6
                                                   possible pairwise crosses to form a 3 × 3 diallel, including age- and
                                                   sex-matched biological replicates for each of the nine possible genotypic
                                                   combinations. Mice were aged to 23 d and killed, and total RNA was                     Dam         PWK/PhJ    6     ,6       6     ,2      5     ,5
                                                   extracted from whole brain, liver, kidney and lung. The sample size
                                                   shown is for RNA-seq (52 females, 39 males). RNA-seq was performed
                                                   on RNA extracted from brain, and microarrays were run on RNA extracted                             WSB/EiJ    6     ,6       6     ,6      6     ,2
                                                   from brain, liver, kidney and lung.

                                                                                                                                               aDVANCE ONLINE PUBLICATION                    Nature Genetics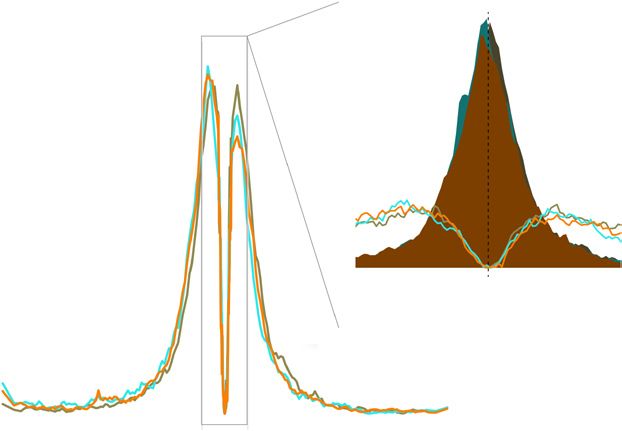
Articles
Figure 2 Principal components (PCs) of brain a PWK/PhJ
b Brain
0.2
Liver
RNA-seq and microarray expression levels across 0.2
15 0.1
four tissues. Each point represents one mouse, 0.1
PC2
PC2
with shape indicating sex (circle, female; square, 0 0
male) and color indicating genotype. For the F1 10
–0.1 –0.1
mice, the outer color indicates the maternal strain –0.2 –0.2
and the inner color indicates the paternal strain. 5
.2
.1
0
1
2
.2
.1
0
1
2
(a) PC1 versus PC2 of the brain RNA-seq TReC for
0.
0.
0.
0.
–0
–0
–0
–0
PC2
all autosomal genes. The three inbred strains form PC1 PC1
0 Lung
a near-perfect triangle with the F1 samples located 0.2
Kidney
0.2
between their corresponding parental strains. 0.1 0.1
PC1 and PC2 account for 31% of the variance in –5
PC2
0
PC2
0
TReC, indicating that genetic background is the
WSB/EiJ –0.1 –0.1
overwhelming driver of gene expression difference, –10
CAST/EiJ –0.2 –0.2
with its effect greatly exceeding those of parent of
origin and sex. (b) PC1 versus PC2 of microarray
.2
.1
0
1
2
.2
.1
0
1
2
–10 –5 0 5 10 15
0.
0.
0.
0.
–0
–0
–0
–0
expression values for all autosomal genes across
PC1 PC1 PC1
four tissues. The pattern seen in brain extends to
multiple diverse tissues.
Of the 11,287 autosomal genes with cis regulatory effects, 4,113 (n = 15,312 genes; see URLs). Brain-expressed genes with a cis regula-
(36%) were detected for all 3 pairs of strains, 5,065 (45%) were tory effect in mouse were much more likely to have a human periph-
© 2015 Nature America, Inc. All rights reserved.
detected for 2 pairs and 2,109 (19%) were detected for 1 pair (Fig. 3a). eral blood eQTL (P = 7.8 × 10⁻¹⁰)25. Published human brain eQTL
Notably, all three subspecies contributed similarly to differential gene studies had much smaller samples sizes; nonetheless, when comparing
expression, indicating that there was no overall bias in read align- our results to a meta-analysis26 of 5 available data sets (total n = 439),
ment to any one genome. Furthermore, the fold-change distribution we observed consistent enrichment (P = 0.04).
of allelic imbalance effect sizes showed a similar pattern among the
three crosses, and there was minimal skewing in the ratio of upregu- Proportion of SNPs with cis regulatory effects
lated to downregulated genes in any given cross (Fig. 3b). We saw a In contrast to previous F 1 RNA-seq studies, we included three
similar pattern with the microarray data across the four tissues ana- genomes in our experimental design to allow multiple pair-
lyzed (Supplementary Fig. 6). wise comparisons. In our experiment, for >90% of the genome,
pairwise comparisons were possible between the different sub
Phenotypic consequences and human relevance species (M. m. domesticus, musculus or castaneus), whereas, for
To test the potential consequences of cis regulatory variation, we the remainder of the genome, just one subspecies was represented
compared our results to a comprehensive set of knockout mouse (M. m. domesticus or musculus)27. Therefore, we could make six com-
phenotypes for 6,039 different genes and 29 phenotype dimensions parisons: three between genomic regions of different subspecific
(see URLs). Brain-expressed genes with cis regulatory effects were origin and three between regions of the same subspecific origin. For
significantly more likely to be associated with a behavioral or neuro- each comparison, we examined the relationship between sequence
logical phenotype in knockout mice (P = 0.012) than brain-expressed diversity (SNPs/kb) and the fraction of genes that showed differen-
genes with no cis effect. Furthermore, we found no such enrichment tial gene expression (additive, consistent strain effects). The result
for the 1,348 genes that result in no overt aberrant phenotype after was a positive logarithmic correlation (Fig. 4), indicating that the
being knocked out (P = 0.56) or those associated with the 27 other number of functional regulatory variants per kilobase increases as
phenotype dimensions. the number of total variants per kilobase increases. Furthermore,
To test the human relevance of mouse cis regulatory variation, within each pairwise comparison, sequence diversity was correlated
we compared our results to those for human expression quantita- with the fraction and magnitude of genes with differential gene
tive trait locus (eQTL) studies. These comparisons were restricted to expression (Supplementary Fig. 7), and this correlation replicated
only the genes that have a one-to-one ortholog for mouse and human in all four tissues.
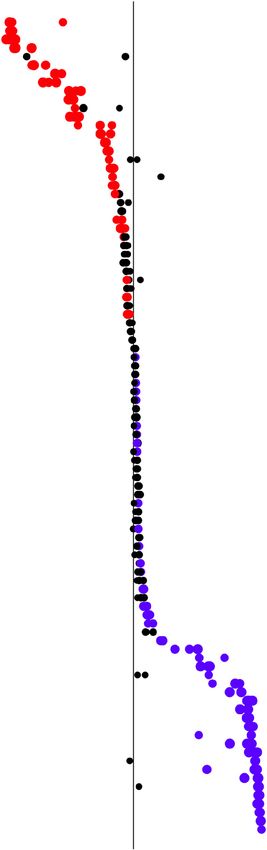
Figure 3 Balanced contribution of different
a CAST/EiJ CAST/EiJ b subspecies to the identification of cis-regulated
vs. vs. Strain effect? genes. (a) Venn diagram showing the number
PWK/PhJ WSB/EiJ
Yes No of genes with allelic imbalance (false discovery
CAST/EiJ vs. PWK/PhJ
rate (FDR) < 0.05) in each cross and the
CAST/EiJ vs. WSB/EiJ
PWK/PhJ vs. WSB/EiJ relationship to other crosses. (b) Distribution
709 1,689 686
6 of allelic imbalance effect sizes for the 11,287
autosomal genes that showed allelic imbalance
4,113 in expression for at least one cross. In each
1,647 4 cross, the proportion is the fraction of
1,729
Density
allele-specific reads from the strain listed
1,439 2 0.45 0.49 0.51 0.55
second in the legend (i.e., PWK/PhJ or WSB/EiJ).
714 The inset magnifies the distribution of effect
sizes in the vicinity of 0.5 and provides, in the
0 background, the distribution of effect sizes for
PWK/PhJ
vs. 0 0.2 0.4 0.6 0.8 1.0 genes that did not reach statistical significance
WSB/EiJ Proportion for a strain effect (filled distributions).
Nature Genetics ADVANCE ONLINE PUBLICATION 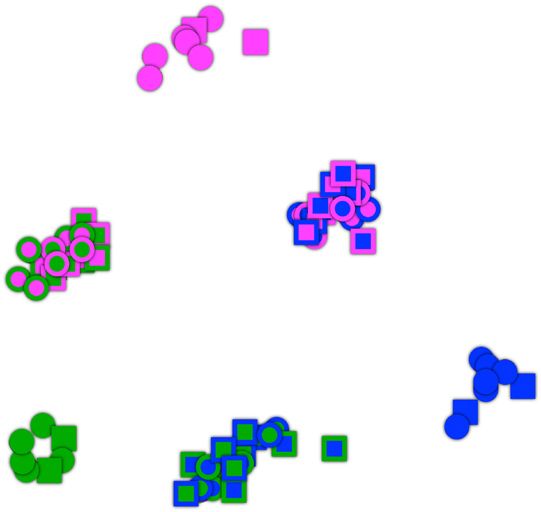
Articles
Figure 4 Differential gene expression is positively correlated with 0.7
sequence diversity at multiple evolutionary scales. Each square indicates
Differential gene expression (proportion)
the relationship between the local level of sequence diversity (SNPs/kb) 0.6
and the fraction of genes that show differential gene expression
r 2 = 0.955
(proportion of genes with additive, consistent strain effects), for regions 0.5
M. m. domesticus
of the genome with the same or different subspecific origin (indicated by M. m. castaneus
dendrograms). Colored circles represent strain (magenta, PWK/PhJ; blue, 0.4 M. m. musculus
M. m. musculus 87–92% of genome
WSB/EiJ; green, CAST/EiJ), and colored text represents the subspecific M. m. musculus
M. m. domesticus M. m. domesticus
origin in the regions of the genome considered (magenta, M. m. musculus; 0.3 M. m. domesticus 2% of genome
blue, M. m. domesticus; green, M. m. castaneus). For each of the M. m. musculus
M. m. domesticus 7% of genome
six pairwise comparisons, only expressed genes with allele-specific 0.2 M. m. domesticus
information were considered and only SNPs within the entire gene body M. m. musculus
6% of genome
(±10 kb) were included. The portion of the genome considered for each 0.1
of these six comparisons was approximately, from left to right, 50 Mb,
150 Mb, 175 Mb and 2.25 Gb for the final three comparisons. 0
0 0.5 1.0 1.5 2.0 2.5 3.0
Genetic diversity (SNPs/kb)
Each cis eQTL identified in this study was explained by at least of the proportion of mutations that create a cis regulatory effect by
one regulatory variant. Therefore, we could estimate the lower bound dividing the number of cis eQTLs by the number of SNPs within
genomic regions spanning all testable genes
a Paternal expression proportion b Imprinted? for a particular cross (Supplementary Fig. 8).
0 0.25 0.50 0.75 1.0 Yes No
The overall ratio was 0.10% (±0.02%), such
© 2015 Nature America, Inc. All rights reserved.
CAST/EiJ vs. PWK/PhJ
CAST/EiJ vs. WSB/EiJ
that approximately 1 in 1,000 SNPs creates
Mirg
Kcnk9
Rian PWK/PhJ vs. WSB/EiJ a cis regulatory effect. This estimate was sta-
Meg3
Prss33 ble across all crosses examined and across all
Cdkn1c
H13
Ube3a regions independently of their phylogenetic
Copg2
Eif2c2 1 origin. This estimate also generalized to genes
Asb4
Trappc9
Chrac1 of varying size and levels of expression.
Igf2
Herc3
Number of genes (density)
Blcap
Igf2r
Pcdhb10 Classical imprinting is incomplete and
Tial1
Tgfb1i1
Bag3
under genetic control
Ddc
Phactr2 0.5 We identified 95 genes with significant evi-
Gm16532
Klhdc10 dence of imprinting (Fig. 5a; full gene list in
Fam135b
Npepl1
Fam13a the Supplementary Data Set). Significance
6330512M04Rik
Tmem209 was defined by a parent-of-origin effect q
Cct4
Stx16
Cobl value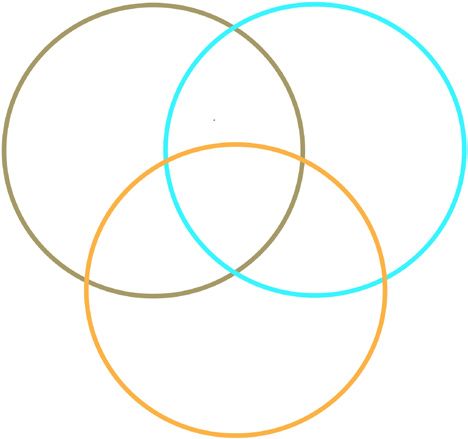
Articles
Figure 6 Global allelic imbalance in a b
favor of the paternal allele. (a) Distribution 0.60
Observed Simulation
40 Observed
neighboring genes with
of the proportion of paternal expression for
same parental skew
Expected if
all genes, except the 95 imprinted genes 30 0.55
Proportion of
symmetric
described in Figure 5. The distribution reflects
Density
20 0.50
aggregate data for ~10,000 genes × 3 crosses ×
2 sexes. The dashed red line represents a 10 0.45
reflection of the values to the left of 0.5
0 0.40
(the expectation if no paternal skew were
0.46 0.48 0.50 0.52 0.54
present). (b) Genes with consistent allelic
1
2
3
4
5
6
7
8
9
10
11
12
13
14
15
16
17
18
19
Paternal expression proportion Chromosome
imbalance (found in all three crosses) are
clustered on most autosomes. The red line c 106 Inconsistent 106 d Inconsistent
denotes the expected proportion of clustering Maternal consistent Maternal consistent
based on the number of genes with consistent 10 5
Paternal consistent 105
Paternal consistent
Distance between TSS and
Distance between TSS and
paternal or maternal overexpression on every
nearest CpG island (bp)
nearest CpG island (bp)
autosome. (c) Genes with consistent paternal 104 104
overexpression in all 3 crosses and both sexes
(n = 467) tend to be closer to CpG islands, 103 103
whereas those with consistent maternal
overexpression (n = 116) tend to be farther 102 102
away, relative to inconsistent genes
101 101
(n = 9,540). Plotted is the cumulative
proportion of genes with a given distance
© 2015 Nature America, Inc. All rights reserved.
0 0
between the TSS and the nearest CpG island.
0.5 0.6 0.7 0.8 0.9 1.0 0.6 0.7 0.8 0.9 1.0
(d) Expanded analysis including genes
Cumulative proportion of genes Cumulative proportion of genes
not fully consistent in both sexes but still
consistent in all three crosses. Genes with consistent paternal overexpression (n = 3,338) retain enrichment for CpG islands, whereas those with
consistent maternal overexpression (n = 1,631) are not different from inconsistent genes (n = 5,154).
(expressed and containing exonic variation) and 42 (58%) were had the same parental skew in expression than expected by chance
identified as being imprinted. The remaining 31 genes were sufficiently (P = 9.6 × 10⁻³, binomial test).
expressed (median TReC = 809, median ASReC = 143) for evaluation We calculated a rough estimate of the number of genes with paternal
but did not meet the criteria for parent of origin–dependent overexpression simply by taking the difference between the number
expression (median P = 0.37, range = 0.01–0.97), suggesting tis- of genes with higher paternal expression and the number of genes
sue-specific imprinting, lack of imprinting in brain or strain effects with higher maternal expression. For example, for female CAST/EiJ ×
on imprinting. PWK/PhJ reciprocal hybrids, there were 1,652 more genes with
Allele-specific RNA-seq data allowed quantification of the strength allelic imbalance in favor of the paternal allele (6,790 paternally over-
of imprinting for each gene. For most genes, imprinting was incom- expressed genes minus 5,138 maternally overexpressed genes). The
plete. For maternally expressed genes, maternal reads represented excess of genes with paternal overexpression ranged between 938
an average 67% of the ASReC (range of 51.5–97.9%). For paternally and 2,500 (across reciprocal crosses stratified by sex; Supplementary
expressed genes, paternal reads represented an average 75.6% of the Table 5). However, these numbers likely represent an underestimation
ASReC (range of 50.6–99.7%). The strength of imprinting was highly because we conservatively assumed that all genes with higher maternal
replicable, with a mean variance of 3.2% within a cross. Of the 95 expression occurred by chance, while some proportion are not due to
imprinted genes, 47 showed a strain effect modifying the strength chance. Although we can estimate the number of genes with pater-
of imprinting (strain × parent of origin effect). We divided these 47 nal overexpression, we lack sufficient power to identify all genes with
genes into 2 classes: those for which the differential gene expression modest parental overexpression while correcting for multiple testing.
could be explained by a single strain effect (n = 11) and those for To identify genomic features associated with parentally over
which it could not, suggesting the existence of a more complex model expressed genes, we first selected genes with consistent paternal
(n = 36) (Supplementary Table 4). or maternal overexpression in the three reciprocal crosses (with or
without stratification by sex). These genes were not significantly
Global allelic imbalance in favor of the paternal allele clustered with known imprinted genes. However, when we exam-
Imprinted genes were 1.5 times more likely to be expressed from the ined the proximity of these genes to CpG islands, we found that the
paternal than the maternal allele (Fig. 5b). This finding is consist- transcription start sites (TSSs) of genes with consistent overexpression
ent with the observation that paternal expression predominates in of the paternal allele in all 3 crosses (n = 467 with and 3,338 without
brain whereas maternal expression predominates in placenta9. To test stratification by sex) were closer to CpG islands (P < 1 × 10⁻⁵) than
whether this asymmetry in parent-of-origin effects extended beyond the TSSs for the remaining genes (Fig. 6c,d). We did not observe
imprinted genes, we estimated the parent-of-origin effect for each this effect among genes with consistent maternal overexpression
cross and each sex separately. We found that 54–60% of genes showed (n = 116 and 1,631; P = 0.60). Note that, for the more restrictive group
higher expression from the paternal allele, a proportion significantly (consistently expressed in both sexes within each cross), there was
different from the expectation of 50% (P = 5.9 × 10⁻²⁴; Fig. 6a and further enrichment for genes with a TSS near a CpG island among
Supplementary Table 5). We also observed that genes with higher paternally overexpressed genes and a significant depletion of genes
expression from one parental allele tended to cluster (Fig. 6b). Among with a TSS near a CpG island among maternally overexpressed genes
the 19 autosomes, 15 had a higher proportion of genes whose neighbor (P = 1 × 10⁻⁵; Fig. 6c).
Nature Genetics ADVANCE ONLINE PUBLICATION 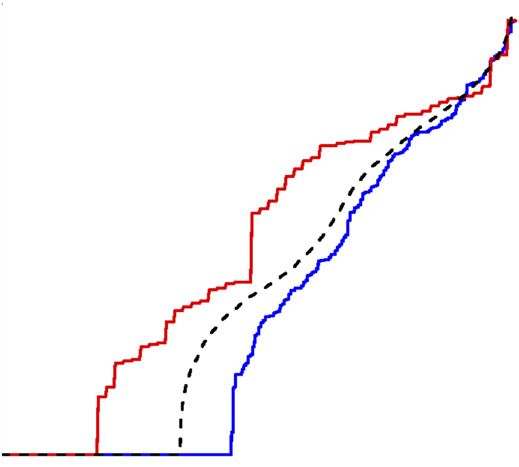
Articles

                                                      For genes consistently overexpressing the paternal allele, we             of parent-of-origin effects on gene expression were observed. First,
                                                   observed that the size of the strain effect was significantly smaller than   we demonstrated that the number of classically imprinted genes
                                                   for other genes (P < 1.2 × 10⁻⁴), implying that cis-acting regulatory        is not substantially different from historical estimates. Second,
                                                   elements have less impact on these genes. Interestingly, the proximity       we observed a global allelic imbalance in favor of expression of the
                                                   of a CpG island to a TSS was associated with smaller additive strain         paternal allele at a large number of genes associated with CpG islands.
                                                   effect sizes, and genes with a TSS that overlapped a CpG island were         For most genes, imprinting is incomplete, and cis-acting mutations
                                                   also clustered in the genome. We conclude that, in addition to the           can modify the strength of imprinting. Furthermore, we conclude
                                                   statistically significant allelic imbalance observed at the gene level       that regulation of gene expression on the X chromosome is similar
                                                   (imprinting), there is an association between the proximity of a CpG         to that for the autosomes and includes two forms of dosage com-
                                                   island to a TSS and a pervasive allelic imbalance favoring expression        pensation. Finally, we developed improved analytical tools with
                                                   of the paternal allele in brain; this suggests that parent of origin–        broad usefulness for RNA-seq analysis in many species (see URLs;
                                                   dependent methylation may be implicated in this phenomenon.                  Supplementary Table 2)22–24. These tools improve the power to detect
                                                      We were able to support this claim using a recently published             allele-specific and parent-of-origin effects while minimizing false dis-
                                                   whole-genome parent-of-origin brain DNA methylation data set                 coveries and reference bias, detect and correct spurious transcriptome
                                                   from reciprocal hybrids of 129X1/SvJ and CAST/EiJ mice28. Genes              inference due to RNA-seq read misalignment and allow analysis of
                                                   with consistent overexpression from the paternal allele were closer to       expression on the X chromosome without chromosome-wide con-
                                                   CpG islands that were preferentially methylated on the maternal allele       founding effects. Finally, a new likelihood-based method to jointly
                                                   (Supplementary Fig. 10). This observed relationship between pater-           analyze TReC and ASReC from inbred and F1 mice (Supplementary
                                                   nal overexpression and nearby maternal methylation is not simply the         Fig. 2) increases statistical power to detect genetic effects.
                                                   result of inherent differences between CpG islands with a paternal              We found cis regulatory effects for 11,686 genes (85% of testable
© 2015 Nature America, Inc. All rights reserved.

                                                   versus maternal methylation bias28.                                          genes). This number exceeds all previous findings for mouse eQTL
                                                                                                                                studies34. We found that the expression of most transcripts shows an
                                                   Two forms of dosage compensation on the X chromosome                         additive pattern of inheritance, consistent with studies in mouse35,
                                                   Gene expression on the X chromosome in mammals is believed to                human36 and plant37. Interestingly, many genes have inconsistent pat-
                                                   be subject to two forms of dosage compensation. The first equalizes          terns of inheritance between TReC and ASReC. We have determined
                                                   the expression of X-linked genes in females and males29,30, and the          that, when one of the strains used to create the reciprocal F1 hybrid
                                                   second equalizes the average expression of X-linked genes with the           has a copy number gain, typically no SNPs and small indels are called
                                                   expression of autosomal genes31. In our data set, the overall level of       in that strain in that genomic region4; this leads to allele-specific
                                                   X-chromosome gene expression was equivalent in males and females             reads from that strain being undercounted. However, patterns of
                                                   in all four tissues examined (Supplementary Fig. 11a). These data            TReC—which are independent of variant calls—are still informative
                                                   indicate that the silencing of one X chromosome in females equal-            for copy number status.
                                                   izes the average expression of X-linked genes between females                   Inbred mouse strains are assumed to possess a fixed genome across
                                                   and males29,30. In addition, X-chromosome gene expression was                time, but mutations arise continuously. We observed two striking
                                                   equivalent to that for the autosomes in all four tissues examined            examples of de novo mutations altering gene expression via changes
                                                   (Supplementary Fig. 11b). These data support the hypothesis31 that,          in gene dosage. Among the 96 samples included in the RNA-seq
                                                   during the evolution of mammalian sex chromosomes from a pair of             study, we identified one XO female caused by paternal nondisjunction
                                                   autosomes, expression of X-linked genes was doubled to compensate            (supported by genotyping) and another mouse with a ~250-kb dupli-
                                                   for the degeneration of Y-chromosome homologs. We also observed              cation spanning 5 genes (Supplementary Fig. 13).
                                                   an effect of genotype at Xce (X-chromosome–controlling element)32               Pinpointing the genetic variants that underlie mouse QTLs has
                                                   and a parent-of-origin effect in X-chromosome inactivation skewing           been challenging because the QTLs detected in experimental crosses
                                                   in females (Supplementary Fig. 12)33.                                        often span hundreds of genes. The data described here can help inves-
                                                      A total of 346 X-chromosome genes were found to possess a strain          tigators prioritize candidate genes on the basis of strain distribution
                                                   effect (77% of all expressed and testable genes), a rate slightly lower      patterns or tissue-specific expression. Furthermore, if differential
                                                   than that for autosomes. This difference is expected because of the          expression of a particular gene is suspected to influence a pheno-
                                                   reduction in power to detect effects on the X chromosome, as ASReC           type, these data provide the means to create an ‘allelic series’, a set
                                                   data can only be informative in female samples. Of the 527 testable          of animals bred intentionally to titrate the level of gene expression.
                                                   X-linked genes, only 4 (0.76%) were differentially expressed between         This approach could complement or even incorporate gene-targeted
                                                   the sexes, a rate similar to the autosomes (0.28%). Overall, however,        knockout mice.
                                                   sex did account for ~12% of the variation in X-chromosome gene                  In humans, common disease-associated variants are enriched
                                                   expression, with effects largely driven by one gene, Xist.                   for regulatory DNA. Animal models for such regulatory variation
                                                                                                                                are needed to provide a more detailed understanding of genotype-
                                                   DISCUSSION                                                                   phenotype relationships. We have shown that eQTL patterns are
                                                   We find that more than 80% of mouse genes have expression levels             often independent of species and tissue, such that cis-regulated genes
                                                   dependent on genetic variation. The majority of these differentially         in human blood often have a counterpart in the mouse ortholog,
                                                   expressed genes fit an additive model and are subject to regulatory          providing a tractable model to assess the effect of regulatory variation
                                                   variation acting in cis. These cis regulatory effects have functional        on phenotype.
                                                   consequences for mouse phenotypes and usually extend to the human               We have provided a lower-bound estimate of the proportion of
                                                   ortholog. Furthermore, differential gene expression is positively cor-       variants that have a cis regulatory effect. We estimate that at least 1
                                                   related with sequence diversity at multiple evolutionary scales, and         in every 1,000 SNPs creates a cis regulatory effect. Therefore, at least
                                                   the proportion of mutations that create a cis regulatory effect has          47,000 regulatory variants are segregating in the Collaborative Cross20
                                                   remained relatively constant as mouse subspecies evolved. Two types          and Diversity Outbred21 populations. These regulatory variants likely

                                                                                                                                               aDVANCE ONLINE PUBLICATION          Nature Genetics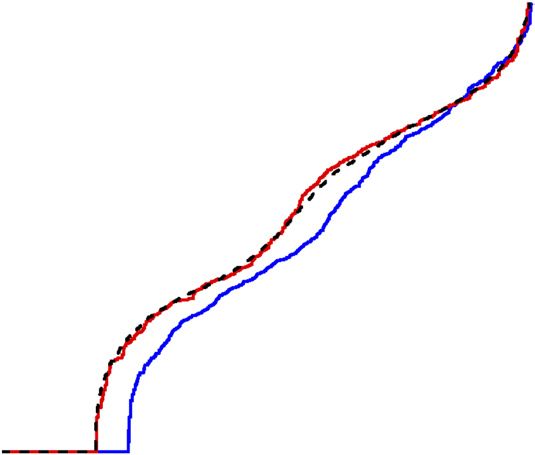
Articles
contribute to the broad phenotypic distributions seen in those popula- and clearly supports Ohno’s hypothesis in mouse. This form of dosage
tions, and the small proportion of testable genes without regulatory compensation provides strong evidence that the level of gene expres-
variation (~15% in this study) are likely under selective pressure to sion is under evolutionary pressure.
maintain gene expression at a constant level. Furthermore, as human In summary, our study demonstrates that in the laboratory mouse
and mice average ~100 de novo mutations per generation38,39, at least the vast majority of genes are subject to cis regulatory variation.
1 in 10 offspring should have a new regulatory mutation. Given this Mouse models incorporating regulatory variation20,21 should pro-
proportion and the size of the human population, several million new vide a powerful complement to null mutants19 in the search for the
regulatory variants are likely created each year. mechanisms underlying complex genetic traits in humans.
There have been conflicting reports regarding the number of mouse
genes subject to imprinting. If the definition of imprinting is restricted URLs. Expression data can be viewed at http://csbio.unc.edu/gecco/.
to genes that show significant allelic imbalance in expression favor- Scripts are provided to construct pseudogenomes (http://code.google.
ing one parent, then our results indicate that the number of genes com/p/lapels/) and perform diploid alignment (http://code.google.
imprinted in mouse brain is in line with the historical consensus. com/p/suspenders/). An R package for jointly analyzing TReC and
However, parent-of-origin effects on gene expression appear to be ASReC and to factor in X-inactivation skewing can be found at
asymmetric in mouse brain, with favored expression of the paternal http://www.bios.unc.edu/~feizou/software/rxSeq. For detection and
allele. This affects many genes distributed across all the autosomes correction of spurious RNA-seq read misalignment (pseudogenes),
and is present in all three reciprocal crosses. The 467 genes that have access GeneScissors at http://csbio.unc.edu/genescissors/. Knockout
consistent overexpression of the paternal allele in all 3 crosses and mouse phenotypes were acquired from http://www.informatics.jax.
both sexes are strongly enriched for CpG islands near their TSSs org/phenotypes.shtml. Orthologous genes for human and mouse were
and tend to show smaller strain effects relative to inconsistent genes identified from Ensembl (http://www.ensembl.org/info/genome/
© 2015 Nature America, Inc. All rights reserved.
(Fig. 6). In addition, genes with consistent overexpression of the compara/homology_method.html) using the category “ortholog_
paternal allele are associated with differentially methylated CpG one2one.” Genes with previous evidence of imprinting were identi-
islands (Supplementary Fig. 10). These observations suggest that dif- fied by creating a union of the databases from the following websites:
ferential parent of origin–dependent resetting of methylation marks http://www.geneimprint.com/, http://igc.otago.ac.nz/ and http://www.
during early development is likely the mechanism responsible for mousebook.org/catalog.php?catalog=imprinting.
global allelic imbalance.
We hypothesize that this global imbalance is ancestral to classical Methods
imprinting. In other words, small differences in parental methylation Methods and any associated references are available in the online
at CpG islands close to the TSS may have been exploited by natural version of the paper.
selection to create classical imprinting. We propose that the difference
in size of strain effects between genes that are affected or not by this Accession codes. Expression data can be acquired from the Gene
parent-of-origin effect could be explained by the fact that mutations Expression Omnibus (GEO) under accession GSE44555.
in the promoters of genes of the later type are likely to create strong
cis regulatory variants. On the other hand, mutations in CpG islands Note: Any Supplementary Information and Source Data files are available in the
online version of the paper.
will only have an overall minor effect on overall methylation. Lastly,
the global allelic imbalance in favor of expression of the paternal allele Acknowledgments
may partly explain why the majority of the newly identified imprinted We thank P. Mieczkowski, A. Brandt, E. Malc, M. Vernon, J. Brennan and
genes described here (37 of 54) show modest overexpression of the M. Calabrese for helpful discussions. Major funding was provided by National
Institute of Mental Health/National Human Genome Research Institute Center
paternal allele and may also explain the surprisingly large number of of Excellence for Genome Sciences grants (P50MH090338 and P50HG006582,
genes found in 2 previous controversial studies of imprinting10,11. co-principal investigators F.P.-M.d.V. and P.F.S.). This work was also supported by
We verified two forms of dosage compensation on the X chromo- grants R01GM074175 (principal investigator F.Z.) from the National Institute of
some. First, for most of the genes on the X chromosome, we found that General Medical Sciences and K01MH094406 (principal investigator J.J.C.) from
males and females have similar expression. Although this has been the National Institute of Mental Health.
demonstrated before using cell lines40,41, here we provide additional AUTHOR CONTRIBUTIONS
evidence in primary tissue samples. Furthermore, we confirm that it F.P.-M.d.V., J.J.C., L.M., F.Z., W.S., V.Z. and P.F.S. designed the study, and J.J.C.
is rare for genes to escape X inactivation in mouse, with this occurring managed the project. J.J.C. and F.P.-M.d.V. drafted the manuscript, and all authors
for just 1.1% of the genes that could be tested, all of which have pre- edited it. D.R.M., G.D.S., T.A.B., R.J.B., M.E.C., S.D.H., N.N.R., J.S.S., R.J.N.,
viously been identified42–44. This finding stands in sharp contrast to C.R.Q. and Y.X. bred the mice and collected tissues. J.D.C., C.J.B., Z.Y. and T.J.G.
prepared samples for expression profiling. W.S., F.Z., V.Z., Y.K. and W.W. developed
the scenario in human females, where ~15% of X-chromosome genes statistical models and conducted analyses. W.V., A.B.L., D.W.T., L.M.T., K.K.,
are biallelically expressed45,46. Second, we found that the overall level J.X., J.P.D., A.P.M. and D.L.A. contributed to data analysis and interpretation.
of X-chromosome expression is roughly equivalent to expression on S.H., I.K.P., J.R.W., C.E.W., C.-P.F., Z.Z., J.H., Z.G. and L.M. contributed to
the autosomes (Ohno’s hypothesis)31. Ohno’s hypothesis was initially pseudogenome construction and RNA-seq read alignment.
supported by three microarray studies across several eutherian spe-
COMPETING FINANCIAL INTERESTS
cies40,47,48 but then contradicted in 2010 by an RNA-seq analysis of The authors declare no competing financial interests.
mouse and human tissues49, and this controversy remains, despite
multiple recent studies50–56. The main factor contributing to dispa- Reprints and permissions information is available online at http://www.nature.com/
rate results across studies has been whether genes with low expres- reprints/index.html.
sion are considered57,58. Because genes with no or low expression in
somatic tissues are more abundant on the X chromosome than on 1. ENCODE Project Consortium. An integrated encyclopedia of DNA elements in the
human genome. Nature 489, 57–74 (2012).
autosomes50, their inclusion can lower median X:autosome expres- 2. King, M.C. & Wilson, A.C. Evolution at two levels in humans and chimpanzees.
sion ratios. Our analysis considers all genes on the X chromosome Science 188, 107–116 (1975).
Nature Genetics ADVANCE ONLINE PUBLICATION 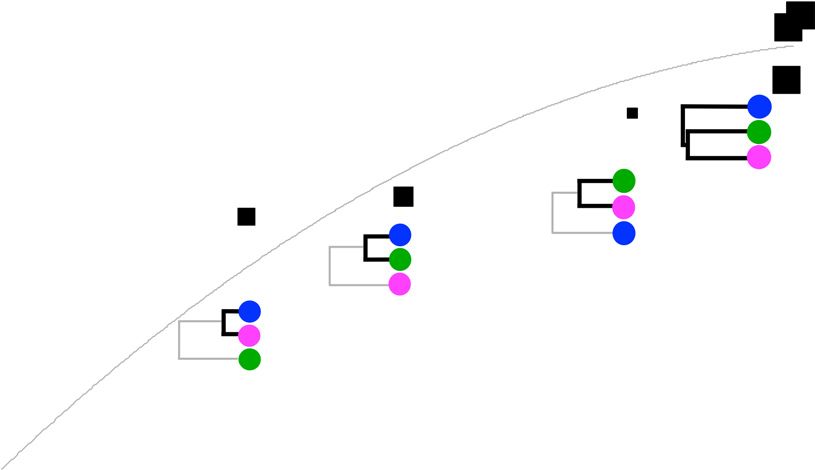
Articles
3. Gan, X. et al. Multiple reference genomes and transcriptomes for Arabidopsis 32. Cattanach, B.M. Controlling elements in the mouse X-chromosome. 3. Influence
thaliana. Nature 477, 419–423 (2011). upon both parts of an X divided by rearrangement. Genet. Res. 16, 293–301
4. Keane, T.M. et al. Mouse genomic variation and its effect on phenotypes and gene (1970).
regulation. Nature 477, 289–294 (2011). 33. Calaway, J.D. et al. Genetic architecture of skewed X inactivation in the laboratory
5. Maurano, M.T. et al. Systematic localization of common disease-associated variation mouse. PLoS Genet. 9, e1003853 (2013).
in regulatory DNA. Science 337, 1190–1195 (2012). 34. Aylor, D.L. et al. Genetic analysis of complex traits in the emerging Collaborative
6. Hindorff, L.A. et al. Potential etiologic and functional implications of genome-wide Cross. Genome Res. 21, 1213–1222 (2011).
association loci for human diseases and traits. Proc. Natl. Acad. Sci. USA 106, 35. Cui, X., Affourtit, J., Shockley, K.R., Woo, Y. & Churchill, G.A. Inheritance patterns
9362–9367 (2009). of transcript levels in F1 hybrid mice. Genetics 174, 627–637 (2006).
7. Schaub, M.A., Boyle, A.P., Kundaje, A., Batzoglou, S. & Snyder, M. Linking disease 36. Price, A.L. et al. Single-tissue and cross-tissue heritability of gene expression via
associations with regulatory information in the human genome. Genome Res. 22, identity-by-descent in related or unrelated individuals. PLoS Genet. 7, e1001317
1748–1759 (2012). (2011).
8. Nicolae, D.L. et al. Trait-associated SNPs are more likely to be eQTLs: annotation 37. Schadt, E.E. et al. Genetics of gene expression surveyed in maize, mouse and man.
to enhance discovery from GWAS. PLoS Genet. 6, e1000888 (2010). Nature 422, 297–302 (2003).
9. Wang, X. et al. Transcriptome-wide identification of novel imprinted genes in 38. Kong, A. et al. Rate of de novo mutations and the importance of father’s age to
neonatal mouse brain. PLoS ONE 3, e3839 (2008). disease risk. Nature 488, 471–475 (2012).
10. Gregg, C. et al. High-resolution analysis of parent-of-origin allelic expression in the 39. Drost, J.B. & Lee, W.R. Biological basis of germline mutation: comparisons of
mouse brain. Science 329, 643–648 (2010). spontaneous germline mutation rates among Drosophila, mouse, and human.
11. Gregg, C., Zhang, J., Butler, J.E., Haig, D. & Dulac, C. Sex-specific parent-of-origin Environ. Mol. Mutagen. 25 (suppl. 26), 48–64 (1995).
allelic expression in the mouse brain. Science 329, 682–685 (2010). 40. Lin, H. et al. Dosage compensation in the mouse balances up-regulation and
12. DeVeale, B., van der Kooy, D. & Babak, T. Critical evaluation of imprinted silencing of X-linked genes. PLoS Biol. 5, e326 (2007).
gene expression by RNA-Seq: a new perspective. PLoS Genet. 8, e1002600 41. Johnston, C.M. et al. Large-scale population study of human cell lines indicates
(2012). that dosage compensation is virtually complete. PLoS Genet. 4, e9 (2008).
13. Wang, X., Soloway, P.D. & Clark, A.G. A survey for novel imprinted genes in the 42. Yang, F., Babak, T., Shendure, J. & Disteche, C.M. Global survey of escape from X
mouse placenta by mRNA-seq. Genetics 189, 109–122 (2011). inactivation by RNA-sequencing in mouse. Genome Res. 20, 614–622 (2010).
14. Okae, H. et al. Re-investigation and RNA sequencing-based identification of genes 43. Li, N. & Carrel, L. Escape from X chromosome inactivation is an intrinsic property
with placenta-specific imprinted expression. Hum. Mol. Genet. 21, 548–558 of the Jarid1c locus. Proc. Natl. Acad. Sci. USA 105, 17055–17060 (2008).
© 2015 Nature America, Inc. All rights reserved.
(2012). 44. Lopes, A.M. et al. Transcriptional changes in response to X chromosome dosage in
15. Goncalves, A. et al. Extensive compensatory cis-trans regulation in the evolution of the mouse: implications for X inactivation and the molecular basis of Turner
mouse gene expression. Genome Res. 22, 2376–2384 (2012). Syndrome. BMC Genomics 11, 82 (2010).
16. Babak, T. et al. Global survey of genomic imprinting by transcriptome sequencing. 45. Carrel, L. & Willard, H.F. X-inactivation profile reveals extensive variability in X-linked
Curr. Biol. 18, 1735–1741 (2008). gene expression in females. Nature 434, 400–404 (2005).
17. Hayden, E.C. RNA studies under fire. Nature 484, 428 (2012). 46. Berletch, J.B., Yang, F. & Disteche, C.M. Escape from X inactivation in mice and
18. Barlow, D.P. Gametic imprinting in mammals. Science 270, 1610–1613 humans. Genome Biol. 11, 213 (2010).
(1995). 47. Nguyen, D.K. & Disteche, C.M. Dosage compensation of the active X chromosome
19. Skarnes, W.C. et al. A conditional knockout resource for the genome-wide study of in mammals. Nat. Genet. 38, 47–53 (2006).
mouse gene function. Nature 474, 337–342 (2011). 48. Gupta, V. et al. Global analysis of X-chromosome dosage compensation. J. Biol. 5,
20. Collaborative Cross Consortium. The genome architecture of the Collaborative Cross 3 (2006).
mouse genetic reference population. Genetics 190, 389–401 (2012). 49. Xiong, Y. et al. RNA sequencing shows no dosage compensation of the active
21. Churchill, G.A., Gatti, D.M., Munger, S.C. & Svenson, K.L. The Diversity Outbred X-chromosome. Nat. Genet. 42, 1043–1047 (2010).
mouse population. Mamm. Genome 23, 713–718 (2012). 50. Deng, X. et al. Evidence for compensatory upregulation of expressed X-linked genes
22. Huang, S., Holt, J., Kao, C.Y., McMillan, L. & Wang, W. A novel multi-alignment in mammals, Caenorhabditis elegans and Drosophila melanogaster. Nat. Genet. 43,
pipeline for high-throughput sequencing data. Database (Oxford) 2014, bau057 1179–1185 (2011).
(2014). 51. Kharchenko, P.V., Xi, R. & Park, P.J. Evidence for dosage compensation between
23. Zhang, Z. et al. GeneScissors: a comprehensive approach to detecting and correcting the X chromosome and autosomes in mammals. Nat. Genet. 43, 1167–1169 author
spurious transcriptome inference due to RNAseq reads misalignment. Bioinformatics reply 1171–1172 (2011).
29, 291–299 (2013). 52. Lin, H. et al. Relative overexpression of X-linked genes in mouse embryonic stem
24. Zou, F. et al. A novel statistical approach for jointly analyzing RNA-Seq data from cells is consistent with Ohno’s hypothesis. Nat. Genet. 43, 1169–1170 author reply
F1 reciprocal crosses and inbred lines. Genetics 197, 389–399 (2014). 1171–1172 (2011).
25. Wright, F.A. et al. Heritability and genomics of gene expression in peripheral blood. 53. Yildirim, E., Sadreyev, R.I., Pinter, S.F. & Lee, J.T. X-chromosome hyperactivation
Nat. Genet. 46, 430–437 (2014). in mammals via nonlinear relationships between chromatin states and transcription.
26. Kim, Y. et al. A meta-analysis of gene expression quantitative trait loci in brain. Nat. Struct. Mol. Biol. 19, 56–61 (2012).
Transl. Psychiatry 4, e459 (2014). 54. He, X. et al. He et al. reply. Nat. Genet. 43, 1171–1172 (2011).
27. Yang, H. et al. Subspecific origin and haplotype diversity in the laboratory mouse. 55. Lin, F., Xing, K., Zhang, J. & He, X. Expression reduction in mammalian X
Nat. Genet. 43, 648–655 (2011). chromosome evolution refutes Ohno’s hypothesis of dosage compensation. Proc.
28. Xie, W. et al. Base-resolution analyses of sequence and parent-of-origin dependent Natl. Acad. Sci. USA 109, 11752–11757 (2012).
DNA methylation in the mouse genome. Cell 148, 816–831 (2012). 56. Brawand, D. et al. The evolution of gene expression levels in mammalian organs.
29. Ohno, S., Kaplan, W.D. & Kinosita, R. Formation of the sex chromatin by a single Nature 478, 343–348 (2011).
X-chromosome in liver cells of Rattus norvegicus. Exp. Cell Res. 18, 415–418 57. Disteche, C.M. Dosage compensation of the sex chromosomes. Annu. Rev. Genet.
(1959). 46, 537–560 (2012).
30. Lyon, M.F. Gene action in the X-chromosome of the mouse (Mus musculus L.). 58. Jue, N.K. et al. Determination of dosage compensation of the mammalian X
Nature 190, 372–373 (1961). chromosome by RNA-seq is dependent on analytical approach. BMC Genomics 14,
31. Ohno, S. Sex Chromosomes and Sex Linked Genes (Springer Verlag, 1967). 150 (2013).
aDVANCE ONLINE PUBLICATION Nature Genetics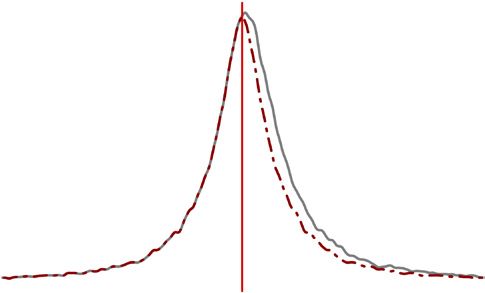
ONLINE METHODS in a given read and its paired-end mate. Considering paired-end mates allowed
Ethical statement. All mouse work was conducted in compliance with the the use of more paired-end reads determining ASE. Finally, alignments to
Guide for the Care and Use of Laboratory Animals (Institute of Laboratory maternal and paternal pseudogenomes were merged by computing the proper
Animal Resources, National Research Council, 1996) and approved by union of the separate alignments (i.e., the two alignments were combined
the Institutional Animal Care and Use Committee of the University of such that a read aligning to the same position in both alignments was counted
North Carolina. once). This final step was applied separately to all the lanes of a sample, and
the resulting alignment files were combined into a single alignment file. For
Mice. The mice used in this study were inbred and reciprocal F1 hybrids of the inbred mice, only a single pseudogenome alignment was necessary, followed
wild-derived strains CAST/EiJ, PWK/PhJ and WSB/EiJ. All mice were bred at by the same remapping and annotation stages.
the University of North Carolina from mice that were fewer than six genera- After alignment, we performed a series of quality control checks capitalizing
tions removed from founders acquired from the Jackson Laboratory. Mice on expectations for the proportions of reads that should align to each parental
were maintained on a 14-h light, 10-h dark schedule with lights turned on at strain for the sex chromosomes, autosomes and mitochondrial genome. Ninety
6 a.m. The housing room was maintained at 20–24 °C with 40–50% relative samples passed quality control.
humidity. Mice were housed in standard 20 cm × 30 cm ventilated polysulfone
cages with laboratory-grade Bed-O-Cob bedding. Water and Purina Prolab RNA-seq: read assignment. Three counts were obtained for each gene assessed
RMH3000 were available ad libitum. A small section of PVC pipe and nestlet with RNA-seq: the total number of paired-end reads (for both inbred and F1
material were present in each cage for enrichment. mice; total read count, or TReC) and the numbers of paternal and maternal
allele-specific paired-end reads (only for F1 hybrids; allele-specific read count,
Tissue collection. Mice were killed at 23 ± 1 d of age by cervical dislocation or ASReC). A paired-end read was allele specific if either end overlapped
without anesthesia (to avoid confounding effects on gene expression). All mice at least one SNP or indel that was heterozygous between the paternal and
were euthanized between 10 and 12 a.m., immediately after removal from their maternal strains. If a paired-end read overlapped more than one heterozygous
home cage. Whole brain, liver (left lobe), kidneys (both) and lungs (all lobes) SNP or indel, it was assigned to a parent only if it was fully consistent (all
© 2015 Nature America, Inc. All rights reserved.
were rapidly dissected, snap frozen in liquid nitrogen and pulverized using a alleles reported were from one parent and none were from the other). We
BioPulverizer unit (BioSpec Products). then counted the number of reads mapped to a gene as the number of paired-
end reads that overlapped the exonic regions of a gene using the R function
RNA extraction. Total RNA was extracted from ~25 mg of powdered tis- isoform/countReads. Exon position information was assigned on the basis of
sue using automated instrumentation (Maxwell 16 Tissue LEV Total RNA transcriptome annotations from Ensembl (Release 66, based on mm9; accessed
Purification Kit, Promega). RNA concentration was measured by fluorometry 14 February 2012). There was no need to correct for gene length because all
(Qubit 2.0 Fluorometer, Life Technologies), and RNA quality was verified analyses were gene specific and gene length was thus constant in comparisons
using a microfluidics platform (Bioanalyzer, Agilent Technologies). of the expression of that gene across samples. We included the total number
of reads for each sample as a covariate.
RNA-seq: sample preparation. The 96 samples were randomized to batches
of 48 for library preparation using the Illumina TruSeq RNA Sample RNA-seq: statistical analysis. Statistical analysis is described in detail in Zou
Preparation Kit v2 with 12 unique indexed adaptors (AD001–AD012). One et al.24 as well as in the Supplementary Note.
microgram of total RNA per sample was used as input, and each sample was
assigned at least two different barcodes. Libraries were quantified using Microarray: processing and quality control. Brain, liver, kidney and lung
fluorometry, and 12 randomly selected samples were pooled at equimolar RNA from the same mice used for RNA-seq was hybridized to Affymetrix
concentrations before sequencing, yielding a total of eight multiplexed pools. Mouse Gene 1.1 ST 96-Array Plate arrays using a GeneTitan instrument from
The Illumina HiSeq 2000 was used to generate 100-bp paired-end reads. Affymetrix according to the manufacturer’s protocols. We used the robust
To account for lane and machine effects in cluster density and sequence multiarray average method (RMA) implemented in the Affymetrix gene
quality, each sample was divided into four portions, and each portion was expression console with default settings (median polish and sketch-quantile
randomly assigned to one lane of one machine. The 384 portions (4 × 96 samples) normalization) to estimate the normalized expression levels of transcripts.
can be partitioned into 18 groups (3 × 3 × 2) for each combination of During normalization, we masked 78,632 probes (~10% of all probes) contain-
paternal strain, maternal strain and sex. χ2 tests confirmed no significant ing any known SNPs in the 3 mouse inbred strains4. We used 28,310 probe
associations between these group indicators and assignments of barcodes sets after excluding control probe sets and those without mRNA annotation.
or to sequencing lanes. To evaluate the overall performance of the arrays, we applied hierarchical
clustering using the R function hclust with the average link function and
RNA-seq: alignment. We developed a customized RNA-seq alignment pipe- principal-component analysis (PCA). For inbred strains and reciprocal F 1
line for mouse subspecies containing considerable genetic diversity22–24. This crosses between the inbred strains, we fitted linear fixed-effect models for
approach has the advantage of incorporating all known strain-specific genetic each transcript to test for strain, parent-of-origin, dominance and sex effects
variants into the alignment reference sequence to improve alignment qual- (full details are provided below).
ity and to minimize bias caused by differences in genetic distance between
the parental genomes and the reference sequence. First, reads from each F1 Microarray: statistical analysis. For inbred strains and reciprocal F1 crosses
hybrid (six of the nine cells in the diallel) were aligned to the appropriate between the inbred strains, we fitted linear fixed-effect models for each
‘pseudogenomes’ (ref. 22), representing each of the parental genomes using transcript to test for strain, parent-of-origin, dominance and sex effects as
TopHat (v1.4; default parameters including segment length of 25 bp, two follows:
mismatches allowed per segment, two mismatches allowed per 100-bp read
and a maximum indel of 3 bases). Pseudogenomes were approximations con-
y = b0 + b1 strain + b2 parent of origin + b3 dominance + b 4 sex
structed by incorporating all known SNPs and indels into the C57BL/6 genome
(mm9). We included all variants reported by a large-scale sequencing effort4 + b5 strain × sex + b6 parent of origin × sex + b7 dominance × sex
that included CAST/EiJ, PWK/PhJ and WSB/EiJ (June 2011 release). Second, + b8 plate + b9 dissection + e
we mapped coordinates from the pseudogenome-aligned reads to mm9 coor-
dinates by updating the alignment positions and rewriting the CIGAR strings where “strain” is a vector for comparisons of two inbred strains, “parent of ori-
of each aligned read (which was necessary as indels alter the pseudogenome gin” is a vector for comparisons of reciprocal F1 crosses, “dominance” indicates
coordinates relative to mm9). Third, we annotated each aligned read to indi- reciprocal F1 crosses, “sex” indicates female, “plate” is a categorical variable
cate the numbers of maternal and paternal alleles (SNPs and indels) observed indicating multiple 96-well plates and “dissection” is a categorical variable
doi:10.1038/ng.3222 Nature GeneticsYou can also read