How Environmental Awareness and Knowledge Affect Urban Residents' Willingness to Participate in Rubber Plantation Ecological Restoration Programs: ...
←
→
Page content transcription
If your browser does not render page correctly, please read the page content below
Article

How Environmental Awareness and Knowledge Affect Urban
Residents’ Willingness to Participate in Rubber Plantation
Ecological Restoration Programs: Evidence from Hainan, China
Yu Gan, Tao Xu *, NengRui Xu, JiLv Xu and Dan Qiao

                                         Management School, Hainan University, Haikou 570228, China;
                                         ganyu84@outlook.com (Y.G.); xunengrui@hainanu.edu.cn (N.X.); xujilv22@outlook.com (J.X.);
                                         qiaodan1124@hainanu.edu.cn (D.Q.)
                                         * Correspondence: xutao_2013@outlook.com; Tel.: +86-1587-765-5809

                                         Abstract: The rapid expansion of rubber plantations in Asian countries has led to various environ-
                                         mental problems. Therefore, local governments are implementing rubber plantation ecological res-
                                         toration (RPER) programs as an essential solution. However, such programs can be implemented
                                         only if residents are intensely involved. Based on a survey of 521 urban households in Hainan Prov-
                                         ince, China, this study investigates the effect of environmental awareness and knowledge on resi-
                                         dents’ willingness to participate in RPER programs. We employ a double-hurdle (DH) model to
                                         estimate residents’ participation in two stages. First, we determine whether residents wish to par-
                                         ticipate or not (PN). Then, we measure residents’ degree of willingness to participate (DWP). The
                                         results show that residents’ environmental awareness has a significant positive effect on whether
                                         they wish to PN but has no impact on their DWP. By contrast, residents’ environmental knowledge
                                         has a significant positive effect on whether they wish to PN and their DWP. The moderating effect
                                         shows that residents’ environmental knowledge significantly weakens the positive effects of their
Citation: Gan, Y.; Xu, T.; Xu, N.; Xu,
                                         environmental awareness on whether they wish to PN. Moreover, residents’ age, educational level,
J.; Qiao, D. How Environmental
                                         employment, and place of residence substantially influence their DWP. The findings in this study
Awareness and Knowledge Affect
                                         can provide useful insights for policymaking on improving rubber plantation ecosystems.
Urban Residents’ Willingness to
Participate in Rubber Plantation
                                         Keywords: environmental awareness; environmental knowledge; ecological restoration; willing-
Ecological Restoration Programs:
Evidence from Hainan, China.
                                         ness to participate; rubber plantation; double-hurdle model
Sustainability 2021, 13, 1852.
https://doi.org/10.3390/su13041852

Received: 17 January 2021                1. Introduction
Accepted: 5 February 2021                     Since the 1960s, rubber plantations have been rapidly expanding in developing Asian
Published: 8 February 2021
                                         countries, with the total planting area of rubber trees increasing by 196% from 3.57 million
                                         ha in 1961 to 10.57 million ha in 2018 [1]. The development of the natural rubber industry
Publisher’s Note: MDPI stays neu-
                                         has contributed to economic growth in some regions with low economic development
tral with regard to jurisdictional
                                         levels. However, the rapid expansion of rubber plantations has damaged local tropical
claims in published maps and insti-
tutional affiliations.
                                         rainforest ecosystems and led to various ecological and environmental problems, such as
                                         a weakened climate-moderating capacity, biodiversity loss, and soil erosion [2,3]. Conse-
                                         quently, restoring and protecting the ecosystems threatened by natural rubber plantations
                                         have become urgent issues in Asian rubber-planting countries [4,5].
Copyright: © 2021 by the authors.             As a natural rubber-producing country, China also faces severe ecological and envi-
Licensee MDPI, Basel, Switzerland.       ronmental problems due to rubber plantation expansion. In this context, the Chinese gov-
This article is an open access article   ernment is implementing rubber plantation ecological restoration (RPER) programs as an
distributed under the terms and con-     essential solution to these issues. RPER programs can effectively improve the ecological
ditions of the Creative Commons At-      functions of plantations, enrich biodiversity, and improve ecological processes by harmo-
tribution (CC BY) license (http://cre-   nizing the relationship between rubber production activities and the external environ-
ativecommons.org/licenses/by/4.0/).      ment [6,7]. However, because of limited funding and technology, as well as the influence

Sustainability 2021, 13, 1852. https://doi.org/10.3390/su13041852                                             www.mdpi.com/journal/sustainability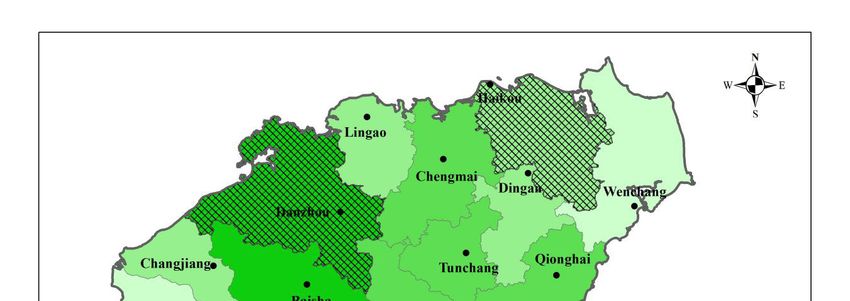
Sustainability 2021, 13, 1852                                                                                         2 of 17

                                of relevant policies, regulations, and other factors, government-led RPER programs have
                                not been implemented effectively [8].
                                      The practical implementation of ecological restoration programs requires the partic-
                                ipation of multiple stakeholders [9,10]. In addition to the government, rubber farmers are
                                important actors in improving rubber plantation ecosystems, and the roles of these farm-
                                ers have received some scholarly attention. For instance, Min et al. analyzed the willing-
                                ness of rubber farmers in Xishuangbanna Prefecture, Yunnan Province, to participate in
                                activities designed to improve rubber plantation ecosystems and found that they had a
                                relatively positive attitude toward such participation. It was also observed that wealth
                                accumulation and environmental awareness have significant positive effects on willing-
                                ness to participate [11]. In relevant studies, scholars have found that farmers often refrain
                                from initiating ecosystem improvement activities due to their poor economic conditions,
                                which leads to slow progress in the implementation of ecological restoration programs
                                [12–14]. Externality theories suggest that ecological restoration activities enable rubber
                                farmers to generate obvious external and social-ecological benefits pursued by external
                                beneficiaries (e.g., urban residents) [15,16]. Hence, the attitudes and desires of external
                                beneficiaries need to be considered when the government is trying to win public support
                                for ecological restoration policies and measures. However, existing studies on RPER have
                                mostly focused on two types of actors, i.e., the government and farmers, and neglect ex-
                                ternal beneficiaries.
                                      Ecological restoration programs can effectively improve residents’ quality of life and
                                promote the environmental condition of neighboring regions. Therefore, as the beneficiar-
                                ies of ecological restoration programs, neighboring residents are encouraged to partici-
                                pate in such programs [17,18]. Several studies have shown that public participation can
                                effectively facilitate ecological restoration programs, including those related to water en-
                                vironment restoration, waste recycling reuse, public service provision, and ecological
                                tourism resources [19–24]. In addition, factors such as individual characteristics and
                                wealth have been verified to influence the public’s willingness to participate [25,26]. Sig-
                                nificantly, as critical driving factors of residents’ pro-environmental behaviors, environ-
                                mental awareness and knowledge have gradually attracted widespread scholarly atten-
                                tion [27–30]. In this regard, it can be assumed that public participation in RPER programs
                                is also affected by environmental awareness and knowledge. However, the ecological and
                                environmental problems caused by rubber planting are usually not as easy to perceive
                                and comprehend as other regular problems (such as water pollution, desertification, and
                                air pollution). During our field survey, we found that the respondents had different per-
                                ceptions of the ecological problems stemming from rubber tree planting. Some of them
                                lacked awareness of the ecological and environmental problems stemming from rubber
                                tree planting. For instance, some respondents believed that rubber plantations are “green”
                                and “environmentally friendly,” while others even thought that the government should
                                reward rubber-planting farmers for growing carbon sinks in their rubber tree planting
                                activities. Therefore, the influence of the public’s awareness and knowledge on its will-
                                ingness to participate in RPER programs may be different from the conclusion of existing
                                studies. Thus, this study focuses on the impacts of environmental awareness and
                                knowledge on residents’ willingness to participate in RPER programs.
                                      Environmental awareness is an individual’s understanding and consciousness of
                                ecological and environmental problems [31–34]. Individuals who are aware of environ-
                                mental issues and the impacts of environmental change are more likely to reduce envi-
                                ronmental damage [35]. Previous studies have examined the relationship between indi-
                                viduals’ environmental awareness and their willingness to take ecological restoration ac-
                                tions. For instance, Eiswerth et al. (2001) investigated how environmental awareness af-
                                fects the public’s participation in invasive species management programs for lakes [36].
                                They found that people with a high educational level or frequent contact with lakes are
                                mostly conscious of the damage that invasive species can cause to lake ecosystems and
                                are more likely to support invasive species management programs. Kamaruddin et al.
Sustainability 2021, 13, 1852                                                                                        3 of 17

                                (2016) assessed the environmental awareness level of some communities. They concluded
                                that the public is aware of various environmental problems. However, its participation is
                                low due to lack of time and interest [37]. In general, individuals with a higher degree of
                                environmental awareness often have more proactive attitudes toward the environment
                                and are more inclined to engage in pro-environmental behaviors [38]. Although there is
                                no literature on the impact of environmental awareness on residents’ participation in
                                RPER programs, we expect that residents who have environmental awareness of the eco-
                                logical problems caused by natural rubber cultivation will be more inclined to support
                                RPER programs [39].
                                     Meanwhile, environmental knowledge is an individual’s perception and under-
                                standing of ecosystem structures, functions, and improvement programs [29]. Some em-
                                pirical studies have shown that environmental knowledge has a positive effect on indi-
                                viduals’ willingness to participate in ecosystem improvement and environmental protec-
                                tion activities [27,40]. For example, Pothitou (2016) found that residents who are more
                                knowledgeable about the environment are more willing to take environmental protection
                                actions [41]. Gifford et al. (2014) argued that environmental knowledge is an essential but
                                insufficient condition for environmental actions [42]. Ogbeide et al. (2015) showed that
                                consumers with more knowledge of green products are more likely to pay for environ-
                                mentally friendly products [43]. In general, it is easier for individuals with environmental
                                knowledge to overcome mental barriers such as a lack of awareness, fear, or misunder-
                                standing. In contrast, individuals who lack environmental knowledge have difficulty
                                making wise participation decisions [44–46]. Therefore, we expect that residents with a
                                greater understanding of RPER programs will be more willing to participate in them.
                                     Although most studies indicate that both subjective environmental awareness and
                                objective environmental knowledge can promote a person’s participation in ecological
                                restoration programs, there are different understandings of the relationship between en-
                                vironmental awareness and experience and their influence on a person’s willingness to
                                participate. Some scholars argue that environmental knowledge is part of environmental
                                awareness and should be treated as its perceptual component [47]. Otto and Pensini (2017)
                                found that environmental knowledge determines only 2% of a person’s environmental
                                behaviors [48]. In addition, Kollmuss and Agyeman (2002) noted that environmental
                                knowledge indirectly influences people’s environmental protection behaviors [49]. Steg
                                and Vlek (2009) suggested that environmental knowledge leads to improved awareness
                                of environmental problems [50]. Bassi et al. (2019) discovered that when relevant
                                knowledge is absent, the public’s awareness of general environmental problems is more
                                substantial than its awareness of specific environmental problems [30]. Despite their dif-
                                ferent opinions, most scholars agree that environmental knowledge influences an individ-
                                ual’s environmental awareness and behaviors (e.g., it may have some moderating effect
                                on an individual’s environmental awareness and actions). Hence, we assume that resi-
                                dents’ environmental knowledge affects the relationship between their environmental
                                awareness and their willingness to participate in RPER programs.
                                     The primary objective of this study is to investigate the impacts of environmental
                                awareness and knowledge on residents’ willingness to participate in RPER programs. This
                                study is expected to make three contributions to the literature. First, hierarchical regres-
                                sion is applied to test the moderating effect of environmental knowledge on the relation-
                                ship between residents’ environmental awareness and their willingness to participate,
                                thus revealing the mechanism by which environmental knowledge and understanding
                                influence the willingness to participate. Second, to further elucidate these influencing
                                mechanisms, residents’ participation decision-making is examined based on two aspects:
                                Whether they wish to participate or not (PN) and the degree of willingness to participate
                                (DWP). Then, a double-hurdle (DH) model is used to examine the influence on each as-
                                pect. Meanwhile, we use a combined analysis to assess the moderating effect on these two
                                aspects simultaneously to avoid potential estimation errors. Third, this study fills the ex-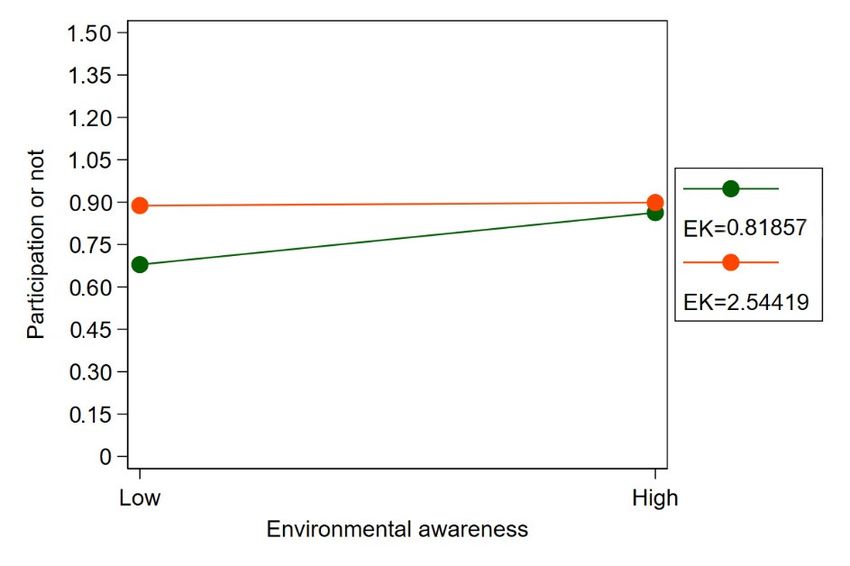
Sustainability 2021, 13, 1852                                                                                                  4 of 17

                                isting gap regarding the role of external beneficiaries in rubber plantation ecosystem im-
                                provement actions and provides a theoretical and empirical reference for policymaking
                                on RPER.
                                     The structure of this paper is as follows. In Section 2, we describe the econometric
                                analysis model of residents’ willingness to participate in ecological restoration. Section 3
                                introduces the study area and data collection process and gives a statistical profile of the
                                sample residents. We then discuss and present the analytical results in Section 4, including
                                the explanatory variables, the control variables, and the influence of the moderating ef-
                                fects. We also analyze the marginal effects and conduct a robustness test on the modeling
                                results. In the final section, we summarize the study and make some policy recommenda-
                                tions.

                                2. Econometric Model
                                2.1. DH Model
                                      A DH model is a two-stage estimation method that is widely applied in studies of
                                individual behavior. It divides the decision-making process into two stages, each of which
                                can have a different determining mechanism [51–53]. In this study, we divided residents’
                                willingness to participate into two stages. The first stage is the wish to PN, and the second
                                stage is the DWP. In the first stage, the dependent variable is a dummy variable (that takes
                                the value of only 1 or 0, indicating participation or not, respectively). In the second stage,
                                the dependent variable is continuous. Hence, if a fair number of residents do not partici-
                                pate in ecological restoration (the value of the dependent variable is 0), multiple sample
                                values will be 0, which in econometrics is known as a corner solution. Since the 0 value
                                represents the rational choice of individuals, the Heckman selection model is inapplicable
                                [54,55]. In this paper, we used the DH model to handle corner solutions.
                                      Specifically, in the first stage, residents decide to participate based on the random
                                utility framework [56,57]. In the formula, ∗ represents the difference between the utility
                                of participating ( ) and the utility of not participating ( ) in an ecosystem improve-
                                ment project. If ∗ =        −      > 0, a resident chooses to participate in the ecological res-
                                toration project. However, these two utilities are subjective and unobservable. They can
                                be expressed as latent variables, and their values are a function of the observable variables
                                in the model. Hence, the model for stage 1 is as follows:
                                                                                                                 ∗
                                                      ∗                                              1               >0
                                                          =       +   ;   ~ (0,1)            =                                    (1)
                                                                                                     0       ℎ
                                where represents respondent , and ∗ is the latent variable of . A value of        =1
                                means that a resident chooses to participate in RPER, while    = 0 means nonparticipa-
                                tion.
                                      The model for the second stage takes the following form:
                                                                                                 ∗       ∗
                                                                                                             >0           =1
                                                 =        +   ;       ~ (0,   )          =                                        (2)
                                                                                             0       ℎ
                                where       is resident’s DWP in RPER; ∗ is the latent variable of , and       and      are
                                vectors containing the explanatory variables, including the main explanatory variables
                                (environmental awareness, environmental knowledge, and their interactive item) and the
                                control variables (the individual characteristic variables, the area dummy variables, etc.).
                                The explanatory variables of the two stages can be different.      and  are correlation co-
                                efficients, and     and    are random errors.
                                      Based on Equations (1) and (2), we created the following log-likelihood function
                                based on the DH model: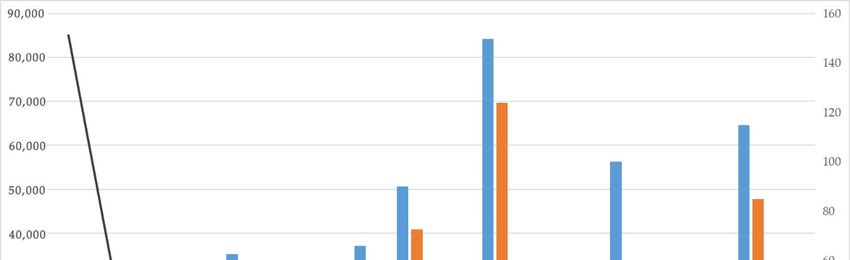
Sustainability 2021, 13, 1852                                                                                                           5 of 17

                                            (    ∣    , )=        [1 − Φ(       /   )]Φ(        / )∗            Φ(      /   )Φ(   / )
                                                                                                                                           (3)
                                                [(    −    )/ ]
                                           ×
                                                     Φ(   / )
                                where      and    are the probability density function and the cumulative distribution
                                function of a normal distribution, respectively;   is the standard deviation of ; and
                                is the standard deviation of . The form of [1/ ( / )] guarantees that the density is
                                integrated as    > 0. Function (5) allows us to compute the values of , , and      based
                                on the maximum likelihood estimates.

                                2.2. Assessing the Moderating Effect
                                     We applied a moderating effect model to assess the influences of environmental
                                knowledge on the relationship between residents’ environmental awareness and willing-
                                ness to participate. When the moderating effect is considered, it is often necessary to nor-
                                malize the independent variables and the moderators [58]. In this paper, the model of the
                                moderating effect on residents’ willingness to participate was as follows:
                                                                =       +           +           ∙         +         +                      (4)
                                where       is the willingness to participate (including the wish to PN and the DWP) of res-
                                ident i;         and        represent the environmental awareness and environmental
                                knowledge of resident I, respectively,       is the control variables, e.g., the individual char-
                                acteristic variables and area dummies; and , , , and are regression coefficients; and
                                  is the error. Equation (4) can be changed into the following form:

                                                                   =        +( +            )            +      +                          (5)
                                where the regression coefficient ( +       ) measures the relationship between the will-
                                ingness to participate and the environmental awareness of resident i, which is a function
                                of     ; and   measures the moderating effect of resident i’s environmental knowledge
                                on the relationship between that resident’s environmental awareness and willingness to
                                participate.

                                2.3. Marginal Effect Analysis
                                      The correlation coefficients of the variables in the DH model can explain only part of
                                the relationship between environmental awareness and knowledge and residents’ will-
                                ingness to participate. In this paper, we also used Burke’s (2009) method and calculated
                                the marginal effects of the explanatory variables on residents’ willingness to participate
                                in the two stages to better understand the influences of environmental awareness and
                                knowledge on residents’ willingness to participate [54]. First, we estimated the PN prob-
                                ability of each individual resident :
                                                                            ∗
                                                                        (       > 0| ) =            (     )                                (6)
                                     Then, we estimated the resident’s conditional DWP (i.e., willingness to participate in
                                ecological restoration):
                                                                  ( |   > 0, ) =            +           × (     / )                        (7)
                                     In Equation (7), (      / ) is the inverse Mill ratio:
                                                                    (   / )= (             / )/ (             / )                          (8)
                                     Based on Equations (6) and (7), we estimated the marginal effect of the independent
                                variables in the first stage and the conditional average partial effect (CAPE) of the inde-
                                pendent variables in the second stage of the DH model.
Sustainability 2021, 13, 1852 6 of 17
3. Data
3.1. Data Collection
The data used in the study came from a household survey conducted in Hainan Prov-
ince, China, in July 2019. Hainan is located in the southernmost part of China and is its
most crucial rubber tree production base. In 2018, the rubber tree planting area in Hainan
was 528,000 ha, accounting for 45.7% of China’s total rubber tree planting area [1,59]. Since
the 1950s, large-scale rubber tree planting has replaced the virgin tropical rainforest on
Hainan Island and has caused severe environmental problems [60–62]. We collected data
via stratified random sampling. First, we randomly selected four cities: Haikou (northern
Hainan Island), Sanya (southern), Danzhou (central), and Wanning (southern) (for details,
see the study area in Figure 1).
Figure 1. Study area.
These four cities have different economic development levels (gross domestic prod-
uct (GDP)) and geographic features (status of rubber tree planting). The details are shown
in Figure 2. Then, we selected residents of different districts of each city through random
sampling. Specifically, the samples included 181 households in the Xiuying, Qiongshan,
Meilan, and Longhua Districts of Haikou; 115 households in the Jiyang, Haitang, and
Tianya Districts of Sanya; 104 households in Danzhou; and 121 households in Wanning
(Danzhou and Wanning are cities at the county level and do not have districts). Thus, we
randomly selected households based on the subdistricts of 2 cities and surveyed 521
households. For the survey, we used a structured questionnaire prepared in Chinese. The
data collected by the questionnaire included residents’ socioeconomic characteristics,
their knowledge and awareness of environmental change, their understanding of RPER
programs, and their willingness to participate. Before the survey, we provided profes-
sional training to all of the investigators to guarantee that the interview approaches and
coverage were consistent and to minimize the errors caused by the subjective opinions of
the investigators. We then conducted a preliminary test on the questionnaire through anSustainability 2021, 13, 1852 7 of 17
online survey in June 2019 and modified the questionnaire based on the test. Finally, we
performed face-to-face interviews with the sampled residents in the study area in July
2019.
Figure 2. The rubber output, planting area, and gross domestic product (GDP) of all regions in Hainan Province.
3.2. PN and DWP
We measured residents’ willingness to participate in RPER programs at two stages.
First, we determined whether residents wish to PN. Then, we measured their DWP. PN is
a binary variable, and we measured it by asking the interviewed residents whether they
were willing to participate in RPER programs. DWP is a continuous variable, measured
as residents’ willingness to pay (WTP) for RPER programs. To assess residents’ WTP, we
applied the conditional valuation method (CVM), a survey approach designed to value
nonmarket values, revealing the public’s WTP for specified changes in the quantity or
quality of nonmarket goods[63]. Through the design of the questionnaire in this study, we
described the particular scenario (rubber expansion has caused some ecological and envi-
ronmental problems) to the survey respondents and made the presented RPER programs
public goods. We then let the respondents give their payments in elicitation formats.
In the CVM survey, elicitation formats are critical: They directly determine the accu-
racy of WTP evaluation. Elicitation formats such as open-ended (OE) and payment cards
(PCs) are widely applied in CVM studies because they are simple and straightforward
[64,65]. However, in practice, these two approaches also pose some obstacles. For instance,
respondents may find it challenging to answer OE questionnaires. Although the PC ap-
proach can dramatically reduce such difficulties, it tends to generate some starting point
deviations [66]. Therefore, in this paper, we followed the example of Whittington et al.
(2002) and used both the OE and PC approaches to design the CVM questionnaire to col-
lect data on the respondents’ WTP [67].
In our CVM questionnaire, we provided respondents with the following virtual mar-
ket scenarios: “In RPER programs, rubber plantations will differ from traditional planta-
tions by treating rubber trees as part of a complex ecosystem with multiple species, mul-
tiple layers of plants, and a sound biological environment. This change can help improveSustainability 2021, 13, 1852 8 of 17
biodiversity and the ecological functions of rubber plantations. Promoting RPER pro-
grams will help improve the local ecological environment, but such activities are expen-
sive and may require your family to pay some fees (equivalent to buying ecological envi-
ronmental products). Please consider your family’s actual circumstances and decide
whether you are willing to participate.” The options for the question were “1=yes, 0=no.”
If the interviewed residents answered “yes,” we proceeded to stage 2 of the WTP survey.
The problem in stage 2 read as follows: “All the fees you pay will be used for RPER pro-
grams. Please indicate the maximum amount you are willing to pay.” For the elicitation
formats, we first asked the respondents an OE question. When it was difficult for the re-
spondents to specify a WTP amount, we provided them with multiple PCs as different
options. We designed the PC options based on the studies by Solomon (2009) and Sardana
et al. (2019) [68,69]. Based on the preliminary online survey results, we roughly estimated
the scope of respondents’ WTP for RPER programs and determined the specific amounts
to put on the PCs (“0, 5, 10 … 900, 1000, more than 1000 RMB”).
3.3. Statistical Profile of the Variables
As shown in Table 1, 429 of the 521 respondents, i.e., 82.34%, were willing to partici-
pate in RPER programs, indicating residents’ high willingness to participate. Further-
more, among the 429 respondents, 27.84% of the residents had a WTP for RPER programs
of less than RMB 50, 28.6% had a WTP between RMB 50 and 100, 29.74% were willing to
pay between RMB 100 and 200, and 16.32% were willing to pay more than RMB 200.
Table 1. Willingness to pay (WTP) distribution.
WTP/Yuan Frequency Percent/% Cum.
WTP = 0 92 17.66 17.66
0 < WTP ≤ 50 145 27.84 45.49
50 < WTP ≤ 100 149 28.6 74.09
100 < WTP ≤ 200 155 29.74 83.69
200 < WTP ≤ 500 36 6.91 90.60
WTP > 500 49 9.41 100.00
Total 521 100 /
This paper’s core independent variables are environmental awareness and environ-
mental knowledge. Environmental awareness refers to whether residents are aware of the
environmental problems caused by natural rubber plantations. To measure their environ-
mental awareness, we asked residents the following question: “Do you agree that rubber
plantation hurt Hainan’s ecosystem?” The respondents were asked to choose from the
following options: “5 = strongly agree,” “4 = agree,” “3 = uncertain or unsure,” “2 = disa-
gree,” and “1 = strongly disagree.” In total, the residents’ average environmental aware-
ness was 2.775, with a standard deviation of 1.227, showing that the environmental aware-
ness of residents of Hainan Province was at a medium level. Environmental knowledge
reflects residents’ understanding of knowledge about the ecological environment, such as
RPER programs’ mechanisms for preventing biodiversity reduction, controlling soil ero-
sion, and so on. To measure residents’ environmental knowledge, we asked them the fol-
lowing question: “Do you know about some RPER programs that have been implemented
and how they work?” The response options included the following: “5 = very much,” “4
= much,” “3 = average,” “2 = a little,” and “1 = hardly any.” The statistical results indicate
that the average environmental knowledge was 1.681, with a standard deviation of 0.862,
which means that the residents of Hainan Province generally had a low level of
knowledge about RPER.
In addition, considering that residents’ characteristics may affect their willingness to
participate in ecological restoration programs, we took their gender, age, educational
level, employment, and family burden as control variables. Moreover, to control for theSustainability 2021, 13, 1852 9 of 17
influences of regional differences, we included the study region as a control variable in
the model. We used the number of years of school education to measure residents’ edu-
cational level. Additionally, we used whether the head of household had a job to access
the respondents’ employment. Furthermore, we used the dependency ratio (the number
of members not of labor-force age versus the number of labor-force members in a house-
hold) to determine family burden. The statistical results indicate that the majority (56%)
of the respondents were male, the average age was 32.8 years, the average educational
level was 12.66 years, the employment rate was 93.5%, and the average family burden
(dependency ratio) was 0.98. The descriptive statistics of the total variables were shown
in Table 2.
Table 2. Descriptive statistics of the variables.
Variables Definitions Mean Std. Dev.
Dependent
PN The respondents’ willingness to participate (1 = yes; 0 = otherwise) 0.823 0.382
The degree of willingness to participate, measured by the respondents’ WTP
DWP 174.129 291.326
(yuan)
Independent
En-awareness The environmental awareness of the interviewed residents (1–5) 2.775 1.227
En-knowledge The respondents’ knowledge of RPER programs (1–5) 1.681 0.863
EA×EK The interaction of environmental awareness and environmental knowledge 0.138 1.089
Control
Gender The gender of the respondents (1 = male; 0 = female) 0.56 0.497
Age The age of the respondents (years) 32.804 10.558
Education The educational level of the respondents (years) 12.658 3.416
Work Whether the respondents are employed (1 = yes; 0 = otherwise) 0.935 0.247
The ratio of those of labor-force age to those not of labor-force age in the
Burden 0.984 0.894
population
Sanya Regional dummy variables 0.221 0.415
Danzhou (1 = live in this area; 0.2 0.4
Haikou 0 = otherwise) 0.347 0.477
4. Estimation Results
4.1. Model Estimation Results
In this paper, we used a DH model to analyze the factors influencing residents’ will-
ingness to participate in RPER and conducts a stratified regression from Models 1 to 3.
Model 1 examines the main effect of environmental awareness’ on residents’ willingness
to participate (including their wish to PN and their DWP). Model 2 adds environmental
knowledge to Model 1 for the main effect analysis. Model 3 adds the interactions between
environmental awareness and knowledge to Model 2 to examine the moderating effects
of environmental knowledge on the relationship between residents’ environmental
awareness and willingness to participate in RPER. As the independent and moderating
variables were continuous, we used a stratified regression to analyze and test the moder-
ating effects and normalized both the independent and moderating variables [58]. Table
3 shows the modeling results. The Wald chi-square tests in Models 1 and 3 were statisti-
cally significant at the 1% level, indicating an overall good degree of fit.Sustainability 2021, 13, 1852 10 of 17
Table 3. Estimation results of the double-hurdle (DH) model.
Model 1 Model 2 Model 3
Variables Hurdle I Hurdle II Hurdle I Hurdle II Hurdle I Hurdle II
PN DWP PN DWP PN DWP
En-awareness 0.199 1 *** 16.727 0.176 *** 14.351 0.389 *** 6.291
(0.056) 2 (12.216) (0.057) (12.036) (0.126) (21.986)
En-knowledge 0.273 *** 75.845 *** 0.682 *** 62.296
(0.091) (19.955) (0.244) (43.836)
EA×EK −0.143 * 4.616
(0.075) (12.817)
Gender 0.147 26.135 0.119 6.515 0.137 6.294
(0.142) (29.923) (0.143) (30.099) (0.145) (30.154)
Age −0.017 *** −3.121 ** −0.017 *** −2.457 ** −0.015 ** −2.476 **
(0.006) (1.228) (0.006) (1.192) (0.006) (1.192)
Education 0.058 *** 10.136 * 0.051 ** 8.285 0.048 ** 8.344
(0.021) (5.457) (0.021) (5.263) (0.021) (5.274)
Work 0.265 101.035 * 0.182 84.855 0.182 85.157
(0.319) (57.132) (0.321) (56.090) (0.323) (55.992)
Burden 0.055 18.482 0.052 16.621 0.046 16.865
(0.080) (16.073) (0.082) (16.371) (0.082) (16.380)
Sanya −0.002 −34.656 0.045 −21.071 0.041 −21.063
(0.187) (44.086) (0.191) (43.683) (0.191) (43.793)
Danzhou 0.558 *** 20.403 0.599 *** 45.304 0.589 *** 45.485
(0.215) (45.104) (0.218) (44.976) (0.218) (45.048)
Haikou 0.340 * −9.397 0.390 ** 18.788 0.380 ** 18.780
(0.180) (44.327) (0.182) (44.345) (0.183) (44.402)
Constant −0.076 98.539 −0.388 −29.045 −0.984 * −6.041
(0.424) (102.109) (0.440) (96.710) (0.549) (108.473)
Observations 521 429 521 429 521 429
Log-likelihood −218.86754 −214.0078 −212.21946
LR chi 2 (9) 48.02 *** 57.74 *** 61.31 ***
1 *** p < 0.01, ** p < 0.05, * p < 0.1. 2 Standard errors are in parentheses.
4.2. The Influences of Environmental Awareness and Knowledge on Residents’ Willingness to
Participate
Table 3 presents the estimated results of the effect of environmental awareness on
residents’ willingness to participate in RPER programs. In Hurdle I, environmental aware-
ness had a significant (at the 1% level) impact on residents’ wish to PN, but in Hurdle II,
the impact of environmental awareness on residents’ DWP was not significant. These re-
sults indicate that residents with strong environmental awareness are more willing to par-
ticipate in RPER programs. However, environmental awareness does not directly affect
their DWP. Model 2, which includes environmental knowledge, shows that environmen-
tal knowledge positively affected residents’ wish to PN and DWP in both hurdles, and
this effect was statistically significant at the 1% level. The results indicate that when resi-
dents are more knowledgeable about RPER, they have a higher willingness to participate.
Moreover, residents’ knowledge about ecological restoration programs directly affects
their participation degree. In summary, environmental awareness affected only residents’
wish to PN, while environmental knowledge affected both residents’ wish to PN and their
DWP.Sustainability 2021, 13, 1852 11 of 17
4.3. The Moderating Effects of Environmental Knowledge
Model 3 introduces the interaction between environmental awareness and environ-
mental knowledge to examine whether environmental knowledge enhances or weakens
the positive impact of environmental awareness on residents’ willingness to participate.
First, in Hurdle I, the results show that environmental knowledge negatively moderated
the effect of environmental awareness on residents’ wish to PN, and this effect was statis-
tically significant at the 10% level, indicating that environmental knowledge affects the
relationship between residents’ environmental awareness and their wish to PN and that
the moderating effect is negative. Second, in Hurdle II, the results show that environmen-
tal knowledge positively moderated the effect of environmental awareness on residents’
DWP. The moderating effect was nonsignificant, indicating that environmental
knowledge has little moderating impact on the relationship between residents’ environ-
mental awareness and their DWP.
To more clearly and intuitively illustrate the moderating effect in Hurdle I, we drew
a diagram, as shown in Figure 3. When residents’ environmental knowledge level is low,
it is more likely that environmental knowledge will have a more substantial moderating
effect on the correlation between residents’ environmental awareness and their wish to
PN (with a higher slope). In contrast, when their environmental knowledge level is high,
its moderating effect will be smaller (with a smaller slope). The causes of such results are
worth discussion. Specifically, environmental awareness and environmental knowledge
can directly affect residents’ willingness to participate in ecological restoration actions.
However, participation decisions based on environmental awareness tend to be more sub-
jective, while those based on environmental knowledge tend to be more objective. Resi-
dents with high environmental knowledge levels (i.e., those who know more about the
ecological restoration programs) are more inclined to base their decisions on their envi-
ronmental knowledge than to base their decisions on their subjective environmental
awareness [48,53].
In contrast, residents with less environmental knowledge may rely only on their sub-
jective environmental awareness to make decisions. Hence, environmental knowledge has
adverse moderating effects on the relationship between environmental awareness and
willingness to participate. Some previous studies on the moderating effects of environ-
mental knowledge on individuals’ behavior have reached similar conclusions. For in-
stance, Haryanto’s (2014) empirical research on Indonesian consumers found that envi-
ronmental knowledge weakens the positive effects of a “green” brand on consumers’ pur-
chasing attitudes [70].
Figure 3. Moderating effect of environmental knowledge. EK represents residents’ degree of envi-
ronmental knowledge.Sustainability 2021, 13, 1852 12 of 17
4.4. The Influences of the Control Variables
Among the control variables of the residents’ characteristics, their age, educational
level, and employment had significant positive effects on their willingness to participate
in RPER programs. In Models 1 and 2, the respondents’ age positively and significantly
(at the 1% level) affected their wish to PN and negatively and significantly (at the 5% level)
affected their DWP. In Model 3, the respondents’ age negatively and significantly (at the
5% level) affected their wish to PN and their DWP. These results mean that older residents
tend to have a lower willingness to participate, probably because older residents have less
access to relevant information and less exposure to environmental awareness-raising ma-
terials and campaigns. Therefore, they have less environmental knowledge and weaker
environmental awareness, which affects their participation. The respondents’ educational
level had a significant positive effect on their wish to PN (in Model 1, the effect was sta-
tistically significant at the 1% level, and in Models 2 and 3, the effect was statistically sig-
nificant at the 5% level). In Model 1, educational level positively and statistically (at the
10% level) affected residents’ DWP. In Models 2 and 3, educational level also positively
affected residents’ DWP. However, the effects were not significant. The results indicate
that residents with better education have a higher DWP in ecological restoration actions.
A reasonable explanation is that well-educated respondents know more about the im-
portance of ecological-environmental protection. Thus, they are more willing to partici-
pate in ecological restoration actions. In Model 1, whether the respondents were employed
positively and significantly (at the 10% level) affected their DWP, indicating that people
with a job and a stable income have a high DWP in ecological restoration actions. Finally,
in Models 1 and 3, the respondents’ gender and family burden (dependency ratios) had
no significant PN or DWP effects.
An analysis of the region control variable indicates that residents’ willingness to par-
ticipate in different areas had high heterogeneity. Specifically, in Models 1–3, living in
Danzhou had a positive effect on the respondents’ wish to PN, and this effect was statis-
tically significant at the 1% level. In all three models, living in Haikou also positively af-
fected residents’ PN (in Model 1, the effect was statistically significant at the 10% level,
while in Models 2 and 3, the effect was statistically significant at the 5% level). These re-
sults indicate that, across different regions of Hainan Province where the natural condi-
tions, economic development level and local culture and customs show heterogeneity,
residents’ willingness to participate in ecological restoration actions significantly varies.
There are two possible reasons for this result. First, as shown in Figure 2, Danzhou is the
area with the highest rubber tree production in both planting and output volume. Hence,
rubber is an important local industry that is closely related to residents’ everyday lives.
Therefore, the residents of Danzhou experience more environmental problems due to rub-
ber planting and know more about rubber planting. Thus, they are more inclined to par-
ticipate in RPER programs. Second, although rubber planting is not an essential industry
in Haikou, it is the capital city of Hainan Province, and its educational level, urbanization
rate, and economic development level are the highest among cities in Hainan Province. In
2019, Haikou city contributed over 30% of the provincial GDP [63]. Haikou residents have
increased exposure to frequent awareness-raising materials and information on ecosys-
tem protection due to their location. They have more vital environmental awareness than
any other residents in our study. Moreover, they have higher income levels than the resi-
dents of other cities. Hence, they are more willing to participate in RPER programs.
4.5. Marginal Effect Analysis
This paper assessed the marginal effects of the models (see Table 4) to reveal how
strongly changes in the independent variables influence changes in the dependent varia-
bles compared to the regression coefficients. Our marginal effect analysis results show
that a 1% increase in residents’ environmental awareness can lead to a 4% increase in their
wish to PN, and this result was statistically significant at the 1% level. This result alsoSustainability 2021, 13, 1852 13 of 17
indicates that a 1% increase in residents’ environmental knowledge can cause an increase
of 7.3% in their wish to PN. The CAPE results suggest that among the residents who de-
cide to participate in ecological restoration actions, a 1% increase in their environmental
knowledge can increase their DWP by RMB 75.58, and this result was statistically signifi-
cant at the 1% level. Increases in residents’ environmental awareness and knowledge can
improve their willingness to participate and their degree of participation in ecological res-
toration actions.
The control variable results show that a 1% increase in the respondents’ age led to a
0.3% decrease in their wish to PN, and that a 1% increase in their educational level caused
a 1.1% increase in their wish to PN. Living in Danzhou and Haikou increased the respond-
ents’ wish to PN by 13.3% and 8.6%, respectively. The CAPE results show that a 1% in-
crease in the educational level of residents willing to participate led to a DWP increase of
8.34 RMB, and this result was statistically significant at the 1% level. Our marginal effect
analysis results further confirm the effects of age and educational level on residents’ will-
ingness to participate in ecological restoration actions. Residents’ PN had significant re-
gional heterogeneity.
Table 4. Marginal effects for the DH model.
Hurdle I: PN Hurdle II: DWP
Variables
Marginal effects Std. Err. CAPE Std. Err.
En-awareness 0.040 ***
1 0.013 14.371 12.204
En-knowledge 0.073 *** 0.022 75.584 *** 17.077
Gender 0.031 0.033 6.294 30.165
Age −0.003 ** 0.001 −2.476 1.5118
Education 0.011 ** 0.005 8.344 * 4.5451
Work 0.041 0.073 85.157 57.279
Burden 0.010 0.019 16.865 16.580
Sanya 0.009 0.043 −21.063 45.174
Danzhou 0.133 *** 0.049 45.485 44.778
Haikou 0.086 ** 0.041 18.780 40.659
Observations 521 429
1 *** p < 0.01, ** p < 0.05, * p < 0.1.
4.6. Robustness Test
To test the reliability of the empirical analysis, we conducted a robustness test using
a regression on reduced sample size [71]. We randomly deleted 25% of the sample data
(130 observations were randomly chosen and then dropped). After that, we re-estimated
the remaining samples. Table 5 presents the DH model assessment results of environmen-
tal knowledge, environmental awareness, and the interaction between them after the ran-
domly chosen 25% of sample data were excluded. Although the coefficient values some-
what changed, the directions of the main explanatory variables and the interaction coeffi-
cients remain unchanged. The effect remains significant (Table 5), indicating that the
study’s conclusions are robust.Sustainability 2021, 13, 1852 14 of 17
Table 5. Robustness checks of the estimation.
En-Awareness En-Knowledge EA× EK
Variables
(Coef.2) (Coef.) (Coef.)
Hurdle I 0.176 1*** 0.273 *** −0.143 *
Original model
Hurdle II 14.351 75.845 *** 4.616
Hurdle I 0.459 *** 0.936 *** −0.188 **
Deleted sample3
Hurdle II 18.638 96.020 * 1.718
1*** p < 0.01, ** p < 0.05, * p < 0.1; 2 Coef. = coefficient; 3 We use the “randomtag” command in the Stata software to randomly
delete 25% of the sample data and re-estimate the remaining samples. After repeating the above processes, the estimation
results remained stable. This table shows one of the estimation results.
5. Conclusions
It is essential to gain public support and participation in RPER programs to protect
and restore the ecosystem functions of rubber tree-planting regions. In this study, we di-
vided willingness to participate into two stages. First, we determined whether residents
wish to PN. Then, we measured their DWP. We surveyed 521 urban households in Hainan
Province, China. We used a DH model to assess the effects of environmental awareness
and knowledge on residents’ willingness to participate in ecological restoration actions.
We also examined the moderating effects of environmental knowledge on the relationship
between residents’ environmental awareness and their willingness to participate, further
assessed the marginal effects of the model, and tested the robustness of the model.
In general, both environmental awareness and knowledge had significant positive
effects on residents’ willingness to participate in ecological restoration actions. This find-
ing means that appropriately raising public awareness can effectively win public support
for implementing RPER programs. The analytic results of the moderating effects showed
that environmental knowledge weakened the positive impact of environmental aware-
ness on residents’ willingness to participate. As residents’ environmental knowledge in-
creases, their environmental awareness had a weaker positive effect on their willingness
to participate in ecosystem- improvement actions. The DH model assessment results in-
dicate that environmental knowledge and awareness have different effects on the two
stages in residents’ decision to participate in RPER. Environmental awareness affected
only residents’ wish to PN in stage 1. In contrast, environmental knowledge affected res-
idents’ willingness to participate in both stages (their wish to PN and their DWP). This
finding suggests that more advanced environmental knowledge encourages residents to
participate in ecological restoration and raises their degree of participation.
Based on the results above, we recommend that policymakers should pay attention
to the importance of environmental knowledge and awareness in ecological restoration
programs. They should promptly inform the public about the implementation back-
ground, targets, operational mechanism, and expected effects of such programs so that
residents can have sufficient access to information about such programs. The government
should further optimize the means of promoting environmental protection. Protecting the
ecological environment is a responsibility shared by society but promoting it should be
tailored to different residential groups and the specific characteristics of regions. The gov-
ernment should strategically select the critical points of campaigns and their promotional
materials to raise residents’ environmental awareness and increase their knowledge about
ecological restoration programs to improve public participation and effectively facilitate
ecosystem program implementation.
Author Contributions: Conceptualization, T.X., N.X. and Y.G.; methodology, Y.G. and T.X.; soft-
ware, Y.G.; validation, J.X. and D.Q.; formal analysis, Y.G.; investigation, T.X. and D.Q.; data cura-
tion, Y.G.; writing—original draft preparation, Y.G.; writing-review and editing, T.X., N.X. and
D.Q.; visualization, Y.G.; supervision, T.X. and N.X.; funding acquisition, T.X. All authors have
read and agreed to the published version of the manuscript.Sustainability 2021, 13, 1852 15 of 17
Funding: This research funded by Hainan Provincial Natural Science Foundation of China
(719QN198), Natural Rubber Industry Operation Early-warning System Construction Pro-
ject(18200125), Industrial Economic Position of China National Natural Rubber Industry Technical
System (CARS-34-CJ1), National Natural Science Foundation of China (No. 72003054), China Engi-
neering Science and Technology Development Strategy Hainan Research Institute 2019 Consulta-
tion Research Major Project Subtopic (19-HN-ZD-03-5).
Institutional Review Board Statement: Not applicable.
Informed Consent Statement: Not applicable.
Data Availability Statement: The data presented in this study are available on request from the
corresponding author. The data are not publicly available due to personal privacy and non-open
access of the research program.
Acknowledgments: The authors wish to thank the Industrial Economic Position of China National
Natural Rubber Industry Technical System for supporting this work.
Conflicts of Interest: We declare that there are no conflicts of interest.
References
1. Food and Agriculture Organization (FAO), 2020. FAOSTAT. Available online: http://www.fao.org/faostat/zh/#search/rubber
(accessed on 14 February 2020).
2. Ahrends, A.; Hollingsworth, P.M.; Ziegler, A.D.; Fox, J.M.; Chen, H.; Su, Y.; Xu, J. Current trends of rubber plantation expansion
may threaten biodiversity and livelihoods. Glob. Environ. Chang. 2015, 34, 48–58, doi:10.1016/j.gloenvcha.2015.06.002.
3. Blagodatsky, S.; Xu, J.; Cadisch, G. Carbon balance of rubber (Hevea brasiliensis) plantations: A review of uncertainties at plot,
landscape and production level. Agric. Ecosyst. Environ. 2016, 221, 8–19.
4. Zhai, D.-L.; Cannon, C.H.; Slik, J.W.F.; Zhang, C.-P.; Dai, Z.-C. Rubber and pulp plantations represent a double threat to Hai-
nan’s natural tropical forests. J. Environ. Manag. 2012, 96, 64–73, doi:10.1016/j.jenvman.2011.10.011.
5. Tan, Z.-H.; Zhang, Y.-P.; Song, Q.-H.; Liu, W.-J.; Deng, X.-B.; Tang, J.-W.; Deng, Y.; Zhou, W.-J.; Yang, L.-Y.; Yu, G.-R.; et al.
Rubber plantations act as water pumps in tropical China. Geophys. Res. Lett. 2011, 38, 24, doi:10.1029/2011GL050006.
6. Luo, J.Y.; Liu, G.M. Thoughts on the Construction of Environment-friendly Rubber Plantation in Jinghong Farm. South China
Agric. 2015, 9, 140–142.
7. Lan, G.Y.; Wu, Z.X.; Xie, G.S.; Huang, H.S.; The theoretical basis of Environment-friendly Rubber Plantation. China Trop. Agric.
2014, 5, 64–73,doi:10.3969/j.issn.1673-0658.2014.05.004.
8. Bureau of Agricultural Reclamation under the Ministry of Agriculture and Rural Affairs in 2020. Available online:
http://www.moa.gov.cn/ztzl/2020gzzd/gsjgzyd/202002/t20200220_6337435.htm (accessed on 5 March 2020).
9. Yao, X.; He, J.; Bao, C. Public participation modes in China’s environmental impact assessment process: An analytical framework
based on participation extent and conflict level. Environ. Impact Assess. Rev. 2020, 84, 106400.
10. Couix, N.; Gonzalo-Turpin, H. Towards a land management approach to ecological restoration to encourage stakeholder par-
ticipation. Land Use Policy 2015, 46, 155–162, doi:10.1016/j.landusepol.2015.01.025.
11. Min, S.; Bai, J.; Huang, J.; Waibel, H. Willingness of smallholder rubber farmers to participate in ecosystem protection: Effects
of household wealth and environmental awareness. For. Policy Econ. 2018, 87, 70–84, doi:10.1016/j.forpol.2017.11.009.
12. Wang, Y.; Liang, J.; Yang, J.; Ma, X.; Li, X.; Wu, J.; Yang, G.; Ren, G.; Feng, Y. Analysis of the environmental behavior of farmers
for non-point source pollution control and management: An integration of the theory of planned behavior and the protection
motivation theory. J. Environ. Manag. 2019, 237, 15–23.
13. Hou, C.; Zhou, L.; Wen, Y.; Chen, Y. Farmers’ adaptability to the policy of ecological protection in China—A case study in Yanchi
County, China. Soc. Sci. J. 2018, 55, 404–412.
14. Ma, S.; Swinton, S.M.; Lupi, F.; Jolejole-Foreman, C. Farmers’ willingness to participate in Payment-for-Environmental-Services
programs. J. Agric. Econ. 2012, 63, 604–626.
15. Lihua, W.U.; Tianshu, M.A.; Yuanchao, B.; Sijia, L.I.; Zhaoqiang, Y.I. Improvement of regional environmental quality: Govern-
ment environmental governance and public participation. Sci. Total Environ. 2020, 717, 137265.
16. Tu, Z.; Hu, T.; Shen, R. Evaluating public participation impact on environmental protection and ecological efficiency in China:
Evidence from PITI disclosure. China Econ. Rev. 2019, 55, 111–123.
17. Xu, T.; Ni, Q.; Yao, L.; Qiao, D.; Zhao, M. Public Preference Analysis and Social Benefits Evaluation of River Basin Ecological
Restoration: Application of the Choice Experiments for the Shiyang River, China. Discret. Dyn. Nat. Soc. 2020, 2020,
doi:10.1155/2020/1345054.
18. Pan, X.; Xu, L.; Yang, Z.; Yu, B. Payments for ecosystem services in China: Policy, practice, and progress. J. Clean. Prod. 2017, 158,
200–208.
19. Zhang, H.; Lei, S.L. A structural model of residents’ intention to participate in ecotourism: The case of a wetland community.
Tour. Manag. 2012, 33, 916–925.
20. Dwivedy, M.; Mittal, R.K. Willingness of residents to participate in e-waste recycling in India. Environ. Dev. 2013, 6, 48–68.Sustainability 2021, 13, 1852 16 of 17
21. Yang, R.; Long, R. Analysis of the influencing factors of the public willingness to participate in public bicycle projects and
intervention strategies—A case study of Jiangsu Province, China. Sustainability 2016, 8, 349.
22. Nnorom, I.C.; Ohakwe, J.; Osibanjo, O. Survey of willingness of residents to participate in electronic waste recycling in Nigeria–
A case study of mobile phone recycling. J. Clean. Prod. 2009, 17, 1629–1637.
23. Wang, Z.; Zhang, B.; Yin, J.; Zhang, X. Willingness and behavior towards e-waste recycling for residents in Beijing city, China.
J. Clean. Prod. 2011, 19, 977–984.
24. Sarvilinna, A.; Lehtoranta, V.; Hjerppe, T. Willingness to participate in the restoration of waters in an urban-rural setting: Local
drivers and motivations behind environmental behavior. Environ. Sci. Policy 2018, 85, 11–18.
25. Inglehart, R. Public support for environmental protection: Objective problems and subjective values in 43 societies. PS Political
Sci. Politics 1995, 28, 57–72.
26. Diekmann, A.; Franzen, A. The wealth of nations and environmental concern. Environ. Behav. 1999, 31, 540–549.
27. Paço, A.; Lavrador, T. Environmental knowledge and attitudes and behaviors towards energy consumption. J. Environ. Manag.
2017, 197, 384–392.
28. Melindi-Ghidi, P.; Dedeurwaerdere, T.; Fabbri, G. Using environmental knowledge brokers to promote deep green agri-envi-
ronment measures. Ecol. Econ. 2020, 176, 106722, doi:10.1016/j.ecolecon.2020.106722
29. Liu, P.; Teng, M.; Han, C. How does environmental knowledge translate into pro-environmental behaviors?: The mediating role
of environmental attitudes and behavioral intentions. Sci. Total Environ. 2020, 728, 138126.
30. Bassi, I.; Gori, E.; Iseppi, L. Assessing environmental awareness towards the protection of the Alps: A case study. Land Use Policy
2019, 87, 104028.
31. Kikuchi-Uehara, E.; Nakatani, J.; Hirao, M. Analysis of factors influencing consumers’ pro-environmental behavior based on
life cycle thinking. Part I: Effect of environmental awareness and trust in environmental information on product choice. J. Clean.
Prod. 2016, 117, 10–18.
32. Zsóka, Á.; Szerényi, Z.M.; Széchy, A.; Kocsis, T. Greening due to environmental education? Environmental knowledge, attitudes,
consumer behavior and everyday pro-environmental activities of Hungarian high school and university students. J. Clean. Prod.
2013, 48, 126–138.
33. Zsóka, Á.N. Consistency and “awareness gaps” in the environmental behavior of Hungarian companies. J. Clean. Prod. 2008, 16,
322–329.
34. Xu, X.; Wang, S.; Yu, Y. Consumer’s intention to purchase green furniture: Do health consciousness and environmental aware-
ness matter? Sci. Total Environ. 2020, 704, 135275.
35. Gadenne, D.L.; Kennedy, J.; McKeiver, C. An empirical study of environmental awareness and practices in SMEs. J. Bus. Ethics
2009, 84, 45–63.
36. Eiswerth, M.E.; Yen, S.T.; van Kooten, G.C. Factors determining awareness and knowledge of aquatic invasive species. Ecol.
Econ. 2011, 70, 1672–1679.
37. Kamaruddin, S.M.; Ahmad, P.; Alwee, N. Community awareness on environmental management through local agenda 21
(LA21). Procedia-Soc. Behav. Sci. 2016, 222, 729–737.
38. Fu, L.; Sun, Z.; Zha, L.; Liu, F.; He, L.; Sun, X.; Jing, X. Environmental awareness and pro-environmental behavior within china’s
road freight transportation industry: Moderating role of perceived policy effectiveness. J. Clean. Prod. 2020, 252, 119796.
39. Faccioli, M.; Czajkowski, M.; Glenk, K.; Martin-Ortega, J. Environmental attitudes and place identity as determinants of prefer-
ences for ecosystem services. Ecol. Econ. 2020, 174, 106600.
40. Gkargkavouzi, A.; Halkos, G.; Matsiori, S. How do motives and knowledge relate to intention to perform environmental behav-
ior? Assessing the mediating role of constraints. Ecol. Econ. 2019, 165, 106394.
41. Pothitou, M.; Hanna, R.F.; Chalvatzis, K.J. Environmental knowledge, pro-environmental behavior and energy savings in
households: An empirical study. Appl. Energy 2016, 184, 1217–1229.
42. Gifford, R.; Nilsson, A. Personal and social factors that influence pro-environmental concern and behavior: A review. Int. J.
Psychol. 2014, 49, 141–157.
43. Ogbeide, O.A.; Ford, C.; Stringer, R. The environmental benefits of organic wine: Exploring consumer willingness-to-pay pre-
miums? J. Food Prod. Mark. 2015, 21, 482–502.
44. Levine, D.S.; Strube, M.J. Environmental attitudes, knowledge, intentions and behaviors among college students. J. Soc. Psychol.
2012, 152, 308–326.
45. Kaiser, F.G.; Roczen, N.; Bogner, F.X. Competence formation in environmental education: Advancing ecology-specific rather
than general abilities. Umweltpsychologie 2008, 12, 56–70.
46. Kaiser, F.G.; Gutscher, H. The proposition of a general version of the theory of planned behavior: Predicting ecological behavior
1. J. Appl. Soc. Psychol. 2003, 33, 586–603.
47. Maichum, K.; Parichatnon, S.; Peng, K.-C. Application of the extended theory of planned behavior model to investigate purchase
intention of green products among Thai consumers. Sustainability 2016, 8, 1077.
48. Otto, S.; Pensini, P. Nature-based environmental education of children: Environmental knowledge and connectedness to nature,
together, are related to ecological behavior. Glob. Environ. Chang. 2017, 47, 88–94.
49. Kollmuss, A.; Agyeman, J. Mind the gap: Why do people act environmentally and what are the barriers to pro-environmental
behavior? Environ. Educ. Res. 2002, 8, 239–260.You can also read