Muscle allele specific expression QTLs may affect meat quality traits in Bos indicus
←
→
Page content transcription
If your browser does not render page correctly, please read the page content below
www.nature.com/scientificreports
OPEN Muscle allele‑specific expression
QTLs may affect meat quality traits
in Bos indicus
Jennifer Jessica Bruscadin1, Marcela Maria de Souza2, Karina Santos de Oliveira1,
Marina Ibelli Pereira Rocha1, Juliana Afonso5, Tainã Figueiredo Cardoso3,
Adhemar Zerlotini4, Luiz Lehmann Coutinho5, Simone Cristina Méo Niciura3 &
Luciana Correia de Almeida Regitano3*
Single nucleotide polymorphisms (SNPs) located in transcript sequences showing allele-specific
expression (ASE SNPs) were previously identified in the Longissimus thoracis muscle of a Nelore (Bos
indicus) population consisting of 190 steers. Given that the allele-specific expression pattern may
result from cis-regulatory SNPs, called allele-specific expression quantitative trait loci (aseQTLs),
in this study, we searched for aseQTLs in a window of 1 Mb upstream and downstream from each
ASE SNP. After this initial analysis, aiming to investigate variants with a potential regulatory role,
we further screened our aseQTL data for sequence similarity with transcription factor binding sites
and microRNA (miRNA) binding sites. These aseQTLs were overlapped with methylation data from
reduced representation bisulfite sequencing (RRBS) obtained from 12 animals of the same population.
We identified 1134 aseQTLs associated with 126 different ASE SNPs. For 215 aseQTLs, one allele
potentially affected the affinity of a muscle-expressed transcription factor to its binding site. 162
aseQTLs were predicted to affect 149 miRNA binding sites, from which 114 miRNAs were expressed
in muscle. Also, 16 aseQTLs were methylated in our population. Integration of aseQTL with GWAS
data revealed enrichment for traits such as meat tenderness, ribeye area, and intramuscular fat . To
our knowledge, this is the first report of aseQTLs identification in bovine muscle. Our findings indicate
that various cis-regulatory and epigenetic mechanisms can affect multiple variants to modulate the
allelic expression. Some of the potential regulatory variants described here were associated with the
expression pattern of genes related to interesting phenotypes for livestock. Thus, these variants might
be useful for the comprehension of the genetic control of these phenotypes.
Allele-specific expression (ASE) or allelic expression imbalance is a pattern that reflects the expression differ-
ence between copies of a gene from each chromosome (i.e., alleles)1. When ASE is parentally guided, it is named
genomic imprinting, caused by epigenetic modifications with cis action, which result in the monoallelic expres-
sion of genes essential for mammal growth and d evelopment2.
Genes showing ASE in their transcripts, as evidenced by the analysis of single nucleotide polymorphisms
(SNP) alleles within them, are called ASE genes. ASE genes have been shown to affect phenotypes for livestock,
such as adipogenesis and lipid metabolism in p igs3. The knowledge about regions with ASE and their regulatory
mechanisms is relevant to improve animal breeding programs by increasing the accuracy of predictive m odels4.
De Souza et al.5 identified SNPs in transcribed regions showing allele-specific expression patterns (ASE SNPs) in
the muscle of Nelore (Bos indicus) related to meat tenderness, an important trait for meat consumer’s approval6,7.
Many of these SNPs were located within genes responsible for essential biological functions for muscle develop-
ment and meat t enderness5.
Recent studies have explored putative regulatory mechanisms that may be responsible for ASE and genomic
imprinting8–10. For instance, ASE can be caused by differential methylation in regulatory regions of the two
parental alleles11. DNA methylation is a well-known imprinting mark in CpG islands12, DNA regions with
clusters of cytosine followed by guanine dinucleotides. This type of epigenetic modification, when presented in
1
Post‑Graduation Program of Evolutionary Genetics and Molecular Biology, Center of Biological Sciences
and Health, Federal University of São Carlos, São Carlos, SP, Brazil. 2Post‑Doctoral Fellow, Department of
Animal Science, Iowa State University, Ames, IA, USA. 3Embrapa Pecuária Sudeste, P. O. Box 339, São Carlos,
SP 13564‑230, Brazil. 4Embrapa Informática Agropecuária, Campinas, SP, Brazil. 5Department of Animal Science,
University of São Paulo/ESALQ, Piracicaba, SP, Brazil. *email: luciana.regitano@embrapa.br
Scientific Reports | (2021) 11:7321 | https://doi.org/10.1038/s41598-021-86782-2 1
Vol.:(0123456789)
www.nature.com/scientificreports/
promoters, can suppress transcription when the CpG islands are hypermethylated, while active transcription
shows no methylation or few isolated methylation e vents11. Another mechanism involved with the ASE pattern
is the presence of differences on microRNA (miRNA) binding sites between the a lleles13,14, once miRNAs can
impair the translation by degrading the target mRNA s equence15. Similarly, sequences showing an affinity for a
transcription factor (TF), i.e., a transcription factor binding site (TFBS), may promote or suppress the transcrip-
tion of the allele in phase with the given TFBS. Thus, in a heterozygous locus, if the regulatory region of only
one allele has an affinity with the transcription factor (TF), this cis-regulatory variant can also lead to A
SE16.
To discover regulatory mechanisms causing ASE, we can execute an initial screening analysis to identify SNPs
associated with a given transcript’s unequal allele expression pattern: the ASE-quantitative trait loci (aseQTLs)17.
From this initial screening, aseQTLs that present any evidence of being related to interesting phenotypes and
regulatory mechanisms affecting allelic expression can be prioritized for further analysis. AseQTLs can contribute
to the understanding of expression regulation of genes associated with economic traits and how alleles under
selection are expected to be expressed in the offspring18–23.
Herein, we investigated aseQTLs associated with allelic expression imbalance, evidenced by the number
of reads corresponding to different SNP alleles in transcripts, previously described in a Nelore experimental
population5. We then analyzed its involvement with predicted regulatory mechanisms, such as DNA methyla-
tion, whether they contained TFBS or miRNA binding sites. This study aimed to add a new knowledge layer
about genomic regulation in Nelore muscle, describing potential mechanisms involved in the allelic expression
of genes related to relevant phenotypes in bovine.
Results
aseQTLs analysis. We retrieved a total of 82,384 SNPs after filtering the original genotype file (429,513
SNPs from 190 Nelore samples), considering a 1 Mb sized window around the 820 SNPs with significant ASE.
Despite this initial dataset, only 22,470 tests were valid due to the requirement of 10 heterozygous samples for
both the aseQTL candidate and the SNP marking allelic imbalance. In this context, only 192 SNPs with ASE were
tested in the aseQTL analysis. Allelic imbalance ratio values were compared between groups of homozygous
and heterozygous animals for each SNP to be tested as aseQTL. AseQTL analysis resulted in 1134 significant
aseQTLs (P value ≤ 0.05), associated with 126 SNPs marking allelic imbalance of 85 genes. AseQTLs reference
alleles have a mean frequency of 0.67, ranging from 0.49 to 0.94. Figure 1 represents ASE SNPs and aseQTLs
distributions through the chromosomes.
Three SNPs marking ASE were also identified as aseQTLs: rs136209194, located in the intergenic region,
which acts like an aseQTL for the rs132817153 SNP; rs109842586 (XIRP2), associated with the ASE pattern of
the rs109372848 SNP; and rs136097891 (MTUS1), an aseQTL for the rs109005284 SNP (MTUS1). AseQTLs
association results can be found in Supplementary Table 1.
The average number of aseQTLs per ASE SNP was nine (ranging from one to 56). The rs134422650 marker
was associated with the highest number of aseQTLs (56). The second one was the rs110850310, located in the
HSPA1A gene, with 38 aseQTLs. Figure 1 shows that some genomic locations had several aseQTLs (red ring)
because they had multiple SNPs with allelic imbalance (grey ring) nearby, for example, between 15 and 20 kb
positions of the chromosome 2 or between 10 and 15 kb of the chromosome 10.
Most aseQTLs affected the ASE marked by a unique SNP. Still, we found the rs132798564 aseQTL simultane-
ously associated with four ASE SNP markers of the CMYA5 gene, and the rs110663707 aseQTL was associated
with three SNPs, also of the CMYA5 ASE gene. Moreover, 54 aseQTLs were associated simultaneously with
different SNP pairs.
An average distance of 404,983 bp (varying from 281 bp to 1.1 Mb) was observed between aseQTLs and the
respective transcription start sites (TSSs) of affected ASE genes. Moreover, the average distance between an ase-
QTL and its associated SNP marker for ASE was 417,698 bp (ranging from 2238 bp to 999,650 bp). AseQTLs were
more frequently located close to the TSS of ASE genes and their associated SNPs (from 0 to 100 kb), becoming
less frequent as the distance increases, especially in intervals larger than 1 Mb. Figure 2 shows aseQTLs distribu-
tion compared with the ASE SNPs and the TSSs of genes showing ASE in their transcripts.
Linkage disequilibrium analysis. Firstly, we evaluated the linkage disequilibrium (LD) between all ase-
QTLs to investigate LD blocks with associated regulatory elements. A total of 3030 aseQTL pairs showed D′
greater than 0.8, and 1813 of them were in total disequilibrium (D′ = 1). In our aseQTL data, we identified 117
LD blocks (Supplementary Table 2) that included between two to 21 aseQTLs. The largest LD block contained
21 aseQTLs (Fig. 3) and affected 5 SNPs marking the ASE of the CMYA5 gene.
Then, we performed the same analysis considering all SNPs located in transcripts showing ASE to observe
if LD should be regarded on accounting for redundant aseQTL affecting the same allelic transcript. A total of
32 ASE SNPs pairs showed D′ > 0.8, being 31 with D′ = 1, distributed in 11 LD blocks (Supplementary Table 3).
Seven blocks consisted of two neighboring SNPs marking ASE within the same gene, i.e., ASB5, ATP1A2, TXNIP,
NXN, MAP4, EIF5, and CAVIN4 genes. For the gene XIRP2, two ASE SNP pairs were within two LD blocks.
Three SNPs inside unknown ASE genes were within the same LD block, whereas the larger LD block involved
five SNPs, all of them inside the CMYA5 gene.
Lastly, we evaluated LD values between SNPs marking ASE and their respective associated aseQTLs. From
1134 SNP pairs submitted to LD analysis, 238 showed D’ higher than 0.8, and 71 aseQTL/ASE SNP pairs were
in total disequilibrium (D’ = 1) (Supplementary Table 4) corresponding to 35 ASE genes. The gene CMYA5 was
identified as presenting more aseQTL/ASE SNP interactions (38), followed by EIF5 (33) and VCP (27).
Scientific Reports | (2021) 11:7321 | https://doi.org/10.1038/s41598-021-86782-2 2
Vol:.(1234567890)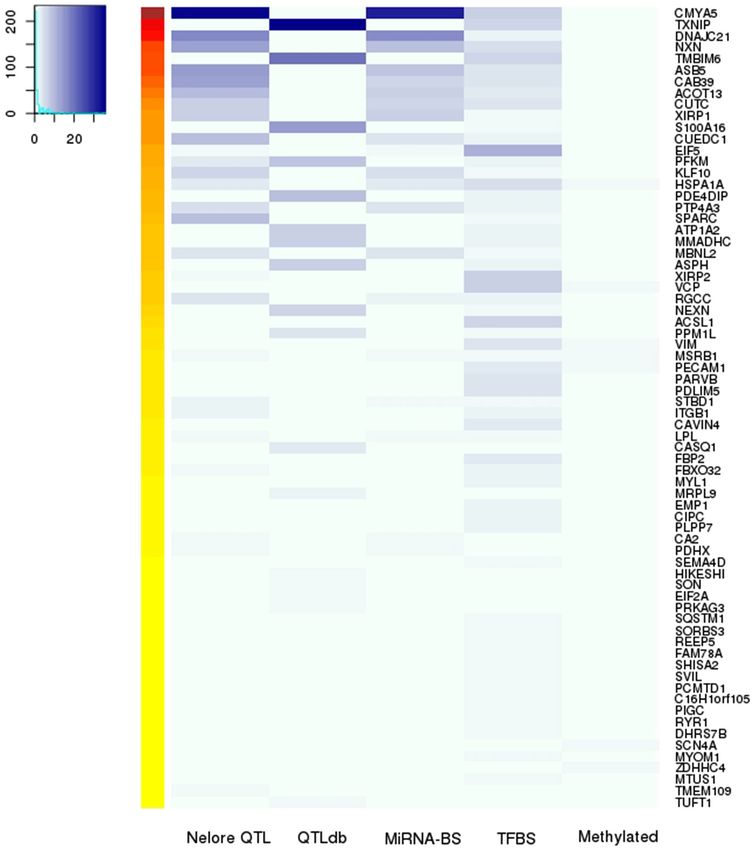
www.nature.com/scientificreports/
Figure 1. SNPs and aseQTLs distribution through the bovine chromosomes, overlap with previous QTL studies
and predicted aseQTL regulatory mechanisms (TFBS, miRNA binding site, or methylated site). ASE SNPs: SNPs
in transcripts with allele-specific expression, only the ASE SNPs with significant aseQTLs are displayed. aseQTL:
identified allele-specific quantitative trait loci (aseQTLs). Overlapped: aseQTLs that overlaps with previous
GWAS data made from our group. TFBS: aseQTLs that possibly enable the TF binding in only one allele.
miRNA-BS: aseQTLs that potentially modify miRNA binding sites in only one allele. Methylated: methylated
aseQTLs. The color intensity increases with increasing SNPs density in the plot scale (1 bp windows). This figure
was made using the software C ircosVCF82.
Scientific Reports | (2021) 11:7321 | https://doi.org/10.1038/s41598-021-86782-2 3
Vol.:(0123456789)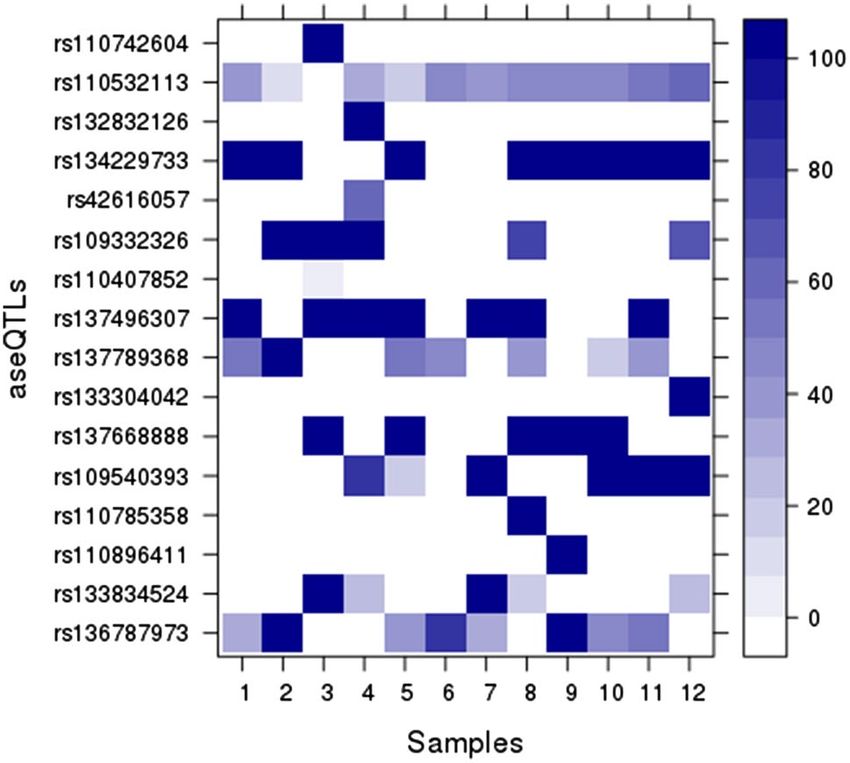
www.nature.com/scientificreports/
Figure 2. Distribution of aseQTLs concerning the distance to each associated ASE gene’s transcription start
site (TSS) in kb (in pink) and each associated SNP in kb (in blue). X-axis: distance in kb. Y-axis: frequency of
aseQTL. Histogram plotted using R basic functions.
aseQTLs overlapping with QTLs. After converting the QTLs retrieved from the Cattle QTL Database to
the current genome assembly build, ARS-UCD1.2, we identified overlaps of 173 aseQTLs within QTL regions
for 21 traits, distributed in 215 occurrences (Supplementary Table 5). The permutation approach applied to
test if the probability of the aseQTLs location within QTL regions was higher than chance, was significant (P
value = 0.0001). The three traits with the highest number of aseQTLs within a QTL region were body weight
(81 aseQTLs), milk palmitoleic acid content (42 aseQTLs), and intramuscular fat (IMF) (28 aseQTLs). The
rs136717535 aseQTL overlapped with regions of more QTL traits: milk kappa-casein percentage, milk protein
percentage, shear force, calf size, and birth index.
We also integrated data with other studies produced by our research group, with a broader sample of the same
experimental population. All permutation tests performed for QTL ranges data were significant (P value ≤ 0.05).
We identified 234 aseQTLs distributed in 894 overlaps with 25 traits (Supplementary Table 6). The aseQTLs
that integrate with GWAS data from our research group are distributed in the blue ring of Fig. 1. Of these, we
identified 847 overlaps with meat quality traits21. Table 1 shows the number of overlapping aseQTLs with QTLs
associated with meat quality traits and the complete name of each trait.
The rs109550233 SNP, marker of allelic imbalance, presented more associated aseQTLs overlapping with
QTLs for meat quality traits than any other in this study, with nine aseQTLs within regions of QTLs for nine
traits, b*FAT, BFT, CL, L*FAT, L*MUSCLE, REA, WBSF0, WBSF7, and WHC, followed by the rs135906938
SNP (ACOT13 gene), with eight aseQTLs in QTLs for eight meat quality traits, i.e., b*FAT, BFT, CL, L*FAT,
L*MUSCLE, REA, WBSF7, and WHC. Thirty-five aseQTLs associated with six SNPs marking ASE of CMYA5
overlapped with seven meat quality traits: b*FAT, CL, L*FAT, REA, WBSF0, WBSF7, and WHC.
Ten aseQTLs overlapped with mineral content QTLs for Co, Mn, Zn, Ca, Cr, Ar, K, Mg, and S 24; seven over-
lapped with QTLs for IMF composition, which were also associated with octadecenoic acid25; Six overlapped
with feed efficiency associated traits: efficiency of gain (EG), maintenance efficiency (ME) and partial efficiency of
growth (PEG)26. Additionally, 20 aseQTLs overlapped with cis-eQTL regions and four with trans-eQTL regions27.
Annotation of the aseQTL SNPs. According to aseQTL locations in the genome, we predicted SNP
consequences with the VEP software28 (Supplementary Table 7). AseQTLs were predominantly distributed in
intronic regions (68%), followed by intergenic regions (27%). The remaining approximately 5% were distributed
equally in non-coding transcription regions, 3′UTR variants, missense variants, and synonymous variants. Four
SNPs, rs132671408 (in the AOPEP gene), rs135305605 (in the RUSC2 gene), rs136155631 (in the RAI14 gene)
and rs43291678 (in the CCDC141 gene) were within the 5′UTR regions and three were located in splice regions:
rs109091165 (inside PECAM1 gene), rs133325919 (inside FAIM2 gene) and rs137526254 (inside MYO6 gene).
Methylated aseQTLs. To analyze the methylation pattern, we compared the positions of aseQTLs with the
methylation percentage of SNPs identified by RRBS in 12 samples. We identified 69 methylated cytosines in 16
aseQTLs, whose distribution is shown in the purple ring of Fig. 1. The rs110532113 aseQTL, associated with an
ASE SNP on the MSRB1 gene, was methylated in 11 of the 12 tested animals. Thirteen aseQTLs had 37 cytosines
with 100% of methylation in the samples. Eight animals showed 100% of methylation in the rs134229733 ase-
QTL, and seven animals in the rs137496307 aseQTL, associated with an SNP marker of ASE of the VIM gene
(Fig. 4; Supplementary Table 8).
Scientific Reports | (2021) 11:7321 | https://doi.org/10.1038/s41598-021-86782-2 4
Vol:.(1234567890)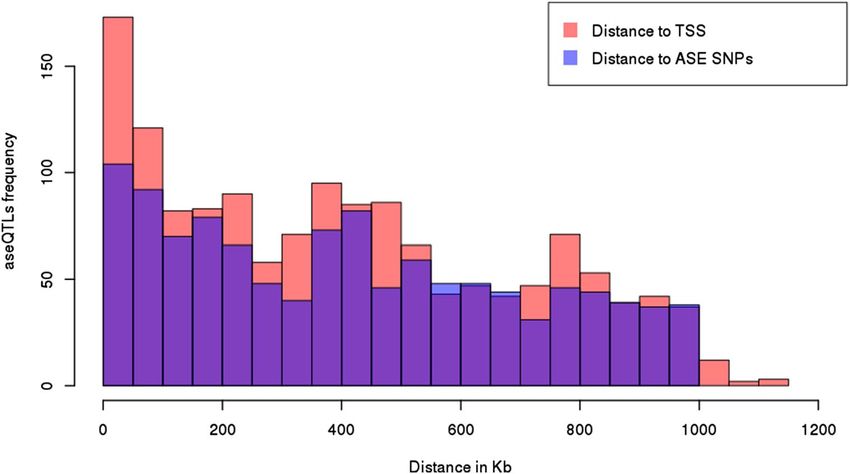
www.nature.com/scientificreports/
Figure 3. The biggest aseQTLs-LD block, located on chromosome 10, containing 21 aseQTLs. Red squares
without numbers are SNPs in total LD, and the numbers within them indicate the intensity of the LD from 0
to 99. The intensity of the reddish tones increases proportionally to the LD values. The genomic position of the
SNP rs137303208 is indicated with the dashed red line. All the SNPs in the block were within miRNAs binding
sites. The blue star indicates that the SNP rs137303208 also was identified within TFBS. Gene representation was
obtained in the Ensembl database and the LD plot was made using Haploview76. The two graphics were joined
without any scale.
Six methylated aseQTLs were associated with SNPs inside transcribed regions with the allelic imbalance of
seven genes: HSPA1A, MSRB1, VCP, VIM, SCN4A, PECAM1, and ZDHHC4, being the rs137668888 aseQTL
simultaneously associated with the ASE marked by SNPs of SCN4A and PECAM1 genes. The rs110407852 was the
methylated aseQTL closest to the TSS region of the respective associated gene (VCP), at a distance of 51,026 bp
from it. The average distance of these methylated aseQTLs and the TSS of associated ASE genes was 216,169 bp.
The other ten methylated aseQTLs were associated with 9 ASE SNPs. The rs42616057 and rs109332326 aseQTLs
were both methylated and associated with the allelic imbalance of rs110095343 SNP.
aseQTLs within TFBS. Using 50 bp flanking sequences of all aseQTLs as input in TRAP software29, we
found 83 TFBS overrepresented in our sequences (FDR < 0.05, Supplementary Table 9). Of them, only 12 TFs
Scientific Reports | (2021) 11:7321 | https://doi.org/10.1038/s41598-021-86782-2 5
Vol.:(0123456789)www.nature.com/scientificreports/
Meat quality traita Number of aseQTLs Affected ASE genes
ACOT13, ASB5, CA2, CAB39, CMYA5, CUEDC1, DNAJC21, ITGB1, KLF10, MBNL2, NXN,
Ribeye area (REA) 192
PTP4A3, RGCC, SPARC, STBD1, XIRP1, XIRP2
Lightness of fat (L*FAT) 127 ACOT13, ASB5, CAB39, CMYA5, DNAJC21, ITGB1, KLF10, NXN, SPARC, STBD1
Warner–Bratzler shear force 7 days after slaughter (WBSF7) 122 ACOT13, ASB5, CAB39, CMYA5, DNAJC21, ITGB1, KLF10, SPARC, STBD1
Water holding capacity (WHC) 113 ACOT13, ASB5, CAB39, CMYA5, DNAJC21, ITGB1, KLF10, SPARC, STBD1
Cooking loss (CL) 105 ACOT13, ASB5, CMYA5, DNAJC21, ITGB1, SPARC, STBD1
Yellowness of fat (b*FAT) 100 ACOT13, CAB39, CMYA5, DNAJC21, ITGB1, KLF10, SPARC, STBD1
Warner–Bratzler shear force 24 h after slaughter (WBSF0) 46 CMYA5, PFKM
Lightness muscle (L*MUSCLE) 23 ACOT13, SPARC,
Backfat thickness (BFT) 17 ACOT13, STBD1
Warner–Bratzler shear force 14 days after slaughter (WBSF14) 2 SPARC
Table 1. Allele-specific expression quantitative trait loci (aseQTLs) overlapping meat quality traits identified
in Nelore muscle and allele specific expression (ASE) genes affected by aseQTLs.
Figure 4. Percentage of aseQTLs methylation in 12 Nelore animals. The color intensity increases proportionally
according to the methylation percentage for each SNP per sample. Heatmap plotted with Lattice R package
(http://lattice.r-forge.r-project.org/).
are expressed in bovine muscle30. Considering only aseQTLs that change muscle-expressed TFBS, we found 215
aseQTLs, distributed in the pink ring of Fig. 1. From these, 150 presented putative TFBS with the reference allele
and 117 with the alternative allele. The SMAD4 binding site was found affected by 37 aseQTLs; AHR by 31 ase-
QTLs; VDR and SP3 by 26 aseQTLs; STAT3 by 25 aseQTLs; PPARA by 24 aseQTLs; DR1, TAL1, and ZNF219 by
20 aseQTLs; STAT6, SP1, and MZF1 TFs were affected by 16, 12, and 10 aseQTLs, respectively.
aseQTLs within miRNA binding sites. We used a subset of 163 aseQTLs identified outside intergenic
regions and that overlapped with our reference population’s QTL data for miRNA binding site prediction. We
identified 153 miRNA binding sites corresponding to 163 aseQTLs flanking sequences. Considering miRNA
binding sites affected by aseQTL, we obtained 1448 aseQTLs/miRNA binding site pairs. In silico analysis of
these pairs predicted 693 miRNA binding sites with the alternative aseQTL allele, whereas 755 binding sites
were predicted in the reference aseQTL allele (green ring of Fig. 1). The pairs were formed with 162 aseQTLs and
149 miRNAs, being 114 miRNAs expressed in the muscle of our p opulation31. These muscle-expressed miRNAs
were denoted without an asterisk in Supplementary Table 10, which contains the results of miRNA binding sites
prediction.
We analyzed whether the ASE genes were previously identified as targets for the miRNAs affected by the
associated aseQTLs with the MiRWalk t ool32. Twenty genes associated with aseQTLs that potentially change
miRNA binding sites’ affinity were used in the MiRWalk analysis. These genes were targets for 583 miRNAs.
From these, 31 miRNAs had their binding sites affected by the aseQTLs predicted to regulate 14 ASE genes,
which were themselves identified as targets for the corresponding miRNAs.
Scientific Reports | (2021) 11:7321 | https://doi.org/10.1038/s41598-021-86782-2 6
Vol:.(1234567890)www.nature.com/scientificreports/
In the following examples, aseQTLs affected the binding sites of miRNAs known to affect the ASE gene
in question. The rs42437277 aseQTL, associated with the allelic imbalance of the ASB5 ASE gene, was pre-
dicted to affect the binding of five miRNAs. The rs133661649 aseQTL, associated with an SNP showing ASE of
the LPL gene, and the rs109408013 aseQTL, associated with the ASE SNP of NXN gene, were both targets of
three miRNAs. Seven aseQTLs were affecting two miRNA binding sites that potentially regulate the associated
genes: rs41255633 (NXN), rs135834852 (NXN), rs136463427 (CUEDC1), rs110417686 (CUEDC1), rs132705216
(MBNL2), and rs137489440 (MBNL2), rs133710221 (CAB39). The complete list of aseQTLs affecting the binding
sites of miRNAs known to target the ASE genes is in Supplementary Table 11.
Regulatory mechanisms summary. In short, we predicted three regulatory mechanisms in our aseQTL
data: methylation, TFBSs, and miRNA binding sites. Only one aseQTL, rs109540393, associated with the ASE
present in the rs109550233 SNP genomic location, was methylated in six animals of our population and was
potentially creating the binding site of the AHR TF. Six miRNAs expressed in Nelore muscle had binding sites
created by the aseQTL rs109540393, five matching the reference allele sequence and one the alternative allele.
This aseQTL overlapped with nine meat quality traits. Moreover, 33 aseQTLs were within two regulatory mecha-
nisms, 354 were predicted to have one regulatory mechanism, and 746 did not show any regulatory evidence.
Supplementary Table 12 contains the number of regulatory mechanisms or overlapping QTLs for each aseQTL.
In Fig. 5, we integrate all our results to identify interesting ASE genes with associated aseQTLs in regulatory
regions. The top 10 ASE genes, according to the number of aseQTLs with relevant attributes, ranging from 73 to
15 aseQTLs, were CMYA5, TXNIP, DNAJC21, NXN, TMBIM6, ASB5, CAB39, ACOT13, CUTC, and CUEDC1,
respectively. Considering each section of results, represented in Fig. 5 as columns, the top gene for each category
was: CMYA5, with 35 aseQTLs overlapping seven meat quality traits identified in our Nelore population; TXNIP,
with 36 aseQTLs located in QTL regions from Cattle QTL Database; CMYA5 with 31 aseQTLs potentially chang-
ing the binding of miRNAs and EIF5 gene showed 11 aseQTLs in TFBSs. Additionally, seven genes showed one
methylated aseQTL.
Discussion
In this study, we identified 1134 aseQTLs associated with the ASE pattern of 126 SNPs in the Longissimus tho-
racis muscle of Nelore steers. Due to the sample requirement to associate each SNP marking ASE and aseQTL
SNP, we tested 23% (192 out of 820) SNPs with significant ASE previously detected in the same p opulation5 and
identified aseQTLs for 126 (66%) of them. Thirty-seven ASE SNPs associated with aseQTLs were also described
in a previous ASE study developed with bovine muscle samples8. Two ASE SNPs described by Guillocheau
et al. (2019) were identified here as aseQTLs: rs109170993, associated with the rs110850310 ASE SNP, and
rs109842586, associated with the rs109372848 ASE SNP. The rs109842586 was also identified marking ASE in
our population as well5.
Sixteen percent of our aseQTL data overlapped with QTL regions from the Cattle QTL Database, showing
enrichment for milk quality and production traits, although we must consider a bias in the frequency of publica-
tions for each trait in that database. The rs136717535 aseQTL, which presents more overlapping QTLs from Cattle
QTL Database, including for shear force, was associated with the ASE SNP rs41257152. This SNP is located in the
HIKESHI gene, which mediates heat stress-induced nuclear transport of Hsp70 heat shock proteins, protecting
cells from heat shock damage33,34. Nelore cattle are widely valued by their heat t olerance35,36, and this aseQTL
potentially regulates a heat stress-related gene’s allelic expression. Moreover, the Hsp70 protein had a lower
abundance in more tender muscle37 in the Nelore population used in this study, thus reinforcing this aseQTL as a
potential regulatory variant for shear force in Nelore. On the other hand, comparisons with our Nelore population
QTL data revealed enrichment for meat quality traits, with 94.7% of the overlapped aseQTLs located in regions of
10 meat quality phenotypes21. For example, SPARC-associated aseQTLs overlapped with lightness and yellowness
of fat, WBSF7, and WBSF14, being this gene identified as differentially expressed between contrasting samples
for IMF c ontent27 in our population, and also classified as a potential target for IMF and tenderness in s wine38,39.
Seven QTL regions, including for BFT, b*FAT, and L*FAT, overlapped with aseQTLs associated with the allelic
imbalance of an SNP of the STBD1 gene, which was differentially expressed between contrasting samples for
IMF content27. Additionally, CMYA5 had 245 overlaps between aseQTLs and QTLs for b*FAT, CL, L*FAT, REA,
WBSF0, WBSF7, and WHC traits. In addition, ASE genes in the bovine muscle functionally enriched for meat
quality traits were previously identified in our population5 and elsewhere8. Although these overlaps with QTLs
might be useful for prioritizing SNPs for validation, a word of caution is necessary, as the confidence intervals
for the QTLs might be considerable and could not be taken into account in our analyzes.
As expected, most aseQTL associations with more than one SNP marking ASE were with ASE SNPs blocks
that presented total LD (D′ = 1), suggesting that these aseQTLs haplotypes regulate the same transcript. For exam-
ple, 14 aseQTLs located in two LD blocks were associated with 2 SNPs, displaying total LD. These SNPs marked
the allelic imbalance of the EIF5 gene, previously associated with marbling in Nelore cattle40. The rs109922571
aseQTL had strong LD among other SNPs in these two LD blocks and was predicted to affect miRNA and TF
binding sites. Another example was the rs132798564 aseQTL, associated with four SNPs in the transcribed ASE
regions of the CMYA5 gene, with total disequilibrium (D′ = 1) within their block. Additionally, 15 aseQTLs were
associated with the ASE of two different pairs of CMYA5 SNPs, each of them in complete LD (D′ = 1). CMYA5
was associated with IMF in pigs41. It lies within regions associated with REA in Nelore cattle40 and six other
meat quality t raits21. This gene encodes for a desmin-associated p rotein42, which can regulate vesicular/lysosome
trafficking43. The autophagy-lysosome pathway is a degradation system involved in muscle wasting and muscular
atrophy44. Moreover, CMYA5 protein may protect from a utolysis45 the CAPN3, whose variants were associated
with meat tenderness in zebu cattle46. The aseQTLs distributed in LD blocks within the CMYA5 gene may be
Scientific Reports | (2021) 11:7321 | https://doi.org/10.1038/s41598-021-86782-2 7
Vol.:(0123456789)www.nature.com/scientificreports/
Figure 5. Heatmap of the aseQTLs distribution according to the associated gene and the regulatory regions
predicted here. In the rows are the ASE genes for which we found at least one aseQTL inside a regulatory
region. Columns represent “results sections”: Nelore QTLs have the number of aseQTLs that overlapped with
Nelore GWAS data; QTLdb has the aseQTLs in QTLs regions from Cattle QTL Database; miRNA-BS, TFBS,
and methylated columns have the aseQTLs that potentially changes miRNA binding sites, transcription factors
binding sites and that was methylated. The blue scale increases according to the presence of aseQTLs in each
results section. The left heatmap with hot colors represents the total of regulatory regions that combine with our
aseQTL data for each gene. The figure was created with Gplots R package (https://github.com/talgalili/gplots).
Scientific Reports | (2021) 11:7321 | https://doi.org/10.1038/s41598-021-86782-2 8
Vol:.(1234567890)www.nature.com/scientificreports/
affecting the allelic expression of this gene. The most informative SNP, displaying strong LD with all SNPs of the
largest LD block, is located in a specific intronic region present in two out of three CMYA5 isoforms. Thus, its
enrolment on CMYA5 splicing regulation should be further investigated. Our results indicate that LD analysis
is essential for the interpretation of ASE association tests in the search for causal mutations because most of the
SNPs marking ASE and their associated aseQTLs could be reduced to LD blocks, which in turn makes it difficult
to pinpoint the causative mutation.
Both the LD results and the presence of aseQTLs nearby the respective TSS or close to the associated ASE
SNP were indicatives of potential cis-regulatory activity of aseQTLs. Cis-eQTLs and aseQTLs were identified
more frequently near the TSS of affected genes17,47,48. AseQTL annotation showed similar results as cis-regulatory
SNPs obtained in the same p opulation27, from which twenty cis-eQTLs overlapped with our aseQTL data. The
predominant distribution of aseQTLs and cis-eQTLs in intergenic and intronic regions supports the concept
that the SNPs in these genomic locations tend to have a regulatory r ole49,50.
Cis-acting variants can modify TFBSs51, resulting in the allele-specific loss of TF binding52 and leading to
ASE in heterozygous animals. We found 215 aseQTLs within 12 TFBS for TFs expressed in bovine m uscle30.
Binding sites for five different TFs were predicted to be affected by more than one aseQTL: SMAD4, AHR, VDR,
STAT3, and PPARA. All these TFs have been associated with phenotypes related to muscle tissue. SMAD4 defi-
cient knockout mice showed muscle atrophy53, PPARA was related with lipid metabolism54, VDR is a vitamin D
receptor that was suggested to regulate marbling and calcium h omeostasis55, the AHR TF was associated with
human aging , STAT3 is related to muscle wasting and muscle regeneration58,59. The alternative allele of the
56 57
rs135348406 aseQTL was identified within a STAT3-binding site and was associated with an SNP marking ASE
of HSPA1A gene, which encodes the Heat shock 70 kDa protein 1. STATs are known to modulate heat shock
proteins, including H sp7060. The reference allele of the rs137692633 aseQTL was predicted to benefit the bind-
ing of STAT3 and STAT6 transcription factors. Besides that, SP1, SP3, VDR, and ZNF219 TFs were predicted to
have a binding affinity with the alternative allele of the same aseQTL.
Epigenetic mechanisms, as DNA methylation2,11, can also be associated with ASE8,61, repressing the transcrip-
tion of a specific hypermethylated a llele11. To identify whether the methylation of these aseQTLs could have an
important role in ASE, we compared the level of allelic imbalance ratio of the ASE SNPs with the methylation
of the associated aseQTLs per animal. However, in our study, only a few animals with methylation data showed
significant ASE in an SNP associated with a methylated aseQTL. The methylated aseQTL closest to the TSS of
the respective SNP marking ASE (within VCP gene) was rs110407852, with methylation in the alternative allele.
The corresponding ASE SNP was monoallelic in nine animals, expressing only the allele in phase with the refer-
ence aseQTL allele, thus providing an indication of methylation-mediated silencing of the allele phased with
the methylated aseQTL. Similarly, three animals with the genotype 1|0 for the ASE SNP rs42719199 showed an
allelic imbalance ratio of 0.5, expressing only the alternative allele. The associated rs136787973 aseQTL showed
methylation rates of 32.30%, 80%, and 55.75% and the genotypes C|T, T|C, and T|C, respectively. Thus, it could
be postulated that, for the two animals with higher methylation levels for this aseQTL (80% and 55.75%), the
T|C aseQTL genotypes and the methylated cytosine potentially silenced the expression of the ASE SNP reference
allele, which should be further investigated. We considered that analyzing the methylation pattern in individual
candidate variants was of little value on indicating the causative variants, probably due to our restricted meth-
ylation data.
As well as methylation, m iRNAs62,63 have been related to genomic imprinting. Some studies related the
allelic imbalance with the cis-regulatory action of miRNA binding s ites64,65, which was also described in bovine
muscle8. We identified 162 aseQTLs within miRNA binding sites, potentially changing the binding affinity of 149
miRNAs, distributed in 1448 miRNA/target pairs. Among the affected, the bta-miR-423-5p and bta-miR-486
miRNAs were differentially expressed between extreme groups for IMF31 and RFI66, respectively, in our reference
Nelore population. Fourteen ASE genes affected by aseQTLs within binding sites of miRNAs were predicted as
targets for the corresponding miRNA. For instance, the rs42437277 aseQTL, associated with the ASE marked
by an SNP in the ASB5 gene, was predicted to affect the binding of five miRNAs which, in turn, are predicted to
target this gene. Thus, the integration of our data and the known miRNA-target genes information offers more
reliability for these findings.
Some aseQTLs appeared more than others among the analyzes performed in this work. The rs109540393
aseQTL, which overlapped with nine meat quality QTLs identified in our population21, was methylated, predicted
to affect a binding site of six muscle-expressed miRNAs and the TFBS of AHR. AHR was negatively associated
with aging56 and angiogenesis67, although the associated allelic imbalance SNP marker is within an unanno-
tated transcript. Finally, the CMYA5 associated aseQTLs, which showed more overlaps with Nelore QTLs (35),
contained a larger number of aseQTLs affecting miRNA binding sites (7), including sites for two differentially
expressed miRNAs for IMF and RFI. The combined results demonstrate that muscle-related aseQTLs are located
in regions associated with bovine traits, mainly enriched for meat quality QTLs, including REA, tenderness,
and IMF. Tenderness is an essential factor for consumers’ a cceptance6,7, while IMF is related to palatability and
juiciness68, sensorial characteristics that affect consumer choice and meat p rice69. Some genes seem to have a
strong aseQTL regulation, influenced by different and integrative cis-regulatory mechanisms, as CMYA5, which
the literature indicates as functionally relevant for meat quality phenotypes. These results suggested that the
aseQTLs regulating the CMYA5 gene can be candidates for the improvement of sensory traits of Nelore beef.
Thus, our results reinforce a complex regulation of ASE in bovine muscle, indicating potential cis-regulatory
variants whose effects remain to be explored due to the high LD and the lack of conclusive evidence about causal
variants. As we were not able to address false positives due to the restrictions of sampling, these results should
be interpreted along with other evidence for regulatory function for each given potential aseQTL. Future stud-
ies may prioritize SNPs based on aseQTLs for experimental validation, and methodological approaches can be
designed according to the potential regulatory mechanisms and phenotypes predicted in this work.
Scientific Reports | (2021) 11:7321 | https://doi.org/10.1038/s41598-021-86782-2 9
Vol.:(0123456789)www.nature.com/scientificreports/
Material and methods
Use of experimental animals. The study complied with the ARRIVE guidelines. All experimental pro-
cedures and animal protocol were carried out following the relevant guidelines and regulations provided by the
Institutional Animal Care and Use Committee Guidelines of Embrapa Pecuária Sudeste ethics committee (São
Carlos, São Paulo, Brazil. Protocol CEUA 01/2013). The Ethical Committee of Embrapa Pecuária Sudeste (São
Carlos, São Paulo, Brazil) approved all experiments (approval code CEUA 01/2013).
Sample collection. Details regarding the animal’s production can be found in Tizioto et al.21 Concisely, we
used a subset of the described experimental population, consisting of 190 Nelore steers. These animals were sired
by artificial insemination using 34 bulls that represented the main lineages of the breed, monetarily accessible to
any Brazilian producer and not closely related. The steers were raised until 18 months of age in three farms and
afterward maintained in three feedlots under identical nutrition at Embrapa Pecuária Sudeste (São Carlos, São
Paulo, Brazil). Animals were slaughtered according to the subcutaneous fat thickness (5 mm), with an average
weight of 383.2 kg and around 24 months of age.
DNA extraction and genotyping. The DNA was extracted from blood samples by using salting out
ethod70. DNA concentration and purity were measured by spectrophotometry in NanoDrop. Integrity inspec-
m
tion was made by agarose gel electrophoresis.
Genotyping was performed with Illumina BovineHD BeadChip (Illumina Inc, San Diego, CA, USA) at the
USDA ARS Bovine Functional Genomics Laboratory in Beltsville, MD, USA and the ESALQ Genomic Center
razil71. Quality control was performed with PLINK s oftware72 from the autosomal SNPs with
in Piracicaba, SP, B
genome coordinates corresponding to the bovine reference genome (Assembly: ARS-UCD1.2). SNPs with MAF
lower than 5%, as well as samples and SNPs with a call rate lower than 95%, were discarded. In addition, we
removed SNPs with a Hardy–Weinberg Equilibrium P value ≤ 0.0001. This genotype file has a total of 429,513
SNPs available for ASE analysis. The genotypes were phased using BEAGLE software73 with default configura-
tions. We did not use imputation parameters and did not use a pedigree file, so all the samples were considered
unrelated individuals.
RNA extraction and sequencing. A total of 100 mg of Longissimus thoracis tissue from 190 animals were
collected immediately after slaughter, submerged in liquid nitrogen, and stored at − 80 °C until RNA extraction.
Total RNA extraction and RNA sequencing methodology were described e lsewhere27. Briefly, RNA extraction
was made using TRIzol reagent (Life Technologies, Carlsbad, CA, USA), following the manufacturer’s instruc-
tions. Bioanalyzer 2100 (Agilent, Santa Clara, CA, USA) was used to verify the RNA integrity and the TruSeq
RNA Sample Preparation kit v2 guide (Illumina, San Diego, CA) was used to prepare the RNA libraries from
2 µg of RNA. We also used the Bioanalyzer 2100 to determine the average size of the libraries and the quantita-
tive PCR with the KAPA Library Quantification kit (KAPA Biosystems, Foster City, CA, USA) to carry out the
quantification. Clustering and sequencing were performed with Illumina HiSeq 2500 (Illumina, San Diego, CA,
USA), and SeqyClean software (https://github.com/ibest/seqyclean) was used to remove sequencing adapters
and low complexity reads. The quality control was performed with FASTQC software version 0.10.1 (https://
www.bioinformatics.babraham.ac.uk/projects/fastqc/). The sequencing was performed at the Genomics Center
at ESALQ, Piracicaba, São Paulo, Brazil, and archived on the European Nucleotide Archive (ENA) under acces-
sions: PRJEB13188, PRJEB10898, and PRJEB19421.
ASE analysis. SNPs located in regions showing ASE were obtained from De Souza et al. (2020). In brief, the
authors identified heterozygote SNPs from Illumina BovineHD BeadChip genotyping data, and the genotypes
were phased and organized in individual files. Together with the bovine reference genome (ARS_UCD1.2), these
files were used as inputs in the ALEA algorithm74, which created two diploid homozygous genomes basing on
the two haplotypes from each heterozygous animal. After that, the RNA-Seq reads of the 190 steers were aligned
to each in silico-created genome, resulting in the counts of reads that mapped the first or second haplotype per
SNP and individual. A binomial test was applied to determine if allele counts were statistically divergent for each
SNP and animal. Finally, a total of 820 SNPs in ASE (FDR < 0.05) were described and used in this study5.
aseQTLs identification. For the ASE-association test, we selected SNPs within 1 Mb upstream and down-
stream from each SNP marking ASE identified p reviously5 because this window probably encompasses cis-reg-
ulatory SNPs. To test for the presence of aseQTLs, the mean values of allelic expression imbalance, i.e., the ratio
of counts from each allele, were computed and compared between heterozygote and homozygote animal groups
for the candidate aseQTL, using the non-parametric Wilcoxon Rank Sum test (P-value ≤ 0.05)17. If an SNP has
regulatory action on the allelic expression, we only can observe ASE when the genotype is heterozygous. If this
SNP is in homozygosis, the two alleles will contribute equally to allelic expression. Thus, the identification of an
aseQTL occurs if animals of the heterozygous aseQTL group had an imbalance of allelic expression (present in
the SNP marking ASE) significantly higher than any homozygous aseQTL group, being always tested with the
homozygous group with more animals. This analysis required a minimum of 10 heterozygous animals for each
test, both in candidate’s aseQTLs and ASE SNPs.
The aseQTLs identification methodology comprises a non-parametric test and requires a large number of
heterozygotes, which makes it more restrictive, being more rigorous for an association to be significant. The
required minimum repetition of genotypes in the population increases confidence for the results, but unfor-
tunately, such conditions turn unviable the correction for multiple tests due to a large number of tests for few
Scientific Reports | (2021) 11:7321 | https://doi.org/10.1038/s41598-021-86782-2 10
Vol:.(1234567890)www.nature.com/scientificreports/
significant results. As the aseQTLs are candidate SNPs for the understanding of bovine regulation, thus to be
further verified by other methods, we followed the method described p reviously17 and, as in that reference, we
did not apply any method for multiple comparisons correction.
The aseQTL allele frequency was computed with VCFtools software75. To compare aseQTL positions with the
TSS, we extracted from BioMart (Ensembl Release 98. Access in: https://www.ensembl.org/biomart/martview)
the TSS positions for all annotated ASE genes. AseQTLs SNPs were annotated using the Variant Effect Predictor
(VEP, Ensembl Release 98) s oftware28.
Linkage disequilibrium analysis. Some associations between SNPs may result from population dynam-
ics, such as the presence of LD by calculating D’ statistics. We choose D’ statistics because it is less sensitive to
allele frequency than R2 and we aimed to inspect any possible LD, including rare variants. We calculated LD to
investigate allele relationship among aseQTLs and SNPs located in ASE regions in three ways using the software
Haploview76: (1) LD analysis between aseQTLs and their respective ASE SNPs (to verify if the high LD is relevant
for ASE-association test significance); (2) LD analysis between all aseQTLs (to investigate possible ambiguous
results and indicate conserved cis-regulatory elements within an LD block); and III) LD analysis among the
SNPs marking ASE (to understand whether the same aseQTLs can be associated with more than one ASE SNP
because of high LD).
The overlap between aseQTLs and GWAS data. We intersected data from aseQTLs with QTL regions
previously associated with economic traits for beef cattle. For an overview on how aseQTLs can affect pheno-
types of interest in other populations, the overlap of each aseQTL position was intersected with QTL positions
obtained from the Cattle QTL database (Assembly: UMD_3.1) (https://www.animalgenome.org/QTLdb/cattle/
downloaded in June 2019).
AseQTLs were integrated with data described by our research group for eQTL27 and QTLs, using a larger
population that comprised the animals used here, identified by GWAS of meat quality traits21, mineral content24,
feed efficiency26, and IMF c ontent25. For the integration with position ranges of QTLs, a permutation test was
performed with 1000 iterations using RegioneR p ackage77 to investigate the randomness of aseQTL locations
within these potential regulatory regions. In both QTL overlap analyses, we could not correct for a confidence
interval of QTLs since this information was not available.
All the GWAS data obtained by our research group or in the Cattle QTL database in studies performed with
the UMD 3.1.1 reference genome was converted for the ARS-UCD1.2 version using Lift Genome Annotations
UCSC tool (https://genome.ucsc.edu/cgi-bin/hgLift Over).
Methylation profile. To determine the methylation profile in Nelore muscle, we subset 12 animals of our
population for the Reduced Representation Bisulfite Sequencing (RRBS), selected based on the ranking of the
estimated breeding value (EBV) for the tenderness phenotype78. The muscle samples were collected as described
before, and DNA extraction was made by using DNeasy Blood & Tissue kit (Qiagen, Hilden, Germany), accord-
ing to the manufacturer’s protocol. DNA concentration was quantified with Qubit dsDNA High Sensitivity Assay
(Thermo Fisher Scientific). The quality was measured with Fragment Analyzer and DNF-487 Standard Sensitiv-
ity or the DNF-488 High Sensitivity Genomic DNA Analysis Kit (Advanced Analytical).
The RRBS experiments were performed by Diagenode. Each sample library was prepared from 100 ng of
genomic DNA using the Premium RRBS kit (Diagenode), according to the manufacturer’s protocol. Bisulfite
conversion efficiency independent of the CpG context was assessed by adding methylated and unmethylated
spike-in controls (concentration of 0.1%). In summary, the protocol consisted of the digestion of DNA by the
MspI enzyme, followed by the fragment end repair and addition of adaptors. Thus, samples were quantified by
qPCR, being the Cq values used to pool samples by similarity. Bisulfite conversion was performed using the
Premium RRBS kit (Diagenode) according to the manufacturer’s protocol, followed by library enrichment by
PCR. Adequate fragment size distributions were confirmed by Bioanalyzer High Sensitivity DNA chips (Agilent).
Libraries were sequenced on Illumina HiSeq 3000 using single-end 50 bp reads. Sequencing read quality con-
trol was performed using FastQC version 0.10.1 (https://www.bioinformatics.babraham.ac.uk/projects/fastqc/),
and adaptors were removed by Trim Galore! Version 0.4.1. (http://www.bioinformatics.babraham.ac.uk/proje
cts/trim_galore/). Bismark version 0.16.179 was used to align the reads to the Bos taurus reference genome ARS-
UCD1.2 and to identify methylated cytosines.
The methylation profile was calculated by the percentage of methylation in a given region, dividing the num-
ber of methylated cytosines in that region by the sum of the methylated and unmethylated cytosines, multiplied
by 100.
Regulatory mechanism prediction. We performed three different approaches to investigate whether the
aseQTL had additional evidence for being considered as the causal SNP affecting the allele-specific expression
and predict possible regulatory mechanisms involved. First, we checked the methylation percentage in aseQTLs
by integrating the exact positions of the aseQTLs and the methylated SNPs, which data was resultant from the
RRBS experiment. Then, we compare if the animals with methylated aseQTL showed significant ASE5 to observe
the existence of an interaction between the methylation and the allelic imbalance in that animal.
The aseQTLs with TFs affinity were identified using TRAP software (Transcription Factor Affinity Prediction)
for multiple sequences29. The analyses were performed using the flanking sequences considering a window of
25 bp downstream and upstream to the aseQTL, with data from Transfac 12.1 Metazoans matrix and background
model of chordate conserved elements. The resulting TFs were overlapped with a list of manually curated TFs
expressed in bovine muscle30. We considered significant interactions whether the corrected P-values were ≤ 0.05
Scientific Reports | (2021) 11:7321 | https://doi.org/10.1038/s41598-021-86782-2 11
Vol.:(0123456789)www.nature.com/scientificreports/
(with the Benjamini–Hochberg correction). We selected aseQTLs that changed the TF binding with the refer-
ence or alternative allele.
The third approach was to find aseQTLs overlapping predicted miRNA binding sites. To filter all the aseQTLs
dataset for the miRNA binding site prediction, we used the aseQTLs outside of intergenic regions that integrate
with other QTL regions identified in our population. The prediction of miRNA binding sites in our aseQTLs
was made with the RNAhybrid s oftware80. RNAhybrid calculates the most energetically favorable hybridiza-
tion between the mRNA and miRNAs sequences. Here we evaluate the interaction between aseQTL flanking
sequences and bovine mature miRNAs sequences available in the MiRBase database81. Only miRNA-target
interactions showing an MFE of less than − 18.0 were maintained for analysis. We compared these results with
the miRNA expression data obtained in 185 animals of our p opulation31. After that, we used MiRWalk s oftware32
to identify if the ASE genes affected by these aseQTLs were miRNA targets identified by RNAhybrid80. For this,
we selected the bovine model in the species panel on MiRWalk and searched for genes that were found in the
literature as targets for these miRNAs. This list of genes was used for further comparisons with the ASE genes
affected by aseQTLs within miRNA binding sites.
Received: 31 January 2020; Accepted: 17 March 2021
References
1. Yan, H., Yuan, W., Velculescu, V. E., Vogelstein, B. & Kinzler, K. W. Allelic variation in human gene expression. Science 297, 1143
(2002).
2. Ferguson-Smith, A. C. Imprinting and the epigenetic asymmetry between parental genomes. Science 293, 1086–1089 (2001).
3. Stachowiak, M., Szczerbal, I. & Flisikowski, K. Investigation of allele-specific expression of genes involved in adipogenesis and
lipid metabolism suggests complex regulatory mechanisms of PPARGC1A expression in porcine fat tissues. 1–9 (2018).
4. Cheng, H. H. et al. Fine mapping of QTL and genomic prediction using allele-specific expression SNPs demonstrates that the
complex trait of genetic resistance to Marek’s disease is predominantly determined by transcriptional regulation. BMC Genom.
16, 1–9 (2015).
5. De Souza, M. M., Zerlotini, A., Rocha, M. I. P. & Bruscadin, J. J. Allele-specific expression is widespread in Bos indicus muscle
and affects meat quality candidate genes. Sci. Rep. 10, 10204 (2020).
6. Huffman, K. L. et al. Effect of beef tenderness on consumer satisfaction with steaks consumed in the home and restaurant. J. Anim.
Sci. 74, 91 (1996).
7. Miller, M. F., Carr, M. A., Ramsey, C. B., Crockett, K. L. & Hoover, L. C. Consumer thresholds for establishing the value of beef
tenderness. J. Anim. Sci. 79, 3062 (2001).
8. Guillocheau, G. M. et al. Survey of allele specific expression in bovine muscle. Sci. Rep. 9, 4297 (2019).
9. Jiang, Z. et al. DNA methylomes of bovine gametes and in vivo produced preimplantation embryos. Biol. Reprod. https://doi.org/
10.1093/biolre/ioy138 (2018).
10. Triantaphyllopoulos, K. A., Ikonomopoulos, I. & Bannister, A. J. Epigenetics and inheritance of phenotype variation in livestock.
Epigenet. Chromatin 9, 1–18 (2016).
11. Tian, X. Genomic imprinting in farm animals. Annu. Rev. Anim. Biosci. 2, 23–40 (2014).
12. Pfeifer, K. Mechanisms of genomic imprinting. Am. J. Hum. Genet. 67, 777–787 (2000).
13. Tan, Z. et al. Allele-specific targeting of microRNAs to HLA-G and risk of asthma. Am. J. Hum. Genet. 81, 829–834 (2007).
14. Tchatchou, S. et al. A variant affecting a putative miRNA target site in estrogen receptor (ESR) 1 is associated with breast cancer
risk in premenopausal women. Carcinogenesis 30, 59–64 (2009).
15. Jonas, S. & Izaurralde, E. Towards a molecular understanding of microRNA-mediated gene silencing. Nat. Rev. Genet. 16, 421–433
(2015).
16. Knowles, D. A. et al. Allele-specific expression reveals interactions between genetic variation and environment. Nat. Methods 14,
699–702 (2017).
17. Battle, A. et al. Characterizing the genetic basis of transcriptome diversity through RNA-sequencing of 922 individuals. Genome
Res. 24, 14–24 (2014).
18. Higgins, M. G. et al. GWAS and eQTL analysis identifies a SNP associated with both residual feed intake and GFRA2 expression
in beef cattle. Sci. Rep. 8, 1–12 (2018).
19. Mancini, G. et al. Association between single nucleotide polymorphisms (SNPs) and milk production traits in Italian Brown cattle.
Livest. Sci. 157, 93–99 (2013).
20. Cochran, S. D., Cole, J. B., Null, D. J. & Hansen, P. J. Discovery of single nucleotide polymorphisms in candidate genes associated
with fertility and production traits in Holstein cattle. BMC Genet. 14, 49 (2013).
21. Tizioto, P. C. et al. Genome scan for meat quality traits in Nelore beef cattle. Physiol. Genom. 45, 1012–1020 (2013).
22. Santiago, G. G., Siqueira, F., Cardoso, F. F., Regitano, L. C. A. & Ventura, R. Genomewide association study for production and
meat quality traits in Canchim beef cattle 1. J Anim Sci https://doi.org/10.2527/jas2017.1570 (2018).
23. Seabury, C. M. et al. Genome-wide association study for feed efficiency and growth traits in U.S. beef cattle. BMC Genom. 18, 386
(2017).
24. Tizioto, P. C. et al. Detection of quantitative trait loci for mineral content of Nelore longissimus dorsi muscle. Genet. Sel. Evol. 47,
15 (2015).
25. Cesar, A. S. et al. Genome-wide association study for intramuscular fat deposition and composition in Nellore cattle. BMC Genet.
15, 39 (2014).
26. de Oliveira, P. S. et al. Identification of genomic regions associated with feed efficiency in Nelore cattle. BMC Genet. 15, 100 (2014).
27. Cesar, A. S. M. et al. Identification of putative regulatory regions and transcription factors associated with intramuscular fat content
traits. BMC Genom. 19, 499 (2018).
28. McLaren, W. et al. The ensembl variant effect predictor. Genome Biol. 17, 122 (2016).
29. Thomas-Chollier, M. et al. Transcription factor binding predictions using TRAP for the analysis of ChIP-seq data and regulatory
SNPs. Nat. Protoc. 6, 1860–1869 (2011).
30. de Souza, M. M. et al. A comprehensive manually-curated compendium of bovine transcription factors. Sci. Rep. 8, 13747 (2018).
31. Oliveira, G. B. et al. Integrative analysis of microRNAs and mRNAs revealed regulation of composition and metabolism in Nelore
cattle. BMC Genom. 19, 126 (2018).
32. Sticht, C., De La Torre, C., Parveen, A. & Gretz, N. miRWalk: an online resource for prediction of microRNA binding sites. PLoS
ONE 13, e0206239 (2018).
Scientific Reports | (2021) 11:7321 | https://doi.org/10.1038/s41598-021-86782-2 12
Vol:.(1234567890)www.nature.com/scientificreports/
33. Imamoto, N. Heat stress-induced nuclear transport mediated by Hikeshi confers nuclear function of Hsp70s. Curr. Opin. Cell Biol.
52, 82–87 (2018).
34. Kose, S., Furuta, M. & Imamoto, N. Hikeshi, a nuclear import carrier for Hsp70s, protects cells from heat shock-induced nuclear
damage. Cell 149, 578–589 (2012).
35. Passos, B. R. et al. Tolerância ao calor em bovinos das raças Nelore branco , Nelore vermelho e Pantaneira Heat tolerance in Nelore
branco , Nelore vermelho and Pantaneira breeds in the Pantanal region, Brazil INTRODUÇÃO A produtividade de bovinos de
corte em pastagem nas re. 854–865 (2014).
36. Ribeiro, A. R. B., Alencar, M. M., Freitas, A. R., Regitano, L. C. A. & Oliveira, M. C. S. Heat tolerance of Nelore, Senepol x Nelore
and Angus x Nelore heifers in the southeast region of. Brazil. 39, 2008–2010 (2009).
37. Carvalho, M. E. et al. Heat shock and structural proteins associated with meat tenderness in Nellore beef cattle, a Bos indicus
breed. Meat Sci. 96, 1318–1324 (2014).
38. Damon, M. et al. Associations between muscle gene expression pattern and technological and sensory meat traits highlight new
biomarkers for pork quality assessment. Meat Sci. 95, 744–754 (2013).
39. Damon, M., Wyszynska-Koko, J., Vincent, A., Hérault, F. & Lebret, B. Comparison of muscle transcriptome between pigs with
divergent meat quality phenotypes identifies genes related to muscle metabolism and structure. PLoS ONE 7, e33763 (2012).
40. Carvalho, M. E. et al. Genomic regions and genes associated with carcass quality in Nelore cattle. Genet. Mol. Res. 18, GMR18226
(2019).
41. Xu, X. et al. The molecular characterization and associations of porcine cardiomyopathy asssociated 5 (CMYA5) gene with carcass
trait and meat quality. Mol. Biol. Rep. 38, 2085–2090 (2011).
42. Kouloumenta, A., Mavroidis, M. & Capetanaki, Y. Proper perinuclear localization of the TRIM-like protein myospryn requires its
binding partner desmin. J. Biol. Chem. 282, 35211–35221 (2007).
43. Tsoupri, E. & Capetanaki, Y. Μyospryn: a multifunctional desmin-associated protein. Histochem. Cell Biol. 140, 55–63 (2013).
44. Sandri, M. Protein breakdown in muscle wasting: Role of autophagy-lysosome and ubiquitin-proteasome. Int. J. Biochem. Cell
Biol. 45, 2121–2129 (2013).
45. Sarparanta, J. et al. Interactions with M-band titin and calpain 3 link myospryn (CMYA5) to tibial and limb-girdle muscular
dystrophies. J. Biol. Chem. 285, 30304–30315 (2010).
46. Barendse, W., Harrison, B. E., Bunch, R. J. & Thomas, M. B. Variation at the Calpain 3 gene is associated with meat tenderness in
zebu and composite breeds of cattle. BMC Genet. 9, 41 (2008).
47. Josephs, E. B., Lee, Y. W., Stinchcombe, J. R. & Wright, S. I. Association mapping reveals the role of purifying selection in the
maintenance of genomic variation in gene expression. Proc. Natl. Acad. Sci. 112, 15390–15395 (2015).
48. Larson, N. B. et al. Comprehensively evaluating cis-regulatory variation in the human prostate transcriptome by using gene-level
allele-specific expression. Am. J. Hum. Genet. 96, 869–882 (2015).
49. Nelson, C. E., Hersh, B. M. & Carroll, S. B. The regulatory content of intergenic DNA shapes genome architecture. Genome Biol.
5, R25 (2004).
50. Barrett, L. W., Fletcher, S. & Wilton, S. D. Regulation of eukaryotic gene expression by the untranslated gene regions and other
non-coding elements. Cell. Mol. Life Sci. 69, 3613–3634 (2012).
51. Almlöf, J. C. et al. Powerful identification of cis-regulatory SNPs in human primary monocytes using allele-specific gene expres-
sion. PLoS ONE 7, e52260 (2012).
52. McDaniell, R. et al. Heritable individual-specific and allele-specific chromatin signatures in humans. Science 328, 235–239 (2010).
53. Sartori, R. et al. BMP signaling controls muscle mass. Nat. Genet. 45, 1309–1318 (2013).
54. Burri, L., Thoresen, G. H. & Berge, R. K. The role of PPAR α activation in liver and muscle. PPAR Res. 2010, 1–11 (2010).
55. Smith, S. B. et al. Cellular regulation of bovine intramuscular adipose tissue development and composition12. J. Anim. Sci. 87,
E72–E82 (2009).
56. Eckers, A. et al. The aryl hydrocarbon receptor promotes aging phenotypes across species. Sci. Rep. 6, 19618 (2016).
57. Bonetto, A. et al. STAT3 Activation in skeletal muscle links muscle wasting and the acute phase response in cancer cachexia. PLoS
ONE 6, e22538 (2011).
58. Kami, K. & Senba, E. In vivo activation of STAT3 signaling in satellite cells and myofibers in regenerating rat skeletal muscles. J.
Histochem. Cytochem. 50, 1579–1589 (2002).
59. Zhang, C. et al. Interleukin-6/signal transducer and activator of transcription 3 (STAT3) pathway is essential for macrophage
infiltration and myoblast proliferation during muscle regeneration. J. Biol. Chem. 288, 1489–1499 (2013).
60. Stephanou, A. & Latchman, D. S. Transcriptional regulation of the heat shock protein genes by STAT family transcription factors.
Gene Expr. 7, 311–319 (1999).
61. Serre, D. et al. Differential allelic expression in the human genome: a robust approach to identify genetic and epigenetic cis-acting
mechanisms regulating gene expression. PLoS Genet. 4, e1000006 (2008).
62. Wang, Q. et al. Recent acquisition of imprinting at the rodent Sfmbt2 locus correlates with insertion of a large block of miRNAs.
BMC Genom. 12, 204 (2011).
63. Seitz, H. A large imprinted microRNA gene cluster at the mouse Dlk1-Gtl2 domain. Genome Res. 14, 1741–1748 (2004).
64. Kim, J. & Bartel, D. P. Allelic imbalance sequencing reveals that single-nucleotide polymorphisms frequently alter microRNA-
directed repression. Nat. Biotechnol. 27, 472–477 (2009).
65. Ramachandran, S. et al. Cis-acting single nucleotide polymorphisms alter MicroRNA-mediated regulation of human brain-
expressed transcripts. Hum. Mol. Genet. https://doi.org/10.1093/hmg/ddw317 (2016).
66. De Oliveira, P. S. N. et al. An integrative transcriptome analysis indicates regulatory mRNA-miRNA networks for residual feed
intake in Nelore cattle. Sci. Rep. 8, 17072 (2018).
67. Ichihara, S. et al. A role for the aryl hydrocarbon receptor in regulation of ischemia-induced angiogenesis. Arterioscler. Thromb.
Vasc. Biol. 27, 1297–1304 (2007).
68. Wood, J. et al. Effects of fatty acids on meat quality: a review. Meat Sci. 66, 21–32 (2004).
69. Cheng, W., Cheng, J.-H., Sun, D.-W. & Pu, H. Marbling analysis for evaluating meat quality: methods and techniques. Compr. Rev.
Food Sci. Food Saf. 14, 523–535 (2015).
70. Tizioto, P. C. et al. A SNP in ASAP1 gene is associated with meat quality and production traits in Nelore breed. Meat Sci. 92,
855–857 (2012).
71. Mudadu, M. A. et al. Genomic structure and marker-derived gene networks for growth and meat quality traits of Brazilian Nelore
beef cattle. BMC Genom. 17, 235 (2016).
72. Purcell, S. et al. PLINK: a tool set for whole-genome association and population-based linkage analyses. Am. J. Hum. Genet. 81,
559–575 (2007).
73. Miar, Y., Sargolzaei, M. & Schenkel, F. S. A comparison of different algorithms for phasing haplotypes using Holstein cattle geno-
types and pedigree data. J. Dairy Sci. 100, 2837–2849 (2017).
74. Younesy, H. et al. Genome analysis ALEA: a toolbox for allele-specific epigenomics analysis. Bioinformatics 30, 1172–1174 (2014).
75. Danecek, P. et al. The variant call format and VCFtools. Bioinformatics 27, 2156–2158 (2011).
76. Barrett, J. C., Fry, B., Maller, J. & Daly, M. J. Haploview: analysis and visualization of LD and haplotype maps. Bioinformatics 21,
263–265 (2005).
Scientific Reports | (2021) 11:7321 | https://doi.org/10.1038/s41598-021-86782-2 13
Vol.:(0123456789)You can also read