Control of mitochondrial structure and function by the Yorkie/YAP oncogenic pathway
←
→
Page content transcription
If your browser does not render page correctly, please read the page content below
Downloaded from genesdev.cshlp.org on November 3, 2015 - Published by Cold Spring Harbor Laboratory Press

Control of mitochondrial structure
and function by the Yorkie/YAP
oncogenic pathway
Raghavendra Nagaraj,1,2,6 Shubha Gururaja-Rao,1,2,6 Kevin T. Jones,1,2 Matthew Slattery,3
Nicolas Negre,4 Daniel Braas,5 Heather Christofk,5 Kevin P. White,4 Richard Mann,3
and Utpal Banerjee1,2,7
1
 Department of Molecular, Cell, and Developmental Biology, 2Department of Biological Chemistry, Molecular Biology Institute,
Broad Stem Cell Research Center, University of California at Los Angeles, Los Angeles, California 90095, USA; 3Department of
Biochemistry and Molecular Biophysics, Columbia University, New York, New York 10032, USA; 4Institute for Genomics and
Systems Biology, University of Chicago, Chicago, Illinois 60637, USA; 5Institute for Molecular Medicine, David Geffen School of
Medicine, University of California at Los Angeles, Los Angeles, California 90095, USA

Mitochondrial structure and function are highly dynamic, but the potential roles for cell signaling pathways in
influencing these properties are not fully understood. Reduced mitochondrial function has been shown to cause
cell cycle arrest, and a direct role of signaling pathways in controlling mitochondrial function during development
and disease is an active area of investigation. Here, we show that the conserved Yorkie/YAP signaling pathway
implicated in the control of organ size also functions in the regulation of mitochondria in Drosophila as well as
human cells. In Drosophila, activation of Yorkie causes direct transcriptional up-regulation of genes that regulate
mitochondrial fusion, such as opa1-like (opa1) and mitochondria assembly regulatory factor (Marf ), and results in
fused mitochondria with dramatic reduction in reactive oxygen species (ROS) levels. When mitochondrial fusion
is genetically attenuated, the Yorkie-induced cell proliferation and tissue overgrowth are significantly suppressed.
The function of Yorkie is conserved across evolution, as activation of YAP2 in human cell lines causes increased
mitochondrial fusion. Thus, mitochondrial fusion is an essential and direct target of the Yorkie/YAP pathway in
the regulation of organ size control during development and could play a similar role in the genesis of cancer.
[Keywords: Hippo pathway; ROS; Yap; Yorkie; marf; mitochondrial fusion; opa]
Supplemental material is available for this article.
Received November 10, 2011; revised version accepted July 27, 2012.

The Mst/Lats/YAP pathway functions in the process of                        Drosophila, the Hippo pathway promotes proliferation by
contact inhibition to regulate organ size in mammals, and                   positively regulating cyclin E and the microRNA bantam
loss in this pathway’s function is implicated in multiple                   (Harvey et al. 2003; Wu et al. 2003; Huang et al. 2005;
cancer types (Zhao et al. 2008). In Drosophila, where this                  Nolo et al. 2006; Thompson and Cohen 2006). This
pathway, commonly referred to as the ‘‘Hippo pathway,’’                     pathway also inhibits apoptosis by controlling DIAP1
was first identified and best understood, the correspond-                   expression (Harvey et al. 2003; Huang et al. 2005; Dong
ing proteins are Hippo/Warts/Yorkie (Hariharan 2006;                        et al. 2007; Oh and Irvine 2008). Overexpression of Yki in
Pan 2007; Zhang et al. 2009). Loss-of-function mutations                    the late larval and pupal eye disc cells causes an increased
in any upstream component of the Hippo pathway will                         adult eye size (Huang et al. 2005; Dong et al. 2007). This
cause Yorkie (Yki) to remain unphosphorylated and                           phenotype is further enhanced by coexpression of Sd
actively signal within the nucleus, causing an overgrowth                   (Goulev et al. 2008; Wu et al. 2008; Zhang et al. 2008).
phenotype (Dong et al. 2007; Oh and Irvine 2008). YAP/                      The extreme effect of this pathway on growth and its
Yki functions as a transcriptional coactivator, interacting                 prominent role in cancer progression prompted us to
with a DNA-binding partner such as mammalian TEAD                           investigate a possible link to cellular metabolism.
proteins/Drosophila Scalloped (Sd) (Huang et al. 2005;
Goulev et al. 2008; Wu et al. 2008; Zhang et al. 2008). In
                                                                            Results
6
 These authors contributed equally to this work.
7
 Corresponding author                                                       Mitochondrial phenotype upon Yki pathway activation
E-mail banerjee@mbi.ucla.edu
Article published online ahead of print. Article and publication date are   GFP targeted to the mitochondrial matrix (mitoGFP) is
online at http://www.genesdev.org/cgi/doi/10.1101/gad.183061.111.           trapped and stabilized and allows visualization of the

       GENES & DEVELOPMENT 26:2027–2037 Ó 2012 by Cold Spring Harbor Laboratory Press ISSN 0890-9369/12; www.genesdev.org           2027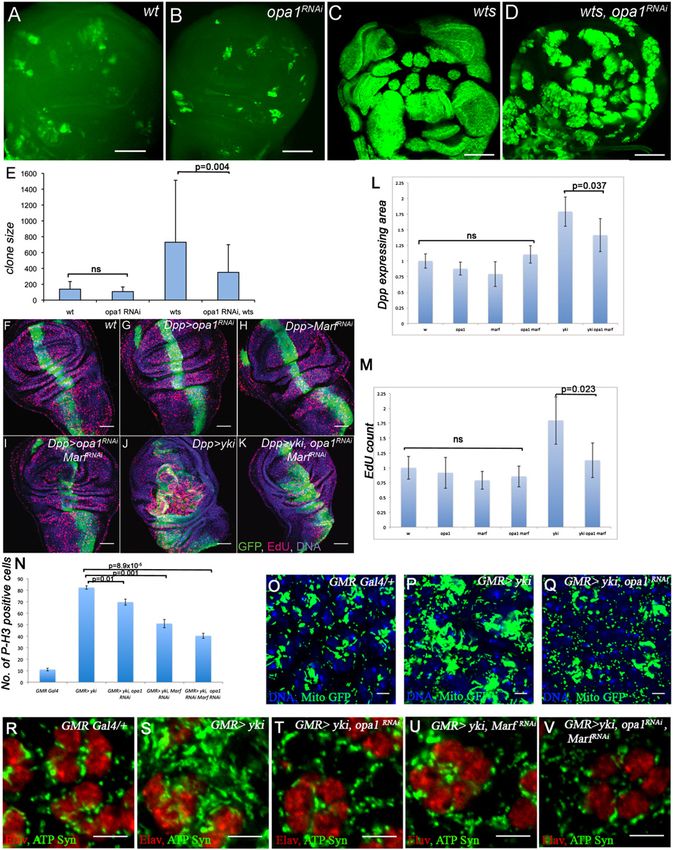
Downloaded from genesdev.cshlp.org on November 3, 2015 - Published by Cold Spring Harbor Laboratory Press
Nagaraj et al.
mitochondrial network (Clark et al. 2006; Goyal et al. 2006). We also generated clones that overexpress Yki. In all
2007; Deng et al. 2008). This reagent was used to assess cases, mutant cells show an autonomous increase in the
the effects of activating the yki/sd pathway on mitochon- expression of mitochondrial markers (Fig. 2A–J). Further-
dria. In the wild-type pupal eye disc, the majority of more, down-regulation of wts and ft using RNAi in the
mitochondria are oval in shape and scattered around the dorsal compartment of the wing disc also causes an
cell with no visible signs of an interconnected network increase in mitochondrial staining within the mutant
(Fig. 1A; Supplemental Fig. S1). Upon overexpression of tissue (Fig. 2K,L; Supplemental Fig. S4). Reduction of Yki
Sd, the DNA-binding partner of Yki, only a modest in- by RNAi suppresses the increased mitochondrial staining
crease in mitochondrial size seems evident (Fig. 1B). How- observed in wts mutant cells, showing that yki functions
ever, overexpression of Yki (GMR-Gal4, UAS-yki) causes downstream from wts to regulate mitochondrial expan-
a dramatic increase in mitochondria (Fig. 1C; Supplemental sion (Supplemental Fig. S5). The microRNA bantam is a
Fig. S1). This phenotype is further enhanced upon a simul- transcriptional target of Yki, and its overexpression causes
taneous coexpression of Yki and Sd (Fig. 1D). Inactivation increased cell proliferation and organ size overgrowth
of sd in a GMR-Gal4, UAS-yki mutant background by (Nolo et al. 2006; Thompson and Cohen 2006). However,
either a single-copy loss of sd or a coexpression of sdRNAi overexpression of bantam does not result in a mitochon-
suppresses the Yki-induced mitochondrial expansion drial phenotype (Supplemental Fig. S6A–D). Furthermore,
(Fig. 1E,F). In contrast, knocking down Homothorax (hth), although bantam overexpression enhances tissue over-
another known transcriptional partner of Yorkie (Peng et al. growth due to Yki, no enhancement of the Yki mitochon-
2009), in a Yorkie overexpression background did not drial phenotype by bantam overexpression is apparent in
modify the mitochondrial phenotypes of Yorkie (data not the eye disc (Supplemental Fig. S6E–H).
shown), suggesting that the control of mitochondria by this
pathway involves the Yki/Sd and not the Yki/Hth complex.
The Yki mitochondrial phenotype is independent
The phenotype of an enhanced mitochondrial network
of cell proliferation
upon Yki/Sd expression is not specific to the eye, as it is
also seen in the wing and leg imaginal discs (Fig. 1G–L; The use of GMR-Gal4 as a driver to express Yki causes
additional controls in Supplemental Figs. S2, S3). cells to proliferate, making it difficult to assess whether
To determine whether Yki functions autonomously in the observed change in mitochondrial morphology is a
mitochondrial control, we generated mutant clones of the primary result of the activation of this pathway or a sec-
canonical Hippo pathway components: hippo, which ondary consequence of increased proliferation. We there-
encodes an upstream Ste-20 class kinase (Harvey et al. fore used spa-Gal4 as a driver to activate Yki in post-mitotic
2003; Wu et al. 2003); warts (wts), which encodes the ter- cone cells (green in Fig. 2M,O) in the eye. The spa-Gal4,
minal kinase that phosphorylates Yki (Justice et al. 1995; UAS-yki combination does not cause overgrowth, and yet
Harvey et al. 2003); and fat (ft), which encodes a receptor for a robust increase in mitochondrial staining is readily ap-
the Hippo pathway (Bennett and Harvey 2006; Silva et al. parent (Fig. 2M–P), suggesting that even in the absence of
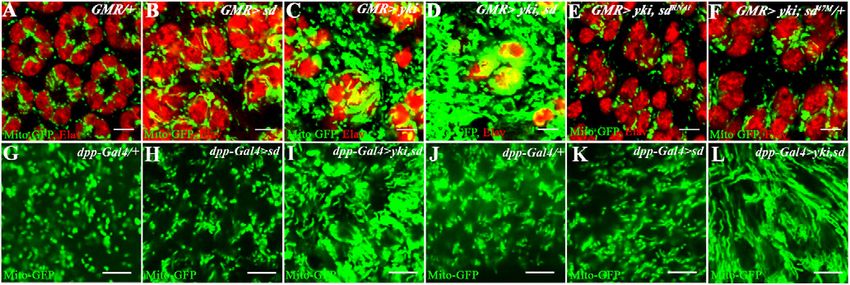
Figure 1. Yki activation causes mitochondrial phenotypes. (A–F) Mid-pupal eye discs. mitoGFP (green) marks the mitochondrial
matrix. ELAV (red) marks photoreceptor nuclei. Bar, 5 mm. (A) Control (GMR-Gal4, UAS-mitoGFP) mitochondria (green) are seen as
individual dots. (B) Overexpression of Scalloped (GMR-Gal4, UAS-mitoGFP UAS-sd) causes a modest increase in mitochondria. (C)
Overexpression of Yki (GMR-Gal4, UAS-mitoGFP UAS-yki) results in extensive mitochondrial (green) expansion. (D) Combined
overexpression of Yki and Sd (GMR-Gal4, UAS-mitoGFP UAS-yki, UAS-sd) causes further enhancement of the mitochondrial
expansion phenotype. (E) In the background of Yki activation, a reduction in sd function (GMR-Gal4, UAS-mitoGFP, UAS-yki, UAS-
sdRNAi) suppresses the Yki-mediated expansion of mitochondria. (F) Single-copy loss of sd in a Yki-activated background (GMR-Gal4,
UAS-mitoGFP, UAS-yki, sd47M/+) causes a suppression in mitochondrial expansion compared with that seen upon Yki overexpression
(cf. C). (G–L) Third instar wing (G–I) and leg (J–L) imaginal discs. mitoGFP (green) marks the mitochondria. (G) Control (dpp-Gal4, UAS-
mitoGFP) wing disc; the mitochondria (green) are seen as individual dots. (H) Overexpression of Sd (dpp-Gal4, UAS-mitoGFP, UAS-sd)
does not significantly affect mitochondria. (I) A combined overexpression of Yki and Sd in the wing disc (dpp-Gal4, UAS-mitoGFP,
UAS-yki, UAS-sd) results in extensive increase in mitochondria. (J) Control (dpp-Gal4, UAS-mitoGFP) leg disc. (K) Overexpression of
Sd (dpp-Gal4, UAS-mitoGFP, UAS-sd) is similar to control. (L) Combined overexpression of Yki and Sd (dpp-Gal4, UAS-mitoGFP, UAS-
yki, UAS-sd) causes extensive expansion of mitochondria.
2028 GENES & DEVELOPMENT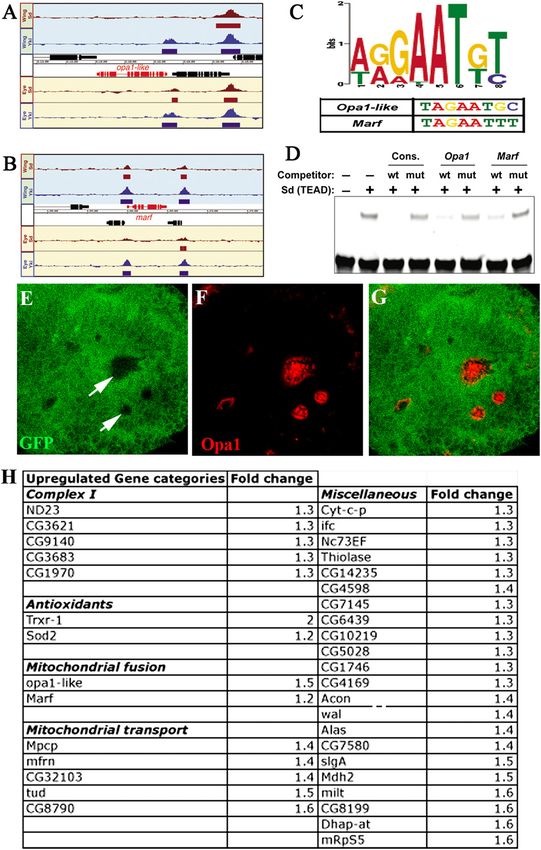
Downloaded from genesdev.cshlp.org on November 3, 2015 - Published by Cold Spring Harbor Laboratory Press

                                                                                                          Yorkie/YAP and mitochondrial function

Figure 2. Mitochondrial phenotypes in Hippo pathway mutant backgrounds. (A–L) Third instar wing discs. (A,B) Isolated mutant clones
of wts (green) generated using MARCM and stained for ATP-syn (red in B) show increased staining in the mutant (green) cells. (C–H) Third
instar wing discs containing mutant clones (nongreen) for warts (wts) (C,D), fat (ft) (E,F), and hippo (hpo) (G,H) show increased
mitochondrial staining using ATP synthase-a antibody (red) in the mutant cells (nongreen) compared with adjacent wild-type tissue
(green). (B,D,F,H) Red channel alone is shown for clarity. Bar, 50 mm. (I,J) Clones of cells in a wing disc expressing Yki (green) using the Ay-
Gal4 system (see the Materials and Methods). Increased expression of the mitochondrial marker ATP synthase-a (red) is seen in Yki
overexpressing cells (green) as compared with the adjacent wild-type cells (nongreen). (J) Red channel alone is shown for clarity. Bar, 5 mm.
(K,L) Knockdown of wts function in the dorsal compartment of the wing disc (K; green, ap-Gal4 UAS-GFP, UAS-wtsRNAi) causes an
increase in mitochondrial marker ATP synthase-a staining (L; red). The white dotted line marks the dorsal–ventral boundary. Bar, 50 mm.
(M–P) Pupal eye discs. (M,N) Control, pupal eye disc from spa-Gal4, UAS-GFP background. The cone cells are marked with GFP (M; green)
and stained for mitochondrial marker ATP-syn (N; red). (O,P) Overexpression of Yki in cone cells (spa-Gal4, UAS-GFP, UAS-yki) (O;
green) causes a significant increase in mitochondrial marker ATP-syn staining (P; red). Bar, 5 mm. (Q–T) Clones of cells in the fat body
expressing Yki (shown in Q and S in green) using the Ay-Gal4 system (see the Materials and Methods). Increased staining with ATP
synthase-a antibody (R; red) and increased uptake of the mitochondrial membrane potential-sensitive dye MitoTracker Red (S; red) can be
seen in Yki overexpressing cells (S; green) at the perinuclear regions when compared with adjacent wild-type cells (S; nongreen). Bars, 5 mm.

cell proliferation, this pathway is capable of promoting                   enously express YAP2, as assessed by protein blots (data
mitochondrial biogenesis. This phenotype is specific to                    not shown), and thus might have functional cofactors.
Yki, since overexpression of other growth-promoting                        Mitochondria were analyzed with MitoTracker Red stain-
factors such as activation of the EGFR or the Wingless                     ing and an antibody against the mitochondrial protein
pathway using the spa-Gal4 driver does not cause                           ATP synthase-a. In control cells from the breast cancer
a similar increase in mitochondrial biogenesis (Supple-                    cell lines MDAMB453 and SUM159PT, we observed a
mental Fig. S7). Furthermore, loss of two other tumor                      small number of mitochondria predominantly localized
suppressor genes (scribble and avalanche), each of which                   in perinuclear regions (Fig. 3A–D). Overexpression of
shows an extensive growth phenotype similar to that                        YAP2 causes an increase in MitoTracker and mitochon-
seen upon Yki activation, also does not result in increased                drial ATP synthase-a staining (Fig. 3A9–D9). We also ex-
mitochondrial staining (Supplemental Fig. S8).                             amined three additional cell lines derived from different
  Finally, we asked whether the increased mitochondrial                    human cancers that express varying levels of endogenous
staining seen with mitoGFP and ATP-synthase is also                        YAP2. In two cases, we observed a correlation between
reflected as higher mitochondrial membrane potential by                    increased YAP2 expression and enhanced mitochondrial
staining with the dye MitoTracker (Baltzer et al. 2009). As                mass, but this correlation was not seen in the third cell
evidenced by clones generated in the post-mitotic cells of                 line (data not shown). Thus, YAP expression may be
the fat body, Yki activation causes an increase in mito-                   correlative but is not the sole determinant of mitochon-
chondrial markers and in the intensity of MitoTracker                      drial morphology in human cancer cells. However, the
staining (Fig. 2Q–T).                                                      phenotypes that we observed upon YAP2 overexpression
                                                                           are remarkably similar to those seen in Drosophila and
The mitochondrial phenotype of Yki is conserved                            suggest that regulation of mitochondria by the Yki path-
in humans                                                                  way is conserved in humans.
To determine whether the role of the Hippo pathway in
                                                                           Ultrastructural and metabolic analysis
the control of mitochondrial network formation is con-
                                                                           of mitochondria upon Yki activation
served across species, we stably overexpressed a Flag-
tagged form of YAP2 (one of the human homologs of                          To characterize the mitochondrial phenotype seen above
Yorkie) in several human cancer cell lines, which endog-                   at the ultrastructural level, we carried out an electron

                                                                                                           GENES & DEVELOPMENT             2029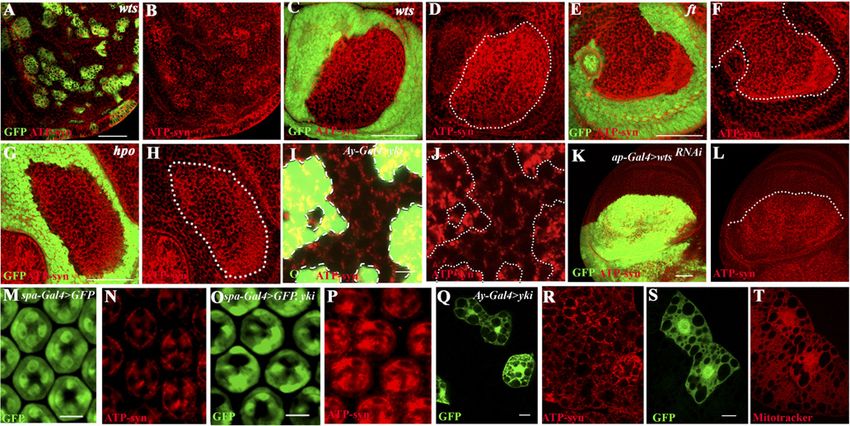
Downloaded from genesdev.cshlp.org on November 3, 2015 - Published by Cold Spring Harbor Laboratory Press

Nagaraj et al.

Figure 3. Mitochondrial phenotypes of Yki/YAP2-activated human and Drosophila cells. (A–D) Controls. Mitochondrial staining in
MDAMB453 and SUM159PT cells expressing empty vector using MitoTracker Red (A,C) and ATP-synthase-a antibody (B,D). Stable
expression of Flag-tagged YAP2 in MDAMB453 and SUM159PT cells causes an increase in mitochondria monitored using MitoTracker
Red (A9,C9) and ATP-synthase-a antibody (B9,D9). Bar, 5 mm. (E–J) Ultrastructural analysis of mitochondria (highlighted in red) upon
Yki/YAP2 overexpression. (E,F) Electron micrographs of mitochondria from human cells. YAP2 overexpressing MDAMT453 cells
(F) have elongated and enlarged mitochondria compared with their vector-transformed controls (E). Bar, 1 mm. (G,H) Electron micrographs
of mitochondria from Drosophila salivary glands. The mitochondria are elongated upon combined overexpression of Yki and Sd (H)
compared with wild-type control (G). Bar, 1 mm. (I,J) Electron micrographs of mitochondria from Drosophila pupal eye discs. High-
magnification view of mitochondria from control (I) and Yki-activated (J) pupal eye tissue. Bar, 0.5 mm. (K–M) Reduction of ROS in YAP2
overexpressing cells. Flow cytometric analysis of ROS-labeled control cells (red trace) and YAP2-overexpressing cells (blue trace) in
HS578T (K), SUM159PT (L), and MDAMB231 (M) cell lines. The ROS levels show a dramatic decrease of ;100-fold in all three cell lines
upon YAP2 expression.

microscopic (EM) analysis in cultured human cells over-               phenotypes are due to mitochondrial fusion. The elon-
expressing YAP2 (Fig. 3E,F) as well as in Drosophila                  gated mitochondria continue to maintain normally struc-
tissues in which Yki is activated (Fig. 3G–J). Consistent             tured cristae. Quantitation of the fusion phenotype
with the light microscopic immunohistochemical re-                    revealed an average twofold increase in the length of
sults, at the EM level, the mitochondria are elongated                mitochondria upon Yki/Sd activation (P = 0.0009) (Supple-
and enlarged (Fig. 3E–J), suggesting that the observed                mental Fig S9A). Mitochondrial numbers are moderately

2030       GENES & DEVELOPMENT
Downloaded from genesdev.cshlp.org on November 3, 2015 - Published by Cold Spring Harbor Laboratory Press

                                                                                             Yorkie/YAP and mitochondrial function

increased (52%) (Supplemental Fig. S9B), which could be           clones, opa1 expression is up-regulated (Fig. 4E–G). Based
due to either increased biogenesis or decreased turnover,         on the genetic, microarray, and ChIP data and reporter
which is reported to result from increased fusion (Twig           assays, we conclude that the Yki/Sd complex controls
et al. 2008).                                                     expression of the mitochondrial fusion genes opa1 and
   To assess the functional effects of Yki/YAP2 on mito-          Marf that lead to the formation of the extensively fused
chondria, we measured several metabolic outputs in                mitochondria observed upon Yki activation.
human and Drosophila cells. ATP levels are not signifi-              The ChIP–chip array showed that 261 mitochondrial
cantly altered upon Yki/YAP2 overexpression in either             genes were bound by both Sd and Yki, of which 36 are also
Drosophila or human cells, and consumption of glucose,            up-regulated at least 1.2-fold in the microarray analysis
oxygen, and glutamine and production of lactate and               (Fig. 4H). We confirmed the up-regulation of opa1 and
glutamate were also unaffected in several human cell              Marf by quantitative PCR (Supplemental Fig. S13). The 36
lines (Supplemental Fig. S10). However, levels of reactive        genes include various mitochondrial enzymes and trans-
oxygen species (ROS) show a dramatic, two orders of               porters, including complex I genes, antioxidants, and the
magnitude decrease when YAP2 is overexpressed in the              two mitochondrial fusion genes opa1 and Marf, which
three independent cell lines tested (Fig. 3K–M). These            implies that the Yki/Sd complex directly binds to the
results demonstrate that one consequence of the mam-              upstream regions of these genes to regulate their tran-
malian YAP2 pathway activation is a reduction of ROS,             scription. In addition to these fusion proteins, the two
which is likely to increase cellular resistance to oxida-         major classes of up-regulated proteins whose relevance
tive stress.                                                      seems evident from our genetic analysis include the anti-
                                                                  oxidant proteins and members of complex I of the electron
                                                                  transport chain. Both of these protein classes have dem-
Mitochondrial targets of Yki activation
                                                                  onstrated functions related to ROS levels (Finkel 2003;
To probe mechanistic determinants of Yki function in              Owusu-Ansah et al. 2008), and their up-regulation by the
mitochondrial expansion, we conducted a genome-wide               Yki/YAP pathway helps explain the dramatic reduction in
microarray experiment and specifically compared expres-           ROS levels upon YAP2 activation (Fig. 3K–M) and suggests
sion patterns of mitochondria-related transcripts from            a conserved function for Yki/YAP2 signaling in the mod-
control (GMR-Gal4) and Yorkie overexpressing (GMR-                ulation of oxidative stress. The best-characterized target of
Gal4; UAS-yki) pupal eye discs. Genes that have pre-              the Yki/Sd pathway, Diap1, is also up-regulated at levels
viously been implicated in basal mitochondrial biogene-           similar to the mitochondrial genes (1.2-fold) in our tran-
sis, such as Spargel (PGC-1a) and DELG (NRF2) (Baltzer            scriptome analysis.
et al. 2009), are not altered upon overexpression of Yki.
However, a number of other genes associated with mito-
                                                                  opa1 and Marf suppress Yki growth and mitochondrial
chondrial function are up-regulated by Yki, including the
                                                                  phenotypes
two mitochondrial fusion genes opa1-like (opa1) and mi-
tochondria assembly regulatory factor (Marf) (Supplemen-          The role of opa1 and Marf as downstream targets of Yki
tal Fig S11A; Chan 2006). These could potentially provide         was further dissected through genetic analysis. MARCM
a link between Yki activation and enhanced mitochondrial          clones of wts in wing discs in which opa1 function is
fusion evident from the ultrastructural analysis.                 attenuated using UAS- opa1RNAi causes significant sup-
   To determine whether Yki and Sd are directly bound             pression in the growth of mutant clones (Fig. 5A–E). Using
to DNA corresponding to mitochondrial genes, we                   the dpp-Gal4 driver, we found that combined inactivation
used chromatin immunoprecipitation (ChIP) and whole-              of opa1 and Marf significantly suppresses the increased
genome tiling arrays (ChIP–chip) to identify regions              tissue growth observed upon overexpression of Yki (Fig.
bound by these factors in eye–antennal and wing imaginal          5F–L). This effect is Yki-specific, as overgrowth due to loss
discs. We found that Yki and Sd together bind to enhancer         of other tumor suppressor backgrounds is not suppressed
elements corresponding to several genes related to mito-          by opa1 (Supplemental Fig. S14).
chondrial fusion, including opa1 and Marf (Fig. 4A,B;                The attenuation in Yki-mediated tissue growth can be
Supplemental S11B). These genes include a consensus               traced to a reduction in cell proliferation. In the larval
motif (AGGAATGT) in their upstream sequence that                  wing disc, knockdown of opa1 and Marf using RNAi
matches with the published Sd-binding consensus site.             suppresses the enhanced EdU incorporation observed
Importantly, most of the Sd-bound regions around these            upon Yki overexpression (Fig. 5F–K,M). Likewise, over-
genes also contain strong matches to the Sd consensus             expression of Yki causes increased proliferation of cells in
site that we defined using in vitro selection followed by         the third instar eye imaginal disc, and this phenotype is
next-generation sequencing (Fig. 4C). Gel shift assays            significantly suppressed upon reduction of either opa1 or
established that the Sd consensus sites within opa1 and           Marf as measured by phospho-Histone H3 staining (Fig.
Marf are indeed bound by Sd (Fig. 4D). Luciferase reporter        5N; additional controls in Supplemental Figs. S15, S16) in
assays in S2 cells using the Sd-binding domain containing         the eye. We analyzed Caspase-3 staining in multiple
enhancer regions of opa1 and Marf showed a 15-fold and            RNAi backgrounds for both opa1 and Marf used in this
fivefold induction of opa1 and Marf, respectively, upon           study and did not detect an increase in cleaved Caspase-3
activation with Yki/Sd (Supplemental Fig. S12). In situ           (Supplemental Fig. S17). The suppression of Yki-mediated
hybridization studies further show that in wts mutant             proliferation by the loss of fusion genes correlates with the

                                                                                              GENES & DEVELOPMENT            2031
Downloaded from genesdev.cshlp.org on November 3, 2015 - Published by Cold Spring Harbor Laboratory Press

Figure 4. Direct regulation of mitochondria-related genes by the Yorkie/Scalloped complex. (A,B) Sd and Yki are bound near the loci of
mitochondrial morphogenesis genes. Sd and Yki ChIP–chip binding profiles at opa1 (A) and Marf (B). Regions designated as bound by
a given factor (5% FDR [false discovery rate]) are indicated by solid rectangles below a given peak. (C) Sd consensus motif identified by
in vitro selection and next-generation sequencing in mitochondrial fusion genes. (D) Gel mobility shift assay. Purified TEA domain of
Sd protein used for mobility shift assay shows binding to wild-type but not mutated consensus Sd-binding sites as indicated. opa1- and
Marf-specific DNA sequences containing wild-type but not mutated putative Sd-binding sites can compete and block Sd binding to the
probe. (E–G) Fluorescence in situ hybridization to visualize opa1 transcripts in wts mutant clones. wts mutant clones (nongreen,
marked by arrows in E) were generated in third instar eye discs using the Flp/FRT system. In situ hybridization for GFP (green) marks
the wild-type tissue. (F) opa1 expression (red) is up-regulated in the mutant (nongreen) tissue. The merged image is shown in G. Note
that the level of expression of opa1 in the wild-type eye disc is below the levels of detection. However, in these experiments, we were
able to detect wild-type opa1 expression in the wing disc pouch, ring glands, and eye disc upon overexpression of opa1 using the
combination GMR-Gal4, UAS-opa1. (H) List of categories of mitochondrial genes that are up-regulated with their fold change (judged
by microarray analysis) that are also bound by both Yki and Sd (based on ChIP–chip data set generated for Yki and Sd).
Downloaded from genesdev.cshlp.org on November 3, 2015 - Published by Cold Spring Harbor Laboratory Press

Figure 5. Mutations in mitochondrial fusion genes suppress phenotypes caused by Yki activation. (A–E) MARCM clones of wts in the
wing imaginal discs. (A) Mock clones (green) generated with wild-type FRT82B chromosome. (B) Mock clones (green) expressing
opa1RNAi. (C) wts clones (green) showing an extensive overgrowth phenotype. (D) wts clones (green) expressing opa1RNAi suppress the
overgrowth phenotype seen upon loss of wts function (cf. C and D). (E) A quantitative analysis of clone sizes in different genotypes as
indicated at the bottom of the graph. The clone sizes in the wild type and opa1RNAi are similar with no significant differences, while
expression of opa1RNAi in wts clones results in a significant (P = 0.004) suppression of clone size. Bars, 50 mm. (F–K) Representative
images of third instar wing discs labeled with EdU to mark S-phase cells. dpp-Gal4, UAS-GFP is used to drive appropriate RNAi/ UAS-
Yki overexpression. Genotypes are indicated (RNAi constructs used are opa1KK105706 and Marf KK105261). Bars, 50 mm. (L) Quantification
of the area of the dpp-Gal4, UAS-GFP-expressing tissue. RNAi targeting opa1, Marf, or both does not significantly alter growth in the
wing disc, as demonstrated by measuring the area of dpp-expressing tissue normalized to control (dpp-Gal4 UAS-GFP crossed to w1118,
opa1 RNAi, Marf RNAi, or opa1 RNAi/Marf RNAi). Overexpression of yorkie (dpp-Gal4 UAS-GFP, UAS-yki) causes a robust increase in
tissue size (P = 1.2 3 10 4), and this is significantly reduced by combined inactivation of opa1 and Marf (P = 0.037). Average sizes
relative to control and error bars indicating standard deviation are shown. (M) Quantification of EdU-positive cells within the dpp-Gal4,
UAS-GFP-expressing tissue. Genotypes are as indicated. Compared with control (dpp-Gal4, UAS-GFP), the reduction of opa1 or Marf
function by RNAi, separately or in combination, does not significantly reduce the number of EdU-labeled cells. Overexpression of
yorkie (dpp-Gal4, UAS-GFP, UAS-yki) causes a dramatic increase in EdU-positive cells (P = 0.008), and coexpression of opa1 and Marf
RNAis with yorkie (dpp-Gal4, UAS-GFP, UAS-yki, UAS-opa1 RNAi, UAS-Marf RNAi) leads to a significant suppression of EdU-
positive cell number (P = 0.023). Average number of EdU spots in the dpp(+) area is plotted relative to control, and error bars indicate
standard deviation. (N) Quantitative analysis of phospho-Histone H3 (P-H3)-positive cells upon Yki activation and in combination with
a reduction of opa1 and Marf function. Genotypes are as indicated. Overexpression of Yki in the third instar eye discs causes
a significant increase in the number of P-H3-positive cells (P = 2.7 3 10 6). Knockdown of opa1 alone, Marf alone, or both in a Yki
overexpression background significantly suppresses the number of P-H3-positive cells (P = 0.01, 0.001, and 8.9 3 10 5, respectively).
(O–Q) Suppression of Yki-induced mitochondrial phenotype upon loss of opa1 function. Mitochondrial morphology is monitored using
mitoGFP (green). Cell nuclei are marked with Topro (blue). Bar, 5 mm. (R–V) Suppression of Yki-induced mitochondrial phenotype upon
loss of opa1 and Marf function. Mitochondrial morphology is monitored using ATP synthase-a staining (green). Photoreceptor nuclei
are marked with ELAV (red). Bar, 5 mm. Combined reduction of opa1 and Marf in a Yki-activated background causes strong suppression
of mitochondrial expansion.
Downloaded from genesdev.cshlp.org on November 3, 2015 - Published by Cold Spring Harbor Laboratory Press

Nagaraj et al.

suppression in Yki-induced mitochondrial fusion observed             Our study reveals that increased mitochondrial fusion and
in the pupal eye disc (Fig. 5O–V; further controls in                expansion by Yki is evolutionarily conserved and that this
Supplemental Fig. S18). The relevance of opa1-mediated               function of the Hippo pathway is relevant for both normal
mitochondrial fusion to the Yki-mediated mitochondrial               and patho–physiological situations.
phenotype is underscored by the dosage-dependent inter-
action between a single-copy loss of opa1 and Yki over-
                                                                     Materials and methods
expression (Supplemental Fig. S19).
                                                                     Fly stocks
Discussion                                                           The following stocks were used: sd47M; UAS-sd; UAS-mitoGFP;
                                                                     spa-Gal4; GMR-Gal4; ap-Gal4; Ay-Gal4; dpp-Gal4 (Bloomington
Previous studies have shown that the Hippo pathway
                                                                     Stock Center); UAS-yki (D. Pan); Sd-GFP (A. Spradling); UAS-
functions in flies as well as vertebrates to control organ
                                                                     opa1RNAi (KK105706 and HMS000349); UAS-Marf RNAi (GD40478,
size (Dong et al. 2007). Furthermore, mutations in com-              KK105261, and JF01650) (multiple opa1 and Marf RNAis were
ponents of this pathway have been implicated in multiple             tested for adult eye size suppression and in other assays de-
forms of cancer (Edgar 2006). This pathway has been                  scribed in Fig. 5); UAS-wtsRNAi (KK106174 and HMS00026);
shown to directly promote cell proliferation and repress             UAS-ft RNAi (KK108863 and HMS00932); UAS-ykiRNAi (KK104523);
apoptosis. Here, we show that the mitochondrion is an                UAS-sdRNAi (KK108264); UAS-avlRNAi (KK107264); UAS-scribRNAi
important additional target of the Hippo pathway. An                 (KK106065); FRT hpo 42-47 (I. Hariharan); UAS-ban (S. Cohen); UAS-
increase in Yki activity causes an increase in mitochon-             opa1 (J. Chung); and MARCM stocks (J. Martinez).
drial fusion due to direct transcriptional activation of
major mitochondrial fusion genes. Increased mitochon-                Immunohistochemistry
drial fusion has been linked to regulation of the G1–S
                                                                     We used the following antibodies: anti-mouse ATP synthase-a
checkpoint and Cyclin E activity (Mandel et al. 2005;
                                                                     (1:100; Mitosciences), anti-rabbit Mn-SODII (1:100; Stressgen),
Mitra et al. 2009), and cells harboring fused mitochondria           MitoTracker Red (Molecular Probes), anti-rat anti-phospho-his-
are resistant to stress-induced apoptosis (Tondera et al.            tone 3 (1:300), and anti-Yki (1:500; D. Pan). BrdU labeling was
2009; van der Bliek 2009). Interestingly, these are precisely        done by incubating freshly dissected eye discs in 75 mg/mL BrdU
the phenotypes seen upon activation of the Hpo/Yki                   for 30 min, followed by fixation, washing in PBS, and mounting.
pathway. It seems likely that this pathway independently             Antibody staining was performed as described previously (Rogge
activates the cell cycle, represses apoptosis (Harvey et al.         et al. 1991).
2003; Hay and Guo 2003; Wu et al. 2003), and promotes
mitochondrial and metabolic changes described in this                Ay-Gal4 flip-out clones
study that together cause tumor growth. However, since
                                                                     Flip-out clones were generated in the eye and in the fat body.
mitochondrial fusion plays a role in S-phase entry and
                                                                     hs-flp was used to flip out the stuffer cassette from act-
stress resistance (Mitra et al. 2009), it is attractive to
                                                                     FRTyFRT-Gal4 to generate act Gal4, which expresses Gal4 in
speculate that the mitochondrial effects could indirectly            all cells of the eye imaginal disc and fat body (Ito et al. 1997).
affect Yki’s up-regulation of Cyclin E and DIAP. This is             The respective crosses were maintained at 18°C. At mid-
supported by our observation that in hpo, opa1 double-               second instar, a 10-min heat shock at 37°C was applied (Ito
mutant clones, Cyclin E expression is suppressed when                et al. 1997). Tissues were dissected in the third instar, fixed,
compared with that seen in hpo mutant clones (Supple-                and stained with appropriate antibodies or MitoTracker Red
mental Fig. S21). The increase in fusion gene levels upon            (Invitrogen).
Yki activation is modest. This may be important in pro-
ducing the observed phenotype of fused but functional                EdU labeling and tissue growth measurements
mitochondria. Gross overexpression of fusion genes leads
to abnormal and globular mitochondria (Supplemental                  Appropriate genetic crosses were allowed to lay eggs on grape
                                                                     juice/agar plates, and larvae hatched over a 3-h period were
Fig. S20). Moreover, the modification of mitochondrial
                                                                     collected and transferred to normal food plates maintained at
structure by Yki is accompanied by an up-regulation of               29°C. Upon reaching the third instar, larvae were dissected in
antioxidant enzymes and subunits of complex I of the                 room temperature Schneider’s Drosophila medium, imaginal
electron transport chain and a dramatic reduction in                 wing discs were incubated for 30 min in 10 mM EdU, and then
intracellular ROS. It has recently been demonstrated that            discs were fixed and stained according to standard protocol
other oncogenes (Ras, Raf, and Myc) also reduce ROS, but             (Click-iT EdU Alexa Fluor 555 imaging kit, Life Technologies).
in our system, these oncogenes do not up-regulate mito-              For visualization of GFP, tissue was stained with a monoclonal
chondrial fusion as seen with activation of the Yki                  GFP antibody (Millipore) at a dilution of 1:100. To quantify the
pathway, suggesting that different oncogenic pathways                number of EdU-positive cells, images were analyzed with ImageJ
could alter ROS by distinct mechanisms (DeNicola et al.              software. Briefly, automatic thresholds were applied to green and
                                                                     red channels, and the green channel was inverted and subtracted
2011). The importance of mitochondrial fusion in Yki
                                                                     from the red channel to select only EdU spots within the dpp-
signaling is further highlighted by our observation that             expressing area. Watershed segmentation was then performed to
a reduction in mitochondrial fusion suppresses Yki-medi-             separate overlapping EdU spots, and particles 10 mm2 in size or
ated growth phenotypes. This observed link between the               greater were counted. To measure tissue sizes, ImageJ was used
Hpo/Yki pathway and mitochondrial fusion is of signifi-              to automatically threshold the fluorescent channel, and area was
cance to both normal development and cancer biology.                 measured.

2034       GENES & DEVELOPMENT
Downloaded from genesdev.cshlp.org on November 3, 2015 - Published by Cold Spring Harbor Laboratory Press
Yorkie/YAP and mitochondrial function
MARCM clones GenomePlex WGA4 whole-genome amplification kit (Sigma).
The samples were then labeled according to Affymetrix pro-
MARCM clones for wts (third chromosome) and its suppression
tocols and hybridized on Affymetrix GeneChip Drosophila
by opa1RNAi (second chromosome) were done using egg collec-
Tiling 2.0R arrays. ChIP–chip for each factor and tissue was
tion in vials for 3 h. Larvae from the crosses were heat-shocked
performed in biological triplicate. All raw and processed ChIP–
for 45 min at 37°C at 48 h after egg laying. Mid-third instar larvae
chip data are publicly available through the Gene Expression
were collected for dissection, and the discs were fixed and
Omnibus (GEO; accession no. GSE26678).
mounted in VectaShield for confocal microscopy. The area under
Tiling array data were processed with MAT (model-based
the clone was measured using ImageJ software, and statistical
analysis of tiling arrays), and peaks were called at a 5% FDR
data analysis was performed in Excel.
(false discovery rate) using MAT. For a given tissue, peaks were
called as shared if the Yki and Sd peaks overlapped by 1 bp or
In situ hybridization more. Target genes were called based on the transcription start
site nearest a given peak. At the 5% FDR threshold, 6713 Sd+Yki
wts mutant clones were generated using the Flp/FRT system by peaks were called in the wing disc and 5170 Sd+Yki peaks were
a 30-min heat-shock pulse at 37°C during the mid-second instar. called in the eye–antenna disc. Altogether, 5203 genes are called
Plasmids for the generation of GFP and Opa1 probes were as Sd+Yki targets in either the wing or eye–antenna. Sd+Yki
obtained from Kathy Ngo and the Drosophila Genomics Re- target gene GO (gene ontology) overlap probabilities were
source Center (DGRC), respectively. The opa1 probe was labeled calculated from the hypergeometric distribution based on the
with digoxygenin-tagged alkaline phosphatase, and the GFP number of FlyBase GO annotated Sd+Yki target genes in the
probe was labeled with fluorescein-tagged HA. For tissue in situ given category and the total number of Drosophila melanogaster
hybridization experiments, third instar larvae from the cross genes in the annotation category.
were washed in DEPC-treated water, dissected in Schneider’s In vitro selection (or SELEX) was performed with GST-Sd
medium, fixed in 3.7% paraformaldehyde in 100 mM PIPES immobilized on glutathione agarose. The input SELEX library
buffer for 45 min on ice, and subsequently dehydrated in ethanol sequence was 59-GTTCAGAGTTCTACAGTCCGACGATCTG
for 12 h. The following day, discs were subjected to Proteinase K GNNNNNNNNNNNNNNNNCCAGCTGTCGTATGCCGT
treatment (10 mg/mL) for 4 min, followed by washes in glycine CTTCTGCTTG-39, where ‘‘N’’ represents A/G/T/C. Eluted DNA
buffer (20 mg/mL). The discs were then incubated in prehybrid- was PCR-amplified and prepared for Illumina sequencing by three
ization buffer (2 h) and then incubated in hybridization buffer for rounds of PCR with the following primers: 59-CAAGCAGAA
2 h at 55°C. The probe was prepared in 200 mL of hybridization GACGGCATACGA-39 and 59-AATGATACGGCGACCACCGA
buffer and heated at 90°C, followed by cooling for 5 min on ice for CAGGTTCAGAGTTCTACAGTCCGA-39. Illumina sequencing
denaturation. The discs were incubated with probe in hybridiza- (once for 36 cycles) was performed according to the manufac-
tion buffer for 18–22 h at 55°C. The following day, the discs were turer’s protocol for small RNA sequencing, as this is optimized
washed multiple times in PBT at 55°C. The signal was amplified for sequencing short DNA fragments. The Sd-binding motif
with fluorescent-labeled antibodies (fl-HA for GFP and Dig-AP was constructed from the top 300 16-mers selected after two
for opa1), and the discs were then mounted in VectaShield. rounds of in vitro selection with full-length GST-tagged Sd. A
Images were captured using confocal microscopy. position weight matrix (PWM) was generated using MEME
(Bailey and Elkan 1994) and the following parameters: mini-
Imaging mum motif width of 6, maximum motif width of 8, one per
sequence.
Samples were imaged using a Bio-Rad Radiance 2000 confocal Gel shift assays were performed essentially as described pre-
with LaserSharp 2000 acquisition software and a Zeiss LSM700 viously (Estella et al. 2008), except the oligonucleotide probe was
confocal with Zen 2009 acquisition software. Fluorescent in- dual-labeled with 59 IRDye 700 (Integrated DNA Technologies),
tensity quantifications were analyzed by ImageJ software. and gels were scanned using the Odyssey infrared imaging
system (Li-Cor Biosciences). The TEA domain of Sd, described
previously (Halder and Carroll 2001), was expressed in BL21 and
Microarray experiments
purified using Ni-NTA agarose (Qiagen). The following probes
Eye discs (100 for each genotype) were dissected from GMR-Gal4 were used: Consensus, 59-TTCGATACACTTGTGGAATGTGT
(control) and GMR-Gal4, UAS-yki genotypes ;40 h after pupar- TTGATTTGTTAGCCCCG-39; Consensus-mutated, 59-TTCGA
iation. Total RNA was isolated from the dissected discs (Trizol TACACTTGcatAATaaGTTTGATTTGTTAGCCCCG-39; Opa1,
method and Qiagen RNAeasy kit) and used to generate micro- 59-GTTTCTTTTTAATATTTAGAATGCACTTTGCAAAGAA
array probes that were hybridized to Drosophila genome 2 arrays GTA-39; Opa1-mutated, 59-GTTTCTTTTTAATATTcatAATaaA
(Affymetrix). The GeneChip Operating system (Affymetrix) and CTTTGCAAAGAAGTA-39; Marf, 59-AATCATTGTCAGGGTA
dCHIP program (Harvard University) were used to generate pair- AATTCTATTTTTAAATTAGACAAA-39; and Marf-mutated, 59-
wise comparisons between the transcription profiles of control AATCATTGTCAGGGTttATTatgTTTTTAAATTAGACAAA-39.
and Yorkie overexpressing discs.
MitoTracker and antibody staining of human cells
ChIP, ChIP–chip, and motif analysis
Flag-tagged YAP2 was cloned into the pLJM1 lentiviral vector,
Wandering third instar larvae were dissected and fixed. Imaginal and breast cancer cells stably expressing Flag-YAP2 were se-
discs were collected in PBS on ice. Discs were fixed with 1.8% lected with puromycin. SUM159PT and MDAMB453 cells as
formaldehyde, and cross-linked chromatin was sonicated to an well as culture conditions are described previously (Neve et al.
average size of 500 base pairs (bp). Chromatin preparation and 2006). For MitoTracker staining, human cells plated on cover-
ChIPs were performed as described (Estella et al. 2008). Both slips were treated with 250 nm of MitoTracker Red (Invitrogen)
rabbit anti-Yki (D. Pan) and rabbit anti-GFP (Abcam, ab290) were in culture medium for 30 min at 37°C. The cells were fixed,
used at final dilutions of 1:300. Immunoprecipitated DNA and washed, and mounted in VectaShield (Vector Laboratories) for
input DNA were amplified for array hybridization using the taking images.
GENES & DEVELOPMENT 2035Downloaded from genesdev.cshlp.org on November 3, 2015 - Published by Cold Spring Harbor Laboratory Press
Nagaraj et al.
For antibody staining, cells were fixed in 4% paraformalde- for transfection efficiency. Transfections were performed with
hyde for 5 min, washed for 2 min (PBS + 0.05% Triton X-100), Effectene transfection reagent (Qiagen), and reporter assays were
permeabilized with PBS + 0.1% TX-100 PBS for 5 min, and carried out in triplicate 48 h post-transfection. Reporter assays
washed twice for 5 min each. The cells were blocked with 10% were performed using the Dual-Glo Luciferase assay system
normal goat serum for 30 min, followed by two washes for 5 min (Promega).
each. Cells were then incubated with primary antibody for 1 h at
room temperature, followed by two 5-min washes and incuba- Acknowledgments
tion with the secondary antibody for 1 h at room temperature.
Finally, the cells were washed three times for 5 min each and We thank K. Ngo, D. Pan, I. Hariharan, A. Spradling, J. Chung, S.
mounted on glass slides with VectaShield (Vector Laboratories). Cohen, and the stock centers of Bloomington, the National
TO-PRO-3 (Invitrogen) was applied in the second wash. Institute of Genetics (Tokyo), and the Vienna Drosophila RNAi
Center (Vienna) for providing Drosophila stocks and reagents.
We thank H. Richardson, H. McNeill, and T. Orr-Weaver for
ATP measurements
Cyclin E antibody. We gratefully acknowledge Xiaoyue Wang’s
Drosophila imaginal discs from 50 larvae expressing Yorkie with help in the luciferase reporter assays. We thank and acknowledge
a T80-Gal4 driver were dissected and collected in lysis buffer, Derek Cheung’s contribution in analyzing data. We thank W.
and ATP was extracted according to the manufacturer’s instruc- Freije for help with microarray analysis, and Genaro Villa for
tions using an ATP Bioluminescence assay kit HS II (Roche). ATP help with creating YAP2 constructs. We acknowledge the help
was measured by using a luminometer, and the values were from the microarray core facility in the Department of Pathology
normalized with protein amounts measured from the same lysed at the University of California at Los Angeles. We also thank
extracts using a Pierce BCA protein assay kit (Thermo Scien- Sirus Kohan and the Brain Research Institute EM facility for
tific). ATP measurements from human cells were carried out assistance with electron microscopy. K.T.J. is supported by a
using the same procedure. post-doctoral fellowship (#PF-10-130-01-DDC) from the American
Cancer Society. This work is supported by National Institutes of
Health Grant RO1EY008152 to U.B.
Metabolite measurements
Cells (106) of empty vector or YAP2 transfected cells were grown
References
in DMEM supplemented with 10% FBS and 1% penicillin/
streptomycin, and the medium was replaced 24 h prior to Afzelius BA, Maunsbach AB. 2004. Biological ultrastructure
analysis. Cell numbers were counted using a Beckman Coulter research; the first 50 years. Tissue Cell 36: 83–94.
Z1 particle counter, and glucose, lactate, glutamine, and gluta- Bailey TL, Elkan C. 1994. Fitting a mixture model by expecta-
mate concentrations were simultaneously analyzed using tion maximization to discover motifs in biopolymers. Proc
a NOVA Basic 4 Bioanalyzer. Metabolite consumption/produc- Int Conf Intell Syst Mol Biol 2: 28–36.
tion was expressed as moles per 106 cells per hour. Baltzer C, Tiefenbock SK, Marti M, Frei C. 2009. Nutrition
controls mitochondrial biogenesis in the Drosophila adipose
tissue through Delg and cyclin D/Cdk4. PLoS ONE 4: e6935.
Electron microscopy
doi: 10.1371/journal.pone.0006935.
Drosophila tissues were dissected in PBS and fixed in 2% Bennett FC, Harvey KF. 2006. Fat cadherin modulates organ size
glutaraldehyde and 2.5% formaldehyde in PBS, and human cells in Drosophila via the Salvador/Warts/Hippo signaling path-
were fixed in 2% glutaraldehyde in PBS. Embedding, thin way. Curr Biol 16: 2101–2110.
sectioning, and staining were carried out according to standard Chan DC. 2006. Mitochondrial fusion and fission in mammals.
protocol (Afzelius and Maunsbach 2004). The sections were Annu Rev Cell Dev Biol 22: 79–99.
stained with uranyl acetate and lead citrate and examined on Clark IE, Dodson MW, Jiang C, Cao JH, Huh JR, Seol JH, Yoo SJ,
a JEOL 100CX electron microscope at 80 kV. Hay BA, Guo M. 2006. Drosophila pink1 is required for
mitochondrial function and interacts genetically with parkin.
Nature 441: 1162–1166.
ROS measurements
Deng H, Dodson MW, Huang H, Guo M. 2008. The Parkinson’s
The ROS dye (CM-H2DCFDA, Invitrogen) was dissolved in disease genes pink1 and parkin promote mitochondrial
DMSO and added to serum-containing medium to a final con- fission and/or inhibit fusion in Drosophila. Proc Natl Acad
centration of 5 mM. Cells were incubated with the dye-contain- Sci 105: 14503–14508.
ing medium for 20 min at 37°C. Cells were rinsed twice with DeNicola GM, Karreth FA, Humpton TJ, Gopinathan A, Wei C,
PBS, trypsinized, and recovered in full medium followed by a Frese K, Mangal D, Yu KH, Yeo CJ, Calhoun ES, et al. 2011.
5-min spin down at 200g. Cells were resuspended in 400 mL of PBS Oncogene-induced Nrf2 transcription promotes ROS de-
and used for flow cytometric analysis using the FITC channel. toxification and tumorigenesis. Nature 475: 106–109.
Dong J, Feldmann G, Huang J, Wu S, Zhang N, Comerford SA,
Gayyed MF, Anders RA, Maitra A, Pan D. 2007. Elucidation
Reporter assays
of a universal size-control mechanism in Drosophila and
Putative enhancers upstream of opa1-like (chromosome 2R, mammals. Cell 130: 1120–1133.
10123270–10123692) and Marf (chromosome X, 6259520– Edgar BA. 2006. From cell structure to transcription: Hippo
6260412) were inserted between the MluI and XhoI sites of the forges a new path. Cell 124: 267–273.
pGL2 vector to generate luciferase reporter constructs. The Estella C, McKay DJ, Mann RS. 2008. Molecular integration of
expanded and 3xSd reporter constructs, also pGL-based, and wingless, decapentaplegic, and autoregulatory inputs into
pIE7-Flag-Sd and pAc-HA-Yki expression constructs were de- Distalless during Drosophila leg development. Dev Cell 14:
scribed previously (Nicolay et al. 2011). S2 cells were transfected 86–96.
with an individual reporter plasmid, Sd and/or Yki expression Finkel T. 2003. Oxidant signals and oxidative stress. Curr Opin
plasmids, and a Renilla luciferase plasmid (pAC-Rluc) to control Cell Biol 15: 247–254.
2036 GENES & DEVELOPMENTDownloaded from genesdev.cshlp.org on November 3, 2015 - Published by Cold Spring Harbor Laboratory Press
Yorkie/YAP and mitochondrial function
Goulev Y, Fauny JD, Gonzalez-Marti B, Flagiello D, Silber J, Silva E, Tsatskis Y, Gardano L, Tapon N, McNeill H. 2006. The
Zider A. 2008. SCALLOPED interacts with YORKIE, the tumor-suppressor gene fat controls tissue growth upstream
nuclear effector of the hippo tumor-suppressor pathway in of expanded in the hippo signaling pathway. Curr Biol 16:
Drosophila. Curr Biol 18: 435–441. 2081–2089.
Goyal G, Fell B, Sarin A, Youle RJ, Sriram V. 2007. Role of Thompson BJ, Cohen SM. 2006. The Hippo pathway regulates
mitochondrial remodeling in programmed cell death in the bantam microRNA to control cell proliferation and
Drosophila melanogaster. Dev Cell 12: 807–816. apoptosis in Drosophila. Cell 126: 767–774.
Halder G, Carroll SB. 2001. Binding of the Vestigial co-factor Tondera D, Grandemange S, Jourdain A, Karbowski M,
switches the DNA-target selectivity of the Scalloped selector Mattenberger Y, Herzig S, Da Cruz S, Clerc P, Raschke I,
protein. Development 128: 3295–3305. Merkwirth C, et al. 2009. SLP-2 is required for stress-induced
Hariharan IK. 2006. Growth regulation: A beginning for the mitochondrial hyperfusion. EMBO J 28: 1589–1600.
hippo pathway. Curr Biol 16: R1037–R1039. doi: 10.1016/ Twig G, Elorza A, Molina AJ, Mohamed H, Wikstrom JD, Walzer
j.cub.2006.11.012. G, Stiles L, Haigh SE, Katz S, Las G, et al. 2008. Fission and
Harvey KF, Pfleger CM, Hariharan IK. 2003. The Drosophila Mst selective fusion govern mitochondrial segregation and elim-
ortholog, hippo, restricts growth and cell proliferation and ination by autophagy. EMBO J 27: 433–446.
promotes apoptosis. Cell 114: 457–467. van der Bliek AM. 2009. Fussy mitochondria fuse in response to
Hay BA, Guo M. 2003. Coupling cell growth, proliferation, and stress. EMBO J 28: 1533–1534.
death. Hippo weighs in. Dev Cell 5: 361–363. Wu S, Huang J, Dong J, Pan D. 2003. hippo encodes a Ste-20
Huang J, Wu S, Barrera J, Matthews K, Pan D. 2005. The Hippo family protein kinase that restricts cell proliferation and
signaling pathway coordinately regulates cell proliferation promotes apoptosis in conjunction with salvador and warts.
and apoptosis by inactivating Yorkie, the Drosophila homo- Cell 114: 445–456.
log of YAP. Cell 122: 421–434. Wu S, Liu Y, Zheng Y, Dong J, Pan D. 2008. The TEAD/TEF
Ito K, Awano W, Suzuki K, Hiromi Y, Yamamoto D. 1997. The family protein Scalloped mediates transcriptional output of
Drosophila mushroom body is a quadruple structure of the Hippo growth-regulatory pathway. Dev Cell 14: 388–398.
clonal units each of which contains a virtually identical set Zhang L, Ren F, Zhang Q, Chen Y, Wang B, Jiang J. 2008. The
of neurones and glial cells. Development 124: 761–771. TEAD/TEF family of transcription factor Scalloped mediates
Justice RW, Zilian O, Woods DF, Noll M, Bryant PJ. 1995. The Hippo signaling in organ size control. Dev Cell 14: 377–387.
Drosophila tumor suppressor gene warts encodes a homolog Zhang L, Yue T, Jiang J. 2009. Hippo signaling pathway and
of human myotonic dystrophy kinase and is required for organ size control. Fly (Austin) 3: 68–73.
the control of cell shape and proliferation. Genes Dev 9: Zhao B, Lei QY, Guan KL. 2008. The Hippo-YAP pathway: New
534–546. connections between regulation of organ size and cancer.
Mandal S, Guptan P, Owusu-Ansah E, Banerjee U. 2005. Curr Opin Cell Biol 20: 638–646.
Mitochondrial regulation of cell cycle progression during
development as revealed by the tenured mutation in Dro-
sophila. Dev Cell 9: 843–854.
Mitra K, Wunder C, Roysam B, Lin G, Lippincott-Schwartz J.
2009. A hyperfused mitochondrial state achieved at G1–S
regulates cyclin E buildup and entry into S phase. Proc Natl
Acad Sci 106: 11960–11965.
Neve RM, Chin K, Fridlyand J, Yeh J, Baehner FL, Fevr T, Clark
L, Bayani N, Coppe JP, Tong F, et al. 2006. A collection of
breast cancer cell lines for the study of functionally distinct
cancer subtypes. Cancer Cell 10: 515–527.
Nicolay BN, Bayarmagnai B, Islam AB, Lopez-Bigas N, Frolov
MV. 2011. Cooperation between dE2F1 and Yki/Sd defines
a distinct transcriptional program necessary to bypass cell
cycle exit. Genes Dev 25: 323–335.
Nolo R, Morrison CM, Tao C, Zhang X, Halder G. 2006. The
bantam microRNA is a target of the hippo tumor-suppressor
pathway. Curr Biol 16: 1895–1904.
Oh H, Irvine KD. 2008. In vivo regulation of Yorkie phosphor-
ylation and localization. Development 135: 1081–1088.
Owusu-Ansah E, Yavari A, Mandal S, Banerjee U. 2008. Distinct
mitochondrial retrograde signals control the G1–S cell cycle
checkpoint. Nat Genet 40: 356–361.
Pan D. 2007. Hippo signaling in organ size control. Genes Dev
21: 886–897.
Peng HW, Slattery M, Mann RS. 2009. Transcription factor
choice in the Hippo signaling pathway: homothorax and
yorkie regulation of the microRNA bantam in the progenitor
domain of the Drosophila eye imaginal disc. Genes Dev 23:
2307–2319.
Rogge RD, Karlovich CA, Banerjee U. 1991. Genetic dissection
of a neurodevelopmental pathway: Son of sevenless func-
tions downstream of the sevenless and EGF receptor tyrosine
kinases. Cell 64: 39–48.
GENES & DEVELOPMENT 2037Downloaded from genesdev.cshlp.org on November 3, 2015 - Published by Cold Spring Harbor Laboratory Press
Control of mitochondrial structure and function by the Yorkie/YAP
oncogenic pathway
Raghavendra Nagaraj, Shubha Gururaja-Rao, Kevin T. Jones, et al.
Genes Dev. 2012 26: 2027-2037 originally published online August 27, 2012
Access the most recent version at doi:10.1101/gad.183061.111
Supplemental http://genesdev.cshlp.org/content/suppl/2012/08/22/gad.183061.111.DC1.html
Material
References This article cites 41 articles, 9 of which can be accessed free at:
http://genesdev.cshlp.org/content/26/18/2027.full.html#ref-list-1
Email Alerting Receive free email alerts when new articles cite this article - sign up in the box at the top
Service right corner of the article or click here.
To subscribe to Genes & Development go to:
http://genesdev.cshlp.org/subscriptions
Copyright © 2012 by Cold Spring Harbor Laboratory PressYou can also read