Identification of IFN-Induced Transmembrane Protein 1 With Prognostic Value in Pancreatic Cancer Using Network Module-Based Analysis
←
→
Page content transcription
If your browser does not render page correctly, please read the page content below
ORIGINAL RESEARCH
                                                                                                                                               published: 22 March 2021
                                                                                                                                         doi: 10.3389/fonc.2021.626883

                                              Identification of IFN-Induced
                                              Transmembrane Protein 1 With
                                              Prognostic Value in Pancreatic
                                              Cancer Using Network
                                              Module-Based Analysis
                                              Lingyun Wu 1† , Xinli Zhu 1† , Danfang Yan 1 , Mengmeng Tang 2 , Chiyuan Ma 3*† and
                                              Senxiang Yan 1*†
                                              1
                                                Department of Radiation Oncology, The First Affiliated Hospital, Zhejiang University School of Medicine, Hangzhou, China,
                                              2
                                                Department of Pathology, The First Affiliated Hospital, Zhejiang University School of Medicine, Hangzhou, China,
                                              3
                                                Department of Orthopedic Surgery, The Second Affiliated Hospital, Zhejiang University School of Medicine, Hangzhou, China

                                              Despite improvements reported in diagnosis and treatments in recent decades,
                           Edited by:
                       Xiangqian Guo,
                                              pancreatic cancer is still characterized by poor prognosis and low survival rate among
                Henan University, China       solid tumors. Intensive interests have grown in exploring novel predictive biomarkers,
                      Reviewed by:            aiming to enhance the efficiency in early detection and treatment prognosis. In this
                      Jiateng Zhong,
                                              study, we identified the differentially expressed genes (DEGs) in pancreatic cancer by
    Xinxiang Medical University, China
                         Liang Chen,          analyzing five gene expression profiles and established the functional modules according
             Wuhan University, China          to the functional interaction (FI) network between the DEGs. A significant upregulation
                      Guosen Zhang,
              Henan University, China
                                              of the selected DEG, interferon (IFN)-induced transmembrane protein 1 (IFITM1), was
                   *Correspondence:
                                              evaluated in several bioinformatics online tools and verified with immunohistochemistry
                         Senxiang Yan         staining from samples of 90 patients with pancreatic cancer. Prognostic data showed
               yansenxiang@zju.edu.cn
                                              that high expression of IFITM1 associated with poor survival, and multivariate Cox
                          Chiyuan Ma
                machiyuan@zju.edu.cn          regression analysis showed IFITM1 was one of the independent prognostic factors for
     † These
                                              overall survival. Meanwhile, significant correlations of the expression of IFITM1 and the
               authors have contributed
                    equally to this work      infiltration of immune cells were found by TIMER. Furthermore, a higher level of IFITM1
                                              was assessed in pancreatic cancer cell lines compared to normal human pancreatic
                   Specialty section:         duct epithelial cells, and silencing IFITM1 in tumor cells remarkedly inhibited cancer
         This article was submitted to
                      Cancer Genetics,        tumorigenicity. Collectively, our findings suggested that IFITM1 might have promising
               a section of the journal       utility for pancreatic cancer.
                 Frontiers in Oncology
                                              Keywords: IFITM1, IFN-induced transmembrane protein 1, pancreatic cancer, functional interaction network,
       Received: 07 November 2020
                                              prognostic biomarker, tissue microarray detection
        Accepted: 08 February 2021
         Published: 22 March 2021

                             Citation:        INTRODUCTION
   Wu L, Zhu X, Yan D, Tang M, Ma C
     and Yan S (2021) Identification of
                                              Pancreatic cancer is expected to be the second leading cause of cancer-related deaths in developed
 IFN-Induced Transmembrane Protein
1 With Prognostic Value in Pancreatic
                                              countries by 2030, and is characterized as highly invasive and metastatic as well as extremely
Cancer Using Network Module-Based             resistant to chemo-radio-therapy (1). Despite some efforts made on adjuvant therapeutics recent
   Analysis. Front. Oncol. 11:626883.         years, the clinical mortality ratio remains elevated to date (2). The 5-year survival rate was reported
      doi: 10.3389/fonc.2021.626883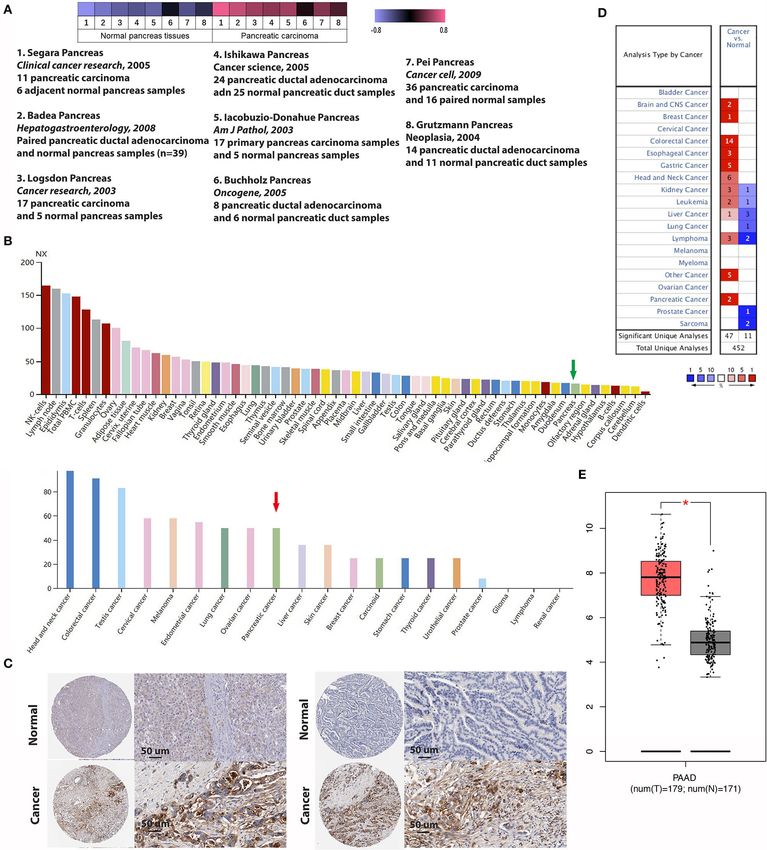
Wu et al.                                                                                                                         IFITM1 in Pancreatic Cancer

prognosis, better identification of clinical biomarkers useful                       Encyclopedia of Genes and Genomes (KEGG) was used for
for making therapeutic decisions and developing targets for                          enrichment analysis (14); (5) the MultiExperiment Viewer (MeV)
innovative drugs are urgently needed in this complex and                             application (version 4.9.0; http://mev.tm4.org/) was used to
heterogeneous mutational landscape.                                                  generate the heat map; and (6) some bioinformatics online
   The human interferon (IFN)-induced transmembrane protein                          tools such as the Oncomine database (https://www.oncomine.
1 (IFITM1), also named Leu13 or CD225, is a 17-kDa cell-                             org/), the Human Protein Atlas (https://www.proteinatlas.org/),
surface membrane protein in the IFN-stimulated genes (ISGs)                          the interactive web application Gene Expression Profiling
protein family along with IFITM2 and IFITM3. Since it was first                      Interactive Analysis (GEPIA) (https://www.gepia.cancer-pku.
discovered in neuroblastoma cells in 1984, it has been identified                    cn), and the TIMER database (https://cistrome.shinyapps.io/
participating in various biological processes (BPs) including cell                   timer/) were used. A detailed flowchart of identifying the targeted
proliferation and adhesion and being important in immunity and                       genes associated with pancreatic cancer is shown in Figure 1.
antiviral activities (4, 5). Particularly, more and more studies have
confirmed that IFITM1 is overexpressed in numerous human                             Patient Samples Preparation
cancers during the last decade, such as lung, gastric, colorectal,                   Between 2004 and 2008, a total of 90 human pancreatic cancer
and ovarian cancers (6–9). Furthermore, the positive IFITM1                          specimens were collected from the Taizhou People’s Hospital of
expression was illustrated in correlations with poorer prognosis                     China for tissue microarray (TMA) detection, 60 of which were
in diverse tumors (10, 11). Hence, it is very likely that IFITM1                     paired nonmalignant tissue. All the specimens were stored at
may also hold hitherto undiscovered value in pancreatic cancer                       the Biobank Center of National Engineering Center for Biochips
and might be further associated with prognosis of patients with                      at Alenabio and Shanghai Outdo Biotech Company, China.
pancreatic cancer.                                                                   All the patients received no preoperative anticancer treatment
   In this study, we investigated gene expression profiles                           or postoperative adjuvant chemo-radio-therapy. Histological
from Gene Expression Omnibus (GEO) repository to screen                              differentiation grade and disease stages were classified according
out common DEGs between pancreatic cancer and normal                                 to the American Joint Committee on Cancer (AJCC) TNM
pancreatic tissues and analyzed them by establishing a protein                       Classification (7th Edition). The follow-up time was recorded
functional interaction (FI) network. Functional network-based                        from the date of the surgery to the date of death or last visit to
modules were constructed, and biological pathways were                               the clinic. The use of pancreatic cancer samples and clinical data
analyzed afterward. It was confirmed that IFITM1 played a                            were reviewed and approved by the Ethical Committees of the
vital role in pancreatic cancer by analyzing the clinical and                        National Engineering Center for Biochips at Shanghai along with
pathological characteristics of 90 patients with pancreatic cancer                   the Taizhou People’s Hospital. Informed consent was written in
and their survival rate as well as by verifying through several                      accordance with the Declaration of Helsinki from all participants.
bioinformatics online tools. Our study suggested that IFITM1
may have promising clinical utility for prognostic stratification,                   Microarray Data
and combining IFITM1 expression profiles systematically with                         To investigate biological characteristics of genes differently
clinical characteristics of patients is promising to be effective for                expressed between pancreatic cancer and normal pancreatic
developing treatment.                                                                tissues, five data sets were retrieved from National Center for
                                                                                     Biotechnology Information (NCBI)-GEO (http://www.ncbi.
                                                                                     nlm.nih.gov/geo/) for the analysis, including GSE101448 (18
MATERIALS AND METHODS                                                                with pancreatic tumor and 13 non-tumor pancreatic tissue
Research Tools                                                                       samples), GSE62165 (118 pancreatic tumor samples and 13
(1) BRB-Array Tools (version 4.6.0; http://linus.nci.nih.gov/                        control samples), GSE62452 (69 pancreatic tumor and adjacent
BRB-ArrayTools.html) were used to analyze the DEGs (12); (2)                         non-tumor tissues), GSE41372 (matched pancreatic ductal
the Cytoscape software (version 3.7.1; http://www.cytoscape.org)                     adenocarcinoma samples from 15 patients), and GSE28735
was applied to construct FI network and the network-based                            (45 matching pairs of pancreatic tumor and adjacent non-
functional modules; (3) the FunRich (version 3.1.3; http://www.                      tumor tissues). NCBI-GEO is a public repository containing an
funrich.org) was used to construct biological pathways (13); (4)                     initial database of 1,325 biologically defined gene profiles and
the Omicshare online database (https://www.Omicshare.com/),                          was developed to help in the analysis and interpretation
a commercial database based on the Database for Annotation,                          of the long lists of genes produced from microarray-
Visualization, and Integrated Discovery (DAVID), was used                            based experiments. The details of the series data are listed
for the visual analysis of Gene Ontology (GO), and Kyoto                             in Table 1.

Abbreviations: IFN, interferon; IFITM1, IFN-induced transmembrane protein 1;         Initial Identification of DEGs
ISGs, IFN-stimulated genes; GEO, Gene Expression Omnibus; DEGs, differentially       As microarray batch effects appear to be the major contributors
expressed genes; FI, functional interaction; GO, Gene Ontology; KEGG, Kyoto          to the differential expression, SangerBox online tool (http://
Encyclopedia of Genes and Genomes; FDR, false discovery rate; TCGA, the Cancer       sangerbox.com/) was used to eliminate them before taken into
Genome Atlas; IHC, immunohistochemical; MCL, Markov cluster algorithm;
NSCLC, non-small cell lung cancer; TMA, tissue microarray; BP, biological
                                                                                     account (15). Later, data were imported into the BRB-Array
process; MF, molecular function; HNSCC, head and neck squamous cell                  Tools to identify the DEGs between pancreatic tumor and
carcinoma; OS, overall survival.                                                     normal pancreatic tissues. The Affymetrix platform (Santa Clara,

Frontiers in Oncology | www.frontiersin.org                                      2                                    March 2021 | Volume 11 | Article 626883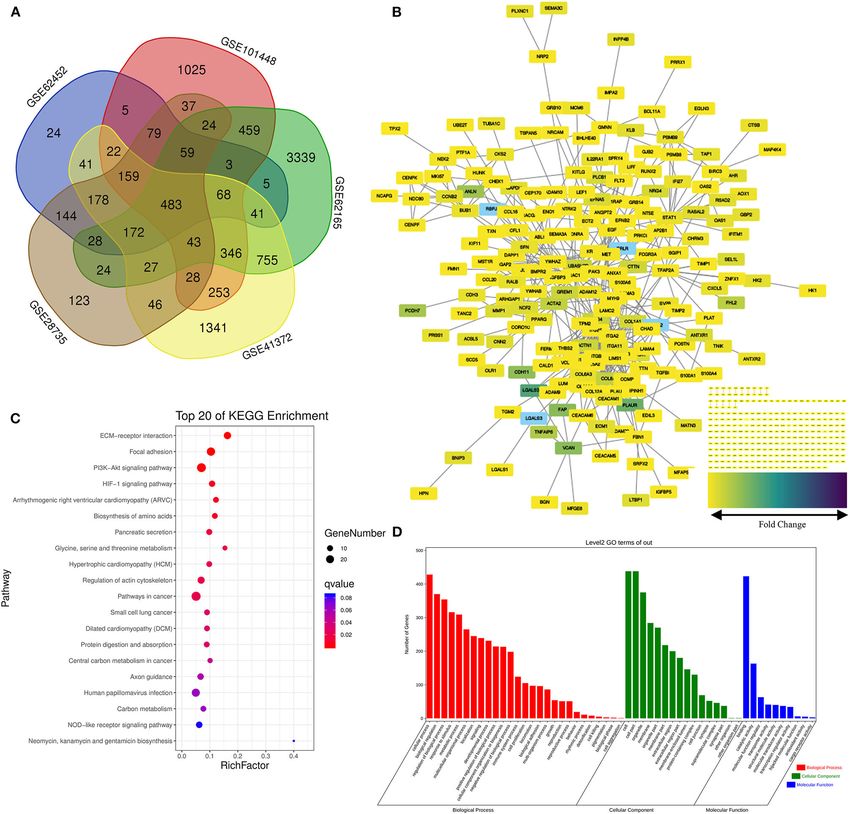
Wu et al.                                                                                                                                    IFITM1 in Pancreatic Cancer

 FIGURE 1 | A detailed flowchart of identifying and verifying the targeted differentially expressed genes (DEGs) associated with pancreatic cancer.

TABLE 1 | Detailed information of the five GEO data sets in the study.

Series               Organism             Study type                 Platform                               Country                     Samples

GSE101448            Homo                 Expression                 GPL10558 Illumina                      Germany                     18 with pancreatic tumor and 13
                     sapiens              profiling by array         HumanHT-12 V4.0 expression                                         non-tumor pancreatic tissue
                                                                     beadchip                                                           samples
GSE62165             Homo                 Expression                 GPL13667 [HG-U219]                     Belgium                     118 surgically resected PDAC
                     sapiens              profiling by array         Affymetrix Human Genome                                            and 13 control samples
                                                                     U219 Array
GSE62452             Homo                 Expression                 GPL6244 [HuGene-1_0-st]                USA                         69 pancreatic tumors and 61
                     sapiens              profiling by array         Affymetrix Human Gene 1.0                                          adjacent non-tumor tissue from
                                                                     ST Array [transcript (gene)                                        patients with pancreatic ductal
                                                                     version]                                                           adenocarcinoma
GSE41372             Homo                 Expression                 GPL6244 [HuGene-1_0-st]                Italy                       15 paired pancreatic tumor and
                     sapiens              profiling by array         Affymetrix Human Gene 1.0                                          adjacent non-tumor tissues
                                                                     ST Array [transcript (gene)
                                                                     version]
GSE28735             Homo                 Expression                 GPL6244 [HuGene-1_0-st]                USA                         45 matching pairs of pancreatic
                     sapiens              profiling by array         Affymetrix Human Gene 1.0                                          tumor and adjacent non-tumor
                                                                     ST Array [transcript (gene)                                        tissues from 45 patients with
                                                                     version]                                                           pancreatic ductal
                                                                                                                                        adenocarcinoma

California, USA) was applied for data set and gene annotation.                         web tool (http://bioinformatics.psb.ugent.be/webtools/Venn/)
The probes were filtered when some gene expression data                                was depicted graphically in the form of Venn diagram to detect
were missing. The Bioinformatics and Evolutionary Genomics                             the common DEGs among the five data sets.

Frontiers in Oncology | www.frontiersin.org                                        3                                            March 2021 | Volume 11 | Article 626883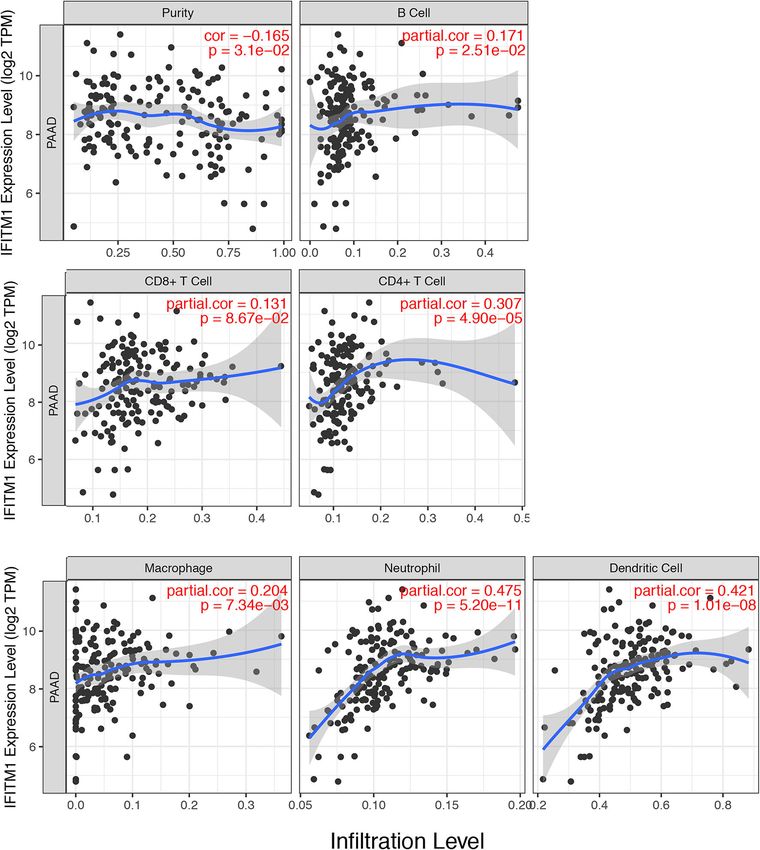
Wu et al.                                                                                                               IFITM1 in Pancreatic Cancer

Establishment of FI Network                                                pancreatic cancer, the database was searched to obtain Kaplan–
The Reactome pathway database (version 7.2.0; http://www.                  Meier survival curves and violin plots. The requested mRNA
reactome.org) was applied to analyze the pathway enrichment                expressions above or below the median classified the patients
for the sets of genes, investigate the functional relationships            into both high and low expression groups. The log-rank p-
of the genes, and visualize the outcomes with diagrams that                value and hazard ratio (HR) with 95% CIs were calculated and
can be manually generated (16). Over 60% of human proteins                 displayed on the website. A value of p < 0.05 was considered
were covered to help construct the Reactome FI network. The                statistically significant.
pairwise interaction information was uploaded into Cytoscape
software (http://www.cytoscape.org) to establish the FI network            Immunohistochemical Staining
(17). A false discovery rate (FDR)
Wu et al.                                                                                                                             IFITM1 in Pancreatic Cancer

at 450 nm (OD 450 nm), according to the instructions of                            into complementary DNA (cDNA) with the QuantiTect
the manufacturer. The results were confirmed with three                            Reverse Transcription Kit (TaKaRa, Dalian, China). The
independent experiments.                                                           sequences of the designed primers used for the real-time
                                                                                   PCR (qRT-PCR) experiments were as follows: IFITM1
Quantitative Real-Time PCR Analysis                                                forward, 5′ -AGCCAGAAGATGCACAAGGA-3′ and reverse,
To extract total RNA, cells were lysed with the TRIzol Reagent                     5′ -GATCACGGTGGACCTTGGAA-3′ ;        GAPDH      forward,
(Invitrogen Corporation, Carlsbad, CA, USA) and reversed                           5′ - GAAGGTCGGTGTGAACGGATTTG-3′ and reverse,

 FIGURE 2 | Screening of the differentially expressed genes (DEGs) in the pancreatic cancer establishment of the functional interaction (FI) network. (A) A
 flower-shaped Venn diagram showing 483 DEGs between pancreatic cancer and normal pancreatic tissues among five studies. (B) The FI network was established
 using pancreatic cancer-related 483 DEGs. Edges were based upon the FI annotation. Node colors defined fold changes in pancreatic cancer-related DEGs, ranging
 from yellow for low expression to purple for high expression, compared to non-cancerous samples. (C,D) Gene functional enrichment of the 483 DEGs. Kyoto
 Encyclopedia of Genes and Genomes (KEGG) showed the top 20 signaling pathways, and Gene Ontology (GO) analysis showed the biological processes and
 molecular functions involved in differential genes.

Frontiers in Oncology | www.frontiersin.org                                    5                                          March 2021 | Volume 11 | Article 626883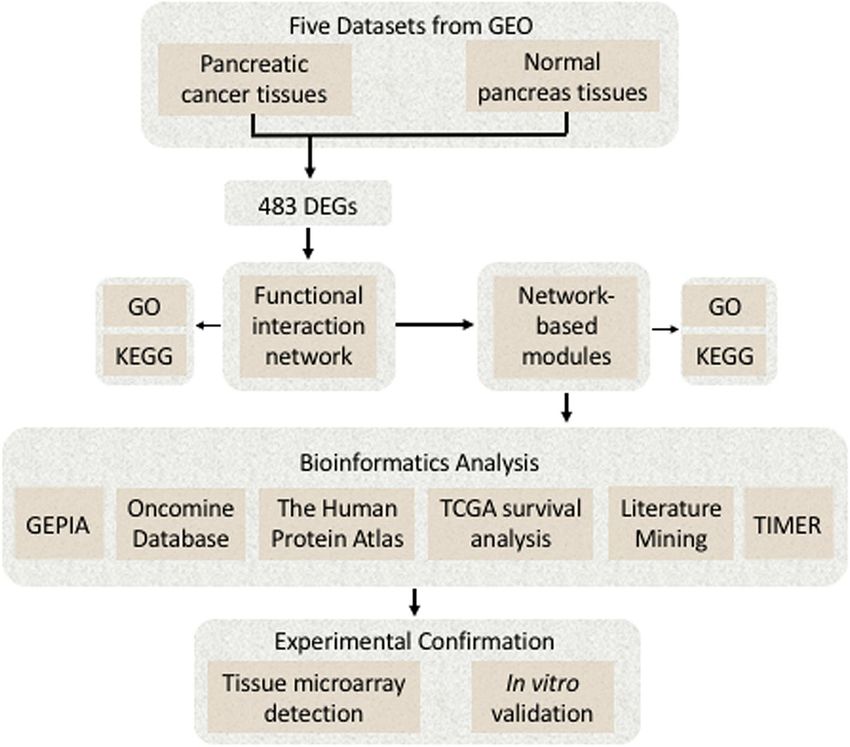
Wu et al.                                                                                                                    IFITM1 in Pancreatic Cancer

5′ -  CATGTAGACCATGTAGTTGAGGTCA-3′                       (Sangon,         were obtained (Figure 2A). Of those, 231 DEGs were identified
Shanghai, China).                                                         upregulated and 252 downregulated (Supplementary Table 1).

Western Blot Analysis                                                     Establishment of the Pancreatic
Radioimmunoprecipitation         assay     (RIPA;   Invitrogen            Cancer-Related FI Network
Corporation, Carlsbad, CA, USA) was added to protease,                    Functional interaction data derived from the Human Protein
and phosphatase inhibitors were used to gain total protein                Reference Database (http://www.hprd.org/) (24), BioGrid
samples. The proteins were separated by the sodium dodecyl                (https://thebiogrid.org/) (25), I2D (http://ophid.utoronto.
sulfate-polyacrylamide gel electrophoresis (SDS-PAGE) gel (Bio-           ca/) (26), IntACT (https://www.ebi.ac.uk/intact/) (27), MINT
Rad, Hercules, CA, USA) and transferred to the polyvinylidene             (https://www.ebi.ac.uk/intact/) (28), the Database of Interacting
fluoride (PVDF) membrane (Sigma Chemical Corporation,                     Proteins (http://dip.doe-mbi.ucla.edu) (29) as well as multiple
St. Louis, MO, USA). The membranes were blocked for 1 h                   high-throughput assays (30). We established the FI network by
and then incubated overnight with primary antibodies against              mapping the pancreatic cancer-related DEGs to the FIs data.
IFITM1 and β-actin (Abcam, Cambridge, UK), followed by                    Of 245 isolated nodes, 227 in eight clusters were identified with
the horseradish peroxidase (HRP)-linked secondary antibodies.             an effective mean degree of 2.20 (Figure 2B). The connectivity
SuperSignal West Femto Maximum Sensitivity Substrate                      of a node represents the number of its neighbors, and the
(Thermo Fisher Scientific, Waltham, MA, USA) was used to                  neighborhood connectivity represents the average connectivity
detect the probed proteins.                                               of all neighbors of the selected node. Under the criteria of
                                                                          neighborhood connectivity ≥20 and the shortest path length
Wound Healing Assay                                                       ≥3.5 for non-single modules, eight genes (EDIL3, RSAD2, AHR,
The cells were seeded in 48-well Falcon (Thermo Fisher Scientific         GBP2, IFITM1, AOX1, KIF11, and CEP170) among all the nodes
Inc. Waltham, Massachusetts, USA) Petri dishes. Once 80–90%               in the FI network were filtered out (Supplementary Table 2).
confluence was reached, a 200-µl sterile plastic pipette tip was
used to make a single wound by gently scratching in every                 Functions Analysis of the FI Network
well. Cell debris was removed using phosphate-buffered saline             To gain insights into the role of the putative targets involved
and refreshed with serum-free medium immediately. Cells that              in various BPs and molecular functions (MFs), the preliminary
extended the borders of the wound were photographed and                   GO function and KEGG pathway analysis were performed
quantified in three randomly selected regions per well.                   using the OmicShare online database. As expected, among
                                                                          the top 20 KEGG pathways, extracellular matrix (ECM)–
Colony Formation Assay                                                    receptor interaction, pancreatic secretion, and pathways
The cells in the logarithmic growth phase were seeded in 6-well           in cancer had significant relations to tumorigenesis and
Falcon Petri dishes (500 cells/well) and incubated for 7–14 days.         progression of pancreatic cancer (Figure 2C; for details
The medium was refreshed every 3 days. The colonies were fixed            see Supplementary Table 3). Among the most highly
with 70% ethanol and stained with crystal violet (0.5% w/v). The          enriched functions in the BP category, cell process, biological
cell colonies containing at least 50 cells were photographed and          regulation, and regulation of BP were found associated with the
quantified. The results were presented as mean ± SD for three
independent experiments.
                                                                          TABLE 2 | Genes analyzed in six modules in the FI network.
Statistical Analysis
Statistical analyses were performed using SPSS 23.0 (SPSS Inc.,           Module       Number of       Average      Gene set
Chicago, IL, USA) and Prism 8 (GraphPad Software, San                     number         genes        correlation
Diego, CA, USA). Correlations between protein expression and
clinicopathological features in patients with pancreatic cancer           0                19           0.9927      ADAM28, ADAM9, CHAD, COL10A1,
                                                                                                                    COL11A1, COL5A2, COL6A3,
were analyzed by the χ 2 -test. Overall survival (OS) was evaluated                                                 COL8A1, FERMT1, ITGA11, ITGA2,
using the Kaplan–Meier method and the log-rank test. A Cox                                                          ITGA3, ITGB1, ITGB4, LAMA4, LUM,
proportional hazards regression model was used to assess the                                                        PLAU, SERPINH1, THBS2
univariate and multivariate analyses. The Enter method was used           1                12           1.0000      AHR, AOX1, FCGR3A, GBP2,
to select the independent variables in the multivariate analysis.                                                   IFITM1, OAS1, OAS2, PRLR,
                                                                                                                    RASAL2, RSAD2, STAT1, TAP1
                                                                          2                 9           0.9615      ADAM12, AP2B1, CTTN, EGF,
RESULTS                                                                                                             IL22RA1, LIFR, NRG4, SGIP1,
                                                                                                                    SPRY4
Screening of DEGs                                                         3                 9           0.8365      ABLIM3, ARHGAP1, CORO1C,
Five data sets from GEO containing gene expression profiles                                                         DAPP1, ECT2, PAK3, RAC1, RALB,
of pancreatic cancer as well as normal pancreas samples were                                                        SEMA3A
downloaded for microarray analysis. The random variance                   4                 7           0.9739      ANXA1, ANXA2, PLAT, S100A10,
mode method along with the paired t-test was applied for                                                            S100A4, S100A6, TNIK
the differential expression calculation. Considering the criteria         5                 7           0.7790      CXCL5, FHL2, SEL1L, TFAP2A,
                                                                                                                    TIMP1, TIMP2, ZNFX1
of |log2 (Fold change) |>1 adjusted p < 0.05, 483 DEGs

Frontiers in Oncology | www.frontiersin.org                           6                                          March 2021 | Volume 11 | Article 626883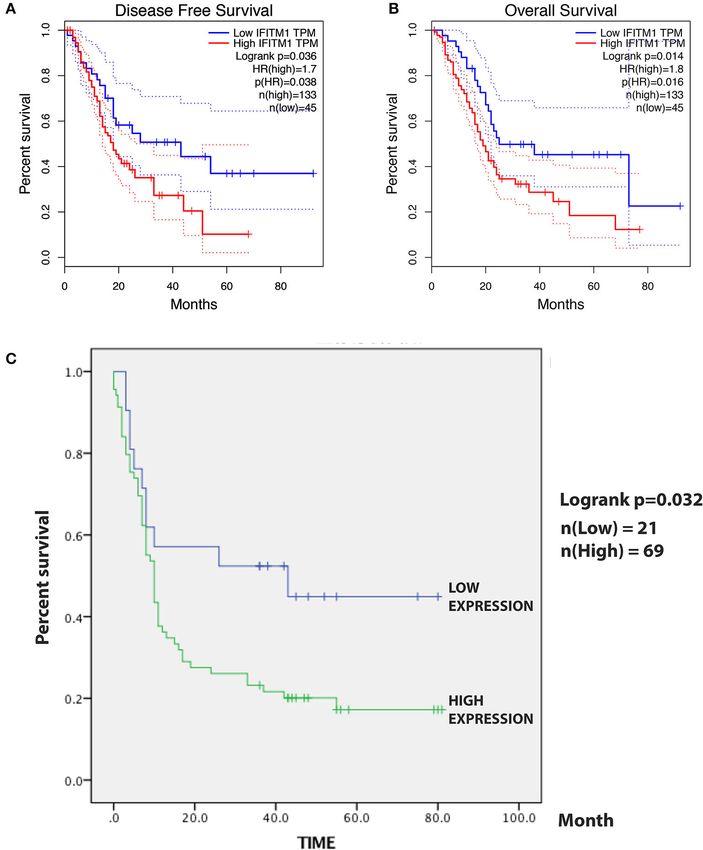
Wu et al. IFITM1 in Pancreatic Cancer
tumorigenesis and progression of pancreatic cancer. Meanwhile, value of the Pearson’s correlation coefficient of the interacting
cell, cell part, organelle, and membrane were top enriched items genes was used to weigh each correlation edge. A total
in the cellular component (CC) category. In the MF category, the of 6 modules involving 63 genes were obtained, ranging
DEGs were mainly enriched in binding activities (Figure 2D; for from 7 to 19 genes per module (Table 2, Figure 3A). Later,
details see Supplementary Tables 4–6). GO function and pathway analyses were performed on the
six network-based functional modules. Through enrichment
analysis (Supplementary Table 7), we identified that Module 0
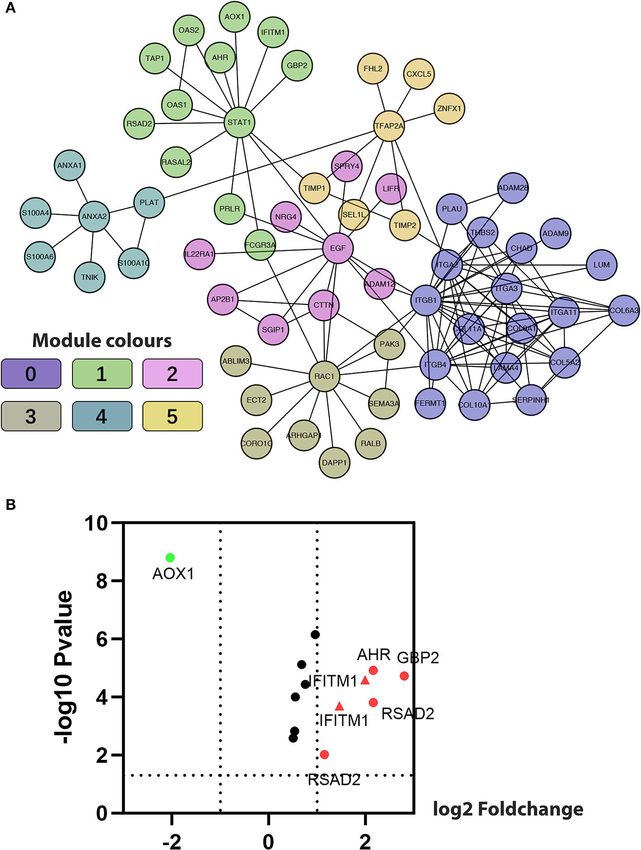
Identification of FI Network-Based containing 19 genes was in relation to the classical cell–cell
Functional Modules adhesion process. Module 1 was of the highest average correlation
The Markov Cluster algorithm (MCL) was applied for the and was related to the classical cancer signaling pathway in
network-based module-clustering algorithm, and the absolute the KEGG and IFN-gamma pathway in NCI-PID. Module 2
FIGURE 3 | Construction of functional interaction (FI) network-based module genes. (A) A functional network constructed by six FI-based modules comprises 23
genes in different colors. (B) A volcano map shows differentiating pancreatic cancer samples from normal samples, with red representing significantly upregulated
genes, green representing significantly downregulated genes, and the red triangle representing IFITM1.
Frontiers in Oncology | www.frontiersin.org 7 March 2021 | Volume 11 | Article 626883Wu et al. IFITM1 in Pancreatic Cancer FIGURE 4 | The expression of IFN-induced transmembrane protein 1 (IFITM1) between pancreatic cancer and normal pancreas samples. (A) Heat map of IFITM1 associated with pancreatic cancer among eight studies. (B,C) An overview of IFITM1 levels in pancreatic tumors and normal pancreatic tissues and immunohistochemical analysis of IFITM1 expression in pancreatic cancer and normal pancreatic tissues. Data were derived from the Human Protein Atlas database. (B) The green and the red arrows represent normal pancreatic tissue and pancreatic cancer, respectively. (C) Top: Protein levels of IFITM1 in normal tissue (staining: negative; intensity: negative; quantity: none); bottom: Protein levels of IFITM1 in pancreatic cancer tissue (staining: high; intensity: strong; quantity: >75%). (D) mRNA levels of IFITM1 in 20 types of cancers vs. normal tissues. The figure represented the number of data sets involving statistically significant upregulated (dark) as well as downregulated (light) expression of IFITM1. (E) The box plot shows the expression profile of the IFITM1 based on GEPIA. The red node represents pancreatic cancer, and the gray node represents normal samples. *p < 0.05. Frontiers in Oncology | www.frontiersin.org 8 March 2021 | Volume 11 | Article 626883
Wu et al.                                                                                                                                IFITM1 in Pancreatic Cancer

was found related to cell motility and proliferation in KEGG                         were selected for the volcano plot analysis of the five GEO
and Module 3 to cell migration and cytoskeleton. Fibro-relevant                      data sets (Figure 3B, IFITM1 marker in the red triangle).
families in Reactome were enriched in Module 4. Meanwhile, the                       Through comprehensive literature searching, studies relative
enrichment of GO term was also analyzed. The calculation results                     to AHR and pancreatic cancer have been taken, but not
showed that the GO functions of six modules complied with the                        enough background data was found about AOX1, GBP2,
pathway annotations (Supplementary Tables 8–10).                                     and RSAD2 (31). Combining the results from the functional
   Five genes (IFITM1, AHR, AOX1, GBP2, and RSAD2)                                   analysis of the FI network and literature mining, we were
common to both Module 1, with an average correlation                                 interested to see if IFITM1 could be a potential biomarker in
equal to 1.00, and the set of previously selected eight genes                        pancreatic cancer.

 FIGURE 5 | The IFN-induced transmembrane protein 1 (IFITM1) expressions in pancreatic cancer samples and paired peritumor tissues. (A) IFITM1 in representative
 cases of pancreatic cancer tissues in TNM stage 1–4 were detected by IHC experiments, respectively. Original magnification × 20. (B) The differential protein
 expression of IFITM1 was shown in pancreatic cancer tissues and matched non-tumor tissues of 90 patients as indicated. The median extents of the expressions
 were indicated by the horizontal line in the scatterplot figure. (C) Correlations between different expressed IFITM1 and the pathological TNM stage of pancreatic
 cancer patients.

Frontiers in Oncology | www.frontiersin.org                                      9                                          March 2021 | Volume 11 | Article 626883
Wu et al.                                                                                                                                 IFITM1 in Pancreatic Cancer

Aberrant Expression of IFITM1 in                                                          of 2.350 and p-value 0.008), and Iacobuzio-Donahue et al.
Pancreatic Cancer                                                                         (36) (fold change of 2.855 and p-value of 0.005), respectively.
First, we used the Oncomine database to explore the                                       While Buchholz et al. (37) and Grutzmann et al. (38) found no
transcriptional level of IFITM1 in pancreatic cancer and                                  significant upregulation in pancreatic cancer with p-values of
normal pancreatic tissues (Figure 4D). Based on the data from                             0.412 and 0.231, respectively. Recently, Pei et al. (39) studied 36
the Oncomine database, the transcriptional level of IFITM1                                samples of pancreatic carcinoma and 16 paired normal samples,
was significantly elevated in pancreatic cancer tissue vs. normal                         and statistical significance was reported with a fold change of
pancreatic tissue. Same results can also be seen in colorectal,                           2.304 and a p-value of 0.002. Meanwhile, we found the protein
esophageal, gastric, liver, and many other cancer types. Eight                            expression of IFITM1 with the help of the Human Protein Atlas,
studies reported from 2003 to 2009 were filtered out with the                             and the positively strong level was also found in pancreatic
screening condition of “IFITM1; Cancer vs. Normal Analysis;                               cancer specimens compared with normal tissues (Figures 4B,C).
Cancer Type: Pancreatic Cancer” and assessed with a heat map                              Furthermore, the GEPIA online tool (https://www.gepia.
analysis (Figure 4A). Segara et al. (32) found that the level                             cancer-pku.cn) was also used to validate the differential mRNA
of IFITM1 in pancreatic cancer was significantly increased                                expression analysis of IFITM1 in pancreatic cancer and normal
compared to adjacent normal pancreas samples, with a fold                                 tissues (Figure 4E).
change of 5.521 and a p-value of 6.78E-7. The same results                                    Immunohistochemical experiments were applied to validate
were also reported by Badea et al. (33) (fold change of 3.065                             IFITM1 expression in 90 patients with pancreatic cancer.
and p-value of 8.21E-9), Logsdon et al. (34) (fold change of                              Representative IHC-stained images showed that IFITM1 is
4.104 and p-value of 1.14E-4), Ishikawa et al. (35) (fold change                          mainly located in the cell membrane of the pancreatic cancer

TABLE 3 | Relationship between the expression of IFITM1 and clinical characteristics of 90 patients with pancreatic cancer.

Parameter                                                    Patients                                                         IFITM1 expression

                                              Number                     Percentage                        Low                    High                      p-value

Gender                                                                                                                                                       0.808
  Male                                          58                           64.44                          14                     44
  Female                                        32                           35.56                           7                     25
Age at diagnosis (year)                                                                                                                                      0.944
  ≤65                                           54                           60.00                          13                     41
  >65                                           36                           40.00                           9                     27
Tumor size (cm)                                                                                                                                              0.839
  ≤4.5                                          54                           60.00                          13                     41
  >4.5                                          36                           40.00                           8                     28
Histologic differentiation                                                                                                                                   0.032
  Well                                          9                            10.00                           4                      5
  Moderate                                      48                           53.55                          14                     34
  Poor                                          33                           36.67                           3                     30
TNM stage                                                                                                                                                    0.044
  1                                             3                             3.33                           2                      1
  2                                             66                           72.22                          12                     54
  3                                             18                           21.11                           7                     11
  4                                             3                             3.33                           1                      2
Nodal status                                                                                                                                                 0.970
  negative                                      50                           55.56                          11                     40
        1                                       33                           36.67                           8                     26
        2                                       7                             7.78                           2                      3
Distant metastasis                                                                                                                                           0.259
  negative                                      86                           95.56                          21                      0
  positive                                      4                             4.44                          65                      4
TNM Stage                                                                                                                                                    0.512
  I                                             3                             3.33                           1                      2
  II                                            37                           41.11                           6                     31
  III                                           42                           46.67                          11                     31
  IV                                            8                             8.89                           3                      5

Frontiers in Oncology | www.frontiersin.org                                          10                                       March 2021 | Volume 11 | Article 626883
Wu et al. IFITM1 in Pancreatic Cancer
tissues. A significantly upregulated expression of IFITM1 was of patients with pancreatic cancer, including gender, age at
found in 76.7% of the patients (69/90), which was consistent diagnosis, tumor size, histologic differentiation, TNM stage,
with the results analyzed by the microarray data (p < 0.001, see nodal status, and distant metastasis. Histologic differentiation
Figures 5A,B). (p = 0.032) and TNM stage (p = 0.044) were found to
have close correlations with IFITM1 expression (Table 3).
Higher expression of IFITM1 correlated with poor histologic
Correlation of IFITM1 Expression of differentiation and larger TNM stage. The significant correlation
Clinical Features in Patients With between IFITM1 and the TNM stage was also verified
Pancreatic Cancer using the GEPIA (https://www.gepia.cancer-pku.cn; Figure 5C).
The χ 2 -test was applied to assess the relationship between the Consistent with our investigation, IFITM1 might be an oncogene
expressions of IFITM1 and the clinical and pathologic features for pancreatic cancer that participates in tumorigenesis.
FIGURE 6 | The prognostic value of different expressed IFITM1 in patients with pancreatic cancer. (A) Kaplan–Meier curve for the disease-free survival of patients with
pancreatic cancer with low vs. high expression of IFITM1 [median progression-free survival (PFS)Wu et al. IFITM1 in Pancreatic Cancer
The Cancer Genome Atlas-Based Analysis relation between IFITM1 levels and immune infiltrations.
Validates the Prognostic IFITM1 Signature The positive correlations were assessed between IFITM1 and
A total of 184 patients with pancreatic cancer in the TCGA B cell (Cor = 0.171, p = 2.51E-2), CD4+ T cell (Cor =
database, with 5 of them having no documented T or N stage, 0.307, p = 4.90E-5), macrophage (Cor = 0.204, p = 7.34E-3),
leaving 179 patients for the confirmation of the relationship neutrophil (Cor = 0.475, p = 5.20E-11), and dendritic cell
between IFITM1 and human pancreatic cancer. The Kaplan– (Cor = 0.421, p = 1.01E-8). IFITM1 level was in negative
Meier analysis and the log-rank test were used for analysis. As association with purity (Cor = −0.165, p = 3.1E-2). Only
shown in Figure 6A, patients with a low level of IFITM1 had CD8+ T cell was found having no significant relation to IFITM1
better disease-free survival than those with high IFITM1 (log- expression (Figure 7).
rank p = 0.036) as well as had a better OS (Figure 6B, log-rank
p = 0.014).
IFN-Induced Transmembrane Protein 1
Silencing Inhibits Tumorigenicity of
Verification of IFITM1 With Prognostic
Pancreatic Cancer
Signature Three types of pancreatic cancer cell lines and normal human
For the survival analysis, the median IHC value was used
pancreatic duct epithelial cell line HPDE6-C7 were used to
as an objective cutoff to stratify 90 patients with pancreatic
examine the expressions of IFITM1. As shown in Figures 8B,C,
cancer with low and high expressions. We used the Kaplan–
higher mRNA and protein levels of IFITM1 were found
Meier analysis and the log-rank test to explore the correlation.
in BxPc-3, PanC-1, and SW1990 compared to HPDE6-C7.
The follow-up time was 81 months, and a high IFITM1 level
Two shRNA targeting IFITM1 were transfected into PanC-
was found significantly related to decreased OS (p = 0.032;
1 and SW1990 to detect the IFITM1 silencing effects, and
Figure 6C). The median OS of the patients with pancreatic
the efficiency was examined both by qRT-PCR and Western
cancer with the low and high IFITM1 expression was 43.0 vs. 10.0
blot analysis (Figures 8D,E). We performed cell counting kit-8
months, respectively.
assay to assess the cancer cell proliferation. The results showed
As for the univariable Cox regression analysis, positive
that the downregulation of IFITM1 significantly decreased the
nodal status (p = 0.008), TNM stage (p = 0.012), histologic
proliferation of PanC-1 and SW1990 cell lines (Figure 8A).
differentiation (p = 0.004), and IFITM1 expression (p = 0.040)
Moreover, the wound-healing assay indicated that IFITM1
were significantly associated with worse outcome (Table 4). In
silencing inhibited cell migration capability, and the colony-
the multivariable analysis, IFITM1 expression (HR = 2.134; 95%
formation assay showed that it greatly reduced the cancer stem
CI 1.073, 4.245; p = 0.031) remained an independent prognostic
cell-like properties of pancreatic cancer (Figures 8F–I).
marker for OS of patients with pancreatic cancer (Table 4).
Immune Cell Infiltration of IFITM1 in DISCUSSION
Patients With Pancreatic Cancer
IFN-induced transmembrane protein 1 was found involving in With the highest incidence-to-mortality ratio of solid tumors,
inflammatory processes and immune cells infiltration, which pancreatic cancer is an elusive disease seeking explorations
might further influence the clinical outcomes of patients with to elicit the redundant mechanisms involving pathogenesis,
pancreatic cancer. We used the TIMER database (https:// progression, and metastasis. To improve the poor clinical
cistrome.shinyapps.io/timer/) to explore a comprehensive expectations, we identified and verified a potential molecular
TABLE 4 | Univariable and multivariable Cox regression analyses for overall survival, accounting for IFITM1 expression and clinicopathological features in 90 patients with
pancreatic cancer.
Parameter Univariable Multivariable
Hazard ratio p-value Hazard ratio (95% CI) p-value
(95% CI)
Gender (female/male) 1.164 (0.702, 1.931) 0.556
Age (years; ≤65/>65) 1.200 (0.733, 1.963) 0.469
TNM stage (1/2/3/4) 1.541 (0.939, 2.529) 0.087
Nodal status (0/1/2) 1.670 (1.140, 2.447) 0.008 1.026 (0.535, 1.970) 0.938
Distant metastasis (-/+) 2.548 (0.921, 7.053) 0.072
TNM Stage(I/II/III/IV) 1.563 (1.103, 2.215) 0.012 1.684 (0.886, 3.198) 0.111
Tumor size (≤4.5/>4.5 cm) 1.212 (0.739, 1.990) 0.446
Histologic differentiation (well/moderately/poorly) 1.819 (1.214, 2.725) 0.004 1.616 (1.060, 2.462) 0.026
IFITM1 expression (≤median/>median) 1.971 (1.030, 3.771) 0.040 2.134 (1.073, 4.245) 0.031
Frontiers in Oncology | www.frontiersin.org 12 March 2021 | Volume 11 | Article 626883Wu et al. IFITM1 in Pancreatic Cancer FIGURE 7 | The correlations between different IFITM1 expression and the immune cell infiltration (TIMER) in pancreatic cancer. biomarker through network-based analytic methods of multiple was confirmed through IHC experiment later. Similarly, previous data sets and etiology-based malignancies characterizing (30). studies have shown high expressed IFITM1 in a variety of cancers. Systematically, through five microarray gene expression data Through the human cancer profiling array containing 10 samples sets, the FI network-based approach was used to build the of lung carcinoma and the corresponding normal samples, functional modules for pancreatic cancer. On the basis of IFITM1 was detected increasing significantly in lung carcinoma the diverse function of each module, the degree value, and (40). The difference was also observed in two other studies the connectivity of the nodes, IFITM1 was identified as a that demonstrated IFITM1 overexpression through tissues and promising biomarker. Consistent with the outcomes of several lung cancer cell lines of patients (8, 41). Immunohistochemistry bioinformatics online tools, IFITM1 was found highly expressed on TMA of a consecutive cohort including 174 patients with in pancreatic cancer compared to normal pancreatic tissues and gastroesophageal adenocarcinoma also detected a significant Frontiers in Oncology | www.frontiersin.org 13 March 2021 | Volume 11 | Article 626883
Wu et al.                                                                                                                                IFITM1 in Pancreatic Cancer

 FIGURE 8 | The depletion of IFITM1 decreased the tumorigenicity of pancreatic cancer cells. (A) Control (shNC) or IFITM1-depleted (shIFITM1-1 and shIFITM1-2)
 PanC-1 and SW1990 cell lines were incubated for 72 h to determine the cell proliferation rate by cell counting kit-8 assay. Data represent the mean ± SD of three
 independent experiments (***p < 0.001). (B,C) Detection of IFITM1 mRNA expression in three different pancreatic cancer cell lines and HPDE6-C7 by qRT-PCR and
 Western blot analysis. GAPDH and β-Actin were used as controls, respectively. The results are expressed as the mean ± SD of three independent experiments (***p <
 0.001). (D,E) Pancreatic cancer cell lines were transfected with shRNAs (shIFITM1-1 and shIFITM1-2), and the expression level of IFITM1 was assessed by qRT-PCR
 and Western blot analysis using GAPDH and β-actin as controls, respectively. The results are expressed as mean ± SD of three independent experiments. (F,G)
 Colony-formation assay was performed to show decreased cancer stem cell-like properties of PanC-1 and SW1990 cells transfected with shIFITM1-1 or shIFITM1-2
 compared with control in vitro. (H,I) The wound-healing assay was performed to assess the effect of IFITM1 silencing on the wound closure ability of PanC-1 cells.
 Representative images are shown (magnification ×100).

Frontiers in Oncology | www.frontiersin.org                                     14                                          March 2021 | Volume 11 | Article 626883
Wu et al.                                                                                                             IFITM1 in Pancreatic Cancer

elevation of IFITM1 in primary tumors along with lymph                      In addition to the multiple cell functions involving anti-
node metastases, compared to the adjacent normal epithelium              proliferation and adhesion, the IFITM1 is predominantly
and intestinal metaplasia (42). Gastric cancer samples derived           important in immune responses (54). As we discovered
from 27 patients and 6 gastric cancer cell lines, and tissues            above, immune cell infiltration was in significant correlation
of 4 patients and 4 tumor cell lines were assessed by Lee                with IFITM1 in pancreatic cancer. Escape of natural killer
et al. (7) and Yang et al. (43) separately and showed the same           cell recognition was reported from gastric cancer cells with
findings. Moreover, aberrant expressions of IFITM1 detected              an increased level of IFITM1 (43). This indicated that
through cancer array profiling, immunohistochemistry, RT-PCR,            tumors expressing high IFITM1 were insensitive to the
immunoblotting, and immunofluorescence analysis were verified            antiproliferative therapies, which might be attributed to escaping
in colorectal cancer, hepatocellular carcinoma, head and neck            immune surveillance.
squamous cell carcinoma (HNSCC), gallbladder, and ovarian                   Although we discovered the potential role of IFITM1 in
cancer (6, 8, 23, 44–46).                                                pancreatic cancer, limitations to this study were acknowledged.
   Notably, the histologic differentiation (p = 0.032) and TNM           A tumor xenograft model is needed to verify the outcomes in
stage (p = 0.044) of the patients with pancreatic cancer were            vivo experiments, and a larger cohort of patients with pancreatic
significantly correlated with IFITM1 expression in the clinical          cancer are expected to validate the data.
and pathological analyses. In order to explore the underlining              Taken together, our study constructed an effective FI network-
mechanisms, we found the role of IFITM1 has been shown in                based module analysis to discover the differentially expressed
the tumorigenesis involving tumor cells unlimited proliferation,         genes between pancreatic cancer and normal pancreatic tissues
invasion, angiogenesis, metastasis, and treatment resistance.            and suggested that the upregulation of IFITM1 correlated to a
Overexpression of IFITM1 was for the first time found to enhance         poor clinical result of pancreatic cancer.
cancer migration and invasion in 2005, with the cell model
of gastric cancer (43). The phenomenon was then discovered
in HNSCC, glioma, and gastric cells in vitro experiments,                DATA AVAILABILITY STATEMENT
and meanwhile the downregulation of IFITM1 significantly
                                                                         The original contributions presented in the study are included
decreased the activity of matrix metalloproteinase 9 (MM9)
                                                                         in the article/Supplementary Material, further inquiries can be
(44, 47). Two studies revealed that the depletion of IFITM1
                                                                         directed to the corresponding author/s.
significantly inhibited aromatase inhibitor (AI)-resistant breast
cancer growth, and the invasion and observation reversed with
the ectopic level of IFITM1 (48, 49). Recently, Yang et al.              ETHICS STATEMENT
(43) demonstrated that IFITM1 was essentially required for
the progression of non-small cell lung cancer (NSCLC), both              The studies involving human participants were reviewed
in vitro and in vivo and the silenced expression of IFITM1               and approved by the Ethical Committees of the National
significantly reduced the capacity of sphere-formation, invasion,        Engineering Center for Biochips at Alenabio and Shanghai
and migration of NSCLC.                                                  Outdo Biotech Company and Taizhou People’s Hospitals. The
   To further validate the prognostic signature of IFITM1                patients/participants provided their written informed consent to
in patients with pancreatic cancer, both univariable and                 participate in this study. The animal study was reviewed and
multivariable Cox regression analyses were assessed, and the data        approved by the Ethical Committees of the National Engineering
suggested IFITM1 as an independent prognostic marker. Similar            Center for Biochips at Alenabio and Shanghai Outdo Biotech
prognostic values were also seen in other types of tumors (42,           Company and Taizhou People’s Hospitals. Written informed
45, 50). Chemotherapy, radiation therapy, and endocrine therapy          consent was obtained from the individual(s) for the publication
are three critical and effective strategies in cancer treatment.         of any potentially identifiable images or data included in
Accumulating evidence has indicated that IFITM1 was involved             this article.
in radio- and chemo-resistance as well as endocrine therapy
resistance. In our previous study, we explored the radiosensitive
possibility of adipose-derived mesenchymal stem cells and                AUTHOR CONTRIBUTIONS
discovered IFITM1 could be an important target involved in
                                                                         SY and CM were responsible for the research design
radioresistance (23). Mechanically, the upregulation level of
                                                                         and participated in the paper. LW and XZ drafted
IFITM1 was correlated with high expression of STAT3 and MMP
                                                                         the manuscript and participated in data collection and
family and also with the downregulation of P53 and caspase
                                                                         analysis. LW, XZ, MT, and DY performed the laboratory
family. The association between IFITM1 and signal transducer
                                                                         experiments. All authors were responsible for data analysis and
STAT at the molecular level was also detected and evaluated
                                                                         figure format.
by knockdown of IFITM1 in oral tumors (51, 52). While the
interaction between IFITM1 and P53 signaling cascades, the
apoptotic effects of other IFITM proteins were mainly P53-               FUNDING
independent (53). Yet, it is still unclear whether IFITM1 is
of prime importance in the responsiveness of patients with               This study was supported by grants from the Chinese Medicine
pancreatic cancer to clinical therapies.                                 Research Program of Zhejiang Province (Grant No.2018ZZ014)

Frontiers in Oncology | www.frontiersin.org                         15                                    March 2021 | Volume 11 | Article 626883
Wu et al. IFITM1 in Pancreatic Cancer
and the Zhejiang Provincial key Discipline of Traditional Chinese School of Medicine, Hangzhou, China) for the professional
Medicine (Grant No.2017-XK-A32). assistance in tissue staining valuation.
ACKNOWLEDGMENTS SUPPLEMENTARY MATERIAL
The authors thank Professor Chen Xin (Zhejiang University The Supplementary Material for this article can be found
School of Medicine, Hangzhou, China) for the professional online at: https://www.frontiersin.org/articles/10.3389/fonc.
support and help, and Mr. Cui Jinlong (Zhejiang University 2021.626883/full#supplementary-material
REFERENCES 16. Croft D, O’Kelly G, Wu G, Haw R, Gillespie M, Matthews L, et al. Reactome:
a database of reactions, pathways and biological processes. Nucleic Acids Res.
1. Rahib L, Smith BD, Aizenberg R, Rosenzweig AB, Fleshman JM, Matrisian (2011) 39:D691–7. doi: 10.1093/nar/gkq1018
LM. Projecting cancer incidence and deaths to 2030: the unexpected burden 17. Shannon P, Markiel A, Ozier O, Baliga NS, Wang JT, Ramage
of thyroid, liver, and pancreas cancers in the United States. Cancer Res. (2014) D, et al. Cytoscape: a software environment for integrated
74:2913–21. doi: 10.1158/0008-5472.CAN-14-0155 models of biomolecular interaction networks. Genome Res. (2003)
2. Robin F, Angenard G, Cano L, Courtin-Tanguy L, Gaignard E, Khene ZE, 13:2498–504. doi: 10.1101/gr.1239303
et al. Molecular profiling of stroma highlights stratifin as a novel biomarker 18. Wu G, Dawson E, Duong A, Haw R, Stein L. ReactomeFIViz: a Cytoscape
of poor prognosis in pancreatic ductal adenocarcinoma. Br J Cancer. (2020) app for pathway and network-based data analysis. F1000Res. (2014)
123:72–80. doi: 10.1038/s41416-020-0863-1 3:146. doi: 10.12688/f1000research.4431.2
3. Christenson ES, Jaffee E, Azad NS. Current and emerging therapies for 19. Zhao X, Xu M, Cai Z, Yuan W, Cui W, Li MD. Identification of LIFR.
patients with advanced pancreatic ductal adenocarcinoma: a bright future. PIK3R1, and MMP12 as novel prognostic signatures in gallbladder
Lancet Oncol. (2020) 21:e135–45. doi: 10.1016/S1470-2045(19)30795-8 cancer using network-based module analysis. Front Oncol. (2019)
4. Diamond MS, Farzan M. The broad-spectrum antiviral functions of IFIT and 9:325. doi: 10.3389/fonc.2019.00325
IFITM proteins. Nat Rev Immunol. (2013) 13:46–57. doi: 10.1038/nri3344 20. Uhlen M, Fagerberg L, Hallstrom BM, Lindskog C, Oksvold P, Mardinoglu A,
5. Friedman RL, Manly SP, McMahon M, Kerr IM, Stark GR. Transcriptional et al. Proteomics. tissue-based map of the human proteome. Science. (2015)
and posttranscriptional regulation of interferon-induced gene expression in 347:1260419. doi: 10.1126/science.1260419
human cells. Cell. (1984) 38:745–55. doi: 10.1016/0092-8674(84)90270-8 21. Rhodes DR, Yu J, Shanker K, Deshpande N, Varambally R, Ghosh D, et al.
6. Kim NH, Sung HY, Choi EN, Lyu D, Choi HJ, Ju W, et al. Aberrant DNA ONCOMINE: a cancer microarray database and integrated data-mining
methylation in the IFITM1 promoter enhances the metastatic phenotype in an platform. Neoplasia. (2004) 6:1–6. doi: 10.1016/S1476-5586(04)80047-2
intraperitoneal xenograft model of human ovarian cancer. Oncol Rep. (2014) 22. Tang Z, Li C, Kang B, Gao G, Li C, Zhang Z. GEPIA: a web server for cancer
31:2139–46. doi: 10.3892/or.2014.3110 and normal gene expression profiling and interactive analyses. Nucleic Acids
7. Lee J, Goh SH, Song N, Hwang JA, Nam S, Choi IJ, et al. Overexpression Res. (2017) 45:W98–102. doi: 10.1093/nar/gkx247
of IFITM1 has clinicopathologic effects on gastric cancer and 23. Wu L, Tang Q, Yin X, Yan D, Tang M, Xin J, et al. The therapeutic
is regulated by an epigenetic mechanism. Am J Pathol. (2012) potential of adipose tissue-derived mesenchymal stem cells to enhance
181:43–52. doi: 10.1016/j.ajpath.2012.03.027 radiotherapy effects on hepatocellular carcinoma. Front Cell Dev Biol. (2019)
8. Yang YG, Koh YW, Sari IN, Jun N, Lee S, Phi LTH, et al. Interferon- 7:267. doi: 10.3389/fcell.2019.00267
induced transmembrane protein 1-mediated EGFR/SOX2 signaling axis is 24. Keshava Prasad TS, Goel R, Kandasamy K, Keerthikumar S, Kumar S,
essential for progression of non-small cell lung cancer. Int J Cancer. (2019) Mathivanan S, et al. Human protein reference database−2009 update. Nucleic
144:2020–32. doi: 10.1002/ijc.31926 Acids Res. (2009) 37:D767–72. doi: 10.1093/nar/gkn892
9. Yu F, Xie D, Ng SS, Lum CT, Cai MY, Cheung WK, et al. IFITM1 promotes 25. Chatr-Aryamontri A, Breitkreutz BJ, Oughtred R, Boucher L, Heinicke S,
the metastasis of human colorectal cancer via CAV-1. Cancer Lett. (2015) Chen D, et al. The BioGRID interaction database: 2015 update. Nucleic Acids
368:135–43. doi: 10.1016/j.canlet.2015.07.034 Res. (2015) 43:D470–8. doi: 10.1093/nar/gku1204
10. Ramanathan A, Ramanathan A. Interferon induced transmembrane Protein- 26. Brown KR, Jurisica I. Unequal evolutionary conservation of human
1 gene expression as a biomarker for early detection of invasive potential protein interactions in interologous networks. Genome Biol. (2007)
of oral squamous cell carcinomas. Asian Pac J Cancer Prev. (2016) 17:2297– 8:R95. doi: 10.1186/gb-2007-8-5-r95
9. doi: 10.7314/APJCP.2016.17.4.2297 27. Orchard S, Ammari M, Aranda B, Breuza L, Briganti L, Broackes-Carter
11. Sari IN, Yang YG, Phi LT, Kim H, Baek MJ, Jeong D, et al. F, et al. The MIntAct project–IntAct as a common curation platform for
Interferon-induced transmembrane protein 1 (IFITM1) is required 11 molecular interaction databases. Nucleic Acids Res. (2014) 42:D358–
for the progression of colorectal cancer. Oncotarget. (2016) 63. doi: 10.1093/nar/gkt1115
7:86039–50. doi: 10.18632/oncotarget.13325 28. Licata L, Briganti L, Peluso D, Perfetto L, Iannuccelli M, Galeota E, et al.
12. Wright GW, Simon RM. A random variance model for detection of MINT, the molecular interaction database: 2012 update. Nucleic Acids Res.
differential gene expression in small microarray experiments. Bioinformatics. (2012) 40:D857–61. doi: 10.1093/nar/gkr930
(2003) 19:2448–55. doi: 10.1093/bioinformatics/btg345 29. Salwinski L, Miller CS, Smith AJ, Pettit FK, Bowie JU, Eisenberg D. The
13. Pathan M, Keerthikumar S, Ang CS, Gangoda L, Quek CY, database of interacting proteins: 2004 update. Nucleic Acids Res. (2004)
Williamson NA, et al. FunRich: an open access standalone functional 32:D449–51. doi: 10.1093/nar/gkh086
enrichment and interaction network analysis tool. Proteomics. (2015) 30. Wu G, Feng X, Stein L. A human functional protein interaction
15:2597–601. doi: 10.1002/pmic.201400515 network and its application to cancer data analysis. Genome Biol. (2010)
14. Niu X, Zhang J, Ni J, Wang R, Zhang W, Sun S, et al. Network pharmacology- 11:R53. doi: 10.1186/gb-2010-11-5-r53
based identification of major component of Angelica sinensis and its action 31. Masoudi S, Hassanzadeh Nemati A, Fazli HR, Beygi S, Moradzadeh M,
mechanism for the treatment of acute myocardial infarction. Biosci Rep. Pourshams A, et al. An increased level of aryl hydrocarbon receptor in
(2018) 38:BSR20180519. doi: 10.1042/BSR20180519 patients with pancreatic cancer. Middle East J Dig Dis. (2019) 11:38–
15. Akey JM, Biswas S, Leek JT, Storey JD. On the design and analysis of gene 44. doi: 10.15171/mejdd.2018.126
expression studies in human populations. Nat Genet. (2007) 39:807–8; author 32. Segara D, Biankin AV, Kench JG, Langusch CC, Dawson AC, Skalicky DA,
reply 808–9. doi: 10.1038/ng0707-807 et al. Expression of HOXB2, a retinoic acid signaling target in pancreatic
Frontiers in Oncology | www.frontiersin.org 16 March 2021 | Volume 11 | Article 626883Wu et al. IFITM1 in Pancreatic Cancer
cancer and pancreatic intraepithelial neoplasia. Clin Cancer Res. (2005) 45. He J, Li J, Feng W, Chen L, Yang K. Prognostic significance of INF-
11:3587–96. doi: 10.1158/1078-0432.CCR-04-1813 induced transmembrane protein 1 in colorectal cancer. Int J Clin Exp Pathol.
33. Badea L, Herlea V, Dima SO, Dumitrascu T, Popescu I. Combined gene (2015) 8:16007–13.
expression analysis of whole-tissue and microdissected pancreatic ductal 46. Li D, Yang Z, Liu Z, Zou Q, Yuan Y. DDR2 and IFITM1 are prognostic
adenocarcinoma identifies genes specifically overexpressed in tumor epithelia. markers in gallbladder squamous cell/adenosquamous carcinomas and
Hepatogastroenterology. (2008) 55:2016–27. adenocarcinomas. Pathol Oncol Res. (2019) 25:157–67. doi: 10.1007/s12253-01
34. Logsdon CD, Simeone DM, Binkley C, Arumugam T, Greenson JK, Giordano 7-0314-3
TJ, et al. Molecular profiling of pancreatic adenocarcinoma and chronic 47. Gonzalez-Avila G, Sommer B, Mendoza-Posada DA, Ramos C,
pancreatitis identifies multiple genes differentially regulated in pancreatic Garcia-Hernandez AA, Falfan-Valencia R. Matrix metalloproteinases
cancer. Cancer Res. (2003) 63:2649–57. participation in the metastatic process and their diagnostic and
35. Ishikawa M, Yoshida K, Yamashita Y, Ota J, Takada S, Kisanuki H, et al. therapeutic applications in cancer. Crit Rev Oncol Hematol. (2019)
Experimental trial for diagnosis of pancreatic ductal carcinoma based on 137:57–83. doi: 10.1016/j.critrevonc.2019.02.010
gene expression profiles of pancreatic ductal cells. Cancer Sci. (2005) 96:387– 48. Choi HJ, Lui A, Ogony J, Jan R, Sims PJ, Lewis-Wambi J. Targeting
93. doi: 10.1111/j.1349-7006.2005.00064.x interferon response genes sensitizes aromatase inhibitor resistant breast
36. Iacobuzio-Donahue CA, Maitra A, Olsen M, Lowe AW, van Heek NT, cancer cells to estrogen-induced cell death. Breast Cancer Res. (2015)
Rosty C, et al. Exploration of global gene expression patterns in pancreatic 17:6. doi: 10.1186/s13058-014-0506-7
adenocarcinoma using cDNA microarrays. Am J Pathol. (2003) 162:1151– 49. Lui AJ, Geanes ES, Ogony J, Behbod F, Marquess J, Valdez K, et al. IFITM1
62. doi: 10.1016/S0002-9440(10)63911-9 suppression blocks proliferation and invasion of aromatase inhibitor-resistant
37. Buchholz M, Braun M, Heidenblut A, Kestler HA, Kloppel G, Schmiegel breast cancer in vivo by JAK/STAT-mediated induction of p21. Cancer Lett.
W, et al. Transcriptome analysis of microdissected pancreatic intraepithelial (2017) 399:29–43. doi: 10.1016/j.canlet.2017.04.005
neoplastic lesions. Oncogene. (2005) 24:6626–36. doi: 10.1038/sj.onc.1208804 50. Balbous A, Cortes U, Guilloteau K, Villalva C, Flamant S, Gaillard A, et al.
38. Grutzmann R, Pilarsky C, Ammerpohl O, Luttges J, Bohme A, Sipos A mesenchymal glioma stem cell profile is related to clinical outcome.
B, et al. Gene expression profiling of microdissected pancreatic ductal Oncogenesis. (2014) 3:e91. doi: 10.1038/oncsis.2014.5
carcinomas using high-density DNA microarrays. Neoplasia. (2004) 6:611– 51. Liang R, Li X, Zhu X. Deciphering the roles of IFITM1 in
22. doi: 10.1593/neo.04295 tumors. Mol Diagn Ther. (2020) 24:433–41. doi: 10.1007/s40291-02
39. Pei H, Li L, Fridley BL, Jenkins GD, Kalari KR, Lingle W, et al. FKBP51 affects 0-00469-4
cancer cell response to chemotherapy by negatively regulating Akt. Cancer 52. Yang J, Li L, Xi Y, Sun R, Wang H, Ren Y, et al. Combination of IFITM1
Cell. (2009) 16:259–66. doi: 10.1016/j.ccr.2009.07.016 knockdown and radiotherapy inhibits the growth of oral cancer. Cancer Sci.
40. Andreu P, Colnot S, Godard C, Laurent-Puig P, Lamarque D, (2018) 109:3115–28. doi: 10.1111/cas.13640
Kahn A, et al. Identification of the IFITM family as a new 53. Xu Y, Yang G, Hu G. Binding of IFITM1 enhances the inhibiting effect
molecular marker in human colorectal tumors. Cancer Res. (2006) of caveolin-1 on ERK activation. Acta Biochim Biophys Sin. (2009) 41:488–
66:1949–55. doi: 10.1158/0008-5472.CAN-05-2731 94. doi: 10.1093/abbs/gmp034
41. Yan J, Jiang Y, Lu J, Wu J, Zhang M. inhibiting of proliferation, 54. Siegrist F, Ebeling M, Certa U. The small interferon-induced
migration, and invasion in lung cancer induced by silencing Interferon- transmembrane genes and proteins. J Interferon Cytokine Res. (2011)
Induced Transmembrane Protein 1 (IFITM1). Biomed Res Int. (2019) 31:183–97. doi: 10.1089/jir.2010.0112
2019:9085435. doi: 10.1155/2019/9085435
42. Borg D, Hedner C, Gaber A, Nodin B, Fristedt R, Jirstrom K, et al. Expression Conflict of Interest: The authors declare that the research was conducted in the
of IFITM1 as a prognostic biomarker in resected gastric and esophageal absence of any commercial or financial relationships that could be construed as a
adenocarcinoma. Biomark Res. (2016) 4:10.doi: 10.1186/s40364-016-0064-5 potential conflict of interest.
43. Yang Y, Lee JH, Kim KY, Song HK, Kim JK, Yoon SR, et al. The interferon-
inducible 9-27 gene modulates the susceptibility to natural killer cells Copyright © 2021 Wu, Zhu, Yan, Tang, Ma and Yan. This is an open-access article
and the invasiveness of gastric cancer cells. Cancer Lett. (2005) 221:191– distributed under the terms of the Creative Commons Attribution License (CC BY).
200. doi: 10.1016/j.canlet.2004.08.022 The use, distribution or reproduction in other forums is permitted, provided the
44. Hatano H, Kudo Y, Ogawa I, Tsunematsu T, Kikuchi A, Abiko Y, et al. original author(s) and the copyright owner(s) are credited and that the original
IFN-induced transmembrane protein 1 promotes invasion at early stage publication in this journal is cited, in accordance with accepted academic practice.
of head and neck cancer progression. Clin Cancer Res. (2008) 14:6097– No use, distribution or reproduction is permitted which does not comply with these
105. doi: 10.1158/1078-0432.CCR-07-4761 terms.
Frontiers in Oncology | www.frontiersin.org 17 March 2021 | Volume 11 | Article 626883You can also read