Endogenous suppression of WNT signalling in human embryonic stem cells leads to low differentiation propensity towards definitive endoderm - Nature
←
→
Page content transcription
If your browser does not render page correctly, please read the page content below
www.nature.com/scientificreports
OPEN Endogenous suppression
of WNT signalling in human
embryonic stem cells leads
to low differentiation propensity
towards definitive endoderm
Dominika Dziedzicka1, Mukul Tewary2,3, Alexander Keller1, Laurentijn Tilleman4,
Laura Prochazka2, Joel Östblom2, Edouard Couvreu De Deckersberg1, Christina Markouli1,
Silvie Franck1, Filip Van Nieuwerburgh4, Claudia Spits1, Peter W. Zandstra2,5,6,
Karen Sermon1* & Mieke Geens1
Low differentiation propensity towards a targeted lineage can significantly hamper the utility
of individual human pluripotent stem cell (hPSC) lines in biomedical applications. Here, we use
monolayer and micropatterned cell cultures, as well as transcriptomic profiling, to investigate how
variability in signalling pathway activity between human embryonic stem cell lines affects their
differentiation efficiency towards definitive endoderm (DE). We show that endogenous suppression
of WNT signalling in hPSCs at the onset of differentiation prevents the switch from self-renewal to
DE specification. Gene expression profiling reveals that this inefficient switch is reflected in NANOG
expression dynamics. Importantly, we demonstrate that higher WNT stimulation or inhibition of
the PI3K/AKT signalling can overcome the DE commitment blockage. Our findings highlight that
redirection of the activity of Activin/NODAL pathway by WNT signalling towards mediating DE fate
specification is a vulnerable spot, as disruption of this process can result in poor hPSC specification
towards DE.
The use of human pluripotent stem cells (hPSCs) in biomedical applications is hampered by variable efficiencies
with which individual lines differentiate towards desired cell lineages1–4. Both (epi)genetic and environmen-
tal factors can contribute to this functional v ariability5,6. For example, differences in genetic, epigenetic and
transcriptomic profiles between individual hPSC lines4,7–10 can lead to different levels of activity of signalling
pathways, resulting in an individual line’s differential response to differentiation cues.
Human PSC differentiation efficiency can be improved by optimising differentiation conditions for individual
lines3,11, or by screening and selecting lines with the highest differentiation efficiency for an intended applica-
tion. While specific expression profiles at the undifferentiated stage can act as indicators of hPSC differentia-
tion propensity12–14, not all disruptions to differentiation programmes are detectable at this stage. Therefore, a
more optimal screening approach can be to evaluate lines based on their early lineage specification efficiency.
Moreover, studying mechanisms which lead to differentiation bias can improve our knowledge about key signal-
ling pathways involved in hPSC fate specification and lead to further improvement of differentiation protocols.
Given the importance of querying the differentiation potential of multiple hPSC lines, tools have been devel-
oped to address this question in a standardized manner. Examples include the TeratoScore, which quantitatively
assesses trilineage differentiation capacity based on gene expression signatures of hPSC-derived teratomas15, and
the ScoreCard, which scores the gene expression profiles of differentiating embryoid bodies (EBs)4,16. However,
1
Research Group Reproduction and Genetics, Vrije Universiteit Brussel, 1090 Brussels, Belgium. 2Institute of
Biomaterials and Biomedical Engineering, University of Toronto, Toronto, ON M5S 3E1, Canada. 3Centre for Stem
Cells and Regenerative Medicine, King’s College London, Guy’s Hospital, London SE1 9RT, UK. 4Laboratory of
Pharmaceutical Biotechnology, Ghent University, 9000 Ghent, Belgium. 5Michael Smith Laboratories, University
of British Columbia, Vancouver, BC V6T 1Z4, Canada. 6School of Biomedical Engineering, University of British
Columbia, Vancouver, BC V6T 1Z3, Canada. *email: karen.sermon@vub.be
Scientific Reports | (2021) 11:6137 | https://doi.org/10.1038/s41598-021-85447-4 1
Vol.:(0123456789)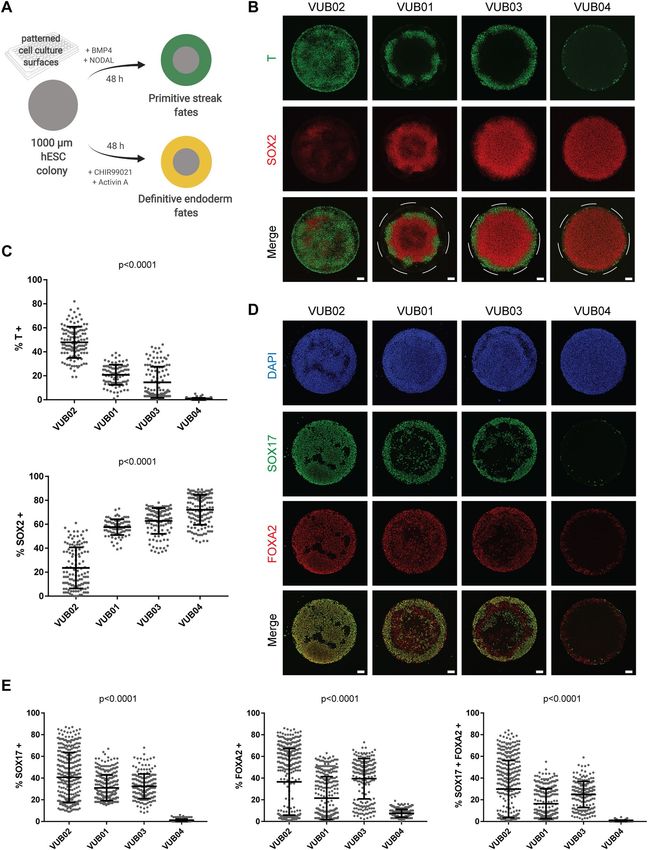
www.nature.com/scientificreports/

          Scientific Reports |   (2021) 11:6137 |   https://doi.org/10.1038/s41598-021-85447-4   2

Vol:.(1234567890)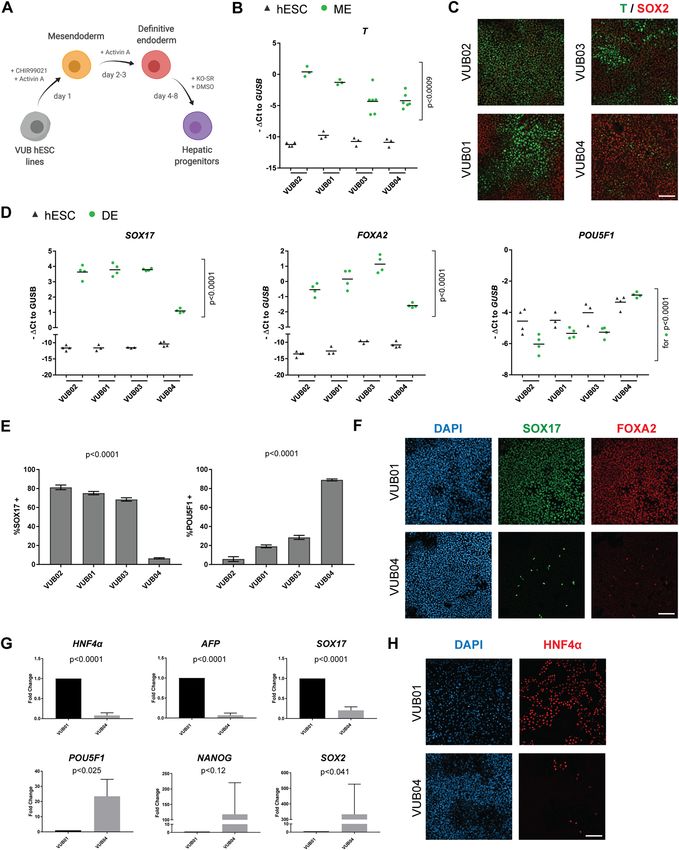
www.nature.com/scientificreports/
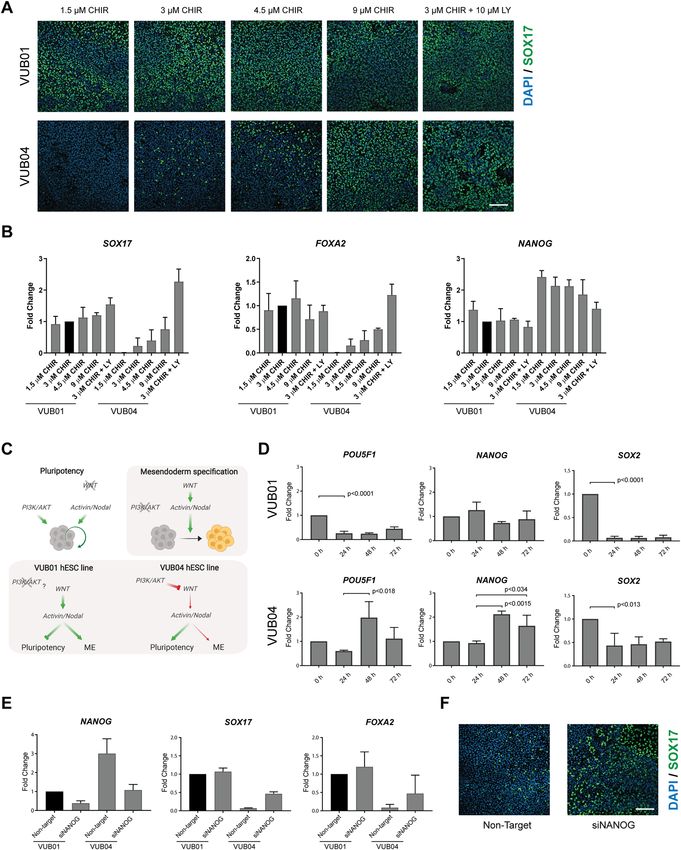
◂Figure 1. Differentiation propensity screen of four hESC lines shows that the VUB04 line has a low
differentiation efficiency towards definitive endoderm (DE). (A) Schematic overview of differentiation
protocols used to direct the cells towards mesendoderm (ME), DE and hepatic progenitors (HP). Created with
BioRender. (B) Gene expression levels of T in hESCs and ME samples. Black triangles and green dots represent
undifferentiated and differentiated samples, respectively. (C) Representative immunofluorescent images for T
and SOX2 after 24-h ME differentiation. (D) Expression level of SOX17, FOXA2 and POU5F1 in hESCs and
DE samples. Black triangles and green dots represent undifferentiated and differentiated samples, respectively.
(E) Percentage of SOX17- and POU5F1-positive cells after 72-h DE differentiation of hESC lines. The cells
were counted with ImageJ software, version 1.51j8 (https://imagej.nih.gov/ij/index.html). (F) Representative
immunofluorescent images for SOX17 and FOXA2 after DE differentiation of VUB01 and VUB04. (G)
Comparison of expression levels of hepatic, DE and pluripotency markers between VUB01 and VUB04 in HP
samples. (H) Representative immunostainings for HNF4α after 8-day HP differentiation of VUB01 and VUB04.
All scale bars represent 100 μm. All gene expression data and the quantified immunofluorescent data are
representative of at least three (panel B,D) or three (panel G) biological replicates. The p-values were calculated
using either one-way ANOVA (panel B,D,E) or unpaired t-test (panel G). For panels B and D, the p-values were
calculated only for differentiated samples (green dots).
both methods are suboptimal for high-throughput studies because they are time-consuming, taking from 7 days
(ScoreCard) to several weeks (TeratoScore). In contrast, a recently developed in vitro platform allows for the
generation of peri-gastrulation-like fate patterning in geometrically-confined colonies within only 2 days17,18, and
has been recently validated for robust and quantitative screening of differentiation propensities of multiple hPSC
lines19. Thus, this micropatterned differentiation can be a valuable alternative to the previously established tools.
Efficient differentiation of hPSCs towards endodermal lineages, e.g. of liver or pancreas, is of great value
to regenerative medicine and drug development. Most established differentiation protocols initiate definitive
endoderm (DE) specification by modulating the activity of Activin/NODAL and WNT s ignalling20–22, though
some additionally employ modifiers of FGF, BMP and/or PI3K/AKT pathway activity23–25. The Activin/NODAL
pathway is known to play an important role in both maintaining pluripotency and guiding the cells towards DE
specification26,27, whereas the role of WNT signalling in DE differentiation is to switch the specificity of Activin/
NODAL signalling from supporting pluripotency to initiating mesendoderm s pecification20,28,29.
Our study aimed to uncover how variability in the activity of key signalling pathways associated with either
maintenance of pluripotency or early lineage specification influences the differentiation propensity of individual
hPSC lines towards DE. We used short-term monolayer differentiation protocols and the peri-gastrulation-
like patterning to classify our human embryonic stem cell (hESC) lines according to their early differentiation
propensity towards DE lineages and subsequently evaluated their transcriptomic profiles. Our results show that
endogenous suppression of WNT signalling can result in reduced hPSC differentiation propensity towards DE
and highlights that the essential switch of Activin/NODAL activity is a vulnerable spot on the way to efficient
DE specification.
Results
Differentiation propensity screen identifies a hESC line with poor differentiation efficiency
towards DE. We first screened a panel of four hESC lines (VUB01, VUB02, VUB03 and VUB04), routinely
grown on human recombinant laminin-521 (LN521), for their efficiency to differentiate towards DE. All these
hESC lines were derived previously in our laboratory30; VUB01 and VUB02 were derived from embryos donated
by infertile patients, and characterized as genetically normal, whereas VUB03 was derived from an embryo
shown to be affected with myotonic dystrophy type 1 (VUB03_DM1), and VUB04 from an embryo with the
F508del mutation in one copy of the CFTR gene and the 5 T variant in the second allele (VUB04_CF). The latter
genotype makes VUB04 a carrier of cystic fibrosis (CF) because the 5 T variant only leads to CF if it appears in
cis with the R117H mutation and a second CFTR disease-causing mutation in trans31.
We used established directed differentiation protocols towards mesendoderm, DE and hepatic p rogenitors32–34
adapted to LN521-based culture (Fig. 1A). After the first 24 h of mesendoderm differentiation, we detected dif-
ferences in the induction of the primitive streak marker Brachyury (T), with VUB03 and VUB04 lines showing
the lowest but variable upregulation (Fig. 1B,C). In the subsequent 48 h differentiation towards DE, VUB04 per-
formed the poorest (Fig. 1D–F, Supplementary Fig. S1), with significantly lower expression of DE markers SOX17
(on average 6.25-fold decrease) and FOXA2 (on average 4.03-fold decrease) in comparison to the other three
lines. VUB04 also retained high expression (6.11-fold increase) of the pluripotency marker POU5F1 (Fig. 1D).
Consistently, at the protein level, less than 10% of the VUB04 cells were positive for SOX17, whereas other
lines showed a range of 65–80% SOX17-positive cells (Fig. 1E). In addition, 85% of VUB04 cells still expressed
POU5F1, which was significantly higher than the other lines, suggesting that VUB04 did not efficiently exit
the pluripotent state. Next, we subjected VUB04 to 8-day hepatic progenitor (HP) differentiation to establish
whether the inability to specify towards DE lineages hampered the specification of DE derivatives. As suspected,
expression of hepatic progenitor markers HNF4α, AFP and SOX17 was significantly lower and the expression of
pluripotency markers POU5F1 and SOX2 significantly higher in VUB04 in comparison to VUB01 (Fig. 1G,H).
To check whether the differentiation impairment of VUB04 is specific towards the DE lineage or more
general, we differentiated all four hESC lines to the neuroectoderm lineage (Supplementary Fig. S1). Although
some variability in the expression levels of PAX6 and SOX1 was observed, VUB04 did not differ significantly
from the other lines (Supplementary Fig. S1). Additionally, we performed 12-day spontaneous EB differentiation
in serum-free STEMdiff APEL medium, followed by gene expression profiling with the ScoreCard assay. For
this, we generated equal-sized aggregates following our previously published p rotocol35 to avoid any potential
Scientific Reports | (2021) 11:6137 | https://doi.org/10.1038/s41598-021-85447-4 3
Vol.:(0123456789)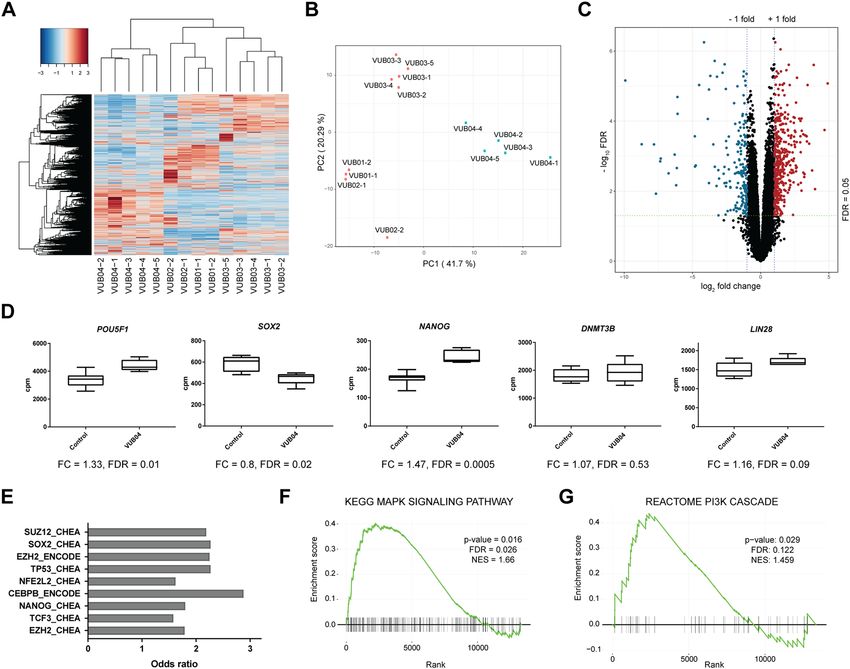
www.nature.com/scientificreports/
differentiation bias originating from differentially sized EBs. Intriguingly, the ScoreCard indicated that all VUB
lines, including VUB04, significantly downregulated pluripotency genes and upregulated genes associated with
the three germ layers (Supplementary Fig. S1). Moreover, the hESC line which scored the lowest for expression of
endoderm-associated genes was VUB03 and not VUB04. We linked this discrepancy in differentiation outcomes
between different differentiation assays to the fact that during this EB assay the lines were subjected to spontane-
ous differentiation in a 3-dimensional environment and not to defined growth factors that were used during the
conventional 2-dimensional monolayer differentiation. Therefore, this experiment showed that VUB04 is able
to upregulate endoderm-associated genes during spontaneous differentiation, but does not efficiently differenti-
ate towards DE upon exposure to particular modulators of signalling pathways (Fig. 1A; CHIR and Activin A).
Importantly, we do not think that the low differentiation efficiency of VUB04 towards DE is caused by the fact
that the line carries the F508del mutation and the 5 T variant in the CFTR alleles. In support of that argument,
studies which used hiPSC lines affected with CF and hiPSC lines which were corrected for CF in vitro have not
reported any differences in differentiation efficiency towards DE based on the mutational state of the l ines36–38.
Additionally, we have not detected CFTR expression in VUB hESC lines at the undifferentiated stage nor in the
samples differentiated towards mesendoderm (Supplementary Fig. S1), which suggests that mutations in CFTR
gene do not affect the pluripotent state and the early lineage specification.
Micropatterned differentiation confirms hESC differentiation propensity. To confirm that
VUB04 has an impaired response to DE specification cues, we subjected our lines to directed differentiation
in an alternative culture system. We used a micropatterning technology which allows for precise control of
spatial microenvironment by confining cells to defined circular geometries. It has been recently demonstrated
that in this system, upon BMP4 induction, micropatterned circular colonies of hPSCs form radially segregated
regions of a population of cells retaining SOX2 expression in the centre and a ring of T-positive cells close to
the edge17. Additionally, we recently showed that by modifying culture conditions it is also possible to obtain
the DE population within these micropatterns, with cells double positive for SOX17 and F OXA219. Therefore,
we used these two micropatterned differentiation protocols to evaluate the differentiation responses of all four
hESC lines (Fig. 2A). After the 48-h BMP4 induction, we observed different fate patterning between the lines.
VUB01 and VUB03 showed the radially segregated peri-gastrulation-like fates, VUB02 colonies were mostly
overtaken by T-positive cells, whereas VUB04 colonies only showed a slight upregulation of T at the very edge
of the colonies (Fig. 2B). Quantitative analysis confirmed that most of the cells within VUB04 colonies retained
the expression of SOX2, whereas fewer than 10% were positive for T (Fig. 2C). Importantly, VUB04 also demon-
strated a poor response in the DE micropatterned differentiation. Here again, we observed a similar variability
in fate patterning as with the BMP4 induction, with VUB02 colonies largely consisting of cells positive for DE
markers, whereas VUB04 colonies only displaying a thin outside ring of SOX17- and FOXA2-double positive
cells (Fig. 2D). Although variability was observed in the amount of double positive cells between the colonies
of the same line, VUB04 consistently showed the worst induction towards the DE fate (Fig. 2E). These results
were consistent with our previous finding that VUB04 displays a low differentiation propensity towards DE in
directed differentiation protocols when starting from monolayer cultures.
Distinct transcriptomic profile of undifferentiated VUB04 cells does not explain the low DE
differentiation propensity. Based on the observations described above, we hypothesised that VUB04
does not respond efficiently to DE differentiation cues because it differently regulates the activity of signalling
pathways involved in DE specification. Therefore, we performed bulk mRNA-sequencing of the hESC lines at
the undifferentiated stage to identify potential differences in the transcriptomic profile of VUB04. Unsupervised
clustering analysis of the transcriptomic data showed that all VUB04 samples cluster separately from the other
three lines (Fig. 3A). Although each hESC line demonstrated some differences in its expression profile, the first
Principal Component which accounted for 41.7% variability between all the samples clustered all the VUB04
samples away from the other samples (Fig. 3B). Therefore, in the following differential expression analysis we
compared VUB04 to the other three lines, grouped as the control. The analysis showed that 579 genes are more
than twofold up- or down-regulated in VUB04 at the FDR < 0.05 significance level (Fig. 3C, Supplementary
Fig. S2). Additionally, we observed differential expression of the pluripotency markers POU5F1, SOX2 and
NANOG in VUB04 (Fig. 3D). Although these were less than a twofold difference, it was an interesting observa-
tion given the high number of POU5F1-positive cells in VUB04 after 72 h of DE differentiation (Fig. 1E). For
NANOG, which was the most differentially expressed, we performed a copy number assay to check for a possible
NANOG gene duplication in VUB04. The result clearly showed that VUB04 has only two copies of the NANOG
gene (Supplementary Fig. S2).
To evaluate which factors may contribute to the distinct VUB04 expression profile, we performed additional
bioinformatic analysis. We carried out transcription factor enrichment analysis for the top differentially expressed
genes in VUB04 using the Enrichr tool. Interestingly, the analysis showed that the list of top differentially
expressed genes is significantly enriched for SOX2 and NANOG targets (Fig. 3E). We then checked if any signal-
ling pathways associated with the pluripotent state are enriched within the significantly differentially expressed
genes in VUB04. GSEA analysis identified MAPK/ERK signalling as one of the most enriched pathways within
the most upregulated genes in VUB04 (Fig. 3F, Supplementary Fig. S2). The MAPK/ERK pathway together with
PI3K/AKT signalling have been suggested to be induced by FGF2 in hPSCs and to play important roles in the
maintenance of pluripotency39. However, the enrichment for PI3K signalling within the most upregulated genes
in VUB04 was not statistically significant (FDR > 0.05; Fig. 3G). Furthermore, the expression profile of VUB04
at the undifferentiated stage did not indicate any clear deregulation for Activin/NODAL and WNT pathways,
Scientific Reports | (2021) 11:6137 | https://doi.org/10.1038/s41598-021-85447-4 4
Vol:.(1234567890)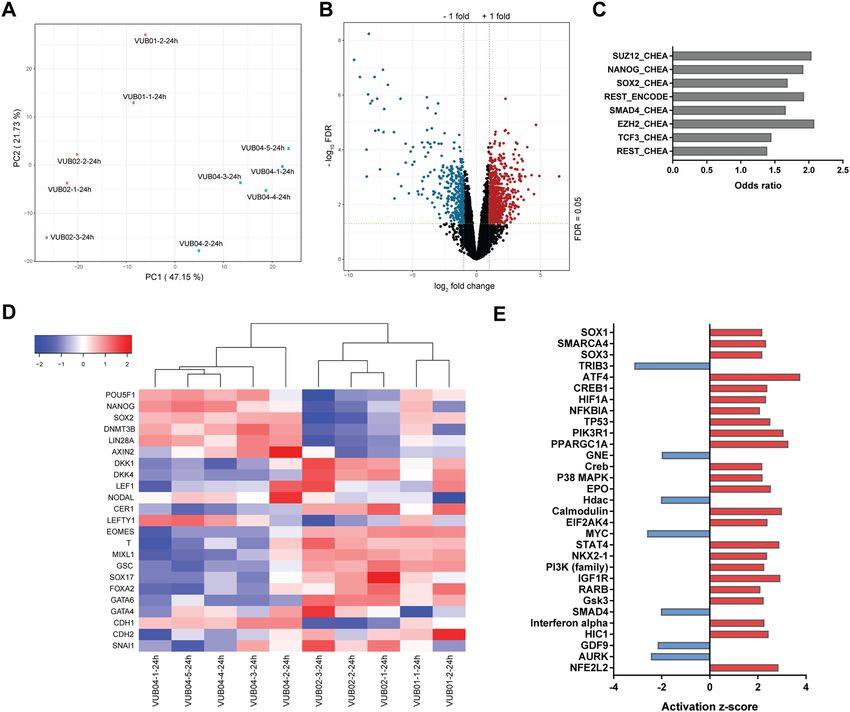
www.nature.com/scientificreports/

                                  Figure 2.  Micropatterned differentiation confirms the low differentiation propensity of VUB04 towards definitive
                                  endoderm (DE). (A) Schematic overview of micropatterned differentiation protocols used to direct four hESC lines
                                  towards primitive streak and DE like fates in 1000 μm in diameter circular colonies. Created with BioRender. (B)
                                  Representative immunofluorescent images for T and SOX2 after 48-h micropatterned differentiation towards primitive
                                  streak fates. (C) Percentage of T- and SOX2-positive cells after peri-gastrulation-like differentiation observed within
                                  the tested lines. Each data point represents one individual colony. Number of colonies were 120, 91, 120 and 134
                                  for VUB02, VUB01, VUB03 and VUB04, respectively. Data pooled from two independent experiments. Error bars
                                  represent mean ± SD. (D) Representative images for SOX17 and FOXA2 after 48-h DE micropatterned differentiation.
                                  (E) Percentage of SOX17-positive, FOXA2-positive and double-positive cells after DE differentiation observed in
                                  the tested lines. Each data point represents one individual colony. Number of colonies were 370, 318, 201 and 300
                                  for VUB02, VUB01, VUB03 and VUB04, respectively. Data pooled from two independent experiments. Error bars
                                  represent mean ± SD. All p-values were calculated using one-way ANOVA. All scale bars represent 100 μm.

Scientific Reports |   (2021) 11:6137 |                 https://doi.org/10.1038/s41598-021-85447-4                                                      5

                                                                                                                                                  Vol.:(0123456789)
www.nature.com/scientificreports/
Figure 3. Transcriptomic analysis reveals that VUB04 has a distinct expression profile at the undifferentiated
stage. (A) Unsupervised hierarchical clustering and heatmap of transcriptome data of all lines tested. (B)
Principal Component Analysis of dimension 1 versus dimension 2 based on normalized transcriptome data. (C)
Volcano plot based on a comparison of gene expression levels between VUB04 and the control group (VUB01,
VUB02 and VUB03). Genes with |log2 fold change|> 1 and FDR < 0.05 were marked as either significantly
upregulated (red) or downregulated (blue). D) Normalized expression values for selected pluripotency markers
in the control group and VUB04. FC fold change. (E) Transcription factor enrichment for the top deregulated
genes in VUB04 (based on top |log2 fold change| and FDR < 0.05) done by the Enrichr tool and based on CHEA
and ENCODE databases.) (F) and (G) Enrichment profile for MAPK/ERK signalling (F) and PI3K signalling
(G) performed on the ranked gene list based on a comparison of the expression levels between VUB04 and the
control group. Rank 0 represents the gene with the highest-ranking score. Vertical black bars represent genes
within the ranked list belonging to the given pathway. NES normalized enrichment score.
which are crucially involved in DE specification. Together, the transcriptomic analysis at the undifferentiated
stage did not provide a clear reason for the VUB04 differentiation impairment.
Transcriptomic profile after 24‑h DE differentiation suggests inefficient activation of WNT sig-
nalling in VUB04. We thus hypothesised that the influence of the distinct expression profile of VUB04
on its DE differentiation propensity is mainly manifested once the line is exposed to specific differentiation
signals. During the first 24 h of DE differentiation, cells were incubated with both the WNT signalling activa-
tor CHIR and Activin A—a ligand of the Activin/NODAL pathway. As Activin/NODAL signalling is active
in both pluripotency and during endoderm specification, whereas WNT signalling is stimulated only during
the first 24 h of endoderm differentiation and is required to switch the activity of Activin/NODAL pathway,
we assessed whether WNT signalling was efficiently induced in VUB04 after this period. Immunofluorescent
analysis showed that β-catenin is not present in the nuclei at the undifferentiated stage but changes its cellular
localization after 24 h DE differentiation in both VUB01 and VUB04 (Supplementary Fig. S3). However, nuclear
localization of β-catenin does not necessarily imply efficient expression of WNT signalling downstream targets.
Therefore, we performed transcriptomic analysis at the 24-h DE differentiation timepoint, using VUB01 and
Scientific Reports | (2021) 11:6137 | https://doi.org/10.1038/s41598-021-85447-4 6
Vol:.(1234567890)www.nature.com/scientificreports/
Figure 4. Transcriptomic profile after 24-h DE differentiation suggests inefficient activation of WNT signalling
in VUB04. (A) Principal Component Analysis of dimension 1 versus dimension 2 based on normalized
transcriptome data. (B) Volcano plot based on comparison of gene expression levels between VUB04 and
the control group (VUB01 and VUB02). Genes with |log2 fold change|> 1 and FDR < 0.05 were marked as
either significantly upregulated (red) or downregulated (blue). (C) Transcription factor enrichment for the
top deregulated genes (|log2 fold change| and FDR < 0.05) in VUB04 done by Enrichr tool. (D) Heatmap for
gene expression levels (normalized counts per million) of pluripotency genes, WNT and NODAL signalling
downstream targets, DE and epithelial-to-mesenchymal transition markers in the control group and in VUB04
after 24-h DE differentiation. (E) Prediction for upstream regulators of differentially expressed genes in the 24-h
DE VUB04 samples with |log2 fold change|> 1 and FDR < 0.05 done by Ingenuity Pathway Analysis. Only the
upstream regulators with the activation z-score higher than 2 or lower than -2 and p-value < 0.05 are shown.
VUB02 as a control group, as they robustly differentiate towards mesendodermal derivatives (Figs. 1, 2), indicat-
ing efficient activation of WNT signalling. As in the undifferentiated state, VUB04 displayed a different expres-
sion profile, clustering away from the control lines (Fig. 4A). There were 1054 genes expressed twofold higher
or lower in VUB04 samples than in the control lines at the FDR < 0.05 significance level (Fig. 4B). Transcription
factor enrichment analysis indicated that the list of top deregulated genes in VUB04 is significantly enriched for
NANOG and SOX2 (Fig. 4C), again suggesting an inefficient exit from pluripotency after 24-h differentiation
(Fig. 4D). While pluripotency genes remained upregulated, many downstream targets of the WNT pathway (e.g.
LEF1, DKK1, DKK4) had little to no expression, and most of the genes associated with primitive streak forma-
tion (e.g. MIXL1, EOMES, T, GSC) were expressed at a much lower level than in the control group (Fig. 4D). In
agreement, Ingenuity Pathway Analysis for upstream regulators predicted that the PI3K/AKT signalling, which
is linked to maintenance of the pluripotent state, and GSK3, a negative regulator of the WNT pathway, are acti-
vated in the VUB04 samples in comparison to the control group (Fig. 4E).
Scientific Reports | (2021) 11:6137 | https://doi.org/10.1038/s41598-021-85447-4 7
Vol.:(0123456789)www.nature.com/scientificreports/
Scientific Reports | (2021) 11:6137 | https://doi.org/10.1038/s41598-021-85447-4 8
Vol:.(1234567890)www.nature.com/scientificreports/
◂Figure 5. Stronger activation of WNT signalling improves DE differentiation efficiency of VUB04. (A)
Representative immunofluorescent images for SOX17 after 72-h DE differentiation of VUB01 and VUB04 in
various differentiation conditions. The scale bar represents 100 μm. (B) Gene expression analysis of SOX17,
FOXA2 and NANOG in VUB01 and VUB04 differentiated for 72 h towards DE—standard differentiation
condition (3 µM CHIR99021 for the first 24 h) was compared to modified conditions (different concentration
of CHIR99021 during the first 24 h or additional incubation with PI3K inhibitor LY294002 for the first 48 h).
Data represents three biological replicates. (C) Schematic illustration of the signalling pathways involved in the
maintenance of pluripotency (white background) and mesendoderm (ME) specification (grey background).
The lower part illustrates the difference in signalling pathway crosstalks between VUB01 and VUB04 hESC
lines which influence the differentiation outcome. Created with BioRender. (D) Gene expression dynamics of
pluripotency markers in VUB01 and VUB04 during the 72-h DE differentiation. Data represents three biological
replicates. The p-values were calculated with unpaired t-test. (E) Comparison of NANOG, SOX17 and FOXA2
expression after 72-h DE differentiation between VUB01 and VUB04 transfected cells. Data represents two
biological replicates. (F) Representative images for SOX17 after 72-h DE differentiation of VUB04 transfected
with either non-targeting or NANOG-targeting siRNA. The scale bar represents 100 μm.
Increased stimulation of WNT signalling improves VUB04 differentiation efficiency towards
DE. As WNT signalling appeared to be inefficiently activated in VUB04 during the first 24 h of DE differen-
tiation, we modified the protocol in an attempt to rescue the poor differentiation of VUB04. We observed an
increase in SOX17-positive cells in VUB04 when stimulated with WNT inducer CHIR at concentrations higher
than the standard 3 µM (Fig. 5A, Supplementary Fig. S4), with an almost 5-times higher expression of SOX17
and FOXA2 when treated with 9 µM CHIR (Fig. 5B). The differentiation outcome also improved when the 3 µM
CHIR condition was supplemented with the PI3K inhibitor LY294002 (LY) for the first 48 h of differentiation,
(Fig. 5A,B, Supplementary Fig. S4). Intriguingly, the expression levels of pluripotency markers in VUB04 only
decreased to similar levels as in VUB01 when the cells were treated with LY, but not when higher concentra-
tions of CHIR were used (Fig. 5B, Supplementary Fig. S4). Additionally, higher CHIR concentrations seemed to
increase the expression of the mesodermal markers PDGFRA in both lines tested and KDR in VUB04 (Supple-
mentary Fig. S4). These results suggest that active PI3K/AKT signalling may prevent efficient activation of WNT
signalling at the onset of DE differentiation (Fig. 5C), as previously s uggested40.
NANOG expression dynamics during differentiation define DE specification efficiency. As the
data indicated that VUB04 did not efficiently exit the pluripotent state during the DE differentiation, we com-
pared the dynamics of pluripotency factor expression between VUB01 and VUB04 over the course of the 72-h
unmodified DE differentiation protocol. In VUB01, the expression of POU5F1 and SOX2 significantly decreased
after 24 h, whereas NANOG expression levels remained similar to the undifferentiated stage during the entire
72 h differentiation period (Fig. 5D). VUB04 displayed a different pattern: after 24 h the downregulation of SOX2
was less pronounced and POU5F1 and NANOG expression increased significantly between 24 and 48 h. The
latter observation coincides with CHIR withdrawal and subsequent incubation with Activin A only for the fol-
lowing 2 days (Fig. 5D). Under normal circumstances, 24 h WNT induction should result in the shift of Activin/
NODAL signalling activity from promoting pluripotency to driving DE specification. The fact that POU5F1
and NANOG expression levels increased at the 48-h timepoint indicated that exit from pluripotency is not effi-
ciently induced in VUB04, likely due to the impaired activation of WNT signalling, and that the cells remain
programmed to support pluripotency when exposed to a high concentration of Activin A (Fig. 5C).
NANOG is one of the key nodes of the pluripotency n etwork41 and it cooperates together with Activin/
NODAL signalling in supporting hPSC self-renewal26. As inhibition of PI3K/AKT signalling in VUB04 seemed
to improve the exit from pluripotency and DE differentiation, we explored if reducing NANOG expression in
VUB04 prior to DE differentiation would also improve the differentiation outcome. Interestingly, knocking down
NANOG led to improved DE differentiation (Fig. 5E,F, Supplementary Fig. S5), with increased expression of
SOX17 and FOXA2 after 72 h, though the expression levels were not as high as in VUB01 (Fig. 5E). Nevertheless,
NANOG knock down in VUB04 also led to improved HP differentiation (Supplementary Fig. S5). At the same
time, exogenous downregulation of NANOG in VUB01 did not result in any change in its high DE differentiation
capacity (Fig. 5E, Supplementary Fig. S5). Therefore, these experiments demonstrated that exogenous knockdown
of NANOG could eliminate the failure of VUB04 to differentiate to DE. It also suggested that efficient DE specifi-
cation is dependent on a certain level of NANOG expression, with lower expression levels likely circumventing the
tempering effect that active PI3K/AKT pathway has on WNT signalling at the onset of differentiation (Fig. 5C).
Discussion
Functional variability among hPSC lines is a significant obstacle for their efficient use in many biomedical
applications5,6. Here, we used two standardized short-term differentiation assays, conventional monolayer and
micropatterned differentiation, to screen hESC lines for their differentiation efficiency towards DE and subse-
quently evaluated how differences in the intrinsic regulation of signalling pathways influence the differentiation
outcome. Importantly, we obtained the same predictions for DE differentiation efficiencies when the same hESC
lines were subjected to these two differentiation assays in two different laboratories. We thus confirmed our recent
report19 by showing that peri-gastrulation-like fate patterning can be used efficiently to fingerprint hPSC lines
for their differentiation potential in a standardized, quantitative and robust manner. In agreement with previous
studies3,11, we also demonstrated that it is possible to improve the low differentiation propensity of an individual
line by optimising the differentiation conditions.
Scientific Reports | (2021) 11:6137 | https://doi.org/10.1038/s41598-021-85447-4 9
Vol.:(0123456789)www.nature.com/scientificreports/
In the differentiation propensity screen, we identified VUB04, as a hESC line with a very low differentiation
efficiency towards DE. Gene expression profiling during DE differentiation showed that VUB04 had a distinct
expression dynamics of pluripotency genes which was coupled with inefficient priming for differentiation upon
stimulation of Activin/NODAL and WNT signalling. Thus, VUB04 is a case in point that some line-specific
properties can cause low differentiation efficiency towards DE fates already at the very onset of differentiation.
The necessity to redirect the Activin/NODAL pathway activity to DE fate specification by WNT s ignalling20,28,29
is a vulnerable spot as any disruption of this process can result in a line with low DE efficiency.
Our study also suggests that active PI3K/AKT signalling has a tempering effect on efficient activation of
WNT signalling during DE differentiation, as inhibiting PI3K/AKT signalling led to increased DE efficiency in
VUB04. The mechanism by which PI3K/AKT signalling regulates pluripotency and early lineage specification is
still being investigated. It has been previously reported that its inhibition is necessary for Activin A to efficiently
promote DE specification25. The following study by the same group proposed that PI3K signalling plays a central
role in maintaining hPSC pluripotency by modulating Activin/NODAL signalling to support self-renewal and
by suppressing MAPK/ERK and WNT signalling pathways to prevent mesendoderm specification40. Accord-
ing to this model, the switch in the Activin/NODAL signalling activity requires inactivation of the PI3K/AKT
pathway, which in turn allows the MAPK/ERK signalling to inhibit GSK3β and subsequently to stimulate the
WNT signalling to initiate differentiation. Although both the MAPK/ERK pathway and PI3K/AKT signalling
were previously reported to be downstream targets of FGF2 signalling in hPSCs, the authors propose that in
culture conditions supportive of pluripotency, PI3K/AKT signalling maintains the activity level of the MAPK/
ERK signalling within the range that supports the undifferentiated state40. A very recent study reported that
PI3K/AKT pathway is active in early human embryos and showed that hPSCs could be expanded in vitro in the
presence of PI3K activators and Activin A without the addition of F GF242, which may suggest a dominant role
of PI3K pathway over MAPK/ERK signalling in supporting hPSC self-renewal. Based on these studies and our
data, we suspect that both the activity of MAPK/ERK and PI3K/AKT are elevated in VUB04 with PI3K signal-
ling playing a dominant role in preventing VUB04 from exiting the pluripotent state during DE differentiation.
Additional proteomic analysis of the PI3K/AKT and MAPK/ERK components would provide more evidence
for this signalling pathway crosstalk.
Interestingly, reducing NANOG expression at the undifferentiated stage in VUB04 also improved DE specifi-
cation. NANOG has been shown to be necessary during mesendoderm specification, whereas its strong down-
regulation initiates neuroectoderm specification43,44. Thus, our results suggest that the effect of NANOG on
hPSC differentiation depends on its expression level, as downregulation of NANOG in the control line, VUB01,
was still permissive for mesendoderm differentiation and did not result in any reduction in DE differentiation
efficiency. Additionally, it is likely that the exogenous downregulation of NANOG in VUB04 directly or indirectly
influenced the activity of signalling pathways, one of which is possibly PI3K/AKT, which otherwise suppressed
efficient activation of WNT signalling.
To conclude, this study presents relevant insight into the influence of WNT and PI3K/AKT signalling on
hPSC differentiation towards DE and demonstrates that a hPSC line with a specific differentiation impairment
can be used as a tool to study crosstalks between signalling pathways involved in the early lineage specification.
Methods
Human ESC culture. Human ESC lines VUB01, VUB02, VUB03 (VUB03_DM1) and VUB04 (VUB04_
CF) were derived and characterized as previously described30. The human embryos used to derive the hESC
lines were donated for research after IVF and PGD cycles with the informed consent of the couples, after the
approval of the ethical committee at the Universitair Ziekenhuis Brussel of the Vrije Universiteit Brussel and
after approval from the Belgian Federal Committee for Research on Embryos (FCE). The lines were generated
according to the Belgian law on research on embryos (law of 11 May 2003). Once generated, Belgian legislation
does not require further licencing for subsequent experiments.
Cells were routinely cultured on dishes coated with 5 µg/ml LN521 (Biolamina) in NutriStem hESC XF
medium (NS medium; Biological Industries) with 100 U/ml Penicillin–Streptomycin (Pen/Strep; Thermo Fisher
Scientific) and passaged as single cells in a 1:10 to 1:30 ratio using TrypLE Express (Thermo Fisher Scientific)
when 70–80% confluent. The cells were kept at 37 °C in 5% C O2. All hESC lines were analysed for their genetic
content by array-based comparative genomic hybridization (Human Genome CGH Microarray 4 × 44 K, Agilent
Technologies) as previously d escribed45, and chromosomally balanced frozen bulks were prepared prior to the
onset of experiments. Karyotypes and passage numbers of lines used in the study can be found in Supplementary
Table S1.
Directed differentiation protocols. Mesendoderm and definitive endoderm specification. We used a
modified protocol based on D’Amour et al. and Sui et al. adapted to LN521 coating32,34. Briefly, hESCs were
seeded at a density of 4 × 10⁴ cells per c m2 and the differentiation was started 1–2 days later once the cells were
50–60% confluent. Cells were differentiated for 24 h in RPMI 1640 Medium with GlutaMAX and supplemented
with 2% B27 supplement (both from Thermo Fisher Scientific), 3 µM CHIR99021 (CHIR, STEMCELL Tech-
nologies) and 100 ng/mL Activin A (Biotechne). After the 24-h mesendoderm specification, the cells were in-
cubated for an additional 48 h in the same differentiation medium but without CHIR. When indicated, the DE
differentiation conditions were modified: either 1.5, 3, 4.5 or 9 µM CHIR was used during the first 24 h, or the
CHIR concentration was left at 3 µM but 10 µM of PI3K inhibitor LY294002 was added to the differentiation
medium for the first 48 h.
Scientific Reports | (2021) 11:6137 | https://doi.org/10.1038/s41598-021-85447-4 10
Vol:.(1234567890)www.nature.com/scientificreports/
Hepatic progenitors. The protocol was adapted from Cameron et al.33. Human ESCs were seeded on LN521 at
a density of 4 × 10⁴ cells per cm2. The next day, the pluripotency medium was changed to RPMI 1640 medium
supplemented with GlutaMAX, 0.5% B27 supplement, 3 µM CHIR and 100 ng/mL Activin A. After the first 24 h
of differentiation CHIR was removed. The day after, the medium was changed to KnockOut DMEM containing
20% KnockOut Serum Replacement, 0.5% GlutaMAX supplement, 1% MEM Non-Essential Amino Acids, 100
U/ml Pen/Strep (all from Thermo Fisher Scientific), 0.1 mM β-mercaptoethanol and 1% DMSO (both from
Sigma-Aldrich). This differentiation step lasted until day 8 and the medium was refreshed daily.
Details on differentiation towards neuroectoderm lineage and EB differentiation can be found in the Sup-
plementary Information.
Micropatterned differentiation protocols. Microtiter 96-well plates with patterned islands of 1000 µm
in diameter were prepared following a previously published protocol17. Prior to seeding cells onto the plates, the
wells were activated with N-(3-Dimethylaminopropyl)-N′-ethylcarbodiimide hydrochloride and N-Hydroxy-
succinimide (both from Sigma-Aldrich) for 20 min. The plates were thoroughly triple washed with d dH2O and
incubated with 10 µg/mL LN521 diluted in Dulbecco’s phosphate-buffered saline (DPBS; Thermo Fisher Scien-
tific) with calcium and magnesium for 3 h at 37 °C or at 4 °C overnight. After incubation, the plates were triple
washed with DPBS to remove any passively adsorbed extracellular matrix.
To develop micropatterned colonies, hESCs were seeded in NS medium with 10 µM ROCK inhibitor (ROCKi)
Y-27632 at a density of 8 × 10⁴ cells per well and incubated for 2 h at 37 °C. Although ROCKi is not essential for
seeding hESCs as single cells on LN521, its addition to the seeding suspension yielded better long-term attach-
ment of micropatterned hESC colonies. After 2–3 h, the medium was changed to NS without ROCKi. When
confluent colonies were observed, typically 12–18 h after seeding, induction towards primitive streak associated
and DE fates was started. For both differentiation protocols the basal medium was N2B27 consisting of 93%
DMEM, 1% Pen/Strep, 1% MEM Non-Essential Amino Acids, 0.1 mM β-mercaptoethanol, 1% GlutaMAX, 1%
N2 Supplement and 2% B27 minus retinoic acid supplement (all from Thermo Fisher Scientific). To generate
gastrulation associated fates, the N2B27 medium was supplemented with 50 ng/mL BMP4, 100 ng/mL NODAL
and 10 ng/mL FGF2 (all from Biotechne). For the induction of the definitive endoderm associated fates, N2B27
medium was supplemented with 3 µM CHIR (STEMCELL Technologies) and 100 ng/mL Activin A (Biotechne).
After 48 h of differentiation, the micropatterned colonies were fixed for subsequent protein expression analysis.
Immunofluorescent stainings and image analysis. For immunofluorescent stainings, the cells were
fixed with 3.7% paraformaldehyde (Sigma-Aldrich) for 20 min, rinsed three times with DPBS and then permea-
bilized with 100% methanol (Sigma-Aldrich) for 3 min. Blocking was performed using 10% Fetal Bovine Serum
(FBS; Thermo Fisher Scientific) in DPBS at 4 °C overnight. Primary antibodies were diluted in 10% FBS and
incubated at 4 °C overnight. Then, cells were triple rinsed with DPBS and incubated with secondary antibodies
and 10 µg/mL Hoechst 33342 diluted in DPBS with 10% FBS at room temperature for 2 h, followed by the final
triple rinse with DPBS. The nuclei in micropatterned hESC colonies were stained with DAPI instead of Hoechst.
Antibody sources and concentrations are shown in Supplementary Table S2.
Immunofluorescent images were taken using a LSM800 confocal microscope (ZEISS). The cell count analysis
presented in Fig. S4 was done using ZEN imaging software (ZEISS; ZEN 2, blue edition, ZEN desk module pack-
age; https://www.zeiss.com/microscopy/int/products/microscope-software/zen.html). The immunofluorescent
images for quantitative DE differentiation data presented in Fig. 1E were taken using an IX-81 fluorescent
microscope (Olympus) with Cell^F software (Olympus) and counted with ImageJ software, version 1.51j8 (https
://imagej.nih.gov/ij/index.html). We analysed at least 1000 cells per biological replicate. To obtain quantitative
single-cell data from micropatterned colonies the plates were scanned with Cellomics Arrayscan VTI platform
(Thermo Fisher Scientific) using the ‘TargetActivation.V4′ bioassay algorithm. This algorithm utilizes the fluo-
rescent intensity in the DAPI channel to identify individual nuclei in all fields imaged and acquires the associated
intensity of proteins of interest localized within the identified region. Single-cell data extracted from immuno-
fluorescent images were exported into a custom-built software for image analysis, ContextExplorer46, which
classifies cells into colonies and calculates the percentage of cells positive for proteins of interest per single colony.
Quantitative real‑time PCR analysis. For qRT-PCR gene expression analysis, total RNA was extracted
using the RNeasy Mini Kit or RNeasy Micro Kit (Qiagen) with on-column DNase digest. Reverse transcrip-
tion was performed using the First-Strand cDNA Synthesis Kit (GE Healthcare). Quantitative RT–PCR was
performed using qPCR MasterMix Plus Low ROX (Eurogentec) and TaqMan Gene Expression Assays (Thermo
Fisher Scientific). The samples were run on the ViiA 7 thermocycler (Thermo Fisher Scientific) using standard
cycling parameters provided by the manufacturer. The relative expression of genes of interest was calculated by
the ∆Ct and ∆∆Ct method with GUSB used as a reference gene. For gene expression analysis after the differentia-
tion towards hepatic progenitors, UBC was used as a second reference gene. References for the TaqMan assays
can be found in Supplementary Table S3.
Statistical analysis. Statistical analysis for quantitative immunofluorescent data and qRT-PCR gene
expression analysis was performed using the GraphPad Prism software (version 7.04; GraphPad Software, Inc.).
An unpaired t-test was performed when comparing two conditions and a one-way ANOVA followed by Bonfer-
roni correction for more than two conditions. The significance level was set at p-value < 0.05.
mRNA sequencing. Total RNA was extracted using the RNeasy Mini Kit (Qiagen) with on-column DNase
digest. The concentration and quality of extracted RNA were evaluated using the Quant-iT RiboGreen RNA
Scientific Reports | (2021) 11:6137 | https://doi.org/10.1038/s41598-021-85447-4 11
Vol.:(0123456789)www.nature.com/scientificreports/
Assay Kit (Thermo Fisher Scientific) and the RNA 6000 Pico Chip (Agilent Technologies), respectively. Subse-
quently, 500 ng of RNA was used to perform an Illumina sequencing library preparation using the QuantSeq
3′ mRNA-Seq Library Prep Kit (Lexogen) according to the manufacturer’s protocol. During library preparation
15 PCR cycles were used. Libraries were quantified by qRT-PCR, according to Illumina’s protocol ’Sequencing
Library qPCR Quantification protocol guide’, version February 2011. The library’s size distribution and quality
were analysed using the High sensitivity DNA Chip (Agilent Technologies) on a 2100 Bioanalyzer platform (Agi-
lent Technologies). Sequencing was performed on a NextSeq 500 (Illumina), generating 75 bp single-end reads.
Two separate sequencing runs where performed, one for the undifferentiated hESC samples and one for the 24-h
ME differentiation samples. All data were deposited in the GEO repository with accession number GSE148050.
Details on the downstream bioinformatic analysis of mRNA sequencing can be found in the Supplementary
Information.
Transfection for siRNA knockdown. Human ESCs were seeded on LN521 at a density of 4 × 10⁴ cells
per cm2 and the transfection was done the next day once the cells were around 50% confluent. The siRNAs
used were ON-TARGETplus Human NANOG siRNA SMARTpool and ON-TARGETplus Non-targeting siRNA
(Dharmacon, Cat.No L-014489-00-0005 and D-001810-01-05, respectively). Transfection was performed using
siRNAs at the final concentration of 50 nM and Lipofectamine RNAiMAX diluted in OptiMEM medium follow-
ing manufacturer’s protocol (Thermo Fischer Scientific). The cells were incubated with transfection reagents for
24 h after which the differentiation was started.
Data availability
The mRNA-Seq datasets generated during the current study were deposited in the GEO repository with acces-
sion number GSE148050.
Received: 9 October 2020; Accepted: 23 February 2021
References
1. Osafune, K. et al. Marked differences in differentiation propensity among human embryonic stem cell lines. Nat. Biotechnol. 26,
313–315 (2008).
2. Kim, S., Kim, B., Gil, J., Kim, S. & Kim, J. Comparative analysis of the developmental competence of three human embryonic stem
cell lines in vitro. Mol. Cells 23, 49–56 (2007).
3. Hu, B.-Y. et al. Neural differentiation of human induced pluripotent stem cells follows developmental principles but with variable
potency. Proc. Natl. Acad. Sci. USA 107, 4335–4340 (2010).
4. Bock, C. et al. Reference Maps of human ES and iPS cell variation enable high-throughput characterization of pluripotent cell
lines. Cell 144, 439–452 (2011).
5. Keller, A. et al. Genetic and epigenetic factors which modulate differentiation propensity in human pluripotent stem cells. Hum.
Reprod. Update 24, 162–175 (2018).
6. Ortmann, D. & Vallier, L. Variability of human pluripotent stem cell lines. Curr. Opin. Genet. Dev. 46, 179–185 (2017).
7. Adewumi, O. et al. Characterization of human embryonic stem cell lines by the International Stem Cell Initiative. Nat. Biotechnol.
25, 803–816 (2007).
8. Kilpinen, H. et al. Common genetic variation drives molecular heterogeneity in human iPSCs. Nature 546, 370–375 (2017).
9. Skottman, H. et al. Gene expression signatures of seven individual human embryonic stem cell lines. Stem Cells 23, 1343–1356
(2005).
10. Markouli, C. et al. Gain of 20q11.21 in Human Pluripotent Stem Cells Impairs TGF-β-Dependent Neuroectodermal Commitment.
Stem Cell Reports 13, 163–176 (2019).
11. Kattman, S. J. et al. Stage-specific optimization of activin/nodal and BMP signaling promotes cardiac differentiation of mouse and
human pluripotent stem cell lines. Cell Stem Cell 8, 228–240 (2011).
12. Kim, H. et al. miR-371-3 expression predicts neural differentiation propensity in human pluripotent stem cells. Cell Stem Cell 8,
695–706 (2011).
13. Ran, D. et al. RUNX1a enhances hematopoietic lineage commitment from human embryonic stem cells and inducible pluripotent
stem cells. Blood 121, 2882–2890 (2013).
14. Jiang, W., Zhang, D., Bursac, N. & Zhang, Y. WNT3 is a biomarker capable of predicting the definitive endoderm differentiation
potential of hESCs. Stem Cell Rep. 1, 46–52 (2013).
15. Avior, Y., Biancotti, J. C. & Benvenisty, N. TeratoScore: Assessing the Differentiation Potential of Human Pluripotent Stem Cells
by Quantitative Expression Analysis of Teratomas. Stem Cell Reports 4, 967–974 (2015).
16. Tsankov, A. M. et al. A qPCR ScoreCard quantifies the differentiation potential of human pluripotent stem cells. Nat. Biotechnol.
33, 1182–1192 (2015).
17. Tewary, M. et al. A stepwise model of Reaction-Diffusion and Positional-Information governs self-organized human peri-gastru-
lation-like patterning. Development 144, 4298–4312 (2017).
18. Tewary, M., Shakiba, N. & Zandstra, P. W. Stem cell bioengineering: building from stem cell biology. Nat. Rev. Genet. 19, 595–614
(2018).
19. Tewary, M. et al. High-throughput micropatterning platform reveals Nodal-dependent bisection of peri-gastrulation–associated
versus preneurulation-associated fate patterning. PLoS Biol. 17, e3000081 (2019).
20. D’Amour, K. A. et al. Production of pancreatic hormone-expressing endocrine cells from human embryonic stem cells. Nat.
Biotechnol. 24, 1392–1401 (2006).
21. Rezania, A. et al. Maturation of human embryonic stem cell-derived pancreatic progenitors into functional islets capable of treating
pre-existing diabetes in mice. Diabetes 61, 2016–2029 (2012).
22. Pagliuca, F. W. et al. Generation of functional human pancreatic b cells in vitro. Cell 159, 428–439 (2014).
23. Hannan, N., Segeritz, C.-P., Touboul, T. & Vallier, L. Production of hepatocyte-like cells from human pluripotent stem cells. Nat.
Protoc. 8, 430–437 (2013).
24. Loh, K. M. et al. Efficient endoderm induction from human pluripotent stem cells by logically directing signals controlling lineage
bifurcations. Cell Stem Cell 14, 237–252 (2014).
25. McLean, A. B. et al. Activin A efficiently specifies definitive endoderm from human embryonic stem cells only when phosphati-
dylinositol 3-kinase signaling is suppressed. Stem Cells 25, 29–38 (2007).
Scientific Reports | (2021) 11:6137 | https://doi.org/10.1038/s41598-021-85447-4 12
Vol:.(1234567890)www.nature.com/scientificreports/
26. Brown, S. et al. Activin/nodal signaling controls divergent transcriptional networks in human embryonic stem cells and in endo-
derm progenitors. Stem Cells 29, 1176–1185 (2011).
27. Bertero, A. et al. Activin/Nodal signaling and NANOG orchestrate human embryonic stem cell fate decisions by controlling the
H3K4me3 chromatin mark. Genes Dev. 29, 702–717 (2015).
28. Funa, N. S. et al. B-catenin regulates primitive streak induction through collaborative interactions with SMAD2/SMAD3 and
OCT4. Cell Stem Cell 16, 1–14 (2015).
29. Yoney, A. et al. WNT signaling memory is required for ACTIVIN to function as a morphogen in human gastruloids. Elife 7, 1–28
(2018).
30. Mateizel, I. et al. Derivation of human embryonic stem cell lines from embryos obtained after IVF and after PGD for monogenic
disorders. Hum. Reprod. 21, 503–511 (2006).
31. Moskowitz, S. M. et al. Clinical practice and genetic counseling for cystic fibrosis and CFTR-related disorders. Genet. Med. 10,
851–868 (2008).
32. D’Amour, K. A. et al. Efficient differentiation of human embryonic stem cells to definitive endoderm. Nat. Biotechnol. 23, 1534–1541
(2005).
33. Cameron, K. et al. Recombinant laminins drive the differentiation and self-organization of hESC-derived hepatocytes. Stem Cell
Rep. 5, 1250–1262 (2015).
34. Sui, L., Mfopou, J., Geens, M., Sermon, K. & Bouwens, L. FGF signaling via MAPK is required early and improves Activin
A-induced definitive endoderm formation from human embryonic stem cells. Biochem. Biophys. Res. Commun. 426, 380–385
(2012).
35. Dziedzicka, D. et al. A high proliferation rate is critical for reproducible and standardized embryoid body formation from laminin-
521-based human pluripotent stem cell cultures. Stem Cell Rev. Rep. 12, 721–730 (2016).
36. Crane, A. M. et al. Targeted correction and restored function of the CFTR gene in cystic fibrosis induced pluripotent stem cells.
Stem Cell Rep. 4, 569–577 (2015).
37. Firth, A. L. et al. Functional gene correction for cystic fibrosis in lung epithelial cells generated from patient iPSCs. Cell Rep. 12,
1385–1390 (2015).
38. Wong, A. P. et al. Directed differentiation of human pluripotent stem cells into mature airway epithelia expressing functional CFTR
protein. Nat. Biotechnol. 30, 876–882 (2012).
39. Lanner, F. & Rossant, J. The role of FGF/Erk signaling in pluripotent cells. Development 137, 3351–3360 (2010).
40. Singh, A. M. et al. Signaling network crosstalk in human pluripotent cells: A Smad2/3-regulated switch that controls the balance
between self-renewal and differentiation. Cell Stem Cell 10, 312–326 (2012).
41. Boyer, L. A. et al. Core transcriptional regulatory circuitry in human embryonic stem cells. Cell 122, 947–956 (2005).
42. Wamaitha, S. E. et al. IGF1-mediated human embryonic stem cell self-renewal recapitulates the embryonic niche. Nat. Commun.
11, 1–16 (2020).
43. Vallier, L. et al. Activin/Nodal signalling maintains pluripotency by controlling Nanog expression. Development 136, 1339–1349
(2009).
44. Wang, Z., Oron, E., Nelson, B., Razis, S. & Ivanova, N. Distinct lineage specification roles for NANOG, OCT4, and SOX2 in human
embryonic stem cells. Cell Stem Cell 10, 440–454 (2012).
45. Jacobs, K. et al. Low-grade chromosomal mosaicism in human somatic and embryonic stem cell populations. Nat. Commun. 5,
4227 (2014).
46. Ostblom, J., Nazareth, E. J. P., Tewary, M. & Zandstra, P. W. Context-explorer: Analysis of spatially organized protein expression
in high-throughput screens. PLoS Comput. Biol. 15, 1–13 (2019).
Acknowledgements
This work was supported by the Methusalem grant of Vrije Universiteit Brussel granted to K.S. D.D. was a
PhD fellow of Research Foundation—Flanders (Fonds voor Wetenschappelijk Onderzoek, FWO—Vlaanderen).
A.K. is a PhD fellow of FWO (Strategisch Basisonderzoek). The authors would like to thank Geoffrey Duque
for the technical assistance with LSM800 confocal microscope and the NXTGNT team for performing the
mRNA-sequencing.
Author contributions
D.D. co-designed the project, performed most experiments and co-wrote the manuscript, M.T. helped with
micropatterned differentiation experiments and protein expression analysis, A.K. helped with the hepatic dif-
ferentiation experiments, L.T. and F.V.N. performed the RNA sequencing and most bio-informatic analyses,
L.P. assisted with transfection experiments, J.O. helped with micropatterned differentiation analysis, E.C.D.D.
performed part of bio-informatic analyses, C.M. and S.F. helped with protein expression analysis, C.S. and
P.W.Z. provided important intellectual contributions, K.S. supervised the project and co-wrote the manuscript,
M.G. supervised the project, co-designed and co-wrote the manuscript. All authors revised and approved the
manuscript.
Competing interests
The authors declare no competing interests.
Additional information
Supplementary Information The online version contains supplementary material available at https://doi.
org/10.1038/s41598-021-85447-4.
Correspondence and requests for materials should be addressed to K.S.
Reprints and permissions information is available at www.nature.com/reprints.
Publisher’s note Springer Nature remains neutral with regard to jurisdictional claims in published maps and
institutional affiliations.
Scientific Reports | (2021) 11:6137 | https://doi.org/10.1038/s41598-021-85447-4 13
Vol.:(0123456789)You can also read