Computational Characterization of the Dish-In-A -Dish, A High Yield Culture Platform for Endothelial Shear Stress Studies on the Orbital Shaker - MDPI
←
→
Page content transcription
If your browser does not render page correctly, please read the page content below
micromachines

Article
Computational Characterization of the Dish-In-A
-Dish, A High Yield Culture Platform for Endothelial
Shear Stress Studies on the Orbital Shaker
Rob Driessen 1,2,† , Feihu Zhao 1,2,3,† , Sandra Hofmann 1,2 , Carlijn Bouten 1,2 ,
Cecilia Sahlgren 1,2,4,5 and Oscar Stassen 1,4,5, *
 1   Department of Biomedical Engineering, Eindhoven University of Technology, 5600 MB Eindhoven,
     The Netherlands; r.c.h.driessen@tue.nl (R.D.); feihu.zhao@swansea.ac.uk (F.Z.); s.hofmann@tue.nl (S.H.);
     c.v.c.bouten@tue.nl (C.B.); c.m.sahlgren@tue.nl (C.S.)
 2   Institute for Complex Molecular Systems, Eindhoven University of Technology, 5600 MB Eindhoven,
     The Netherlands
 3   Zienkiewicz Centre for Computational Engineering, College of Engineering, Swansea University,
     Swansea SA1 8EN, UK
 4   Faculty of Science and Engineering, Biosciences, Åbo Akademi University, 20500 Turku, Finland
 5   Turku Bioscience Centre, Åbo Akademi University and University of Turku, 20520 Turku, Finland
 *   Correspondence: oscar.stassen@abo.fi or o.m.j.a.stassen@tue.nl
 †   Contributed equally.

 Received: 30 April 2020; Accepted: 27 May 2020; Published: 29 May 2020

 Abstract: Endothelial cells sense and respond to shear stress. Different in vitro model systems have
 been used to study the cellular responses to shear stress, but these platforms do not allow studies on
 high numbers of cells under uniform and controllable shear stress. The annular dish, or dish-in-a-dish
 (DiaD), on the orbital shaker has been proposed as an accessible system to overcome these challenges.
 However, the influence of the DiaD design and the experimental parameters on the shear stress
 patterns is not known. In this study, we characterize different designs and experimental parameters
 (orbit size, speed and fluid height) using computational fluid dynamics. We optimize the DiaD for an
 atheroprotective flow, combining high shear stress levels with a low oscillatory shear index (OSI).
 We find that orbit size determines the DiaD design and parameters. The shear stress levels increase
 with increasing rotational speed and fluid height. Based on our optimization, we experimentally
 compare the 134/56 DiaD with regular dishes for cellular alignment and KLF2, eNOS, CDH2 and MCP1
 expression. The calculated OSI has a strong impact on alignment and gene expression, emphasizing
 the importance of characterizing shear profiles in orbital setups.

 Keywords: shear stress; computational fluid dynamics; endothelial cells; orbital shaker; flow

1. Introduction
     Endothelial cells line the vasculature and are sensitive to fluid shear stress induced by the blood
flow. The cells sense shear stress and convert mechanical stress to biological signals to control vascular
tone and morphology [1,2]. The shear stress acting on the endothelial cells is directly linked to
vascular homeostasis and disease [3,4]. Oscillatory and low laminar ( 1 Pa) are considered atheroprotective [7,10]. Cells that are exposed to
an atheroprotective flow align in the direction of the flow, form a tight vascular barrier and express

Micromachines 2020, 11, 552; doi:10.3390/mi11060552                        www.mdpi.com/journal/micromachines
Micromachines 2020, 11, 552                                                                           2 of 14

anti-inflammatory genes [11]. Typical anti-inflammatory markers are Krüppel-like Factor 2 (KLF2) and
endothelial nitric oxide synthase (eNOS), both classical shear stress response markers found in healthy
endothelium [12–14].
      Different culture systems are used to study endothelial cell behavior under shear stress. The most
commonly used system is the parallel plate setup [15–17]. In this system, medium is pumped through
a rectangular or circular channel into which cells are seeded. The shear stress acting on the cells is
determined by the flow speed and channel dimensions. However, the number of cells that can be
exposed to shear stress simultaneously is limited in this set-up. Another frequently used approach
is the cone and plate apparatus, where cells are seeded in a medium-filled dish and a cone is placed
in the medium [15]. By rotating the cone, a fluid flow is created exerting a shear stress on the cells.
The shear stress can be calculated from the viscosity of the medium, the cone angle and the rotational
speed of the cone. In this system only a single dish of cells can be exposed to shear stress at once,
again limiting the number of cells at study. As an alternative for molecular studies that require high
number of cells (e.g., proteomics or chromatin conformation capture), an orbital shaker can be used [15].
By placing a culture dish or plate on a shaker, a frictional drag force is created on the cells. As a result,
a non-uniform shear stress field is created that depends on the angular velocity and the radius of the
shaker. Although this approach increases the experimental throughput significantly, the distribution of
the shear stress is inhomogeneous and includes both atheroprone and atheroprotective regions [18,19].
These conflicting mechanical cues lead to conflicting biological responses. Consequently, variance is
introduced in the system and false conclusions may be drawn from experiments using an orbital shaker.
      To overcome this issue, while retaining high throughput, an annular dish culture setup has been
proposed [20–22]. This is an easy-to-implement platform in which a small standard culture dish is
mounted into a larger standard dish. In this dish-in-a-dish (DiaD) setup, fluid travels around in the
donut-like shaped culture vessel, promoting unidirectional fluid flow at all time. It is important to
know the shear stress that the cells are exposed to since this governs atheroprone and -protective
phenotypes. A commonly used approach to estimate the maximum shear stress values is the extended
solution of Stokes’ second problem [23,24]. The resulting shear stress values are based on the orbit
size of the orbital shaker and the angular velocity. This analytical approach assumes unperturbed
fluid in the far field, neglecting the side walls and initial fluid height [19,25,26]. Computational fluid
dynamics (CFD) has been shown to be a more precise method to characterize flow and shear stress
patterns in dishes on the orbital shaker [18,27–29]. Simulations by these groups have shown that
the shear stress distribution is non-uniform, confirming that the analytical approximation cannot
be used for the characterization of shear stress profiles on the orbital shaker. Since the previously
available characterization of the DiaD shear distribution was based on the analytical approach [20,21],
a more accurate characterization of the shear stress distribution in the DiaD is needed. In this work,
we characterize the influence of orbit size, orbital speed and fluid height on the shear stress distribution
across the DiaD using CFD. Based on these parameters, different dishes are recommended for different
orbit sizes. These can be optimized for either maximal shear, homogeneity of shear or cell numbers.
Finally, the endothelial shear stress response in the DiaD was validated by cell orientation and gene
expression analysis.

2. Materials and Methods

2.1. Computational Approach
     A computational fluid dynamics (CFD) model was developed in ANSYS-CFX (ANSYS Inc.,
Canonsburg, PA, USA) to model the shear stress in (annular) dishes on the orbital shaker. The influence
of orbit diameter, rotational speed and fluid levels was evaluated. Commercially available shakers
typically have an orbital diameter (dob ) of 10, 19 or 25 mm. The orbital speeds were tested at 100,
125, 150 and 200 rpm and the influence of initial fluid levels was examined for 2, 3 and 4 mm of fluid.
Unless otherwise stated, an orbital speed of 200 rpm and a medium height of 3 mm was used.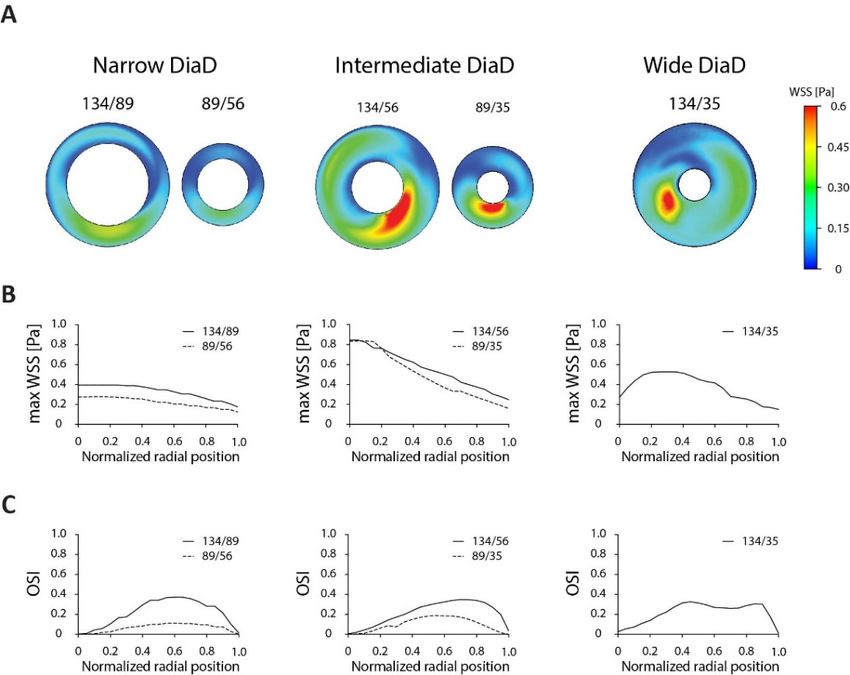
Micromachines 2020, 11, 552 3 of 14
The medium was modelled as an incompressible and Newtonian fluid with a dynamic viscosity
(µ) of 0.7 mPa·s at 37 ◦ C [30]. To determine whether the flow was laminar or turbulent, we first
estimated the Reynolds number (Re) using
ρ ω dob 2
Re = (1)
µ
where ρ is the medium density (ρ = 1000 kg/m3 ) and ω is the orbital speed (ω = 20.94 rad/s for
200 rpm) [31]. Afterwards, the exact Re number was calculated from the CFD pre-computation.
Based on this first approximation is the 10-mm orbit in the transition zone between laminar and
turbulent flow with a Re of approximately 3000. The other orbit diameters resulted in an approximate
Re of 11000 and 18500 (19 and 25 mm, respectively), indicating turbulent flow. Therefore, we first
simulated both laminar and turbulent flow. For the turbulent flow, a κ-epsilon turbulence model was
incorporated into the Navier–Stokes equation [29]. Both methods yielded high Re numbers in the
turbulence range. Therefore, the turbulence model was used in all simulations.
The pressure drop across the medium–air interface was expressed by the radius and the surface
tension was calculated as !
1 1
pM − pA = γ + (2)
rM rA
where pM and pA are the pressures measured by the surface curvature in the normal direction to the
interface in liquid (medium) and gas (air) phases, respectively; γ is the surface tension of the medium
(γ = 0.072 N/m) [29] rM and rA represent the radius measured by the surface curvature in the normal
direction to the interface in liquid (medium) and gas (air) phases, respectively.
The volume of fluid (VOF) technique, which has been introduced in previous studies, was used
for tracking the medium–air interface during shaking [27,28,32]. In each computational finite volume
at the interface, the continuity and momentum equations were solved based on the modified definition
of the fluid properties P [28,29]:
P = αM ·PM + αA ·PA
(3)
αM + αA = 1
where PM and PA are the properties of the medium and air (i.e., density and dynamic viscosity), αM and
αA are the volume fraction of medium and air, respectively.
The dish wall was rigid with a no-slip boundary condition. The wall shear stress τ on the substrate
of the dish was calculated by
∂u
τ = µ· (4)
∂z z=0
where u is the fluid velocity parallel to the substrate and z is the distance to the substrate in coordinate
O’ (Figure 1).
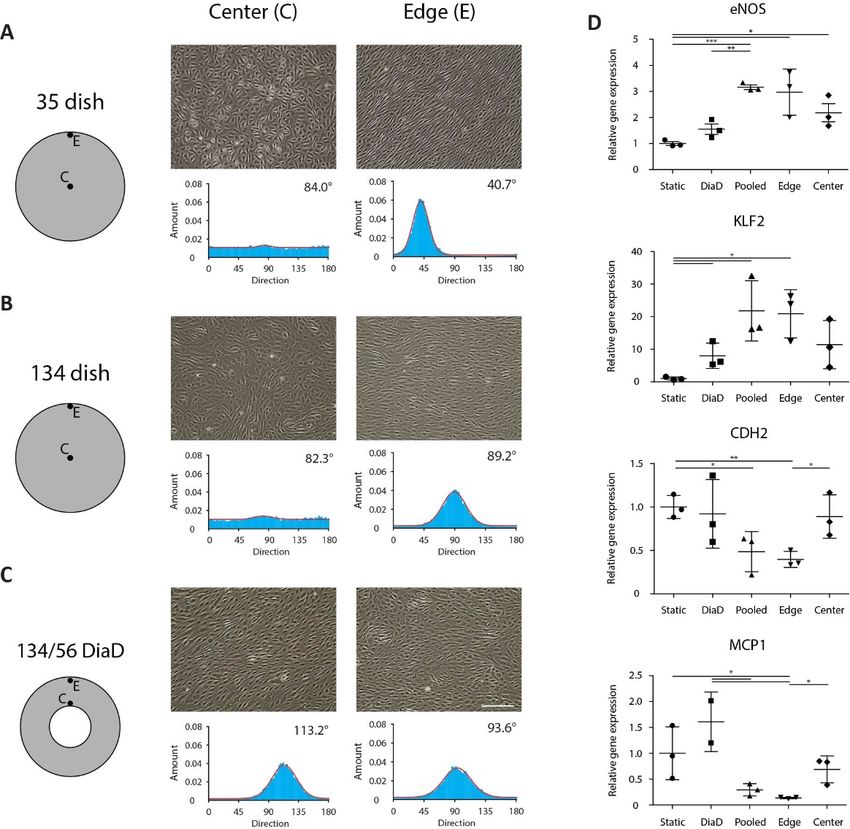
The fluid domain was meshed by hexahedral elements, with D the outer diameter and d the
inner diameter of the annular dish (Figure 1A). After mesh sensitivity analysis, it was found that the
mesh element size of 1500 µm was sufficient for eliminating the mesh-dependent effect (Supplemental
Information 1). When modeling dishes without an inner dish d was set to 0. As dish dimensions
standard culture dishes were used. In contrast to what the product name suggests (35, 60, 100 or
150 mm), the actual diameters of these dishes (35, 56, 89 and 134 mm, respectively) were used for the
mesh. Transient analysis was used in the simulation with a time step of 0.01 s for a whole-time length
of 4.0 s. Finally, the CFD model was solved by a finite volume method (FVM) using ANSYS CFX under
the convergence criteria of the root mean square residual of the mass and momentum < 10−4 .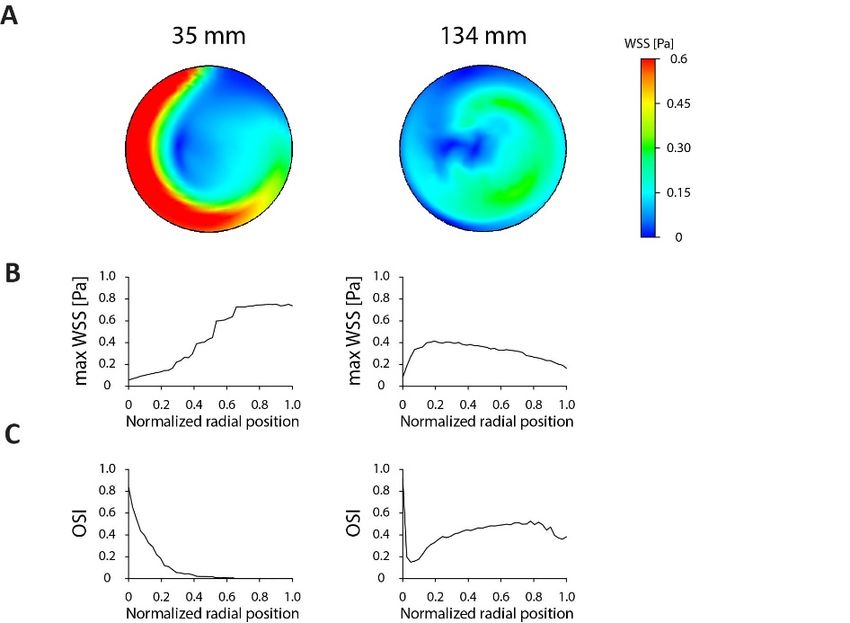
Micromachines 2020, 11, 552 4 of 14
Micromachines 2020, 11, x 4 of 14
Figure
Figure 1.1.Mesh
Mesh design
design and vector
and vector analysis.
analysis. (A). Three-dimensional
(A). Three-dimensional representation
representation of the
of the computational
computational
mesh used to meshmodelusedthe todifferent
model the different geometries,
geometries, varying thevarying
inner (d)theand
innerouter
(d) and
(D) outer (D)
diameter.
diameter. The system
The coordinate coordinate system
denotes denotes the
the reference framereference frame (B)
of the mesh. of Schematic
the mesh.representation
(B) Schematic of
representation
the calculation of calculation
of the low of the
oscillatory shearlow oscillatory
index (OSI) and shear
τmaxindex
. The (OSI) andextracted
τmax was τmax. Thefrom
τmax each
was
extracted
collectionfrom
witheach collection
similar with
a similar similar
radial a similar
position. Allradial position.
vectors Allrotated
are first vectorstoare
α=0first
torotated
obtain to α=0
a time
to obtainto
average a time average
calculate to calculate
the OSI the OSI for
for the variation the variation
in shear in shear direction.
direction.
For each
The fluiddish,
domain the radial shear stress
was meshed distribution
by hexahedral was normalized
elements, with D the between
outer d and D. To
diameter andanalyze
d the
the shear
inner stressofprofiles
diameter over one
the annular dishperiod
(Figurein1A). the After
annular meshdish designs, analysis,
sensitivity all elements were
it was grouped
found in
that the
n groups based on their radial position (r ). For the regular culture
mesh element size of 1500 µm was nsufficient for eliminating the mesh-dependent effect dishes, 20 different time points
in one period were
(supplemental analyzed
information 1).since
When the number dishes
modeling of elements at danclose
without innertodish
zerodiswas
limited.
set toFrom
0. Asthese
dish
temporal data,
dimensions the maximum
standard culture (τ max,r )were
dishes shearused.
stressIn
was determined
contrast to whatforthe
each radial position
product (Figure (35,
name suggests 1B).
Next, the oscillatory shear index (OSI), a measurement method for the degree of
60, 100 or 150 mm), the actual diameters of these dishes (35, 56, 89 and 134 mm, respectively) were variation in the shear
direction,
used for thewas identified
mesh. for analysis
Transient each radialwasposition
used inusing:
the simulation with a time step of 0.01 s for a whole-
time length of 4.0 s. Finally, the CFD model was Rsolved by a finite volume method (FVM) using
T
ANSYS CFX under the convergence criteria of the WSSdt
0 root mean square residual of the mass and
momentum < 10−4. OSI = 1 − R T (5)
|WSS|dt
0 was normalized between d and D. To analyze
For each dish, the radial shear stress distribution
the shear
where T isstress profilesperiod.
one orbital over one period
The maininshear
the annular
direction dish
wasdesigns,
definedallbyelements were of
the direction grouped
the sum in of
n
groups based on their radial position (r n). For the regular culture dishes, 20 different time points in
all shear stress vectors at each radial position. For this, all vectors were first rotated based on their
one period
radial were analyzed since the number of elements at d close to zero is limited. From these
coordinates.
temporal data, the maximum (τmax,r) shear stress was determined for each radial position (Figure 1B).
Next, the oscillatory
2.2. Experimental shear index (OSI), a measurement method for the degree of variation in the shear
Validation
direction, was identified for each radial position using:
2.2.1. DiaD Fabrication
To make the dish-in-a-dish system, a=small 1 − culture dish was mounted in a larger dish using (5)
polydimethylsiloxane (PDMS, Sylgard 184, Dow Corning, | |Midland, MI, USA) with standard culture
dishes 60 and 150 mm in diameter. The rim of the inner dish was dipped in PDMS pre-polymer
where T isratio
(10:1 w/w one of
orbital
PDMS period. Theagent)
to curing main shear direction
and placed was
in the defined
center bylarge
of the the direction of the
culture dish. A sum
smallofhole
all
shear stress vectors at each radial position. For this, all vectors were first rotated based on
was drilled in the inner dish to allow expanding air to escape during curing at higher temperature. their radial
coordinates.
The PDMS was cured overnight at 65 ◦ C. Afterwards, the annular dish was stored until further use.
2.2. Experimental Validation
2.2.1. DiaD Fabrication
To make the dish-in-a-dish system, a small culture dish was mounted in a larger dish using
polydimethylsiloxane (PDMS, Sylgard 184, Dow Corning, Midland, MI, USA) with standard cultureMicromachines 2020, 11, 552 5 of 14
2.2.2. Cell Culture
Pooled human umbilical vein endothelial cells (HUVEC, Lonza, Basel, Switzerland) were cultured
in endothelial growth medium, supplemented with growth factors (EGM-2 medium, Promocell,
Heidelberg, Germany). The cells were subcultured upon 80% confluence and the medium was changed
every 2–3 days. The cells were used until passage 5. All cell cultures and experiments were performed
at 37 ◦ C and 5% CO2 in a humidified incubator.
2.2.3. Shear Stress Experiments
The annular dish was sterilized with 70% ethanol for 30 min under UV light. Afterwards, the
dish was rinsed twice with phosphate-buffered saline (PBS, Sigma Aldrich, St. Louis, MO, USA).
After sterilization, the annular dish was coated with collagen IV in PBS (0.85 µg/cm2 ) for 1 h at 37 ◦ C and
afterwards washed with PBS once. HUVEC were seeded at 25,000 cells/cm2 density in the annular dish
and grown to a monolayer. Upon confluence, the medium was replaced with 35 mL (corresponding
with 3 mm) medium and the annular dishes were fixed on a horizontal orbital shaker (Yellowline OS
10 Basic, IKA GmbH, Staufen, Germany) in the incubator (Figure S1). Shear stress was generated by
shaking the annular dish at 200 rpm for 24 h. The static controls were cultured in the same incubator.
After 24 h, the mechanically loaded cells and their respective static controls were imaged using an
EVOS system (Thermo-Fisher, Waltham, MA, USA). The orientation of the cells was analyzed using the
ImageJ directionality tool. After imaging, the cells were washed twice with cold PBS and removed from
the dish by scraping. The cells were collected in PBS and spun down at 150 g for 5 min. The pellet was
lysed in RLT buffer (RNeasy kit, Qiagen, Hilden, Germany) and stored at −80 ◦ C for gene expression
analysis. All experiments were performed in three experimental replicates.
2.2.4. Gene Expression Analysis
RNA was isolated using the Qiagen RNeasy kit according to the manufacturer’s instructions and
as previously described [33]. For each sample 140 ng of RNA was synthesized to cDNA by using the
SuperScript VILO cDNA synthesis kit (Invitrogen). Reference gene stability was tested for six different
genes, analyzed by GeNorm [34], and glyceraldehyde 3-phosphate dehydrogenase (GAPDH) was
selected as the most stable reference gene. The PCR protocol consisted of a 3 min 95 ◦ C incubation,
followed by 40 cycles of 20 s at 95 ◦ C, 20 s at 60 ◦ C and 30 s at 72 ◦ C. Data were analyzed using the
∆∆Ct method. The primer sequences can be found in Table S1. The GAPDH primer was purchased
from PrimerDesign (Southampton, UK).
2.2.5. Statistical Analysis
All experiments were performed in triplicate as three independent experiments. Data are presented
as the mean +/- standard deviation. Statistical significance between the static and flow conditions was
evaluated with Student’s t-test using GraphPad Prism 6 software, p < 0.05 was considered significant.
3. Results
The flow characteristics that define atheroprone and atheroprotective regimes are complex, but it
has been established that low τmax and OSI are atheroprone and correlate with atherogenesis [19,35].
We aimed for dishes with a high τmax and a low OSI, while maximizing the cell culture area in the
dish. For this optimization process, we first investigated whether the DiaD design resulted in an
improved flow pattern over standard dishes, and how τmax and OSI were affected by the different
geometries. Next, we tested the different orbits available from commercial suppliers, as these will
be fixed depending on the equipment available in the research environment. We further optimized,
for the influence of the orbital speed and volume, parameters that effected the shear stress patterns.Micromachines 2020, 11, x 6 of 14
geometries. Next, we tested the different orbits available from commercial suppliers, as these will be
fixed2020,
Micromachines depending
11, 552 on the equipment available in the research environment. We further optimized,
6 of 14 for
the influence of the orbital speed and volume, parameters that effected the shear stress patterns.
3.1. Optimization of DishofDesign
3.1. Optimization Dish Design
First, we characterized
First, the conventional
we characterized culture
the conventional dishes.
culture The The
dishes. shear stress
shear profile
stress in ainstandard
profile a standard six-
six-wellwell
culture dish and in a 15-cm culture dish, further referred to by their actual
culture dish and in a 15-cm culture dish, further referred to by their actual dimensions dimensions of of
35 35 and
and 134 134mm,
mm, were
weremodeled
modeled onon
ananorbital
orbitalshaker
shaker(10-mm
(10-mmorbit)
orbit)atat200
200rpm.
rpm.TheTheshear
shearstress
stress levels
levels in the
in the center of both dishes were close to zero and displayed a high OSI (Figure 2),
center of both dishes were close to zero and displayed a high OSI (Figure 2), corresponding corresponding to to
atheroprone flow patterns. At the edge of the 35-mm dish, the shear profile obtained
atheroprone flow patterns. At the edge of the 35-mm dish, the shear profile obtained an an atheroprotective
characteristic with a maximum
atheroprotective shear stress
characteristic with of 0.75 Pa andshear
a maximum OSI values
stress ofclose
0.75toPazero.
andThe OSIlarger
values134-mm
close to zero.
dish, onThe
thelarger
other hand, displayed lower shear levels throughout the dish with a τ of
134-mm dish, on the other hand, displayed lower shear levels throughout the dish
max 0.41 Pa. The OSI with a
levels initially dropped to 0.14 but then increased again to stabilize around 0.45–0.50.
τmax of 0.41 Pa. The OSI levels initially dropped to 0.14 but then increased again to stabilize aroundThese data
showed0.45–0.50.
that upscaling
These from a 35-mmthat
data showed dishupscaling
to a larger 134-mm
from dishdish
a 35-mm affects
to ashear
largerstress
134-mmand results in a shear
dish affects
relativestress
increase in the area with an atheroprone flow pattern.
and results in a relative increase in the area with an atheroprone flow pattern.
Figure 2.Figure 2. Comparison
Comparison of shear
of shear stress stress distribution
distribution in standardinculture
standard culture
dishes. dishes.
(A) Heat map(A)ofHeat map of the
the shear
shear stressindistribution
stress distribution in a(35
a six well plate sixmm)
well and
platea (35
15-cmmm) and
dish (134a 15-cm
mm). dish (134 mm).
The dishes The dishes
are scaled are scaled
to equal
size forto equal
shear sizecomparison
stress for shear stress comparison
between between
dishes and dishes shear
the colored and the colored
stress scaleshear
rangesstress
fromscale
0 to ranges
0.6 Pa tofrom 0 toall
display 0.6shear
Pa tostress
display all shear stress
distributions. For alldistributions. For allfluid
situations, a 3-mm situations, a 3-mm fluid
height, 200-rpm height, 200-
rotational
speed andrpm rotational
a 10-mm speed
orbit and a (B)
was used. 10-mm orbit was
Maximum shearused. (B)levels
stress Maximum shear stress
as a function of the levels
radial as a function of
position
the radial
in the dish. position in
(C) Oscillatory the dish.
shear index(C) Oscillatory
(OSI) shearofindex
as a function (OSI) position
the radial as a function
in theofdish.
the radial position in
the dish.
We next characterized the different annular designs of the DiaD that can be obtained by adapting
conventional Weculture dishes. The resulting
next characterized the differentannular dishes
annular wereofdivided
designs the DiaD into
thatthree
can begroups
obtainedbasedbyon adapting
the width of the culture
conventional channel
culture vs. The
dishes. the dish size: annular
resulting narrow, dishes
intermediate and wide
were divided designs
into (Figure based
three groups 3). on
We modeled the shear
the width of thestress in channel
culture these designs
vs. theondish
a 10-mm orbit at intermediate
size: narrow, 200 rpm withand an initial fluid height
wide designs (Figure 3).
of 3 mm.We In the narrow
modeled and intermediate
the shear stress in thesedish designs
designs on a the
10-mm highest
orbitshear
at 200stress values
rpm with anwere
initialfound
fluid height
at the inner dish.InIn
of 3 mm. thethe narrow
narrow anddish, the largestdish
intermediate was found
τmaxdesigns in the larger
the highest dish, 0.40
shear stress values Pa were
for thefound at
134/89 (outer/inner
the inner dish.diameter) and 0.28
In the narrow Pa for
dish, thethe 89/56τdish.
largest max was In found
these dishes, the τmax
in the larger slowly
dish, 0.40 Padecreased
for the 134/89
towards the outer edge.
(outer/inner This coincided
diameter) and 0.28with a peak
Pa for the in the OSI
89/56 dish.halfway
In these thedishes,
culturethearea. The
τmax heightdecreased
slowly of
the OSItowards
peak is dependent on the size of the annular dish, the larger dish reached a higher
the outer edge. This coincided with a peak in the OSI halfway the culture area. The height OSI (0.37 for
the 134/89 dish
of the and
OSI 0.19isfor
peak the 89/56 dish).
dependent on theThe sizeintermediate
of the annular sized dishes
dish, starteddish
the larger at a τreached
max of 0.85 Pa, OSI
a higher
but this(0.37
value
fordecreased
the 134/89when moving
dish and 0.19 to
for0.15–0.25
the 89/56Pa at the
dish). Theouter edge. Thesized
intermediate OSI behavior is similar
dishes started at a τmax of
to the narrow
0.85 Pa,dishes,
but thisthe bigger
value dish displayed
decreased when moving a higher maximumPaOSI
to 0.15–0.25 (0.35
at the overedge.
outer 0.18 respectively).
The OSI behavior is
The wide dish design displayed a peak τmax (0.53 Pa) in the center of the culture area with an OSI of
0.33, like the other designs with a 134-mm outer dish. For further analysis, we tested the dishes withMicromachines 2020, 11, x 7 of 14
similar to the
Micromachines 2020,narrow
11, 552 dishes, the bigger dish displayed a higher maximum OSI (0.35 over7 0.18 of 14
respectively). The wide dish design displayed a peak τmax (0.53 Pa) in the center of the culture area
with an OSI of 0.33, like the other designs with a 134-mm outer dish. For further analysis, we tested
a 134-mm
the dishes outer
with dish, since these
a 134-mm outer offer
dish,the largest
since theseculture arealargest
offer the and highest
culturecell numbers.
area Since cell
and highest the
intermediate sized annular dish could obtain
numbers. Since the intermediate sized annular dishmax large τ values and the narrow dishes resulted in
could obtain large τmax values and the narrow low
variations
dishes in τmax
resulted in,low
these two designs
variations were
in τmax further
, these twocharacterized.
designs were further characterized.
Figure 3. The
The effect
effect of annular dish design on the distribution
distribution of wall
wall shear
shear stress.
stress. (A) Graphical
representation of the shear stress distribution of different
different annular
annular dish
dish designs.
designs. The dish size is scaled
to actual size. Dish
Dish dimensions
dimensions are
are written as outer/inner dish diameter in millimeters. The graphical
shear stress distribution scales to maximal 0.6 Pa to display the distributions in all designs.designs. For the
calculations, aa3-mm
3-mmfluid
fluid height,
height, 200-rpm
200-rpm rotational
rotational speedspeed and a orbit
and a 10-mm 10-mmwasorbit
used.was used. (B)
(B) Maximum
Maximum
shear stressshear
levelsstress levels asofathe
as a function function
radial of the radial
position in theposition
annularindish.
the (C)
annular
OSI asdish. (C) OSIofasthe
a function a
radial position
function of the in the annular
radial positiondish.
in the annular dish.
3.2. Optimization
3.2. Optimization of
of Experimental
Experimental Parameters
Parameters
The most
The most commonly
commonly used used orbital
orbital shakers
shakers havehave orbit
orbit sizes
sizes of of 10,
10, 19
19 or
or 25
25 mm,
mm, respectively.
respectively.
Therefore, we
Therefore, wecharacterized
characterizedthethe shear stress
shear distribution
stress in the
distribution inannular dish on
the annular these
dish onorbits.
these In general,
orbits. In
the τ increased with increasing orbit size (Figure 4A). The variation
max the τmax increased with increasing orbit size (Figure 4A). The variation
general, in τ max in τmax is lowestsmaller
is lowest on the on the
10-mm
smaller orbit
10-mm size. Onsize.
orbit the 19-mm orbit, the
On the 19-mm variation
orbit, in τmax in
the variation is lowest in the 134/89
τmax is lowest dish. The
in the 134/89 OSI
dish. Theis
OSI is also lower in this dish on the 19-mm orbit (Figure 4B). The 134/56 dish on a 19-mm orbita
also lower in this dish on the 19-mm orbit (Figure 4B). The 134/56 dish on a 19-mm orbit resulted in
high variation
resulted in τmax
in a high throughout
variation in τmaxthe dish, withthe
throughout low shear
dish, stress
with lowvalues
shear close
stresstovalues
zero atclose
the inner
to zerodish
at
and up to 2 Pa in the center of the culture area. A similar distribution in τ max was
the inner dish and up to 2 Pa in the center of the culture area. A similar distribution in τmax was foundfound for both dish
designs
for both on thedesigns
dish 25-mm on orbit.
the Because of theBecause
25-mm orbit. high variation in τmax
of the high , the dishes
variation on, the
in τmax the25-mm
dishes orbit
on thewere
25-
not further characterized. The 134/89 design on the 19-mm orbit displayed
mm orbit were not further characterized. The 134/89 design on the 19-mm orbit displayed lower lower variation in τ max and
comparable
variation in τvalues with the results on the 10-mm orbital shaker. Taken together, the 134/56 dish is the
max and comparable values with the results on the 10-mm orbital shaker. Taken together,
optimal dish on the
the 134/56 dish is the 10-mm
optimalorbit, based
dish on theon 10-mm
τmax levels.
orbit,On the 19-mm
based on τmax orbital
levels. shaker,
On the the 134/89
19-mm dish
orbital
is preferred
shaker, over the
the 134/89 134/56
dish dish, based
is preferred overon thethe distribution
τmax dish,
134/56 based on and
theOSI.
τmaxFor that reason,
distribution andthese
OSI. two
For
dishes were further characterized on a 10-mm and 19-mm orbit, respectively.
that reason, these two dishes were further characterized on a 10-mm and 19-mm orbit, respectively.
An important parameter for dishes on the orbital shaker is the orbital speed. In this work, we
tested the effect of orbital speed on the shear stress distributions by modeling the orbital speed from0.85 and 1.29 Pa for the 134/56 and 134/89 dish respectively. When rotated at 100 rpm, the OSI was
lowest, coinciding with the lowest τmax. Interestingly, the OSI peaked at 125 rpm for both dishes
(Figure 5B). The OSI distribution for the 134/56 dish was similar for the 150- and 200-rpm situation.
The OSI values of the 134/89 dish remained below 0.25, except for the 125-rpm situation. In terms of
variations in shear stress direction the 134/89 on 19-mm orbit outperforms the 134/56 dish on 10-mm
orbit. Since
Micromachines 2020,the OSI was not greatly affected by the increase from 150 to 200 rpm, 200 rpm is
11, 552 8 of 14
considered optimal as it can reach the highest shear levels.
Micromachines 2020, 11, x 8 of 14
100 to 200 rpm (Figure 5A). For both dishes, the τmax increased with increasing orbital speed, up to
0.85 and 1.29 Pa for the 134/56 and 134/89 dish respectively. When rotated at 100 rpm, the OSI was
lowest, coinciding with the lowest τmax. Interestingly, the OSI peaked at 125 rpm for both dishes
(Figure 5B). The OSI distribution for the 134/56 dish was similar for the 150- and 200-rpm situation.
The OSI values of the 134/89 dish remained below 0.25, except for the 125-rpm situation. In terms of
variations in shear stress direction the 134/89 on 19-mm orbit outperforms the 134/56 dish on 10-mm
orbit. Since the OSI was not greatly affected by the increase from 150 to 200 rpm, 200 rpm is
considered optimal as it can reach the highest shear levels.
Figure
Figure 4. 4.The
Theeffect
effect of
of orbit
orbit size
sizeon
onshear stress
shear distribution
stress in the
distribution in134/56 and 134/89
the 134/56 and design.
134/89 (A)
design.
(A) Maximum
Maximumshear stress
shear levellevel
stress at each
atradial
each position for the 134/56
radial position for and
the 134/89
134/56annular dish onannular
and 134/89 an orbitaldish
shaker with an orbit diameter of 10, 19 or 25 mm. For the calculations, a 3-mm fluid height and 200-
on an orbital shaker with an orbit diameter of 10, 19 or 25 mm. For the calculations, a 3-mm fluid height
rpm rotational speed was used. (B) OSI as a function of the radial position. Heat maps of the shear
and 200-rpm rotational speed was used. (B) OSI as a function of the radial position. Heat maps of the
stress distributions can be found in Figure S2.
shear stress distributions can be found in Figure S2.
An important parameter for dishes on the orbital shaker is the orbital speed. In this work,
we tested the effect of orbital speed on the shear stress distributions by modeling the orbital speed
from 100 to 200 rpm (Figure 5A). For both dishes, the τmax increased with increasing orbital speed,
up to 0.85 and 1.29 Pa for the 134/56 and 134/89 dish respectively. When rotated at 100 rpm, the OSI
was lowest, coinciding with the lowest τmax . Interestingly, the OSI peaked at 125 rpm for both dishes
(Figure 5B). The OSI distribution for the 134/56 dish was similar for the 150- and 200-rpm situation.
The OSI Figure
values4.ofThe
theeffect of orbit size on shear stress distribution in the 134/56 and 134/89 design. (A)
134/89 dish remained below 0.25, except for the 125-rpm situation. In terms of
Maximum shear stress level at each radial position for the 134/56 and 134/89 annular dish on an orbital
variations in shear stress direction the 134/89 on 19-mm orbit outperforms the 134/56 dish on 10-mm
shaker with an orbit diameter of 10, 19 or 25 mm. For the calculations, a 3-mm fluid height and 200-
orbit. Since the OSI was not greatly affected by the increase from 150 to 200 rpm, 200 rpm is considered
rpm rotational speed was used. (B) OSI as a function of the radial position. Heat maps of the shear
optimal as
stresscan
it reach the
distributions canhighest
be foundshear levels.
in Figure S2.
Figure 5. The influence of rotational speed on shear stress distribution. (A) Maximum shear stress
level at each radial position for different orbital velocities in the 134/56 (10-mm orbit) and 134/89 (19-
mm orbit) annular dish on an orbital shaker. For the calculations, a 3-mm fluid height was used. (B)
OSI as a function of the radial position. Heat maps of the shear stress distributions can be found in
Figure S3.
Figure
Figure 5. The
5. The influence
influence of rotational
of rotational speed
speed on on shear
shear stress
stress distribution.
distribution. (A)
(A) Maximumshear
Maximum shearstress
stresslevel
level at each radial position for different orbital velocities in the 134/56 (10-mm orbit) and
at each radial position for different orbital velocities in the 134/56 (10-mm orbit) and 134/89 (19-mm134/89 (19-
mm orbit) annular dish on an orbital shaker. For the calculations, a 3-mm fluid height was used. (B)
orbit) annular dish on an orbital shaker. For the calculations, a 3-mm fluid height was used. (B) OSI as
OSI as a function of the radial position. Heat maps of the shear stress distributions can be found in
a function of the radial position. Heat maps of the shear stress distributions can be found in Figure S3.
Figure S3.Micromachines 2020, 11, 552 9 of 14
Micromachines 2020, 11, x 9 of 14
Next to orbit size and orbital speed, the shear stress distribution is dependent on the amount of
fluid in the dish. Here, we characterized the role of 2-, 3- and 4-mm initial fluid heights in both dishes
at an orbital
orbital speed
speedof of200
200rpm.
rpm.InIn general,
general, more
morefluid ledled
fluid to atohigher
a higherτmaxτ(Figure 6). In6).
max (Figure theIn134/56 dish,
the 134/56
the 2-mm
dish, situation
the 2-mm led to
situation leda to
low τmax τof
a low max0.34 Pa with
of 0.34 littlelittle
Pa with variation across
variation thethe
across annular
annulardish. Both
dish. 3-
Both
and
3- 4-mm
and 4-mm heights
heights displayed
displayedhigher
highershear
shearstress
stressvalues
valuesof of 0.85
0.85 and
and 1.07 Pa, respectively.
respectively. The
Theττmax
max
distribution and OSI levels across the dish were similar for the 3- and 4-mm situation, whereas 2-mm
fluid increased the OSI. The effect of fluid height was similar for the 134/89 dish on the the 19-mm
19-mm orbit.
orbit.
There was little difference
difference between
between 3- 3- and
and 4-mm
4-mm of fluid, but the 2-mm case led to a shifted variation
max and
in τmax andincreased
increasedOSI OSI values
values upup toto 0.69.
0.69. The
The increase
increase from
from 3- 3- to
to 4-mm
4-mm of fluid lowered the OSI
distribution from a maximum of 0.25 to 0.10. Taken together, the 3-mm and 4-mm fluid heights are
comparable for
comparable for aa 134/56
134/56dish,
dish,whereas
whereasthe the4-mm
4-mmfluid
fluid height
height is is
thethe best
best candidate
candidate forfor 134/89,
134/89, based
based on
on the
the OSIOSI distribution.
distribution.
Figure 6. The influence of fluid levels in the annular dish on shear stress stress distribution.
distribution. (A) Maximum
stresslevel
shear stress levelatateach
eachradial
radial position
position with
with different
different starting
starting fluidfluid heights
heights in thein134/56
the 134/56
(10-mm(10-mm
orbit)
orbit)134/89
and and 134/89
(19-mm (19-mm orbit) annular
orbit) annular dish ondish on an orbital
an orbital shaker. shaker.
For theFor the calculations,
calculations, a 200-rpm
a 200-rpm orbital
orbitalwas
speed speed was
used. (B)used.
OSI as(B)a function
OSI as aoffunction of position.
the radial the radialHeat
position.
maps of Heat
the maps of thedistributions
shear stress shear stress
distributions can be found
can be found in Figure S4. in Figure S4.
3.3. Biological Characterization
3.3. Biological Characterization
To
To test the cellular
test the cellular shear
shearstress
stressresponse,
response,endothelial
endothelial cells
cells were
were exposed
exposed to shear
to shear stress
stress in
in the
the annular dish. Since our lab is equipped with a 10-mm orbital shaker, we
annular dish. Since our lab is equipped with a 10-mm orbital shaker, we used a 134/56 dish. We used a 134/56 dish.
We compared
compared the cellular
the cellular orientation
orientation in response
in response to stress
to shear shear instress in thewith
the DiaD DiaD with a and
a 35-mm 35-mm and a
a 134-mm
134-mm dish. Endothelial
dish. Endothelial monolayersmonolayers were subjected
were subjected to sheartostress
shearon
stress on the orbital
the orbital shaker shaker at an orbital
at an orbital speed
speed of 200 rpm and a medium height of 3 mm. Upon the onset of shear
of 200 rpm and a medium height of 3 mm. Upon the onset of shear stress, the cells respondstress, the cells respond by by
modulating
modulating aa wide
wide variety
variety of
of signaling
signaling pathways.
pathways. In this work,
In this work, we exposed the
we exposed the cells
cells for
for 24
24 h h to
to shear
shear
stress
stress since after this period the shear stress response is reported to be stabilized [9]. The cells in the
since after this period the shear stress response is reported to be stabilized [9]. The cells in the
annular
annular dish
dish all
all aligned
aligned in
in the
the direction
direction ofof the
the main
main shear
shear direction
direction (Figure
(Figure S5). The cells
S5). The cells in
in the
the center
center
of
of the
the 35-mm
35-mm andand the
the 134-mm
134-mm dishdish oriented randomly, whereas
oriented randomly, whereas the
the cells
cells on
on the
the edge
edge aligned
aligned in in the
the
main shear direction (Figure
main shear direction (Figure 7A–C).7A–C).
We also analyzed the cellular response on a gene expression level in the 134/56 and 35-mm dish,
as these were exposed to similar τmax, whereas the τmax of the 134-mm dish was (45%) lower. The cells
in the 35-mm dish were divided into three groups (pooled, edge and center) to separate the effect of
different shear stress profiles for comparison with the 134/56 dish. Cells in the central region wereMCP1 expression was highest in the annular dish and the center of the 35-mm dish. Surprisingly, this
indicated a more atheroprone shear in the 134/56 dish than in the 35-mm dish. Since the shear levels
in these setups are similar, the atheroprone phenotype is likely related to the OSI levels which reach
up to 0.3 in the 134/56 dish, whereas the 35-mm dish approaches 0 for a large region. A similar profile
was seen for2020,
Micromachines the11,
35552
mm pooled dish vs. the edge fraction, which is likely due to the relatively10small
of 14
surface contribution of the region where the OSI is high.
7. Endothelial cell response to shear stress experienced
Figure 7. experienced in the annular
annular dish.
dish. (A–C) Widefield
images of endothelial cells under shear stress at the center or the edge of a standard culture dish or
an annular dish. The alignment directionality of the endothelial cells is quantified in the histograms histograms
below. Scalebar represents 200 µm. (D) Gene expression levels of the shear stress responsive responsive genes
eNOS, KLF2,
KLF2, CDH2
CDH2and MCP1ininendothelial
andMCP1 endothelialcells cellsunder
under static
static conditions
conditions and
and in different
in different (regions
(regions in)
in) culture
culture dishes.
dishes. AllAll genes
genes demonstrate
demonstrate a response
a response iningene
geneexpression
expressionininresponse
response toto shear stress
compared to the static controls. One measurement for the dish-in-a-dish (DiaD) group for MCP1 was
excluded
excluded based
basedon onGrubbs’
Grubbs’outlier
outliertest.
test.Error
Errorbarsbarsare
aredefined
definedasasthe
thestandard deviation.
standard deviation.Significance is
Significance
indicated
is indicated * p*Micromachines 2020, 11, 552 11 of 14
and MCP1 expression was highest in the annular dish and the center of the 35-mm dish. Surprisingly,
this indicated a more atheroprone shear in the 134/56 dish than in the 35-mm dish. Since the shear
levels in these setups are similar, the atheroprone phenotype is likely related to the OSI levels which
reach up to 0.3 in the 134/56 dish, whereas the 35-mm dish approaches 0 for a large region. A similar
profile was seen for the 35 mm pooled dish vs. the edge fraction, which is likely due to the relatively
small surface contribution of the region where the OSI is high.
4. Discussion
Based on the combined computational and experimental data, we recommend the use of an
orbital shaker with an orbit size of 19 mm in combination with a 134/89 dish at 200 rpm and 4 mm
medium. These parameters give rise to an atheroprotective shear stress pattern throughout the dish,
as shown by the low OSI. The disadvantage of this combination is that there is substantial τmax variation.
When low τmax variation is desired, the 89/56 dish on the 10-mm orbit is a good alternative. In this
dish, the maximum OSI is 0.11 and the variation in τmax is lower, but the cell yield is lower. The cell
culture area of a single 134/89 dish is 79 cm2 , allowing for a typical cell count of ± 2 million cells,
meeting the typical requirements of high input molecular techniques such as proteomics or chromatin
conformation capture. These numbers can otherwise only be met by a cone-and-plate apparatus,
but the throughput is limited to a single dish/plate. The annular dishes can be placed next to and
stacked on top of each other, increasing the throughput significantly. Moreover, the orbital shaker is a
more accessible platform than the cone-and-plate apparatus.
To reach similar τmax values as the 134/89 dish on the 19-mm orbit, one could increase the viscosity
of the medium, since this directly scales with the shear stress level. The viscosity can be changed
by supplementing the medium with polysaccharides such as methyl cellulose or xanthan gum [36].
These factors can increase the dynamic viscosity by four or five times, leading to higher shear stress
levels. Alternatively, one could selectively seed the edge area of the 35-mm dish, preventing interference
of atheroprone factors in the experiment. This could be done by scraping prior to the experiment or by
selective passivation of the surface with agents that reduce cell adhesion such as Pluronic F-127 [37–39].
For the larger dishes, this approach is not possible, in these dishes the inner dish is needed to reach the
atheroprotective shear stress conditions.
The shear stress response is not solely dependent on the shear stress magnitude and direction.
When studying endothelial cells under flow, the matrix and cell origin could also be considered. Here,
we coated the dishes with collagen IV, since this is the main component of the basement membrane.
Another commonly used coating is fibronectin, a protein that could be considered atheroprone as it is a
protein produced during wound healing [40]. The source of the endothelial cells can play an even
bigger role. Not only can the difference between arterial and venous origin play a role [41], there is
also a wide heterogeneity between organs [42]. Moreover, it will be very interesting to use the annular
dishes to investigate the role of different key signaling pathways in mechanosensing with both healthy
and diseased cells. This can be in direct mechanotransduction regulators such as focal adhesion kinases
or in cell–cell signaling pathways that are well-known as cell fate regulators [43]. An example of this
is Notch signaling, an evolutionary conserved signaling pathway, that is emerging as an important
regulator in the endothelial shear stress response [17,33,44,45].
In conclusion, this study characterized the shear stress distributions in different designs of orbital
shaker setups. Although the DiaD is an accessible shear stress platform and a potential improvement
over regular dishes on orbital shakers, it is important to calculate and validate the flow profiles.
When carefully characterized, the DiaD can aid in improving our knowledge of vascular biology and
expand our mechanistic knowledge of shear stress-induced response.
Supplementary Materials: The following are available online at http://www.mdpi.com/2072-666X/11/6/552/s1,
Supplemental information 1: mesh sensitivity analysis, Figure S1: Experimental design. Fabricated DiaD and
the experimental design. The DiaD is fixed on the orbital shaker do avoid drift. Figure S2: Shear distribution
controlled by orbit size. Shear stress distribution heat maps in the 134/56 and 134/89 annular dish on orbitalMicromachines 2020, 11, 552 12 of 14
shakers with an orbit size of 10, 19 or 25 mm. The graphical representation scales from 0 to 2.0 Pa to cover shear
stress distributions for both high and low rotational speeds. Figure S3: Shear distribution in the 134/56 and 134/89
annular dish in response to orbital speed. Heat maps of the shear stress distribution in the 134/56 (10 mm orbit)
and 134/89 (19 mm orbit) annular dish on orbital shakers, swirled at an orbital speed of 100, 125, 150 and 200 rpm.
The graphical representation scales from 0 to 1.0 Pa to cover shear stress distributions for both high and low
rotational speeds. Figure S4: Shear distribution in the 134/56 and 134/89 annular dish in response to fluid height.
Shear stress distribution heat maps in the 134/56 (10 mm orbit) and 134/89 (19 mm orbit) annular dish on the
orbital shaker with a starting medium height of 2, 3 or 4 mm culture medium. The graphical representation scales
from 0 to 1.0 Pa to cover shear stress distributions for both high and low rotational speeds. Figure S5: Endothelial
alignment in the annular dish. (A) Graphical representation of the net shear stress vector in a 134/56 annular dish
at 200 rpm, 10 mm orbit, and 3 mm fluid level. (B) Representative widefield images of ECs at different positions
in a 134/56 annular dish after a 24-h culture period under flow. The ECs align in the direction of the net flow
direction. (C) Quantification of the cellular alignment. (D) The main shear stress direction is shown as a function
of the radial position in the annular dish. The dashed line at 90 degrees indicates the orbital direction. Table S1:
Primers used in gene expression analysis.
Author Contributions: Conceptualization, R.D., F.Z., S.H., C.B., C.S. and O.S.; methodology, R.D., F.Z., O.S.;
formal analysis, R.D., F.Z. and O.S.; investigation, R.D., F.Z. and O.S.; writing—original draft preparation, R.D.,
F.Z., and O.S.; writing—review and editing, R.D., F.Z., S.H., C.B., C.S. and O.S.; funding acquisition, S.H., C.B. and
C.S. All authors have read and agreed to the published version of the manuscript.
Funding: We acknowledge the support from the 1Valve consortium, funded by the Netherlands Cardiovascular
Research Initiative (CVON 2012-01): the Dutch Heart Foundation, Dutch Federation of University Medical Centers,
the Netherlands Organization for Health Research and Development and the Royal Netherlands Academy of
Sciences. We further acknowledge the support from the ForceMorph project, funded by the ERC, project number
771168; and from the REMOTE project, funded by ERC, project number 336043. In the context of the Open
Access to Research data Pilot of the ERC, the data underlying this manuscript will be made accessible at
http://doi.org/10.4121/uuid:817dbbc8-f3d7-4b91-b809-1ea25214bd3c.
Conflicts of Interest: The authors declare no conflict of interest.
References
1. Yanagisawa, M.; Kurihara, H.; Kimura, S.; Tomobe, Y.; Kobayashi, M.; Mitsui, Y.; Yazaki, Y.; Goto, K.;
Masaki, T. A novel potent vasoconstrictor peptide produced by vascular endothelial cells. Nature 1988, 332,
411–415. [PubMed]
2. Vozzi, F.; Bianchi, F.; Ahluwalia, A.; Domenici, C. Hydrostatic pressure and shear stress affect endothelin-1
and nitric oxide release by endothelial cells in bioreactors. Biotechnol. J. 2014, 9, 146–154. [CrossRef] [PubMed]
3. Hadi, H.A.R.; Carr, C.S.; Al Suwaidi, J. Endothelial dysfunction: Cardiovascular risk factors, therapy,
and outcome. Vasc. Health Risk Manag. 2005, 1, 183–198. [PubMed]
4. Al-Soudi, A.; Kaaij, M.H.; Tas, S.W. Endothelial cells: From innocent bystanders to active participants in
immune responses. Autoimmun. Rev. 2017, 16, 951–962. [PubMed]
5. Bondareva, O.; Tsaryk, R.; Bojovic, V.; Odenthal-Schnittler, M.; Siekmann, A.F.; Schnittler, H.-J. Identification
of atheroprone shear stress responsive regulatory elements in endothelial cells. Cardiovasc. Res. 2019, 115,
1487–1499. [CrossRef] [PubMed]
6. Mohan, S.; Mohan, N.; Sprague, E.A. Differential activation of NF-kappa B in human aortic endothelial cells
conditioned to specific flow environments. Am. J. Physiol. Physiol. 2017, 273, C572–C578. [CrossRef]
7. Green, J.P.; Souilhol, C.; Xanthis, I.; Martinez-Campesino, L.; Bowden, N.P.; Evans, P.C.; Wilson, H.L.
Atheroprone flow activates inflammation via endothelial ATP-dependent P2X7-p38 signalling. Cardiovasc. Res.
2018, 114, 324–335. [CrossRef]
8. Bai, L.; Shyy, J.Y.-J. Shear Stress Regulation of Endothelium: A Double-edged Sword. J. Transl. Intern. Med.
2018, 6, 58–61. [CrossRef]
9. Ajami, N.E.; Gupta, S.; Maurya, M.R.; Nguyen, P.; Li, J.Y.-S.; Shyy, J.Y.-J.; Chen, Z.; Chien, S.; Subramaniam, S.
Systems biology analysis of longitudinal functional response of endothelial cells to shear stress. Proc. Natl.
Acad. Sci. USA 2017, 114, 201707517. [CrossRef]
10. Malek, A.M.; Alper, S.L.; Izumo, S. Hemodynamic shear stress and its role in atherosclerosis. JAMA 1999,
282, 2035–2042. [CrossRef]
11. Buchanan, J.R.; Kleinstreuer, C.; Truskey, G.A.; Lei, M. Relation between non-uniform hemodynamics and
sites of altered permeability and lesion growth at the rabbit aorto-celiac junction. Atherosclerosis 1999, 143,
27–40. [CrossRef]Micromachines 2020, 11, 552 13 of 14
12. Dekker, R.J.; Van Soest, S.; Fontijn, R.D.; Salamanca, S.; De Groot, P.G.; VanBavel, E.; Pannekoek, H.;
Horrevoets, A.J.G. Prolonged fluid shear stress induces a distinct set of endothelial cell genes, most specifically
lung Krüppel-like factor (KLF2). Blood 2002, 100, 1689–1698. [CrossRef] [PubMed]
13. Ziegler, T.; Bouzourène, K.; Harrison, V.J.; Brunner, H.R.; Hayoz, D. Influence of oscillatory and unidirectional
flow environments on the expression of endothelin and nitric oxide synthase in cultured endothelial cells.
Arterioscler. Thromb. Vasc. Biol. 1998, 18, 686–692. [CrossRef] [PubMed]
14. Ziegler, T.; Silacci, P.; Harrison, V.J.; Hayoz, D. Nitric oxide synthase expression in endothelial cells exposed
to mechanical forces. Hypertension 1998, 32, 351–355.
15. Davis, C.A.; Zambrano, S.; Anumolu, P.; Allen, A.C.B.; Sonoqui, L.; Moreno, M.R. Device-based in vitro
techniques for mechanical stimulation of vascular cells: A review. J. Biomech. Eng. 2015, 137, 040801.
16. van Engeland, N.C.A.A.; Pollet, A.M.A.O.A.O.; den Toonder, J.M.J.J.; Bouten, C.V.C.C.; Stassen, O.M.J.A.J.A.;
Sahlgren, C.M. A biomimetic microfluidic model to study signalling between endothelial and vascular
smooth muscle cells under hemodynamic conditions. Lab Chip 2018, 18, 1607–1620. [CrossRef]
17. Polacheck, W.J.; Kutys, M.L.; Yang, J.; Eyckmans, J.; Wu, Y.; Vasavada, H.; Hirschi, K.K.; Chen, C.S. A
non-canonical Notch complex regulates adherens junctions and vascular barrier function. Nature 2017, 552,
258–262.
18. Filipovic, N.; Ghimire, K.; Saveljic, I.; Milosevic, Z.; Ruegg, C.; Filipovic, N.; Ruegg, C.; Saveljic, I.; Ghimire, K.;
Saveljic, I.; et al. Computational modeling of shear forces and experimental validation of endothelial cell
responses in an orbital well shaker system. Comput. Methods Biomech. Biomed. Engin. 2016, 19, 581–590.
[CrossRef]
19. Warboys, C.M.; Ghim, M.; Weinberg, P.D. Understanding mechanobiology in cultured endothelium: A review
of the orbital shaker method. Atherosclerosis 2019, 285, 170–177. [CrossRef]
20. White, L.A.; Stevenson, E.V.; Yun, J.W.; Eshaq, R.; Harris, N.R.; Mills, D.K.; Minagar, A.; Couraud, P.;
Alexander, J.S. The Assembly and Application of “Shear Rings”: A Novel Endothelial Model for Orbital,
Unidirectional and Periodic Fluid Flow and Shear Stress. J. Vis. Exp. 2016, e54632. [CrossRef]
21. dela Paz, N.G.; Walshe, T.E.; Leach, L.L.; Saint-Geniez, M.; D’Amore, P.A. Role of shear-stress-induced VEGF
expression in endothelial cell survival. J. Cell Sci. 2012, 125, 831–843. [CrossRef] [PubMed]
22. Béguin, E.P.; Janssen, E.F.J.; Hoogenboezem, M.; Meijer, A.B.; Hoogendijk, A.J.; van den Biggelaar, M.
Flow-induced reorganization of laminin-integrin networks within the endothelial basement membrane
uncovered by proteomics. Mol. Cell. Proteomics 2020. [CrossRef] [PubMed]
23. Dardik, A.; Chen, L.; Frattini, J.; Asada, H.; Aziz, F.; Kudo, F.A.; Sumpio, B.E. Differential effects of orbital
and laminar shear stress on endothelial cells. J. Vasc. Surg. 2005, 41, 869–880. [CrossRef] [PubMed]
24. Pearce, M.J.; Mcintyre, T.M.; Prescott, S.M.; Zimmerman, G.A.; Whatley, R.E. Shear stress activates cytosolic
phospholipase A2 (cPLA2) and MAP kinase in human endothelial cells. Biochem. Biophys. Res. Commun.
1996, 218, 500–504. [CrossRef]
25. Hubbe, M.A. Adhesion and detachment of biological cells in vitro. Prog. Surf. Sci. 1981, 11, 65–137.
[CrossRef]
26. Ley, K.; Lundgren, E.; Berger, E.; Arfors, K.E. Shear-dependent inhibition of granulocyte adhesion to cultured
endothelium by dextran sulfate. Blood 1989, 73, 1324–1330. [CrossRef]
27. Thomas, J.M.D.; Chakraborty, A.; Sharp, M.K.; Berson, R.E. Spatial and temporal resolution of shear in an
orbiting petri dish. Biotechnol. Prog. 2011, 27, 460–465. [CrossRef]
28. Salek, M.M.; Sattari, P.; Martinuzzi, R.J. Analysis of fluid flow and wall shear stress patterns inside partially
filled agitated culture well plates. Ann. Biomed. Eng. 2012, 40, 707–728. [CrossRef]
29. Cherng, W.J.; Dong, Z.S.; Chou, C.C.; Yeh, C.H.; Pan, Y.H. Hydrodynamic simulation of an orbital shaking test
for the degradation assessment of blood-contact biomedical coatings. Micromachines 2017, 8, 132. [CrossRef]
30. Köhler, R.; Hoyer, J. Role of TRPV4 in the Mechanotransduction of Shear Stress in Endothelial Cells. In TRP
Ion Channel Function in Sensory Transduction and Cellular Signaling Cascades; Taylor & Francis: Abingdon,
UK, 2007.
31. Schlichting, H.; Gersten, K. Boundary-Layer Theory; Springer: Berlin/Heidelberg, Germany, 2016; Volume 9,
ISBN 978-3-662-52917-1.
32. Melke, J.; Zhao, F.; Ito, K.; Hofmann, S. Orbital seeding of mesenchymal stromal cells increases osteogenic
differentiation and bone-like tissue formation. J. Orthop. Res. 2020. [CrossRef]Micromachines 2020, 11, 552 14 of 14
33. Driessen, R.C.H.; Stassen, O.M.J.A.; Sjöqvist, M.; Suarez Rodriguez, F.; Grolleman, J.; Bouten, C.V.C.;
Sahlgren, C.M. Shear stress induces expression, intracellular reorganization and enhanced Notch activation
potential of Jagged1. Integr. Biol. (Camb) 2018, 10, 719–726. [CrossRef] [PubMed]
34. Vandesompele, J.; De Preter, K.; Pattyn, F.; Poppe, B.; Van Roy, N.; De Paepe, A.; Speleman, F. Accurate
normalization of real-time quantitative RT-PCR data by geometric averaging of multiple internal control
genes. Genome Biol. 2002, 3, 1-0034. [CrossRef] [PubMed]
35. Ku, D.N.; Giddens, D.P.; Zarins, C.K.; Glagov, S. Pulsatile flow and atherosclerosis in the human carotid
bifurcation. Positive correlation between plaque location and low and oscillating shear stress. Arteriosclerosis
1985, 5, 293–302. [CrossRef] [PubMed]
36. van den Broek, C.N.; Pullens, R.A.A.A.; Frøbert, O.; Rutten, M.C.M.M.; den Hartog, W.F.; van de Vosse, F.N.
Medium with blood-analog mechanical properties for cardiovascular tissue culturing. Biorheology 2008, 45,
651–661. [CrossRef]
37. Tharmalingam, T.; Ghebeh, H.; Wuerz, T.; Butler, M. Pluronic enhances the robustness and reduces the cell
attachment of mammalian cells. Mol. Biotechnol. 2008, 39, 167–177. [CrossRef]
38. Buskermolen, A.B.C.; Suresh, H.; Shishvan, S.S.; Vigliotti, A.; DeSimone, A.; Kurniawan, N.A.; Bouten, C.V.C.;
Deshpande, V.S. Entropic Forces Drive Cellular Contact Guidance. Biophys. J. 2019, 116, 1994–2008. [CrossRef]
39. Ghim, M.; Pang, K.T.; Arshad, M.; Wang, X.; Weinberg, P.D. A novel method for segmenting growth of cells
in sheared endothelial culture reveals the secretion of an anti-inflammatory mediator. J. Biol. Eng. 2018, 12,
1–13. [CrossRef]
40. Chiang, H.Y.; Korshunov, V.A.; Serour, A.; Shi, F.; Sottile, J. Fibronectin is an important regulator of
flow-induced vascular remodeling. Arterioscler. Thromb. Vasc. Biol. 2009, 29, 1074–1079. [CrossRef]
41. Paz, N.G.; Amore, P.A.D. Arterial versus venous endothelial cells Nathaniel. Cell Tissue Res. 2009, 335, 5–16.
42. Marcu, R.; Choi, Y.J.; Xue, J.; Fortin, C.L.; Wang, Y.; Nagao, R.J.; Xu, J.; MacDonald, J.W.; Bammler, T.K.;
Murry, C.E.; et al. Human Organ-Specific Endothelial Cell Heterogeneity. iScience 2018, 4, 20–35. [CrossRef]
43. Li, S.; Butler, P.; Wang, Y.; Hu, Y.; Han, D.C.; Usami, S.; Guan, J.-L.; Chien, S. The role of the dynamics of focal
adhesion kinase in the mechanotaxis of endothelial cells. Proc. Natl. Acad. Sci. USA 2002, 99, 3546–3551.
[CrossRef] [PubMed]
44. Mack, J.J.; Mosqueiro, T.S.; Archer, B.J.; Jones, W.M.; Sunshine, H.; Faas, G.C.; Briot, A.; Aragón, R.L.; Su, T.;
Romay, M.C.; et al. NOTCH1 is a mechanosensor in adult arteries. Nat. Commun. 2017, 8, 1620. [CrossRef]
[PubMed]
45. van Engeland, N.C.A.; Suarez Rodriguez, F.; Rivero-Müller, A.; Ristori, T.; Duran, C.L.; Stassen, O.M.J.A.;
Antfolk, D.; Driessen, R.C.H.; Ruohonen, S.; Ruohonen, S.T.; et al. Vimentin regulates Notch signaling
strength and arterial remodeling in response to hemodynamic stress. Sci. Rep. 2019, 9, 12415. [CrossRef]
[PubMed]
© 2020 by the authors. Licensee MDPI, Basel, Switzerland. This article is an open access
article distributed under the terms and conditions of the Creative Commons Attribution
(CC BY) license (http://creativecommons.org/licenses/by/4.0/).You can also read