Murray State's Digital Commons
←
→
Page content transcription
If your browser does not render page correctly, please read the page content below
Murray State's Digital Commons

Honors College Theses                                                                             Honors College

5-2020

An Exploratory Study of Generational Coffee Preferences
Lindsey Falkner

Follow this and additional works at: https://digitalcommons.murraystate.edu/honorstheses

   Part of the Food and Beverage Management Commons, and the Marketing Commons

Recommended Citation
Falkner, Lindsey, "An Exploratory Study of Generational Coffee Preferences" (2020). Honors College
Theses. 50.
https://digitalcommons.murraystate.edu/honorstheses/50

This Thesis is brought to you for free and open access by the Honors College at Murray State's Digital Commons. It
has been accepted for inclusion in Honors College Theses by an authorized administrator of Murray State's Digital
Commons. For more information, please contact msu.digitalcommons@murraystate.edu.
Murray State University Honors College

                                      HONORS THESIS

                                     Certificate of Approval

                  An Exploratory Study of Generational Coffee Preferences

                                        Lindsey Falkner
                                           May 2020

Approved to fulfill the                             ____________________________________
Requirements of HON 437                                 Dr. Sarah Lefebvre, Assistant Professor
                                                                                     Marketing

Approved to fulfill the                             ____________________________________
Honors Thesis requirement                             Dr. Warren Edminster, Executive Director
of the Murray State Honors                                                    Honors College
Diploma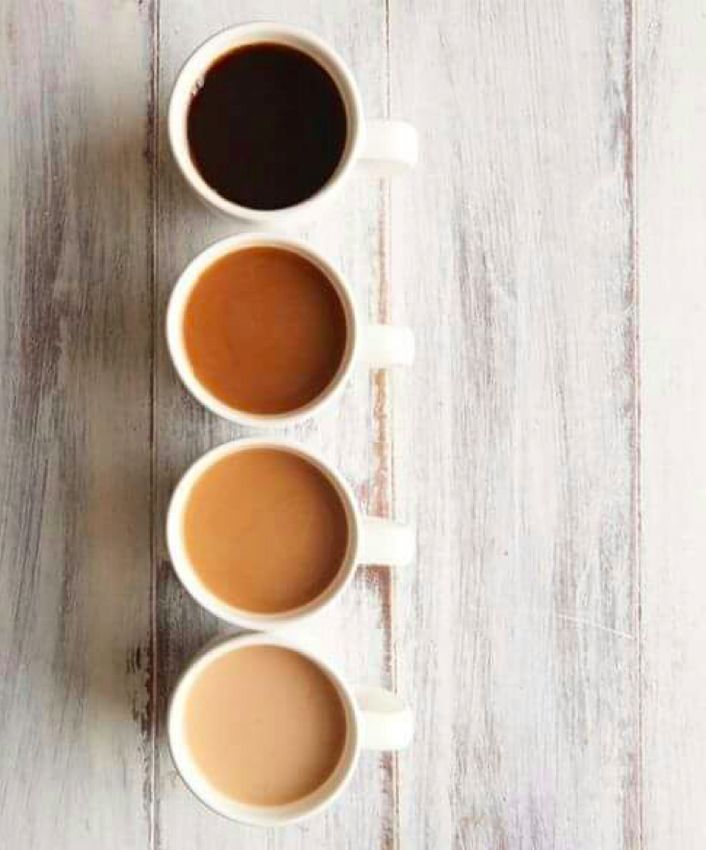
Examination Approval Page

Author: Lindsey Falkner

Project Title: An Exploratory Study of Generational Coffee Preferences

Department: Marketing

Date of Defense: April 27, 2020

Approval of Examining Committee:

_______________________________________                                  _________________
(Dr. Sarah Lefebvre, Advisor)                                                  (Date)

________________________________________                                 _________________
(Dr. Yana Andonova, Committee Member)                                          (Date)

_________________________________________                                _________________

(Dr. Ismail Karabas, Committee Member)                                         (Date)
An Exploratory Study of
       Generational Coffee Preferences

         Submitted in partial fulfillment
              of the requirements
for the Murray State University Honors Diploma

               Lindsey Falkner

                 April 2020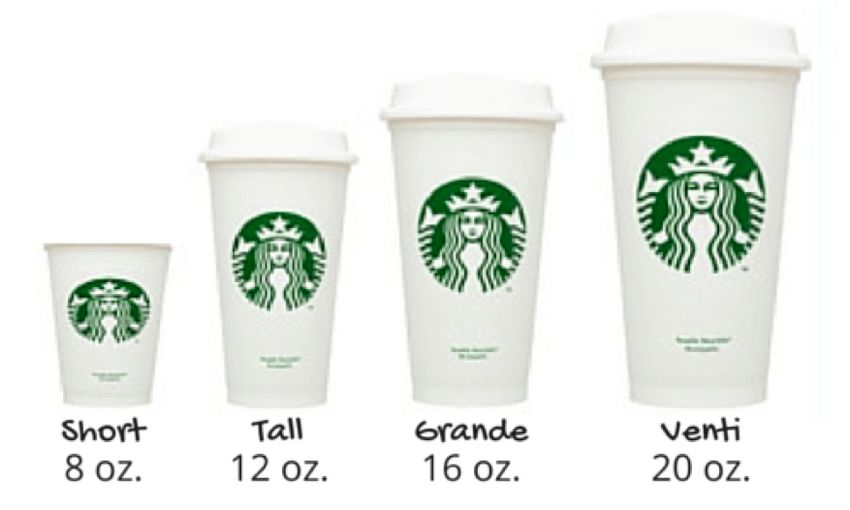
Abstract

   This research focuses on generational differences in preferences towards coffee-style

beverages. The aim of this research is to provide recommendations to marketers within the

saturated coffee industry. An online exploratory study was conducted with two-hundred and

fifty-two participants from Amazon Mechanical Turk. The results show that differences exist

between the coffee preferences across all generations, especially when it comes to the current

trends (e.g., premiumization, convenience, and sustainability). Further, the results reveal several

factors that may cause these generational differences. Finally, the study explored several ways

that marketers in the coffee industry can appeal to different generations’ preferences, especially

utilizing sensory marketing.

                                                                                                      i
TABLE OF CONTENTS
Abstract………………………………………………………………………………………...i
List of Figures/Tables………………………………………………………………………...iii
1. Introduction……………………………………………………………………………………1
2. Literature Review……………………………………………………………………………...2
2.1. The Societal Impact of the Coffee Industry………………………………………………2
2.2. Generational Differences in Purchasing Behavior……………………………………….3
2.3. Current Trends in the Coffee Industry……………………………………………………5
2.4. The Use of Sensory Marketing for Coffee Businesses…………………………………...8
2.5. Research Questions……………………………………………………………………….9
3. Methodology…………………………………………………………………………………10
4. Key Results……………………………………………………………………………..........13
4.1. Frequency of Coffee Consumption……………………………………………………...13
4.2. Coffee Preparation……………………………………………………………................17
4.3. Consumption Environment……………………………………………………………...20
4.4. Millennials vs. Generation Z…………………………………………………................24
5. Discussion and Implications…………………………………………………………………27
5.1. Discussion……………………………………………………………………………….27
5.2. Theoretical Implications………………………………………………………………...27
5.3. Practical Implications…………………………………………………………………...29
5.4. Limitations and Future Research……………………………………………..................33
6. Conclusion…………………………………………………………………………………...35
7. References……………………………………………………………………………………36
8. Appendix………………………………………………………………………………..........43
iiList of Figures/Tables
List of Figures
1. Figure 1: Daily Coffee Consumption……………………………………………………14
2. Figure 2: Weekly Coffee Consumption…………………………………………………14
3. Figure 3: Ready-to-Drink Coffee Consumption………………………………………...16
4. Figure 4: At-Home Coffee Preparation…………………………………...…………….18
5. Figure 5: Coffee Temperature Preference……………………………………………....18
6. Figure 6: Coffee Vessel Preference……………………………………………………..19
7. Figure 7: Coffee Strength Preference…………………………………………………...19
8. Figure 8: Coffee Type Preference……………………………………………………….20
9. Figure 9: Coffee Shop Lighting…………………………………………………………21
10. Figure 10: Coffee Shop Background Noise……………………………………………..22
11. Figure 11: Coffee Shop Duration of Stay……………………………………………….22
12. Figure 12: Coffee Shop Purchasing Factors…………………………………………….23
13. Figure 13: Coffee Strength Preference vs. Coffee Shop Lighting………………………24
List of Tables
1. Table 1: Age and Gender Distribution of Participants…………………………………..11
2. Table 2: Survey Questions………………………………………………………………11
3. Table 3: Specialty Coffee Drink Consumption………………………………………….15
4. Table 4: Importance of Sustainability…………………………………………………...15
5. Table 5: Starting Age of Coffee Consumption………………………………………….16
6. Table 6: Significance Values for Millennials vs. Generation Z…………………………25
iii1. Introduction
Coffee is America’s most consumed beverage, doubling that of juice, tea, soda, and
bottled water (Paul, 2017). Therefore, it is essential for the coffee industry to keep up with these
high demands. The food and beverage industry is becoming increasingly focused on the rapid
growth of the coffee market and its major impact on society. A challenge for all marketers is
recognizing the differences amongst consumers of all generations. This segmentation strategy is
often ignored, yet evidence exists that consumer behavior is partially driven by differences in
generational cohorts. For instance, Baby Boomers tend to have a stronger sense of brand loyalty
than Millennials, likely due to the fact that Millennials were exposed to more promotions and
advertisements from a wide range of brands growing up due to the development of online
marketing (Ordun, 2015). These generational differences in consumer behavior especially can
cause a stronger preference towards certain brands and products, as Baby Boomers’ top brands
include UPS and Home Depot, while Millennials’ and Generation Z’s include Netflix and
Google, which are vastly different types of companies (Gal & Cain, 2019).
Since there is a lot of dispute over boundaries defining generational cohorts, in this
research the generation guidelines set by the Pew Research Center (Dimock, 2019) will be used
to categorize consumers. The generation age groups are as follows:
● The Silent Generation: Born 1928-1945 (75-92 years old)
● Baby Boomers: Born 1946-1964 (56-74 years old)
● Generation X: Born 1965-1980 (40-55 years old)
● Millennials (Generation Y): Born 1981-1996 (24-39 years old)
● Generation Z (Post-Millennials): Born 1997-Present (0-23 years old)
1Though this research will examine coffee beverage preferences across all generational
cohorts, emphasis is placed on comparing Millennials and Generation Z. Many people often do
not see the differences between these two key generations, especially in terms of their
preferences in food and beverages. Most do not even know how to correctly identify Millennials
or Generation Z. Additionally, 56% of the population believes that marketers can use the same
tactics to target Millennials as they can for Generation Z, and assume their tastes are very similar
(Bump, 2020). This is highlighted by the number of marketers who believe that they do not need
to segment consumers and can use a similar approach when marketing to Millennials and
Generation Z. However, this may not be the case, since research has found they share different
life experiences that will alter their views and preferences (Knowles, 2018).
This study aims to distinguish the differences between the coffee preferences of
Millennials and Generation Zers, while also looking across all generational cohorts, including
Baby Boomers, the Silent Generation, and Generation Xers. This will involve analyzing which
trends they are currently gravitating towards (e.g., sustainability, ready-to-drink (RTD),
premiumness, etc.) and the difference between those trends among the generations. Thus,
recommendations can then be made to marketers in the beverage industry on how to best attract
these different generational segments.
2. Literature Review
2.1. The Societal Impact of the Coffee Industry
The National Coffee Association studied several ways that coffee contributes positively
to the U.S. economy. The total economic impact of the coffee industry in the U.S. in 2015 was
$225.2 billion. Coffee-related economic activity comprises approximately 1.6% of the total U.S.
gross domestic product, with consumers spending $74.2 billion on coffee in 2015 alone. In
2addition, the coffee industry is responsible for 1,694,710 jobs in the U.S. economy (National
Coffee Association USA, 2015). Chrystalleni Stivaris, an analyst at Los Angeles-based
IBISWorld, stated, “The U.S. coffee market and its respective segments have all performed well
over the past year...The number of people consuming coffee on a regular basis has increased,
particularly among youth” (Buono, 2017). This is reflected by the 3.8% increase in the number
of branded coffee outlets in the U.S. in 2018. There are approximately 35,616 coffee shops in the
U.S., which has a market value of around $45.4 billion. However, among the three leading U.S.
chains (Starbucks, Dunkin’ Donuts, and Tim Hortons), retail sales flattened compared to 2017,
indicating market saturation. But, this does leave room for growth for smaller coffee shops that
are more quality-focused (Brown, 2018). According to the National Coffee Association, daily
consumption of coffee among 18-to 24-year olds rose to 48% from 34% in 2016, and increased
to 60% from 51% for those aged 25-to 39-years old (Supplement Breakfast Journal, 2017).
Therefore, the coffee industry is continuing to grow, meaning there is more of a need now than
ever for research examining consumer preferences to identify potential areas for growth.
2.2. Generational Differences in Purchasing Behavior
All generations have different preferences when it comes to the food and beverage
industry, even that of coffee. For instance, Millennials have reshaped the coffee industry with
their specific tastes that revolve around sustainability and adventurous flavors. However, it is
important for coffee shops to understand how to target other generations, as they are still key
consumers, and in particular, older generations drink more coffee than younger, which can be
seen by the fact that within the coffee industry context, the age group that drinks the most coffee
is 60+ (70% of those that age drink coffee), with the next highest being Millennial age (64%),
and the least being Generation Z age at 47% (Bedford, 2020). Anecdotal evidence supports that
3older generations drink more coffee, but use more drip machines, drink less gourmet drinks, and
younger generations prefer specialty beverages, espresso machines, and ready-to-drink coffee
(Atlantic Specialty Coffee, 2013). However, research on the coffee preferences across
generations is dated, and with the dynamic industry movement, this area needs to be further
explored.
There is extant research on food preferences of each generation, which can filter into
coffee preferences. Researchers have found: 40% of Generation Z, more than any other
generation, eats their food on-the-go, Millennials emphasize technology (59% saying they use
mobile ordering), Generation X surprisingly likes to take risks (62% stating that they like trying
new flavors), and Baby Boomers mainly focus on taste (70% of them agreeing that taste is most
important to them when choosing what to consume) (Cobe, Gingerella, Lewis, & Nash, 2019).
There is also research on how to market specifically to the Baby Boomer generation in terms of
food service. Some of the main takeaways are focusing on new flavor options, keeping their
brand loyalty, and providing them with personalized service (Cobe, 2018). General research has
also been done on different marketing tactics that can be used on Millennials, Generation Xers,
and Baby Boomers, which can help marketers in all industries, including the coffee industry.
This research states that Baby Boomers have high brand loyalty, Generation Xers can be targeted
by use of coupons, and Millennials focus on innovation, especially with the use of technology
(Lister, 2019).
There appears to be a lack of research on Generation Z preferences, which is essential, as
they are different than previous generations and are starting to have a large buying power. One
article discusses Generation Z’s impact on the beverage industry in general, stating that they
value real food, brands, transparency, convenience, and global flavors (Mark, 2018). While there
4is limited research on Generation Z coffee behavior, one source claims that cold or iced coffee is
their most frequently purchased drink, with hot coffee, smoothies, sports drinks, and soft drinks
trailing behind (Winsight, 2018). In terms of food, Generation Z preferences include an emphasis
on vegan and vegetarian options and trying different types of cuisine (e.g., Asian, Mexican, etc.),
a demonstration of their adventurous side (Maynard, 2019). It has been shown that Generation
Z’s top food service priorities are affordability, convenience, customization, and experience,
with them purchasing a lot of specialty beverages. In addition, they differ from the Millennial
generation by being more interested in the human story behind the product (PJ’s Coffee, 2019).
Research directly comparing Generation Z and Millennial preferences is limited. One
article looked into how Generation Z and Millennials differ in their purchasing behavior and
noted that Generation Z is likely to spend less money, as they grew up in an economic recession
(Young, 2019). A different article briefly discussed Millennial and Generation Z coffee
preferences, citing that Generation Z has high expectations with ethically sourced food and
desire an experience with their coffee, as they are in it for more than the cup (Nation’s
Restaurant News, 2016). There is research that has examined coffee and tea consumption among
different generations, adding that specialty beverages are most common with younger
generations, and ready-to-drink coffee and cold brew are becoming increasingly popular (Red
Diamond, 2019); however, Millennials and Generation Zers were grouped together, which seems
to be the case for most research including Millennials and Generation Z.
2.3. Current Trends in the Coffee Industry
Millennials are very adventurous when it comes to coffee, as they seem to gravitate
towards the trends, including ready-to-drink coffee options, nitro coffee, and cold brew
(Supplement Breakfast Journal, 2017). 5 trends impacting the beverage industry have been
5identified: increased focus on health and wellness, premiumization, convenience, direct to
consumer offerings, and sustainability (Colbert, 2019). It is important to analyze how
generations differ in their preferences for these trends.
Premiumization is the idea that customers are starting to want more premium and
specialty beverages, as less and less are ordering just plain coffee, and want to try something
more out-of-the-box. Premium beverages can include lattes, cold brew, coffee pods, and more.
These are largely popular with younger generations. There is increased consumption of coffee
due to Millennials consuming more, bringing more of an emphasis on premiumization, such as
cold brew, ready-to-drink coffee, and coffee pods (Buono, 2017). While most sources claim that
Millennials are mainly consuming specialty coffee, others state that older generations have
recently seen the most growth in their preference for specialty coffee (Vending Market Watch,
2018).
Another sector of premium coffee that is gaining a lot of traction right now is cold brew,
as it is both a gourmet beverage and can be more technology-focused (i.e., nitro). It is also
becoming increasingly popular in restaurants, especially ones that focus on craft beer (Maynard,
2018). Cold brew’s popularity can be mainly attributed to Millennials and Generation Zers, but
research implies that there is an opportunity to expand into Generation X, who have shown an
interest in specialty drinks, as well (Cvetan, 2019). Premium coffee is beginning to be so popular
that midscale hotels and other lodging establishments are now offering it in their lobbies and are
starting to provide K-cups more frequently (Lincoln Ross, 2017). There has been research done
on the impact of coffee pods and the expansion of cold brew into the coffee market in Great
Britain, suggesting that premiumization is not just an American fascination (Mullaney, 2014).
With gourmet coffees thriving, this proves to be a problem for the producers of coffee, since
6competition is so fierce, it has led small growers to abandon the business. Another cause of this
is climate change, as it has destroyed many coffee growing land. With these farms closing, this
could prove disastrous for the growing premiumization coffee trend (Singh & Perez, 2019). But,
this does not currently seem to be an issue with the trend continuing to grow, even with older
generations. With several sources claiming that older generations are moving towards specialty
beverages, this study seeks to further uncover which generations are consuming the most
premium coffee.
Sustainability is another current trend that many consumers nowadays consider when
deciding on where to eat/drink and what to eat/drink. Sustainability has been shown to have a
major impact on how younger consumers, especially Millennials, view their coffee, as
Millennials have begun questioning the origin of their coffee beans they are drinking. Uriah
Blum, the Vice President of Operations for Vitality Bowls, stated, “At our stores, Millennials are
interested in the quality and origin of the coffee beans. They want to know if it is fair trade,
organic, etc., as well as the method of brewing” (Supplement Breakfast Journal, 2017). In
response to this, leading coffee brands have developed technology to help them trace the origins
of their beans called “Thank My Farmer.” Consumers can also directly support sustainable
practices by donating money to farmers with this technology (Almeida, 2019). Results from a
taste experiment prove that consumers were willing to pay less after they tasted a fair trade
labeled coffee beverage compared to a regular coffee and were also willing to pay less for fair
trade coffee after just seeing the packaging of both, without extant knowledge on fair trade
coffee (Lange, Combris, Issanchou, & Schlich, 2015). With the knowledge that fair trade and
sustainable coffee is believed to not taste as good as normal coffee, it is important to see if
sustainable coffee does matter to different generations, which this study seeks to determine.
72.4. The Use of Sensory Marketing for Coffee Businesses
As the consumption experience becomes more important to consumers, marketers are
recognizing the importance of implementing elements of sensory marketing, appealing to
people’s senses to influence their behavior, into their product and establishment design.
Millennials are a key generation to utilize sensory marketing towards, as they tend to lack the
attention span that older generations have, so businesses need to use new ideas to market to them
(Wardlaw, 2017). This is especially important for coffee shops, as the atmosphere is one of the
main drivers for consumers. Coffee shop owners can influence consumers’ perceptions simply
by changing the color of the mug, the lighting in the store, the music being played, and the
smells being omitted. Several studies have been done on different ways that senses can be
utilized to change consumers’ perceptions about coffee. One study looked into how the color of a
mug can affect the taste of the coffee inside and it was discovered that the white mug enhanced
the intensity of the coffee flavor and consumers perceived it to be less sweet than from the blue
mug (Van Doorn, Wuillemin, & Spence, 2014). Another study was done that contrasted colored
mugs to white mugs, and found that coffee in pink and yellow mugs was perceived to be sweeter
than in white, while coffee in green and yellow mugs was perceived to be more acidic (Carvalho,
Fabiana, & Spence, 2019). There has been other research that looks into how the material of a
cup can affect the taste of coffee, as ceramic mugs tend to be a better option than that of plastic
or paper, which impact the flavor more in a negative way (Starbrew, 2019).
Another way that sensory marketing affects consumer behavior is through the lighting in
a coffee shop or a restaurant. It has been shown that dim lighting causes customers to eat more at
restaurants (Houston, 2017). One study looked at the impact of all of the senses on the purchase
behavior of consumers in coffee shops (Spence & Carvalho, 2019). Some of the key results
8include: those who like strong coffee tend to drink more coffee under bright lighting, and those
who drink weaker coffee drink more coffee under dim lighting (Gal et. al., 2007). Research
examining auditory aspects of marketing revealed that when the coffee machine sound is harsher,
participants claimed the coffee did not taste as good (Knöferle, 2012). Also, coffee shops often
utilize hard seats when they do not want their customers to loiter for too long (Spence, 2017).
While these studies are useful in determining ways that coffee shops can utilize sensory
marketing, there is a lack of research on how different generations view the coffee consumption
experience, thus not allowing for sensory marketing to be properly used for those of different
ages. So, this study will focus on that area, as well.
2.5. Research Questions
65% – 75% of all new products introduced to the market fail or miss their revenue targets
(Sharma, 2018). According to the Coffee Shop Owners Survey of 232 coffee shop business
owners, between 50% – 74% of independent coffee shops will fail in their first five years of
opening. Often failure is attributed to the fact that most businesses do not fully understand their
customer segment and how to attract them, as they will use a one-size-fits-all approach, instead
of a targeted approach. More specifically, in the coffee shop context, failure is largely due to the
huge amount of competition in the coffee industry, and coffee shops are struggling to set
themselves apart and create a unique experience for its target market (Lindenberg, 2019). Even
well-known companies struggle with this, including Tim Hortons, a Canadian-based coffee
chain. Their sales decreased in 2018, notably due to not appealing to their younger consumers,
Millennials and Generation Z, as they were not innovative with their product offerings and could
not keep up with the coffee development trends (Desai, 2019). With an increased focus on the
9coffee industry, many coffee companies are failing to attract different generations due to the fact
that they may not understand that each generation has different preferences.
Research has been done on the various differences between ages in their tastes; however,
there is a lack of focus on finding a contrast between Millennials and Generation Zers, which are
two key generational segments in regards to the coffee industry, as the younger generations are
the ones who tend to set the trends. Generation Z and Millennials also are currently the two most
populated generations in the U.S., with Generation Zers making up 26% of the population and
Millennials making up 25% (Knoema, 2020). This lack of research results in marketers losing
profit for their business, as they could be attracting even more consumers with the correct
segmentation, targeting, and positioning. Therefore, this study aims to explore the taste
preferences for coffee of different generations, with a slight focus on Millennials and Generation
Zers. My findings help to provide recommendations to marketers in the beverage industry on
how they can best target these consumers.
This study seeks to answer the following research questions:
1. Is there a difference in coffee preferences between Generation Z and Millennials?
2. What are the factors that influence coffee preferences across generational cohorts?
3. Based on generational preferences, how can marketers in the coffee industry attract
consumers of different generations, and how does sensory marketing play into this?
3. Methodology
An exploratory research approach was taken to gain insight into the coffee habits and
preferences of consumers. The online survey was distributed and completed through Amazon
Mechanical Turk (MTurk). The survey included 23 questions, with 17 asking about coffee
preferences and 6 being demographic-related. The data was then analyzed using SPSS statistical
10software Version 25 in order to make suggestions to marketers in the coffee industry on how to
target these individuals within the defined generational cohorts.
Two-hundred and fifty-two participants completed the survey in exchange for monetary
compensation. Table 1 provides the number of individuals within each generational group.
Participants’ ages ranged from 20-79 years old, with the mean age being 39 years. Participants
were required to be over the age of 18. Due to the sampling methodology used, the distribution
amongst generations was not even. Though, the participants were split evenly between genders,
with one-hundred and twenty-five male participants and one-hundred and twenty-seven female
participants.
Table 1: Age and Gender Distribution of Participants
Number of Participants 252
Generation Z, N (%) 14 (5.56%)
Millennial, N (%) 137 (54.37%)
Generation X, N (%) 61 (24.21%)
Baby Boomer, N (%) 38 (15.08%)
Silent Generation, N (%) 2 (0.79%)
Gender (Male), N (%) 125 (49.60%)
Gender (Female), N (%) 127 (50.40%)
After reviewing the consent form and survey instructions, participants were prompted to
answer the following questions one at time.
Table 2: Survey Questions
11Question Question Response Options
Number
1 How many 16 oz. servings (equivalent to a Starbucks Grande None; 1-2; 3-4; 5+
size - Appendix A) of coffee do you consume in a day?
2 How many times a week do you consume coffee? None; 1-3; 4-6; 7+
3 What percentage of coffee purchases in a week are specialty Percentage slider scale
beverages (lattes, cold brews, etc.)?
4 Please list the top two coffee drinks that you consume most Open response
frequently (latte, cappuccino, macchiato, etc.).
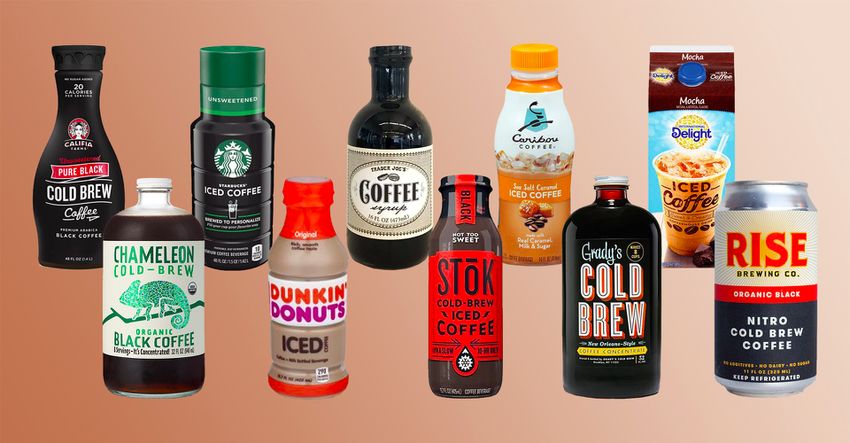
5 How frequently do you consume ready-to-drink beverages Never; 2-3 times a week; 4-7 times a
(Appendix B)? week; Daily
6 Other than coffee, what other beverages do you most Soft drinks; Energy drinks; Tea; Water;
commonly consume? (Please rank from most frequently Juice; Other
consumed (1) to least frequently consumed (6).
7 What age did you start regularly consuming coffee beverages? Drop down list
8 How much do you agree with the following statement: Strongly disagree (1); Disagree (2);
“Sustainable/organic ingredients make a difference in terms of Neither agree nor disagree (3); Agree
what type of coffee I order.” (4); Strongly agree (5)
9 Generally, do you prefer hot or cold coffee, without taking into Hot; Cold; Both
account the temperature outside?
10 Looking at the following image (Appendix C), which cup of 1; 2; 3; 4
coffee, after adding your desired amount of cream, do you
prefer?
11 Which of the following do you consume most frequently? Coffee that is prepared at home; coffee
that is purchased at a coffee shop
12 What type of machine do you use when you prepare coffee at Single serve (Keurig); Drip coffee
home? (Check all that apply) maker; I do not prepare coffee at home;
Other (please list)
13 When going to a coffee shop, how long do you usually stay? I go through the drive-thru; I grab the
coffee and go; I stay less than 30 mins; I
stay 30 mins - 1 hr.; I stay over 1 hr.
14 When choosing where to purchase my coffee from, I decide Location; Price; Brand loyalty; Past
based on: (Rank from most important (1) to least important experience; Flavor; Other (please list)
(6)).
15 What kind of background music do you prefer when going to a Chill music; Upbeat music; Silence
coffee shop?
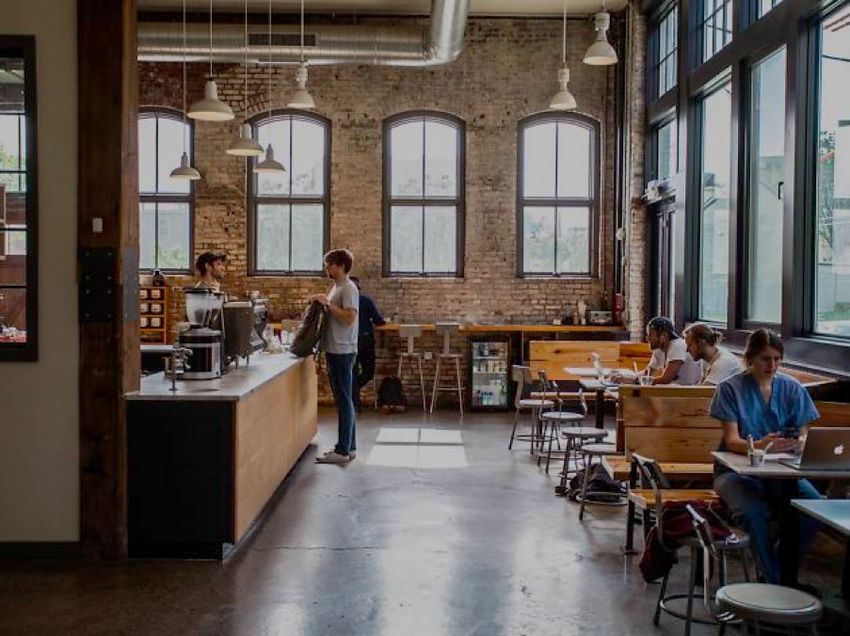
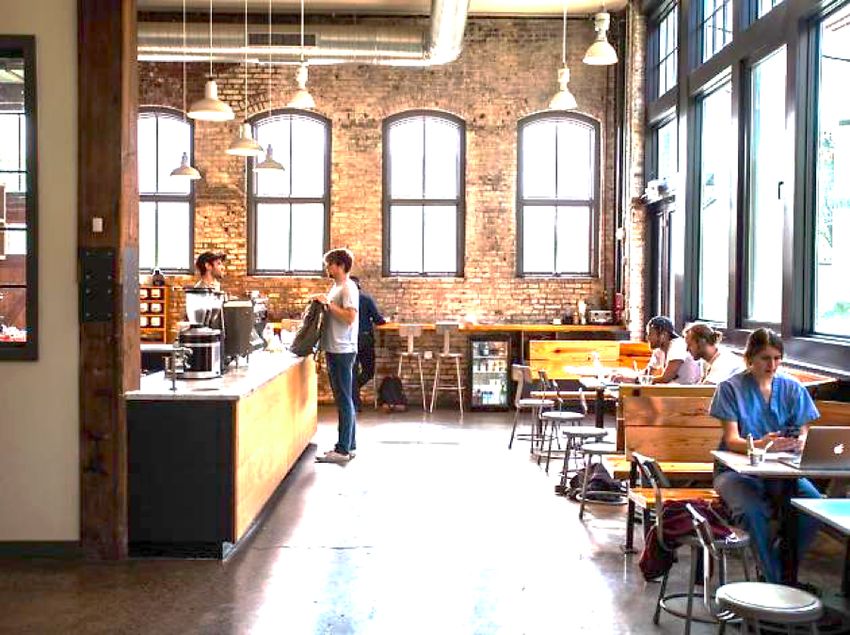
16* From the following images (Appendix D and E), which coffee Dim; Bright
shop would you be more likely to go to?
17 Which of the following do you prefer to consume your coffee Paper to-go cup; Mug
out of?
1218 What is your age? Open response
19 Please check the gender that is indicated on your birth Male; Female
certificate.
20 What gender do you currently identify as? Male; Female; Other
21 How do you describe your ethnicity? White/Caucasian; African American;
Hispanic; Asian; Other
22 Are you still actively working? Yes; No
23 What is your household income? Under $20,000; $20,001-$40,000;
$40,001-$60,000; $60,001-$80,000;
$80,001-$100,000; over $100,000
*For Question 16, the images of the coffee shops were identical, with the exception of the
lighting being changed, so that participants did not factor the interior design into their decision
(see Appendix D and E).
4. Key Results
4.1. Frequency of Coffee Consumption
Cross tabulation was used to compare the frequency counts across generational cohorts.
Results support that the Silent Generation consumes the greatest amount of coffee on both a
daily and weekly basis (see Tables 1 and 2). When asked to indicate the percentage of coffee
purchases that were specialty beverages, the Silent Generation indicated that 64% of their coffee
purchases were specialty, followed by Millennials (31.24%), Generation Z (29.86%), and
Generation X (29.75%), respectively (see Table 3). It should be noted that the representation of
the Silent Generation was limited to two participants, thus responses may not be a true
representation of the cohort as a whole. Millennials also had the highest percentage that value
sustainability in their coffee purchases, as they had a mean of 4.24 (see Table 4). Table 5
13indicates that the generation that began consuming coffee at the youngest age, on average, is
Generation Z, and the generation with the oldest average age is Generation X, which can
influence future coffee consumption behavior and frequency. Figure 3 shows that ready-to-drink
coffee-style beverages were not very popular among the participants, as each generation’s
highest preference was towards the “never consume” option. But, Millennials were the
generation that seem to favor RTD options the most, and older generations, specifically Baby
Boomers and the Silent Generation, had the lowest preference.
Figure 1: Daily Coffee Consumption
How many coffee drinks do you drink in a given day?
Figure 2: Weekly Coffee Consumption
How many times a week do you consume coffee?
14Table 3: Specialty Coffee Drink Consumption
What percentage of your coffee purchases in a week are specialty beverages?
Generation Mean Std. Deviation
Generation Z 29.86% 36.44%
Millennials 31.24% 30.66%
Generation X 29.75% 36.05%
Baby Boomers 15.21% 26.72%
Silent Generation 64.0% 48.08%
Table 4: Importance of Sustainability
When asked to indicate the importance of sustainable/organic ingredients on a scale of 1 (not
important) to 5 (very important)...
15Generation Mean Std. Deviation
Generation Z 3.71 1.33
Millennials 4.24 1.59
Generation X 3.75 1.69
Baby Boomers 3.24 1.87
Silent Generation 4.00 1.41
Table 5: Starting Age of Coffee Consumption
What age did you start regularly consuming coffee or coffee-style beverages (in years)?
Generation Mean Std. Deviation
Generation Z 15.56 0.92
Millennials 18.16 0.54
Generation X 20.53 0.76
Baby Boomers 17.97 1.18
Silent Generation 18.00 0.00
Figure 3: Ready-to-Drink Coffee Consumption
How frequently do you consume ready-to-drink coffee-style beverages?
164.2. Coffee Preparation
Coffee preparation preferences also differ between generations, and are important to
consider. Figure 4 indicates that participants from all generations prepare coffee at home, with a
large majority of younger generations preferring single service preparation (e.g., Keurig) and
older generations, specifically Baby Boomers, using drip machines. In addition, the younger the
generation, the higher the preference towards cold/iced coffee (see Figure 5) and towards paper
to-go cups over mugs (see Figure 6). Figure 7 indicates that all generations, with the exception of
Baby Boomers, had the highest preference towards Cup 3 in Appendix C. Baby Boomers largely
preferred Cup 1, which was the strongest coffee option. Another factor that needs to be
considered in terms of coffee preparation is that of what type of coffee-style beverages people
consume the most. Figure 8 reveals that lattes tend to be the most consumed coffee-style
beverage of all participants, and regular coffee is not as popular, as only fifty-one of the two-
hundred and fifty-two participants listed that as their first choice beverage.
17Figure 4: At-Home Coffee Preparation
What type of machine do you use when you prepare coffee at home?
Figure 5: Coffee Temperature Preference
Do you prefer hot or cold coffee (or coffee-style beverages), without taking into account the
temperature outside?
18Figure 6: Coffee Vessel Preference
Which of the following do you prefer to consume your coffee beverages out of?
Figure 7: Coffee Strength Preference
When looking at the image below (Appendix C), which cup of coffee do you prefer?
19Figure 8: Coffee Type Preference
What is the top coffee drink that you consume most frequently?
4.3. Consumption Environment
The results also help to reveal several ways that marketers in the coffee industry can
attract these generations with the use of sensory marketing in terms of their preferences towards
the consumption environment. Figures 9, 10, and 13 display the results from the questions that
focus on sensory marketing in regards to the coffee industry. While there are several instances
where most generations agreed with each other, for example Figure 9 reveals that bright lighting
was favored over dim lighting in a coffee shop among the participants, no matter the age (65.5%
preferred bright lighting), the generational differences for sensory marketing still need to be
analyzed. It can be seen that, for the most part, the older the generation, the higher the preference
for bright lighting, as only 57.1% of Generation Z preferred bright lighting compared to Baby
Boomers with 71.4% and the Silent Generation with 100.0% (see Figure 9). Additionally, the
20older the generation, the higher the preference for no background music in a coffee shop, as
Generation Z only had 7.1% who chose that option and the Silent Generation had 50.0%. While
most generations would choose to have chill music in the background, Millennials, Generation
X, and Baby Boomers all had a significant percentage of participants who chose the upbeat
music option (see Figure 10). Figure 11 indicates that each generation has a strong preference
towards either the drive-thru option or the grab-and-go option at coffee shops, preferring that
over staying in the coffee shop for an extended period of time. As seen in Figure 12, for factors
that influence purchasing decisions, each generation’s top factor was price, with the exception of
Baby Boomers who chose location as their top factor. Additionally, Generation Z’s top factors
are price, past experience, and flavor, and Millennials’ top factors are price, flavor, and location.
Finally, those who prefer a stronger cup of coffee have a higher preference towards bright
lighting in a coffee shop compared to those who prefer a weaker cup of coffee (see Figure 13).
Figure 9: Coffee Shop Lighting
From the following images (Appendix D and E) which coffee shop would you be more likely to
go to?
21Figure 10: Coffee Shop Background Noise
What kind of background noise do you prefer while at a coffee shop?
Figure 11: Coffee Shop Duration of Stay
When going to a coffee shop, how long do you usually stay?
22Figure 12: Coffee Shop Purchasing Factors
When choosing where to purchase your coffee from, which factor is most important to your
decision?
23Figure 13: Coffee Strength Preference vs. Coffee Shop Lighting
Which cup of coffee do you prefer vs. Which coffee shop would you be more likely to go to?
4.4. Millennials vs. Generation Z
24The survey results for both Millennials and Generation Z were analyzed using both cross
tabulation and a t-test analysis (for the questions comparing two means) in order to find out if
there was a significant difference between the two generational cohorts. Table 6 indicates that
the p-values (significance values) for every question when looking at the preferential differences
between Generation Z and Millennials are over 0.05, and, therefore, there is no significant
difference at the 5% level of significance. This is with the exception of one question that looked
into the age that participants started consuming coffee, which resulted in a p-value of .027,
meaning there is a significant difference in the responses for that question. Therefore, there is
hardly no significant difference between Millennials and Generation Z in terms of their coffee
preferences. Though, it needs to be considered that the sample size for Generation Z was much
lower than the sample size for Millennials, which may have had an effect on the results.
Table 6: Significance Values for Millennials vs. Generation Z
Question Generation Z Millennial Significance
Mean/Highest % Mean/Highest % Value
How many 16oz servings of coffee beverages do 1-2: 92.86% 1-2: 75.18% .466
you consume in a day?
How many times a week do you consume coffee? 7 or more: 42.86% 7 or more: .700
36.76%
What percentage of your coffee purchases in a Mean: 29.86% Mean: 31.24% .893
week are specialty beverages?
How frequently do you consume ready-to-drink Never: 71.43% Never: 54.01% .628
coffee-style beverages?
What age did you start regularly consuming Mean: 15.64 Mean: 18.16 .027
coffee?
To what extent do you agree with the following Mean: 3.71 Mean: 4.24 .183
statement: “Sustainable/organic ingredients
make a difference in terms of what type of coffee
25I order.”
Do you prefer hot or cold coffee? Hot/Cold: 42.86% Hot: 46.72% .510
Looking at the image below, which cup of coffee Cup 3: 35.71% Cup 3: 40.88% .588
do you prefer?
When you think of coffee beverages you Mean: 4.07 Mean: 3.80 .604
consume, to what extent are they prepared at
home compared to purchased away from home?
When choosing where to purchase your coffee 1/3: 28.57% 1: 29.93% .558
from, please rank what you use to make your
decision from most important (1) to least
important (6) - Price
When choosing where to purchase your coffee 2: 35.71% 3: 26.28% .854
from, please rank what you use to make your
decision from most important (1) to least
important (6) - Location
When choosing where to purchase your coffee 5: 57.14% 5: 34.31% .470
from, please rank what you use to make your
decision from most important (1) to least
important (6) - Brand Loyalty
When choosing where to purchase your coffee 2: 35.71% 4: 31.39% .332
from, please rank what you use to make your
decision from most important (1) to least
important (6) - Past Experience
When choosing where to purchase your coffee 3: 28.57% 5: 25.55% .864
from, please rank what you use to make your
decision from most important (1) to least
important (6) - Flavor
What kind of background noise do you prefer Chill: 92.86% Chill: 63.50% .079
while at a coffee shop?
From the following images, which coffee shop Bright: 57.14% Bright: 66.91% .463
would you be more likely to go to?
Which of the following do you prefer to consume Paper cup: Paper cup: .628
your coffee beverage out of, a paper to-go cup or 71.43% 64.96%
a mug?
265. Discussion and Implications
5.1. Discussion
The coffee industry is not only growing and becoming more prominent in American
society, but it is also rapidly expanding to include different products and trends each year. This
study verified the impact of these trends in the coffee industry, with a focus on premiumization,
convenience, and sustainability. This study also sought to support and expand upon previous
research on generational coffee preferences, with a specific analysis on Millennial and
Generation Z differences, due to the lack of research in this area. Once the generational
differences were defined, this study analyzed the factors that can influence generational
purchasing behavior and highlighted the impact of sensory marketing. This research allows for
several theoretical and practical implications to be made towards the coffee industry, with room
for future research to be done.
5.2. Theoretical Implications
This study investigated the generational differences in coffee-style beverages, seeking to
find if there was a prominent difference between Millennial and Generation Z consumers, as
many people fail to see the contrast in these two key generations. The results suggest several
theoretical implications.
First, this study looked into the impact of the current coffee industry on society, as it has
become even more prominent in recent years. The survey results support this idea, as with the
first survey question that asks how many coffee drinks participants drink in a given day, “1-2”
was the most frequently picked option (72.6% of all respondents chose this option) (see Figure
271). The results of the question which asked how many times a week the respondents consume
coffee also helps to show how prominent coffee is in our society, as the vast majority chose the
option that was “7 or more times” (43.3% of all respondents chose this option) (see Figure 2).
Second, prior studies have been completed looking into generational purchasing
behaviors, even that of coffee, but there is a lack of information that focuses on separating
differences between Millennials and Generation Z. Many studies will group these two
generations together, and will simply refer to them as “younger generations,” failing to
differentiate between the two. However, this study sought to separate these generations and
explore the differences between the two.
Third, with this lack of research on Millennial and Generation Z coffee preferences due
to previous studies not separating the two, it is believed by many that these generations share
similar, if not the same, preferences towards coffee-style beverages. This study aimed to find out
if there is a significant difference between their preferences towards the coffee industry, looking
into their opinions on specialty beverages, ready-to-drink beverages, sustainability in a coffee
application, convenience, and sensory marketing in terms of a coffee shop.
Fourth, this study looked into the factors that could potentially cause generations to make
different purchasing decisions from one another, as it is important to consider these factors and
not just state their differences. Specifically, the results that show the influential factors towards
purchasing decisions are that of the age that consumers started consuming coffee (see Table 5)
and the main reasons that they choose to go to a certain coffee shop, whether it be price, location,
brand loyalty, etc. (see Figure 12).
28Lastly, while several studies have analyzed generational purchasing behavior in the
coffee industry, there appears to be a lack of practical application of this research to marketers.
Therefore, this study examined ways that marketers could benefit from the results presented by
looking into generational preferences toward sensory marketing and how it could be incorporated
into coffee shop design.
5.3. Practical Implications
Sensory marketing is an important opportunity for coffee shops to utilize in order to
attract consumers, but it is important to keep in mind that generations differ slightly in their
likes/dislikes of this area. Sensory marketing can include changing the background noise, the
smell, the lighting and visuals, and more. This survey focused on two important aspects, music
and lighting. From the results, it can be seen that Generation Z largely prefers chill music in a
coffee shop. Millennials also prefer chill music, but had the highest percentage of preference for
upbeat music of all generations (see Figure 10). Therefore, a coffee shop may only want to play
upbeat music if they are wanting to attract Millennial consumers. Other than that exception,
coffee shops may want to choose chill music as their form of background noise, as that was the
option with the highest percentage overall across all generational cohorts. If a coffee shop is
wanting to target older generations, they will want to think about reducing the background noise
as much as possible, as they largely prefer no noise and a calmer environment to drink their
coffee in.
In terms of coffee shop lighting, the results also differ. Even though all generations
showed a preference towards bright lighting over dim, Generation Z had the highest percentage
that prefer dim lighting (see Figure 9). This can be attributed to the fact that they also tend to stay
29longer in a coffee shop, as they had the highest percentage that stays in the shop 30 minutes to 1
hour of all generations (see Figure 11). This makes sense because Generation Z desires
experience and connecting with others at a coffee shop, meaning they want a space that allows
for social interaction (Nation’s Restaurant News, 2016). Dim lighting invites customers to stay
longer, and bright lighting coincides more with a faster-paced coffee shop, as it focuses more on
the convenience aspect (Single Platform, 2018). So, a coffee shop may only want to consider dim
lighting if they are targeting Generation Z consumers. Research also shows that people who
prefer stronger coffee drink more coffee under bright lighting and those that prefer weaker coffee
drink more coffee under dim lighting (Spence & Carvalho, 2019). This could prove to be an
advantage to marketers, as the results of this study indicate that the higher the preference for
stronger coffee, the higher the preference for bright lighting, and the higher the preference for
weaker coffee, the higher the preference for dim lighting (see Figure 13). Thus, marketers will
want to keep this in mind when deciding on their lighting, as well, since this can help them to
increase their coffee sales.
According to an article by Ross Colbert, an expert in the Consumer Beverage Sector,
there are 5 key trends in the beverage industry right now: increased focus on health and wellness,
premiumization, convenience, direct to consumer offerings, and sustainability (Colbert, 2019).
The survey results provide support that these trends matter and are worth analyzing, especially
that of premiumization, convenience, and sustainability.
The trend of premiumization is important for coffee shops to understand, as ones with a
limited menu will likely not last long the more prominent that this trend becomes in our society.
Both Millennials and Generation Zers showed more of a preference for specialty beverages than
30other generations, but Millennials had a slightly higher preference (see Table 3). This is likely
due to the fact that Generation Z is more price-conscious, as they grew up in an economic
recession and are not yet at the age where they are receiving a steady income, so they would be
more inclined to purchase less expensive drink options (Young, 2019). Millennials also had the
most preference for RTD beverages among all generations (see Figure 3). This is important to
marketers of ready-to-drink coffee beverages, as they should know that Millennials will be their
primary consumers, and they will want to largely target those that fall under that age range. This
trend corresponds with the fast-paced lifestyle of Americans, creating a need for quick options,
especially in the morning. Furthermore, RTD coffees are consumed cold, piggy-backing on the
very popular iced coffee and cold brew coffee trends (Buono, 2017). Millennials are largely the
main reason that the ready-to-drink market is growing, along with the increased interest in cold
coffee brewing methods. But, since RTD coffees are largely consumed cold and are very
convenient, marketers have a major opportunity to expand more into the Generation Z market,
since Generation Z had the highest preference for cold coffee among all generations (see Figure
5). Similarly, the older the generation, the higher the percentage that chose the hot coffee option
in Figure 5, as Baby Boomers had 89.5% choose that option. These results are not surprising, as
iced coffee, including cold brews, is a recent trend. So, Generation Z would be more inclined to
have a higher preference for them compared to older generations, specifically Baby Boomers and
the Silent Generation, due to the fact that iced coffee is something they grew up with and are
more familiar with. Therefore, if a coffee shop is looking to add iced coffee or cold brew coffee
to their menus, they should know that Generation Z will be their main purchasers. The survey
results also reveal that premium coffee-style beverages are starting to be consumed even more
frequently than regular coffee, as Figure 8 shows that lattes were more popular among the
31You can also read