THE VISITOR EXPERIENCE AT FRANZ JOSEF GLACIER WESTLAND TAI POUTINI NATIONAL PARK NEW ZEALAND
←
→
Page content transcription
If your browser does not render page correctly, please read the page content below
THE VISITOR EXPERIENCE AT FRANZ JOSEF GLACIER
         WESTLAND TAI POUTINI NATIONAL PARK
                                NEW ZEALAND

                     RESULTS FROM THE 2013 VISITOR SURVEY

                                                         PREPARED FOR

        DEPARTMENT OF CONSERVATION, WEST COAST TAI POUTINI CONSERVANCY

                                                           PREPARED BY

                                    DR STEPHEN ESPINER & DR JUDE WILSON

                                               ESPINER CONSULTING (LTD)

                                                           MAY 29 2013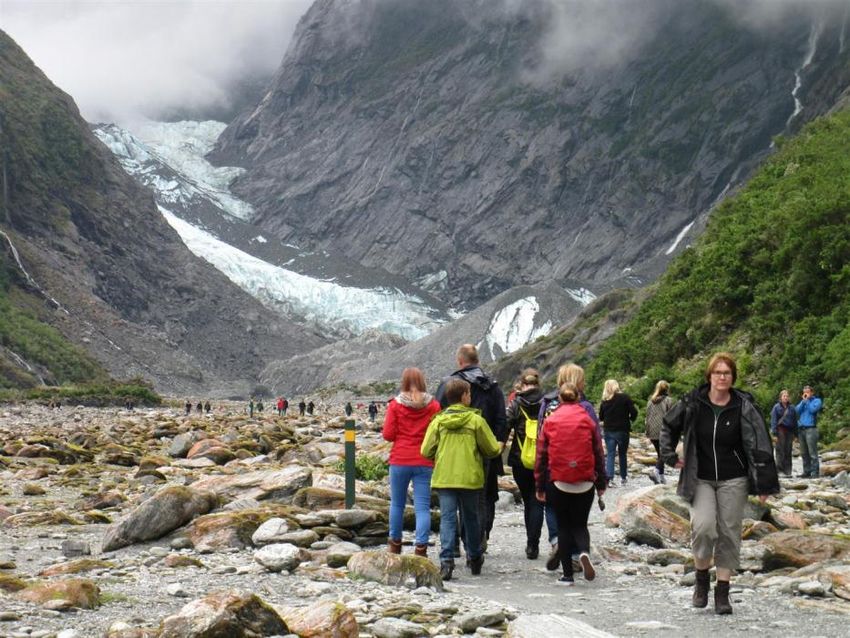
Acknowledgments
We wish to thank the many individuals who contributed their time by completing
questionnaires, and the Department of Conservation (DOC) West Coast Conservancy staff
who provided timely logistical assistance and advice. We are especially grateful to Ian
Wightwick, DOC Technical Advisor (Recreation), for his support throughout the project, and
to Michael Harbrow, Senior Advisor (Visitor), DOC Science and Technical Group, Wellington,
for his comments on the survey design.
Citation: Espiner, S.R., and Wilson, J.W. (2013). The visitor experience at
Franz Josef Glacier, Westland Tai Poutini National Park, New
Zealand: Results from the 2013 Visitor Survey. Report prepared for
the West Coast Conservancy, Department of Conservation, New
Zealand.
Key words: Satisfaction, crowding, visitor experience, Franz Josef Glacier, Fox
Glacier
Prepared for: West Coast Tai Poutini Conservancy, Department of Conservation
Prepared by: Dr Stephen Espiner and Dr Jude Wilson
Espiner Consulting (Ltd)
Date: 29 May 2013
Fieldwork: Jude Wilson, Karina Brennan Evans, Helen Lawrence & Joe Harrison
Contact details: Espiner Consulting
stephen@espiner.co.nz
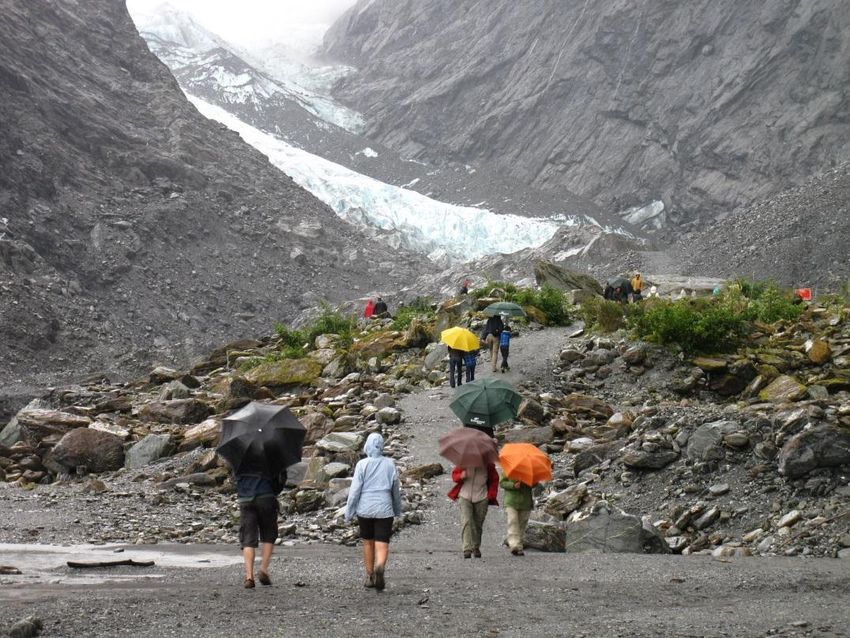
Photograph 1 (Cover) Visitors at Franz Josef Glacier on wet day (Jude Wilson)
Table of Contents

EXECUTIVE SUMMARY ....................................................................................................................... 3

INTRODUCTION.................................................................................................................................. 5

    BACKGROUND .......................................................................................................................................... 5

METHOD ............................................................................................................................................ 5

    SURVEY PERIODS & SURVEY SITES ................................................................................................................. 5
    SAMPLING ............................................................................................................................................... 6
    SAMPLE SIZE & MARGIN OF ERROR ............................................................................................................... 8
    ANALYSIS & REPORTING OF RESULTS ............................................................................................................. 8

RESULTS ............................................................................................................................................. 9
    ABOUT YOU ............................................................................................................................................. 9
      Q15 In which part of the world do you normally live? ..................................................................... 9
      Q16 In which part of New Zealand do you normally live? ............................................................. 10
      Q17 What is your gender? ............................................................................................................. 11
      Q18 Which age group are you in? ................................................................................................. 11
    ABOUT YOUR VISIT .................................................................................................................................. 13
      Q1 Have you visited the Franz Josef Glacier Valley before today? ................................................ 13
      Q2 On your visit today, how much time will you spend in the Franz Josef Glacier Valley? ............ 13
      Q3 Which parts of the Franz Josef Glacier Valley have you visited today? .................................... 14
      Q4 Who are you visiting with? ....................................................................................................... 15
      Q5 How many people are in your group? ...................................................................................... 15
      Q6 How many people in your group are aged under 18 years? ..................................................... 16
    WHAT ARE YOUR IMPRESSIONS OF THIS PLACE............................................................................................... 16
      Q7 What have you liked most about your visit to the Franz Josef Glacier Valley? ........................ 16
      Q8 What have you liked least about your visit to the Franz Josef Glacier Valley? ......................... 18
      Q9 Overall, how satisfied are you with your visit to the Franz Josef Glacier Valley today? ........... 20
      Q10 How satisfied are you with the services and facilities in the Franz Josef Glacier Valley? ....... 21
      Q11 Did you feel crowded during your visit to the Franz Josef Glacier Valley? (9-point scale) ..... 22
      Q12 Measuring and managing the visitor experience ................................................................... 25
      Q13 If there had been a service available to drive you from the car park to a safe viewing point
      near to the Glacier face, would you have used it today? ............................................................... 28
      Q14 If yes, how much would you be prepared to pay for this service? .......................................... 29
    CONCLUDING COMMENTS ......................................................................................................................... 29

REFERENCES ..................................................................................................................................... 32

APPENDICES ..................................................................................................................................... 33

    APPENDIX 1: MAP OF GLACIER WALKING TRACK & SURVEY SITES ...................................................................... 33
    APPENDIX 2: SAMPLING DETAILS ................................................................................................................ 34
    APPENDIX 3: SURVEY ............................................................................................................................... 35
    APPENDIX 4: FULL LIST OF RESPONDENTS’ COUNTRY OF RESIDENCE ................................................................... 39
    APPENDIX 5: CODING FOR ‘MOST LIKED’ ASPECTS OF VISIT............................................................................... 40
    APPENDIX 6: CODING FOR ‘LEAST LIKED’ ASPECTS OF VISIT............................................................................... 41

    2013 Franz Josef Visitor Survey                                                                                                                         1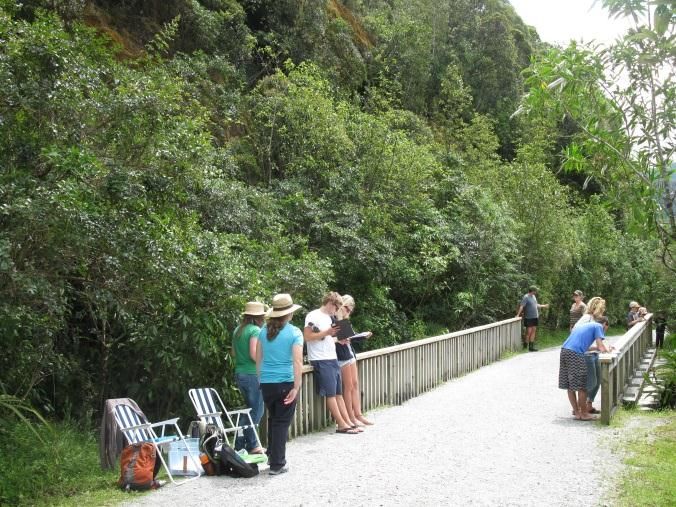
FIGURE 1 COUNTRY OF RESIDENCE OF SURVEY SAMPLE 2013 (N=524)                                                9
FIGURE 2 COUNTRY OF RESIDENCE OF SURVEY SAMPLE 2009 (N=385) & 2013 (N=524)                               10
FIGURE 3 NEW ZEALAND SAMPLE BY REGION & SURVEY PERIOD (N=77)                                             11
FIGURE 4 AGE DISTRIBUTION BY SURVEY PERIOD (N=523)                                                       12
FIGURE 5 AGE DISTRIBUTION BY SURVEY YEARS 2009 (N=387) & 2013 (N=523)                                    12
FIGURE 6 PREVIOUS VISITATION TO FRANZ JOSEF GLACIER VALLEY BY SURVEY PERIOD (N=525)                      13
FIGURE 7 TIME SPENT IN FRANZ JOSEF GLACIER VALLEY BY SURVEY PERIOD (N=514)                               14
FIGURE 8 PARTS OF FRANZ JOSEF GLACIER VALLEY VISITED BY SURVEY PERIOD (N=525) (*MULTIPLE ANSWERS POSSIBLE)
                                                                                                         14
FIGURE 9 NUMBER OF ‘MOST LIKED’ RESPONSES BY CATEGORY (N=698)                                            17
FIGURE 10 DIFFERENCES IN ‘MOST LIKED’ RESPONSES BY CATEGORY & SURVEY PERIOD (N=698)                      18
FIGURE 11 NUMBER OF ‘LEAST LIKED’ RESPONSES BY CATEGORY (N=427)                                          19
FIGURE 12 DIFFERENCES IN ‘LEAST LIKED’ RESPONSES BY CATEGORY & SURVEY PERIOD (N=427)                     20
FIGURE 13 SATISFACTION SCORES BY SURVEY PERIOD (N=524)                                                   21
FIGURE 14 SATISFACTION WITH SERVICES & FACILITIES                                                        22
FIGURE 15 EXPERIENCE OF CROWDING (N=524)                                                                 23
FIGURE 16 PARTS OF FRANZ JOSEF GLACIER VALLEY WHERE CROWDING EXPERIENCED BY SURVEY PERIOD (N=524)
     (*MULTIPLE ANSWERS POSSIBLE)                                                                        24
FIGURE 17 INTEREST IN USING A VEHICLE SERVICE TO THE GLACIER FACE (N=520)                                28
FIGURE 18 AMOUNT PREPARED TO PAY FOR A VEHICLE SERVICE TO GLACIER FACE (N=78)                            29

TABLE 1 DETAILS OF VISITOR REFUSALS (N=60)................................................................................................... 8
TABLE 2 LIKERT-SCALE SCORES FOR VISITOR EXPERIENCE STATEMENTS (GRAPHS SHOWING % OF RESPONDENTS)............. 25

PHOTOGRAPH 1 (COVER) VISITORS AT FRANZ JOSEF GLACIER ON WET DAY (JUDE WILSON) ......................................... 2
PHOTOGRAPH 2 FRANZ JOSEF VALLEY WALK CLOSED DUE TO FLOODING (JUDE WILSON) ............................................. 6
PHOTOGRAPH 3 SURVEYING AT ORIGINAL SURVEY SITE (JUDE WILSON) .................................................................... 7
PHOTOGRAPH 4 SURVEYING AT ADJUSTED SURVEY SITE (JUDE WILSON) ................................................................... 7
PHOTOGRAPH 5 BUSY DAY ON FRANZ JOSEF VALLEY WALK (JUDE WILSON) ............................................................ 24
PHOTOGRAPH 6 INTERPRETATION BOARDS AT SENTINEL ROCK LOOKOUT (JUDE WILSON).......................................... 31

    2013 Franz Josef Visitor Survey                                                                                                          2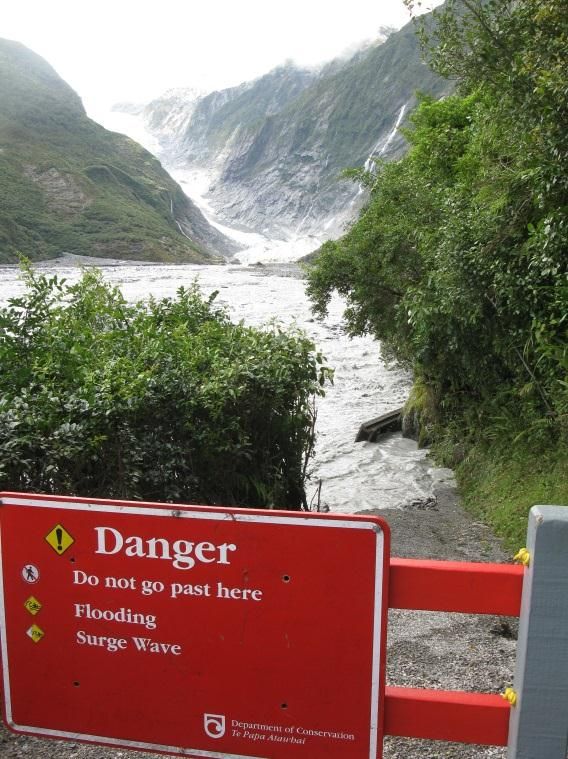
Executive summary

In order to monitor the quality of the visitor experience at Franz Josef Glacier Valley, Espiner
Consulting (Ltd) was commissioned by the Department of Conservation (DOC) West Coast
Tai Poutini Conservancy to develop and implement a questionnaire survey in the Franz Josef
Glacier Valley during the summer of 2012/13. A two-phase implementation strategy was
adopted, over which time a total of 525 surveys were completed.

Key findings

    1. Broadly reflecting the 2009 survey, visitors to the Franz Josef Glacier Valley were
       predominantly international in origin (85%), with the UK, other Europe and Australia
       the largest generating regions. Among New Zealand visitors, most visitors came from
       Auckland, Wellington and Canterbury. First-time visitors to Franz Josef remain the
       majority (78%).

    2. Visitors spent an average of 119 minutes (2 hours) in the valley. Feasible
       comparisons with 2009 data suggest that this represents a modest increase in visit
       duration, although there is some variation in the 2013 data due to the track closure
       over New Year which prevented public access to the track beyond the Forest Walk.

    3. While ‘the Glacier’ was commonly reported among the ‘most liked’ aspects of visits,
       respondents gave prominence to ‘overall scenic amenity’ and ‘the natural
       environment’. This suggests that, although the Glacier may be the region’s key
       attractant, the glacier valley experience extends well beyond the glacier itself. The
       quality of the tracks, clear sign-posting, free parking and the lack of development in
       the valley were also noted as positive elements of the experience.

    4. Most evident among visitors’ dislikes of the experience (cited in 44% of responses)
       were comments related to inability to get close to the glacier, its appearance
       (visibility and perceived dirtiness) and perceptions of crowding. Approximately 20
       per cent of responses specified ‘weather’ as a disappointment, and 8.9 per cent
       mentioned aircraft (including 8 respondents whose disappointment derived from
       their inability to take a flight because of unsuitable weather conditions).

    5. Using a single (‘overall’) measure, 87.6 per cent of visitors to Franz Josef Glacier
       Valley reported being ‘satisfied’ or ‘very satisfied’ with their experience. This
       represents a small decrease since the 2009 study (92%). When specific dimensions
       of experience are analysed, visitor satisfaction appears very high: car park (96%);
       signs and information panels (95%); Glacier Track (91%); and other tracks (93%).
       Only the toilet facilities (84%) fell below the 85 per cent indicator threshold.

   2013 Franz Josef Visitor Survey                                                             3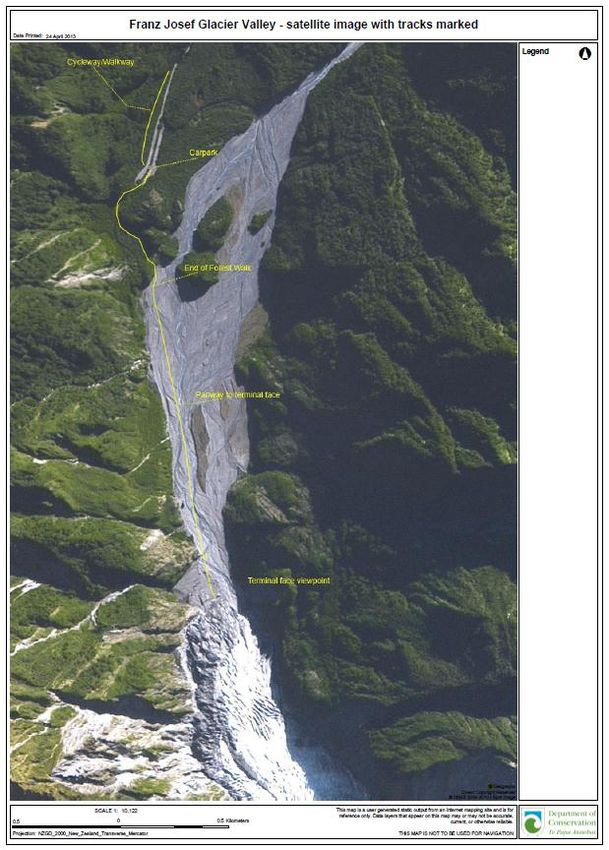
6. Using a single scale to measure crowding, half (51%) of respondents reported feeling
    crowded at some stage of their visit. Closer analysis shows that crowding was more
    likely to be experienced when the valley track was closed (as it was for two days in
    Phase 1 of the survey implementation), abbreviating the walk considerably.
    Common points of crowding appeared to be part-way along the Glacier Valley Walk
    (45%), the Glacier terminal face (35%), the car park (23%) and the Forest Walk
    (18%). It is important to emphasise that there is considerable variation in these
    crowding perceptions depending on the survey phase (see Question 11 for detail).
    This question was last asked in 2007, at which time 47 per cent of respondents felt
    some level of crowding during their visit.

 7. Measures of other social aspects of the Franz Josef Valley Walk indicate that most
    visitors felt safe walking on the tracks (97%), and were able to enjoy nature and
    scenery (97%) and natural peace and quiet (79%). Respondents were less likely to
    agree that the walk offered an opportunity to learn about the area’s landscape and
    geology (62%) or plants and animals (48%). To the extent that these are
    management objectives, such elements may require additional attention.

 8. In terms of the length of the current walk, three-quarters (76%) of respondents
    disagreed that a shorter access route would have been preferable, and 80 per cent
    indicated that they would have been happy to walk further to see the Glacier.
    Among the visitors surveyed, there appears to be limited support for additional
    mechanised access, with only 16 per cent of respondents agreeing that they would
    have liked a service to drive them from the car park to a safe viewpoint close to the
    Glacier. Similarly, most respondents (75%) indicated that the sight or sound of
    vehicles taking people closer to the Glacier via the valley floor would be
    unacceptable, and two-thirds (68%) did not believe that helicopter flights should be
    increased to allow more people to access the Glacier.

2013 Franz Josef Visitor Survey                                                             4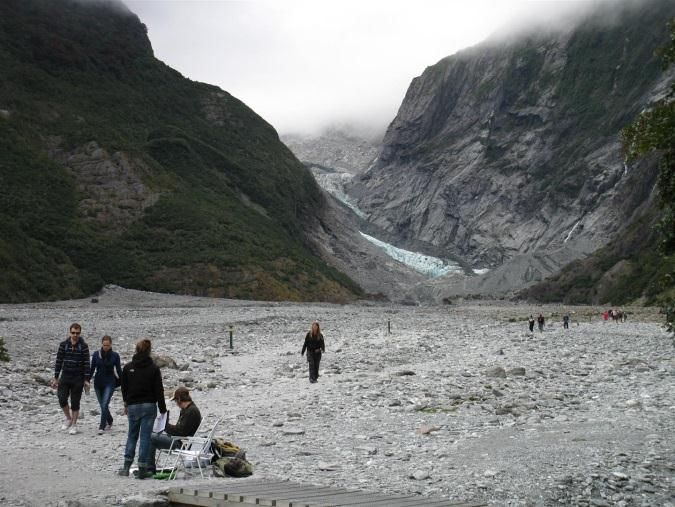
Introduction
Background
This survey has been designed to measure the quality of the visitor experience at Franz Josef
Glacier Valley. More specifically, it measures visitors’ satisfaction with their visit overall and
their satisfaction with the services and facilities in the valley along with their perceptions of
crowding. In addition, opinions around a broad range of experience characteristics (and
potential changes to these) are explored. Visitor data collected includes past visitation, visit
group characteristics and demographic data.

While the survey content is based on previous visitor surveys (undertaken in 2006, 2007 and
2009) it has been substantially changed this year to reflect recent changes to the
accessibility of the Franz Josef Glacier for guided groups, and to explore the levels of visitor
interest in, and potential impacts on the visitors experience, of further proposed changes.
Because of these changes to the survey content, limited comparison to results of previous
surveys is possible. The 2013 survey was in three sections:

        Section 1: About your visit

        Section 2: What are your impressions of this place?

        Section 3: About you

Method

Survey periods & survey sites
The 2013 survey took place over two periods: 27th December 2012 - 4th January 2013; 17th
February - 26th February 2013. Survey Period 1 was significantly disrupted by the weather
(with a severe storm on 2nd January bringing widespread flooding, including the closure of
the Franz Josef valley track for several days, and the closure of SH6 when a bridge was
washed away at Harihari); Survey Period 2 coincided with an extended period of fine
weather with no rain days. There were, however, a number of days with cloud.

The survey was run parallel to an Aircraft Monitoring Survey (conducted at both Franz Josef
and Fox Glacier Valleys) and the same survey site - beside the small footbridge just beyond
the end of the Forest Viewpoint - was used for both surveys in the Franz Josef Valley (see
Appendix 1). During the first five days of Survey Period 1 access was open to a viewpoint 500
metres from the terminal face of the glacier. The storm that followed shut down the valley
beyond the Forest Viewpoint (1500 metres from the terminal face) and for the final two
days the survey site was moved to the footbridge on the bush track just short of where it
forks to the Sentinel Rock track. The original survey site (i.e., on the riverbed just beyond the
Forest Viewpoint) was used during Survey Period 2; access to the terminal face was to the
viewpoint 500 metres from the terminal face. The return walk time from the car park to the
terminal face was approximately 1.5 hours; the return walk from the car park to Forest
Viewpoint was approximately 30 minutes.

   2013 Franz Josef Visitor Survey                                                               5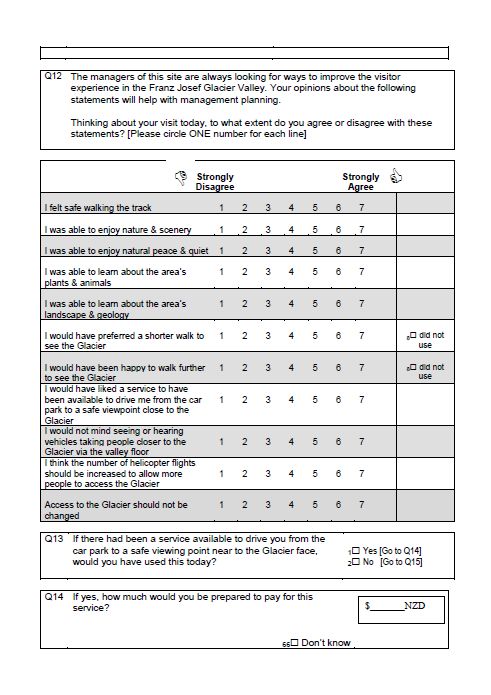
Photograph 2 Franz Josef Valley walk closed due to flooding (Jude Wilson)

Three surveyors were employed for each survey period, two of whom were present
throughout both survey periods. The surveyors were responsible for the distribution of both
surveys and the number present at the Franz Josef Glacier Valley survey site at any one time
varied depending on the weather and the level of aircraft activity (the Aircraft Monitoring
survey was only undertaken on days when there was aircraft activity, whereas the Visitor
Survey was possible on any dry day). The location of the surveyors was also determined by
the quota of surveys sought (the quota for the Visitor Survey was 400) with the surveyors
sometimes swopping between surveys in response to changing conditions. Surveying took
place at varying times between 10am and 5pm and care was also taken to ensure that the
Visitor Survey was spread over both fine and more marginal weather days. Altogether, there
were four days on which only the Visitor Survey was undertaken and ten days when
surveyors distributed both surveys. Full details of survey dates, surveying distribution and
weather conditions are shown in Appendix 2.

Sampling
In order to ensure that survey respondents had spent sufficient time in the valley to form an
impression of the place, only those visitors returning from the Franz Josef Glacier valley walk
were approached and asked if they would participate in the survey. Hence, the survey
sample does not include any visitors who remained in the car park, nor (for the most part)
any visitors who might have returned to the car park before reaching the end of the Forest
Walk. The sample is also limited to those visitors aged 15 years and over. On occasion all
the people in the group approached were given a survey, but usually the number of people
in each visit group asked to complete the survey varied based on logistic considerations
(e.g., how many surveys the surveyors already had out) and on which surveys were

   2013 Franz Josef Visitor Survey                                                            6
underway (e.g., if both this survey and the Aircraft Monitoring surveys were running and a
couple was approached they were each given a different survey).

The surveyors introduced themselves by name, explained that they were doing visitor
surveys for the Department of Conservation, and asked the person/people they had
approached if they had a few minutes to complete a survey. All surveyors wore Department
of Conservation name badges. Respondents were given a survey form, clipboard and pen
and asked to self-complete the survey form. The surveyors were on hand to assist if
necessary. The four page survey took most respondents around 10 minutes to complete (a
copy of the survey can be found in Appendix 3).

                     Photograph 3 Surveying at original survey site (Jude Wilson)

                    Photograph 4 Surveying at adjusted survey site (Jude Wilson)

  2013 Franz Josef Visitor Survey                                                            7
Sample size & margin of error
Altogether, a total of 525 surveys were completed: 211 surveys (40%) in Survey Period 1 and
314 (60%) in Survey Period 2.
An error margin, at the 95% confidence interval, of ±4.0% is estimated for the visitor survey
(n=525). As the sample design was more complex than a simple random sample (on which
this error is calculated), this is an estimate only.
Across all survey days, a total of 60 visitors who were approached declined to be surveyed.
Given the convenience sampling method employed this does not indicate a response rate. A
record of these refusals was kept with surveyors recording details of the person’s age,
gender, country of residence and reason for refusal (Table 1). ‘Other’ reasons for refusal
included needing the toilet, feeling ill, having small children to supervise and not having
glasses with them.
Table 1 Details of visitor refusals (N=60)
Descriptor Details Percentage (N=60)
Age 15-29 years 30.0
30-49 years 28.3
50-69 years 35.0
70+ years 5.0
Gender Male 70.0
Female 30.0
Country of residence New Zealand 6.7
Overseas 93.3
Reason No time 23.3
Not interested 28.3
Language difficulties 38.3
Other 10.0
Analysis & reporting of results
Survey data were entered into an Excel spread sheet during each survey period. These data
were later transported into SPSS for analysis. For each question, data were analysed for
frequencies, mean scores (for scale items), and - where relevant - by survey period. The
data was analysed by survey period because of the notable differences in weather
conditions and the associated changes in accessibility of the various walking tracks.
The design and implementation of the survey instrument was consistent with the
Department of Conservation’s Social Monitoring Standard Operating Procedure (SOP) and,
where feasible, results are reported against the standards set out in that document. As
noted above, because of substantial changes to the survey questions, limited comparison is
possible with previous surveys. Data describing the sample characteristics are compared
across survey years.
Because not all surveys were complete, and because of the differences in sample size in each
survey period, all results are presented as percentages (N=number completing that question
in all results reported).
2013 Franz Josef Visitor Survey 8Results
The following section first presents the results from the demographic data (Section 3: About
you), followed by the visit data (Section 1: About your visit) and then the data describing the
visitor experience (Section 2: What are your impressions of this place?). Within each section,
individual questions are reported in the order in which they appeared in the survey. The
report concludes with a discussion section (Concluding comments) in which key results
(collected from individual questions) are analysed more generally in order to describe the
visitor experience at the Franz Josef Glacier Valley.
About You
Q15 In which part of the world do you normally live?
The 2013 survey respondents lived in 35 different countries. As Figure 1 shows, the largest
single group were from the UK (N=96), followed by Australia (N=87) and then New Zealand
(N=77). Although New Zealanders represented only 14.7 per cent of the sample overall, they
represented a much higher proportion in Survey Period 1 (21.8%) compared to Survey
Period 2 (9.9%). Visitors from Germany and Other Europe combined represented almost one
third of all visitors in the sample (N=169); the most common countries of residence in ‘Other
Europe’ were France (N=20), the Netherlands (N=17) and Sweden (N=10). Asian visitors were
poorly represented in the sample (N=13): four of these were from China, three each from
India and Hong Kong and one each from Singapore, Japan and Taiwan. Altogether, 14 of the
visitors from the Americas were from Canada, four from Brazil and the others from other
South American countries. A full list of respondents’ countries of residence is shown in
Appendix 4.
Country of residence of survey
sample (%)
18.3 17.9
16.6
14.7 14.3
10.5
4
2.5
1 0.2
Figure 1 Country of residence of survey sample 2013 (N=524)
2013 Franz Josef Visitor Survey 9The comparison of country of residence between 2009 and 2013 shows an increase in the
percentage of visitors from USA, Germany and Other Europe and a decrease in visitors from
the UK, the Netherlands and Canada (Figure 2). These findings are consistent with changes in
international visitors to New Zealand as a result of the global recession. The percentage of
visitors surveyed from New Zealand, Australia, Switzerland and Asia was the same.
Country of residence 2009 & 2013 (%)
2009 2013
27
1717 18
1515 14 15
10 11
9
5 6
4 3 3
2 2 2 2 2 1
Figure 2 Country of residence of survey sample 2009 (N=385) & 2013 (N=524)
Q16 In which part of New Zealand do you normally live?
In 2013 those respondents who lived in New Zealand were also asked in which region they
lived. As might be expected, the majority of New Zealand visitors were from Auckland (N=26,
33.8%), Wellington (N=18, 23.4%) and Canterbury (N=15, 19.5%). There was some variation
in the distribution of New Zealand visitors by survey period (Figure 3).
2013 Franz Josef Visitor Survey 10New Zealand sample by region (%)
Survey Period 1 Survey Period 2
37
32.3
28.3 29
16.1
12.9
10.9
8.7
6.5
2.2 3.2 2.2 3.2 2.2 3.2 2.2
Figure 3 New Zealand sample by region & survey period (N=77)
Q17 What is your gender?
In the 2013 sample, gender distribution among respondents was very evenly split with 49.6
per cent males (N=260) and 50.4 per cent females (N=264). Similar gender distribution was
reported in 2009. In 2013 there were slightly more males (50.7%) in Survey Period 1 and
slightly more females (51.1%) in Survey Period 2.
Q18 Which age group are you in?
The sample can be divided almost equally between those aged over and under 35 years, a
feature more or less consistent across both survey periods. As Figure 4 shows, Survey Period
2 had a bi-modal age distribution with a greater concentration of both younger and older
visitors. In comparison, the sample in Survey Period 1 was heavily skewed towards younger
visitors (particularly those aged 25-34 years).
2013 Franz Josef Visitor Survey 11Age distribution by survey period
25
15-19 yrs
20 20-24 yrs
25-29 yrs
Percentage
15 30-34 yrs
35-39 yrs
10
40-44 yrs
5 45-49 yrs
50-54 yrs
0 55-59 yrs
Survey Period 1 Survey Period 2
Figure 4 Age distribution by survey period (N=523)
Figure 5 shows that the 2013 sample was younger than that surveyed in 2009. In 2013, for
example, 52 per cent of respondents were aged 20-39 years (compared to only 40% in 2009)
and 43 per cent were aged over 40 years (55% in 2009).
Age distribution 2009 & 2013 (%)
2009 2013
31
27
21 20 19
15 16
13 12
9
4 5 4 3
15-19 yrs 20-29 yrs 30-39 yrs 40-49 yrs 50-59 yrs 60-69 yrs 70+ yrs
Figure 5 Age distribution by survey years 2009 (N=387) & 2013 (N=523)
2013 Franz Josef Visitor Survey 12About your visit
Q1 Have you visited the Franz Josef Glacier Valley before today?
In 2013, first-time visitors accounted for 78.7 per cent of the sample, a figure highly
consistent with the 2009 report (79%). As Figure 6 shows, a greater percentage of first-time
visitors were surveyed during Survey Period 2. This is most likely related to the higher
percentage of New Zealand visitors encountered in Survey Period 1.
Previous visitation to Franz Josef
90
80
70
60
Percentage
50
40
30
20
10
0
Survey Period 1 Survey Period 2 Total sample
Repeat 26.5 17.8 21.3
First-time 73.5 82.2 78.7
Figure 6 Previous visitation to Franz Josef Glacier Valley by survey period (N=525)
Q2 On your visit today, how much time will you spend in the Franz Josef Glacier
Valley?
Altogether, three quarters of the sample (75.5%) spent two hours or less in the Franz Josef
Glacier Valley (7.4% of those spent less than one hour). While a similar percentage of the
2009 sample reported staying two hours or less (69%), a much larger proportion of those
visitors stayed less than one hour (22%). Beyond this it is difficult to compare the 2013
length of visit data with that collected in 2009: the 2009 survey included people who
reported staying overnight and for several days in the wider Franz Josef area, rather than
time spent up the valley. In 2013, the range of time spent was between 15 minutes and 10
hours with a mean visit time of two hours.
Overall, visitors surveyed in Survey Period 1 had shorter visits. This difference can be
explained by the conditions encountered: of the five survey days in Survey Period 1 only one
was characterised by perfect visit conditions; two days had marginal weather conditions;
and the other two were days when the Glacier Valley Track was closed beyond the Forest
Viewpoint. Figure 7 shows the most common visit times by survey period.
2013 Franz Josef Visitor Survey 13Time spent in Franz Josef
Glacier Valley
40
35
30 1 hour
Percentage
25 1.5 hours
20
2 hours
15
3 hours
10
5 Other
0
Survey Period 1 Survey Period 2
Figure 7 Time spent in Franz Josef Glacier Valley by survey period (N=514)
Q3 Which parts of the Franz Josef Glacier Valley have you visited today?
The closure of the Glacier Valley Track (and Robert’s Point Track) after the storm on 2nd
January is also reflected in the parts of the Franz Josef Glacier valley visited (Figure 8).
Parts of Franz Josef Valley visited*
100
Walkway/Cycle path from
90 village
80 Forest Walk to riverbed only
70
Partway along Glacier Valley
60 walk
Percentage
Full length of Glacier Valley
50 walk
40 Robert's Point Track
30
Sentinel Rock Lookout
20
On to the Glacier (heli-hike)
10
0 Other
Survey Period 1 Survey Period 2
Figure 8 Parts of Franz Josef Glacier Valley visited by survey period (N=525) (*Multiple answers possible)
2013 Franz Josef Visitor Survey 14In Survey Period 1, 54 per cent of respondents reported walking only as far as the Forest Viewpoint (where the barrier was located for two days of the survey period). This restriction on the glacier walk also increased visitation on the Walkway/Cycle path from the village and to the Sentinel Rock Lookout. During Survey Period 2, when the Glacier Valley walk was fully accessible, 92 per cent of visitors walked the full length of the track. Overall, 68.8 per cent (N=361) of respondents walked the full length of the Glacier Valley walk, 28.8 per cent (N=151) visited Sentinel Rock Lookout and 13.5 per cent (N=71) used the Walkway/Cycleway from the village. It is difficult to compare these results with the 2009 survey as different location options were included in the question and a different survey site was used. In 2009, 39 per cent of visitors surveyed had visited both the Sentinel Rock Lookout and ‘the Barrier before the riverbed’, while 36 per cent reported visiting ‘the rope barrier half way up the river bed’. A photograph included in the 2009 report indicates that the survey site was at the footbridge close to the car park; this survey site was only used for the two days when the valley was closed in 2013 (see Appendix 1 for Map showing visit and survey locations; Appendix 2 for sampling details). Q4 Who are you visiting with? Almost all respondents (N=508, 96.9%) were visiting as private parties (friends, family, self), another result highly consistent with the 2009 sample (94% private). Of the other groups reported: in Survey Period 1, four were commercial or guided and one non-commercial club or organisation; in Survey Period 2, three were commercial or guided, two were with a non- commercial club or organisation, four education groups and two were ‘others’ (doing research). Q5 How many people are in your group? Overall, almost two-thirds (N=312, 65.9%) of the sample were visiting with one other person, with just under a quarter (N=123, 23.4%) visiting in three or four person groups. A greater proportion of three and four person groups surveyed in the Survey Period 1 (29.9% compared to 23.4% in Survey Period 2) most probably reflects the higher percentage of New Zealand visitors who were more likely to be travelling in family groups. 2013 Franz Josef Visitor Survey 15
Q6 How many people in your group are aged under 18 years?

Only 6.5 per cent (N=34) of the total sample were visiting with children aged under 18 years.
To a large extent this reflects a limitation of the sampling method and the difficulty securing
people with young children for interviews. The majority (82%) of those visiting with people
in their group aged under 18 years were surveyed in Survey Period 1 (N=28, 13.2%) - again,
this probably reflects the higher proportion of New Zealand families surveyed during this
survey period (during the school holidays). The proportion of Australian visitors was also
higher in Survey Period 1 (20.4% compared to 14.1% in Survey Period 2) which may also
have been families travelling with children during school holidays.

What are your impressions of this place

Q7 What have you liked most about your visit to the Franz Josef Glacier Valley?

Altogether, 487 respondents recorded 698 things they liked ‘the most’ about their visit to
the Franz Josef Glacier Valley. These responses were coded according to the following five
categories (Figure 9):

    1. Natural environment - included any responses which noted specific features of the
       natural world (e.g., waterfalls, rocks, bush, and so on) but the glaciers were not
       specifically noted
    2. Glacier related - any comments in which the glaciers were specifically mentioned
    3. Facilities and activities - comments that referred explicitly to activities in the area
       including tracks (other than the glacier one) and facilities (information, toilets, and
       so on)
    4. Overall scenic amenity - broader more generic comments made about the
       experience (e.g., views, scenery, landscapes, and so on)
    5. Other - any comments that did not fit the above categories

A full list of responses included in each category can be found in Appendix 5.

 2013 Franz Josef Visitor Survey                                                             16
Number of 'most liked' responses
by category
195 203
180
96
24
Natural Glacier related Facilities & Overall scenic Other
environment activities amenity
Figure 9 Number of ‘most liked’ responses by category (N=698)
The majority of responses (83%) were fairly evenly split between the natural environment
(26%), the glaciers (28%) and overall scenic amenity (29%).
Three quarters of the ‘Overall scenic amenity’ comments referred to the ‘scenery’ and the
‘views’; others commented on the ‘spectacular’ and ‘dramatic’ environment and the
‘beauty’ of the area.
Over half of the ‘Glacier related’ responses were unspecified, i.e., people simply wrote ‘the
glaciers’ or the ‘views of the glaciers’. More specific glacier related comments included liking
the easy accessibility of the glacier, enjoying the walk up to see the glacier and the fact that
access was free. Hearing the ice crack, seeing the blue ice, the sounds and scale of the
glacier was also enjoyed, as was seeing a glacier for the first time.
The ‘Natural environment’ comments covered a wide variety of natural features. Apart from
the people who simply wrote ‘nature’, the natural feature most often mentioned was
waterfalls (by 62 respondents). Other aspects of the natural environment frequently noted
were: weather related (enjoying the sunshine, being grateful that it was not raining); flora
(bush, rainforest); rocks, stones or geological features; and fresh air.
The most often reported ‘Facility and activity’ comments referred to enjoying walking on the
tracks (although the glacier track was not specifically mentioned) and appreciating the
quality of the tracks and clear signposting. The lack of development in the valley was also
liked, along with the easy and free parking available and the overall cleanliness and care
taken to manage the area.
‘Other’ comments were primarily generic, with respondents noting that they liked
‘everything’, ‘the whole experience’, and the ‘friendly people’. Several respondents liked the
fact that the Franz Josef village was not over developed.
2013 Franz Josef Visitor Survey 17When examined by survey period, there was some variation in the focus of the ‘most liked’
features reported (i.e., the proportion of comments assigned to each category) (Figure 10).
Also, within each category, the specific comments varied (reflecting the nature of the visit
experience and the conditions encountered). The closure of the glacier valley track in the
first survey period, for example, generated more generic ‘natural environment’ comments
and fewer ‘glacier related’ ones.
Differences in 'most liked' responses
by survey period
Survey Period 1 Survey Period 2
31.6%
27.2%
23.8%
13.9%
3.4%
21.5% 30.9% 13.6% 30.4% 3.5%
Natural Glacier related Facilities & Overall scenic Other
environment activities amenity
Figure 10 Differences in ‘most liked’ responses by category & survey period (N=698)
Q8 What have you liked least about your visit to the Franz Josef Glacier Valley?
Altogether, 401 respondents recorded 427 things they ‘liked the least’ about their visit.
These responses were coded according to the following five categories (Figure 11):
1. Aircraft - any mention of aircraft made
2. Glacier experience - any comments in which the glaciers were specifically noted
3. Nothing - coded if respondents had specifically recorded a comment about disliking
‘nothing’ (e.g., ‘none, N/A, all good)
4. Westland NP experience - broader comments referring to the overall experience
with no specific reference to the glaciers
5. Natural environment - comments referring to the natural environment (e.g., the
weather, insects)
A full list of responses included in each category can be found in Appendix 5.
2013 Franz Josef Visitor Survey 18Number of 'least liked' responses
by category
186
89 87
38
27
Aircraft Glacier Nothing Westland Natural
experience National Park environment
experience
Figure 11 Number of ‘least liked’ responses by category (N=427)
Altogether, almost half (44%) of respondents’ ‘least liked’ comments included a specific
reference to their glacier experiences. Not being able to get close enough to the glacier and
crowding were the most common issues. Quite a few comments related to the quality of the
glacier view including: the colour of the ice; the presence of rocks on the glacier; the
dirtiness of the ice; the fact that the ice was retreating; the lack of visible ice; that it was not
as good as on a previous visit; that it didn’t look as good as in photographs they had seen;
and that it did not compare well to other glaciers they had visited. A number of respondents
commented on the number of other visitors crossing the safety barriers; others thought the
health and safety precautions were too restrictive.
‘Natural environment’ dislikes mostly related to the weather with rain and cloud mentioned
most often.
Those reporting ‘Aircraft’ as a ‘least liked’ aspect of their visit primarily commented on the
annoyance of constant helicopters and their noise, although 8 of the aircraft comments
related to disappointment with the cancellation of planned helicopter activities due to
unsuitable weather conditions.
Similar to the ‘most liked’ comments, when examined by survey period, there was some
variation in the focus of ‘least liked’ features reported (i.e., the proportion of comments
assigned to each category) (Figure 12). Also, within each category, the specific comments
varied (reflecting the nature of the visit experience and the conditions encountered). While
not being able to get close to the glacier was the most common complaint in the first survey
period, this was noted in respect of the glacier valley being closed because of flooding,
whereas in the second survey period it was noted more generically (and more often).
Likewise, the large number of ‘natural environment’ comments in the first survey period also
related to the poor weather, the rain and the subsequent flooding. The majority of weather
comments made in the second survey period were related to cloudy conditions
(compromising views and restricting helicopter activities). More aircraft comments in the
second survey period reflect the higher number of days with aircraft activity.
2013 Franz Josef Visitor Survey 19Differences in 'least liked' responses
by survey period
Survey Period 1 Survey Period 2
34.3% 33.1%
21.7%
6.6% 4.2%
10.3% 49.4% 20.3% 7.7% 12.3%
Aircraft Glacier Nothing Westland Natural
experience National Park environment
experience
Figure 12 Differences in ‘least liked’ responses by category & survey period (N=427)
Q9 Overall, how satisfied are you with your visit to the Franz Josef Glacier Valley
today?
Overall satisfaction was measured on a 7-point scale where 1= ‘very dissatisfied’ and 7=
‘very satisfied’. The mean satisfaction score in 2013 was 5.77, compared with 6.14 in 2009.
When the scale scores are collapsed (1-3 = dissatisfied; 5-7 = satisfied), it is possible to
conclude that 87.6 per cent of respondents were satisfied with their visits. This represents a
decrease from 2009, when 92 per cent of visitors said they were satisfied.
These data ought to be examined in conjunction with the responses to perceived crowding,
and the most and least liked aspects of the visit. It is also important to emphasise that there
is some variation in satisfaction scores according to the time of the visit, the place of
residence and whether or not respondents had visited Franz Josef Glacier previously. For
instance, satisfaction was slightly higher in second survey period (Figure 13) – a finding likely
to be related to the closure of the Franz Josef Glacier Valley Track and the weather
conditions encountered by respondents in Survey Period 1. Those visiting Franz Josef Glacier
for the first time were less likely (86.1%) to report being satisfied than those who had visited
previously (93%). This finding appears to contradict the wider research literature (see, for
example, Manning, 2011), where satisfaction is typically highest among first time visitors to
recreation sites. In the present case, it is possible that the high proportion of international
visitors, coupled with expectations created through extensive tourism marketing campaigns
has led to imagery that no longer matches the reality at Franz Josef Glacier.
2013 Franz Josef Visitor Survey 20Notwithstanding these interpretive remarks about the possible decline in visitor satisfaction
at Franz Josef Glacier, it is also important to emphasise that the overall satisfaction score is
still comfortably above the nominal management target of 85 per cent (DOC, 2006). Overall
satisfaction scores are a useful indicator to measure over time, but may be less valuable for
management than specific satisfaction attributes related to services and facilities
Satisfaction scores by survey
period (%)
Survey Period 1 Survey Period 2
86.2 88.5
8 4.8 5.7 6.7
1-3 4 5-7
Satisfaction scores [1-3=dissatisfied; 4=neutral; 5-7=satisfied]
Figure 13 Satisfaction scores by survey period (N=524)
Q10 How satisfied are you with the services and facilities in the Franz Josef Glacier
Valley?
Mean satisfaction scores for services and facilities ranged from 6.4 (car park) to 5.81
(toilets), with satisfaction scores of 6.29 for signs and information panels, 6.12 for the glacier
track and 6.14 for other tracks (Figure 14). While this question was also asked in 2009
different categories of facilities were included.
2013 Franz Josef Visitor Survey 21Satisfaction with services & facilities
70
60
Percentage 50
40
30
20
10
0
Carpark Signs & Toilets Glacier Track Other tracks
(N=487) information (N=254) (N=502) (N=222)
panels
(N=513)
1 [Very dissatisfied] 2 3 4 5 6 7 [Very satisfied]
Figure 14 Satisfaction with services & facilities
In both 2009 and 2013, many respondents indicated that they had not used the toilet
facilities and this is reflected in the number of respondents reporting a satisfaction score for
toilets (e.g., only 48.4 per cent of the sample in 2013 and 41 per cent in 2009). In 2013, only
42.3 per cent of respondents gave a satisfaction score for ‘other tracks’.
Individually, all the facilities scored above the ≥85 per cent satisfaction score with the
exception of toilets (84.1%). This was a fall since 2009 when the overall satisfaction score for
toilets was 89 per cent. There were several negative comments relating to the toilet facilities
given in response to Question 8 (‘what have you liked the least about your visit?); these
included ‘lack of soap’ and ‘lack of toilet paper’, and ‘no toilet at glacier walk’ (close to
glacier).
Q11 Did you feel crowded during your visit to the Franz Josef Glacier Valley? (9-
point scale)
Crowding was measured on a 9-point scale, the most widely used tool for assessing this
social impact (Manning, 2001). Although the crowding scale is a relatively simple measure of
perceived crowding, it is useful in identifying whether or not crowding is interfering with
recreationists’ experiences, and ultimately where and when this occurs (Shelby, Vaske &
Heberlein, 1989).
In the current study, 50.6 per cent of all respondents reported experiencing some degree of
crowding (‘crowding’ was measured by the number of respondents scoring a 3 or higher on
the crowding scale) (Figure 15). This question was last asked in 2007, at which time 47
percent of respondents reported some level of crowding during their visit.
2013 Franz Josef Visitor Survey 22Experience of crowding
30
25
20
Percentage
15
10
5
0
1 2 3 4 5 6 7 8 9
1= not all all crowded; 3-4= slightly crowded; 6-7= moderately
crowded; 9= extremely crowded
Figure 15 Experience of crowding (N=524)
A higher proportion of respondents reported experiencing crowding during Survey Period 2
(56.9%) compared to Survey Period 1 (41%), although crowding was highest (71%) for those
respondents visiting on the two days in Survey Period 1 when the valley track was closed.
All respondents selecting a score of 3 or higher on the crowding scale were also asked to
indicate the locations at which they felt the most crowded. Figure 16 shows the most
crowded locations reported by survey period. These reflect the conditions encountered and
the tracks that were open during each survey period. In Survey Period 1, the two most
crowded locations reported were the Forest Walk to the riverbed (34.5% of respondents)
and part way along the Glacier Valley walk (21.4% of respondents). In Survey Period 2, 56.1
per cent of respondents reported crowding partway along the Glacier Valley walk and 37.4
per cent reported crowding at the Glacier viewpoint (rope barrier).
The widespread and consistent use of the 9-point crowding scale internationally has allowed
the development of crowding ‘standards’ (Corbett et al., 2007). For instance, Shelby et al.
(1989) used 50 per cent of visitors feeling crowded as a threshold for management action,
and 65 per cent as the carrying capacity.
2013 Franz Josef Visitor Survey 23Parts of Franz Josef Glacier Valley
where crowding experienced*
60
Walkway/Cycle path from
village
50
Forest Walk to riverbed
40 Partway along Glacier
Valley walk
Percentage
At the Glacier viewpoint
30 (rope barrier)
In the car park
20 Sentinel Rock Lookout
On the Glacier (heli-hike)
10
Other
0
Survey Period 1 Survey Period 2
Figure 16 Parts of Franz Josef Glacier Valley where crowding experienced by survey period (N=524) (*Multiple
answers possible)
Photograph 5 Busy day on Franz Josef Valley walk (Jude Wilson)
2013 Franz Josef Visitor Survey 24Q12 Measuring and managing the visitor experience
Using a 7-point Likert-type scale (where 1= ‘strongly disagree’ and 7= ‘strongly agree’),
Question 12 sought respondents’ opinions about a range of statements describing the visitor
experience and potential changes to this. For ease of comprehension, the agreement
statement findings are presented contiguously (Table 2). This is followed by a short
interpretation of these results.
Table 2 Likert-scale scores for visitor experience statements (graphs showing % of respondents)
Statement 1 2 3 4 5 6 7
Strongly disagree Strongly agree
I felt safe
walking the 75
tracks
(N=520)
Mean = 6.64
17.9
0.2 0.2 0.6 1.7 4.4
1 2 3 4 5 6 7
I was able to
enjoy nature 66
& scenery
(N=521)
Mean = 6.51 24.2
6.7
0.2 0.2 0.8 1.9
1 2 3 4 5 6 7
I was able to
enjoy natural 35.8
peace & quiet
(N=520) 22.3
21
Mean= 5.53
8.8
6.3
1.9 3.8
1 2 3 4 5 6 7
2013 Franz Josef Visitor Survey 25Statement 1 2 3 4 5 6 7
Strongly disagree Strongly agree
I was able to 22
learn about 19.6
the areas 16.2 15.4
plants & 12.9
animals 9.5
(N=505)
4.4
Mean = 4.43
1 2 3 4 5 6 7
I was able to
learn about
the area’s 24.4
landscape & 17.6 19.4 18
geology 12.7
(N=505)
5.1
2.8
Mean = 4.86
1 2 3 4 5 6 7
I would have
preferred a
50.2
shorter walk
to the glacier
(N=502)
16.5
Mean = 2.41 9.4 8.6 7.4
4 4
1 2 3 4 5 6 7
I would have
been happy to
walk further 53.4
to see the
Glacier
(N=513)
16.6
9.9
Mean = 5.82 4.5 2.3 3.3
1 2 3 4 5 6 7
2013 Franz Josef Visitor Survey 26Statement 1 2 3 4 5 6 7
Strongly disagree Strongly agree
I would have
liked a service to
have been 66.5
available to drive
me from the car
park to a safe
viewpoint close 12.6
4.8 4.8 3.3 2.5 5.4
to the Glacier
(N=517)
1 2 3 4 5 6 7
Mean = 1.95
I would not mind
seeing or hearing 54.3
vehicles taking
people closer to
the Glacier via
the valley floor
13.4
(N=521) 7.1 7.1 8.6
4.4 5
Mean = 2.43
1 2 3 4 5 6 7
I think the
number of
helicopter flights 41
should be
increased to 20.6
allow more 15.1 12.2
people to access 4.1 4.1
2.9
the Glacier
(N=490)
1 2 3 4 5 6 7
Mean = 2.57
Access to the
Glacier should 38.7
remain as it is
now 19.1 17.4
(N=512) 10.7
5.1 3.9 5.1
Mean = 5.33
1 2 3 4 5 6 7
2013 Franz Josef Visitor Survey 27There is very strong agreement among respondents that the walking tracks in the Franz
Josef Valley feel safe (M=6.64) and nature and scenery were able to be enjoyed (M=6.51).
There is strong, but slightly less agreement that the valley affords opportunity to experience
natural quiet (M=5.53). Views appear divided on whether ‘learning about plants and
animals’ was possible (M=4.43), with approximately one third (30.1%) disagreeing with this
statement.
Visitors disagree (M=2.41) that ‘a shorter walk to the Glacier’ would have been preferable,
with three-quarters of respondents (76.1%) disagreeing with this statement. Similarly, 80
per cent agreed that they would have been happy to walk further to see the Glacier.
Furthermore, most visitors surveyed (83.9%) did not like the idea of a service taking people
from the car park to a safe viewpoint close to the Glacier (M=1.95).
In terms of changes to mechanised access to Franz Josef Glacier, visitors also appear to hold
clear views. Three quarters (74.8%) indicated that seeing or hearing vehicles taking people
closer to the Glacier via the valley floor would negatively affect their visit (M=2.43); and
more than two thirds (68.3%) disagreed that the number of helicopter flights should be
increased to allow more people to access the Glacier (M=2.57). Another two thirds (66.8%)
agreed that ‘access to the Glacier should remain as it is now’ (M=5.33).
Q13 If there had been a service available to drive you from the car park to a safe
viewing point near to the Glacier face, would you have used it today?
The majority of respondents (84%) stated that they would not have used a vehicle service to
drive them to the Glacier face had one been available (Figure 17).
Interest in using a vehicle service to
the Glacier face
Yes, 81,
16%
No, 439, 84%
Figure 17 Interest in using a vehicle service to the Glacier face (N=520)
There was a slightly higher percentage answering ‘yes’ in Survey Period 1 (17.4%) than in
Survey Period 2 (14.4%).
2013 Franz Josef Visitor Survey 28Q14 If yes, how much would you be prepared to pay for this service?
Altogether, 81 people answered yes to Q13. When asked what they would pay, the amounts
ranged from $0 to $75. The most common amount people were prepared to pay was $15
(13 people). Three people reported wanting the service but were not prepared to pay
anything for using it; 15 did not know what they would pay (Figure 18).
Amount prepared to pay for a vehicle
service to Glacier face
16
Number of respondents
14
12
10
8
6
4
2
0
0 4 5 15 20 25 30 35 40 45 50 60 75 Don't
know
New Zealand$
Figure 18 Amount prepared to pay for a vehicle service to Glacier face (N=78)
Concluding comments
It is highly apparent from the variety of responses to open-ended and closed choice
questions posed in this survey that visitors enjoy the walk up to the Glacier. Responses to
the distance statements in Question 12 suggest that most would not prefer it to be shorter,
and almost 80 per cent would be happy for the walk to be longer. Furthermore, ‘glacier
related’ comments did not stand out above and beyond other categories among the ‘most
liked’ features of visits, with greater prominence given to more generic elements of the
valley experience (nature and all its component parts - especially waterfalls). Thus, while the
opportunity to view the glacier is a major motivating force for visitors to the region, it
remains one feature of a broader outdoor recreation experience that is notable because of
its accessibility (both financial and physical) and is perhaps unique for that reason alone.
Among the factors that appeared to have the greatest negative impact on the visitor
experience, several were weather-related. In particular, the visitor experience was
compromised when the valley track was closed due to flooding which, in turn, led to
increased reports of crowding. Weather events were also reflected in the ‘least liked’
comments, although visitors were typically more understanding of this (in respect of
2013 Franz Josef Visitor Survey 29disappointment at not being able to get closer to the glacier) than they were when conditions appeared favourable and yet they were unable to get close enough to the glacier because of the rope barriers. While some of the reported crowding can be linked to the weather-related track closures, crowding has the potential to compromise the visitor experience in all conditions. In the present study, approximately half of all visitors reported some degree of crowding, and this is something that managers will want to monitor carefully. The international literature (see Corbett et al., 2007; Manning, 2011; Shelby, Vaske & Heberlein,1989) indicates that a ‘high normal’ level of crowding begins at 50 per cent, and is the point at which managers might consider intervention options to avoid visitor access and displacement problems. In reference to the possibility of the current track being shortened in the future, it is important to acknowledge the fact that perceived crowding increased on the days when the Glacier Valley track was closed, and hence shorter. This may serve as a reminder that the walking track actually ‘needs’ to be long enough to enable visitors to spread out. Despite a small decrease in overall satisfaction since the 2009 study, satisfaction remains above the level at which management is likely to consider action. As noted in the discussion around the results to Question 9, the open-ended comments reported in the ‘most liked’ and ‘least liked’ aspects of their visit suggest that satisfaction may be associated with a wide variety of interrelated factors, including the timing of their visit, the weather experienced, prior expectations of the glacier experience itself and whether or not they are first-time visitors. In Survey Period 1, for example, many of the least liked comments relating to the weather were not directly focused on the glacier experience, but rather on the weather’s negative impact on their broader visit experience. Further, while it was noted that, for some international visitors, the reality of the Franz Josef Glacier experience did not match the promotional imagery to which they had been exposed, the open-ended responses provided in Question 8 highlighted a number of other ‘expectation shortcomings’ which may contribute to lower satisfaction levels. These included respondents who had viewed glaciers in other locations and found Franz Josef to be ‘not as good’, and disappointment (and dismay) at seeing a retreating glacier, a lack of ice and not seeing a ‘full view’ of the glacier from the accessible lookout points. Some repeat visitors noted that the glacier was less attractive than on previous visits. There also appears to be an expectation of a more accessible glacier experience, permitting much closer access to - and even onto- the glacier as independent (and non-paying) visitors; there was some resentment that full glacier access is only available as a commercial (and often expensive) activity. While it will be important to monitor satisfaction levels regularly, managers might consider how to respond to specific elements of satisfaction raised here. For example, although respondents reported a high level of satisfaction with the signs and information panels that are currently in place, there does appear to be a desire (expressed in the open-ended ‘least liked’ responses to Question 8 and the lower mean agreement scores for statements about these in Question 12) by visitors to have more information about the landscape, the glacier retreat, flora, fauna, geology and so on. 2013 Franz Josef Visitor Survey 30
You can also read