A descriptive analysis of the impact of COVID-19 on Emergency Department attendance and visit characteristics in Singapore
←
→
Page content transcription
If your browser does not render page correctly, please read the page content below
A descriptive analysis of the impact of COVID-19 on
Emergency Department attendance and visit characteristics
in Singapore
Mei Qiu Lim ( limmeiqiu@u.duke.nus.edu )
Duke-NUS Medical School
Fahad Javaid Siddiqui
Duke-NUS Medical School
Nan Liu
Duke-NUS Medical School
Seyed Ehsan Saffari
Duke-NUS Medical School
Sherman Wei Qiang Lian
Singapore General Hospital
Boon Kiat Kenneth Tan
Singapore General Hospital
Nicole Simin Sim
Singapore General Hospital
Yuzhen Shen
Singapore General Hospital
Marcus Eng Hock Ong
Duke-NUS Medical School
Research Article
Keywords: Emergency department attendance during COVID-19, emergency department visit characteristics during
COVID-19, emergency department attendance, emergency department visit characteristics, COVID-19
Posted Date: January 22nd, 2021
DOI: https://doi.org/10.21203/rs.3.rs-149642/v1
License: This work is licensed under a Creative Commons Attribution 4.0 International License. Read Full License
Page 1/21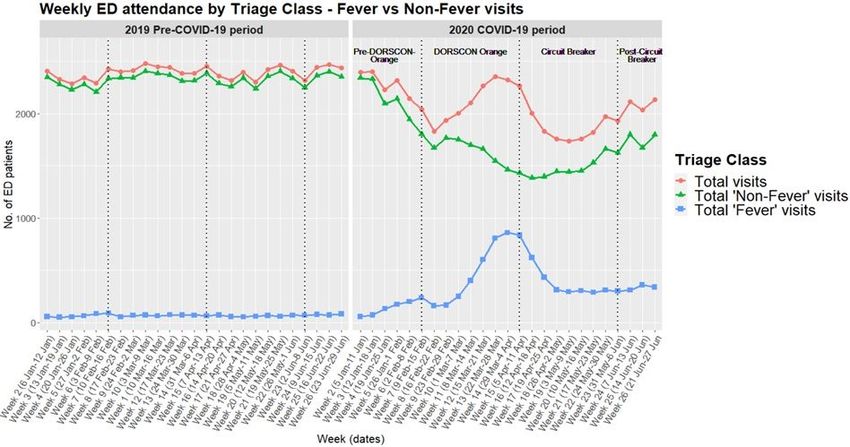
Abstract
Introduction: It is yet to be understood how COVID-19 impacted utilisation of Emergency Department (ED) services in
Singapore. This study aimed to describe the changes in attendance of a single ED and corresponding patient visit
characteristics and outcomes before and during the COVID-19 period.

Methods: In a single-centre retrospective cohort study, we used descriptive statistics to compare ED attendance, patient
demographics and visit characteristics during the COVID-19 period (1 January – 28 June 2020) and its corresponding
historical period in 2019 (2 January – 30 June 2019).

Results: Mean ED attendance decreased from 342 visits/day in the pre-COVID-19 period, to 297 visits/day in the COVID-
19 period. This was accompanied by reductions in P1 visits and presentations in nearly every ICD-10-CM diagnosis
category except for respiratory-related diseases. We also noted a shift in ED patient case-mix from ‘Non-fever’ cases to
‘Fever’ cases, likely giving rise to two distinct trough-to-peak visit patterns during the pre-Circuit Breaker and Circuit
Breaker period. Average ED admission rate during the Circuit Breaker period (48.3%) was higher as compared to pre-
Circuit Breaker period (40.7%), however average daily admission remained stable.

Conclusion: The COVID-19 pandemic caused a reduction in SGH ED attendances amongst patients with low-acuity
conditions and those with highest priority for emergency care. This raises concern about treatment-seeking delays and
possible impact on health outcomes. Our data provides insights that may be useful for ED crowd management planning
in the post-COVID-19 era. There should be cautious use of ED admission rate as a metric in evaluating ED performance
during an outbreak.

Introduction
It is yet to be understood how the coronavirus disease 2019 (COVID-19) impacted utilisation of Emergency Department
(ED) services in Singapore. The resulting changes in the utilisation of medical services for non-COVID-19 emergencies
and urgent health needs can lead to undesirable health consequences1,2. They should be further investigated to formulate
appropriate policy responses.

As with all outbreaks, the Emergency Department (ED) has been the primary portal of entry into hospitals for COVID-19
patients3-5. Despite the surge in suspected COVID-19 cases, there is global evidence to show that the Emergency
Department (ED)’s overall daily attendance has declined6-11. Several studies have reported significant reductions in visits
associated with time-sensitive and life-threatening conditions such as acute myocardial infarction and stroke12-15. This
reduction suggests either the decrease in incidence of diseases during the pandemic or a worrying trend of patients with
acute medical conditions failing to seek critically needed hospital care13,16.

The ED at Singapore General Hospital (SGH) saw Singapore’s first COVID-19 case on 23 January 2020. Subsequently,
rising numbers of unlinked infected cases prompted two major national interventions to curb the spread of COVID-19 in
the community17. The first raising of the risk assessment of COVID-19 to Disease Outbreak Response System Condition
(DORSCON) Orange18 on 7 February 2020 caused widespread fear and panic in the public19. The second was the
implementation of Circuit breaker, a partial lockdown on public movement, on 7 April 2020, as Singapore observed the
peak of daily incidence in April. While COVID-19 fatality rates in Singapore remain one of the lowest globally, the city-state
nevertheless experienced huge spikes in infections. The local government was aggressive in public education efforts,
encouraging residents to stay home and exercise social responsibility, which prevented hidden pockets of infected cases
from affecting others in the community. The close coordination of different healthcare sectors at the national level
allowed accessible public healthcare services even during the pandemic as definitive steps were taken to ensure that the
healthcare system has sufficient capacity to care for clinically unwell patients at peak infection rates20. At the time of
                                                          Page 2/21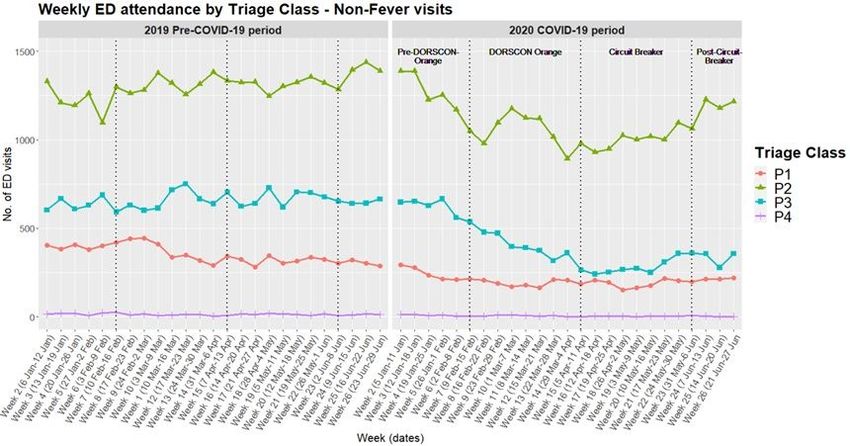
writing, the spread of COVID-19 has largely slowed down, and Singapore is undergoing the second phase of a three-
phased approach to re-open the economy and resume social activities in a careful and calibrated manner21.

Nevertheless, it is not known whether Singapore has been spared from the global phenomenon of declining ED visits,
despite having an effective national response to infection, prompt debunking of misinformation through various
government communication channels and easy accessibility of healthcare services during the pandemic. With residents
largely complying with social distancing measures in Singapore22, we speculate that a similar trend of decline in ED
attendances for both non-emergent and acute life-threatening conditions would be observed. This descriptive study
aimed to understand how attendance of a single ED and corresponding patient visit characteristics have changed during
the COVID-19 period as compared to the pre-COVID-19 period, describing observed impact of COVID-19 on medical care,
resource allocation and patient outcomes. We hypothesise that the impact of COVID-19 outbreak on the utilisation of ED
healthcare services at the Singapore General Hospital (SGH) varies by patient demographics, acuity of illness and clinical
reason for attendance.

Materials And Methods
Study design and setting

Singapore General Hospital (SGH) is one of Singapore’s largest and oldest acute tertiary hospital with 1785 beds in total
and its Emergency Department (ED) sees approximately 130,000 patients annually4.

In a retrospective study cohort, we compared and described SGH ED attendance, patient demographics and visit
characteristics during the COVID-19 period (1 January – 28 June 2020) and its corresponding historical period in 2019 (2
January – 30 June 2019). The studied COVID-19 period was chosen as it represents the changes in ED attendance over
the course of time, revealing trends specific to the Pre-Circuit Breaker period and Circuit Breaker period. The pre-Circuit-
Breaker period includes both Pre-DORSCON-Orange and DORSCON Orange periods.

Data source and extraction

Routine and administrative data on ED attendances were extracted from the electronic health intelligence system
(eHINTS) at SGH ED. Collected data fields were gender, age, nationality, ethnicity, mode of arrival, patient acuity category
(PAC), disposition and clinical reason for attendance. This was a service evaluation study which did not require further
ethical deliberation by SingHealth Centralised Institutional Review Board (CIRB Ref: 2020/2470).

Patient acuity category (PAC) triage system

The patient acuity category (PAC) triage system is used to assign ED patients a specific level of priority for medical
attention based on the acuity and severity of their presenting complaints. The four main levels of PAC status are; Priority
1 (P1) for critically ill patients who require immediate resuscitation; Priority 2 (P2) for non-ambulant patients in stable
condition and do not require resuscitation but must be initially treated in the hospital; Priority 3 (P3) for ambulant patients
with acute symptoms which may be treated by ED physicians or primary care providers; Priority (4) for patients with non-
emergent conditions which are more appropriately managed in primary health care setting. Febrile patients in different
acuity categories were labelled as P1F, P2F and P3F and they share the same priority levels as their non-fever
counterparts.

Study variables

Twelve disposition descriptions were condensed into two categories, admitted, or not admitted. Multiple categorical
variables were created for age, nationality, ethnicity, mode of arrival, ED disposition and clinical reason for ED attendance.

                                                          Page 3/21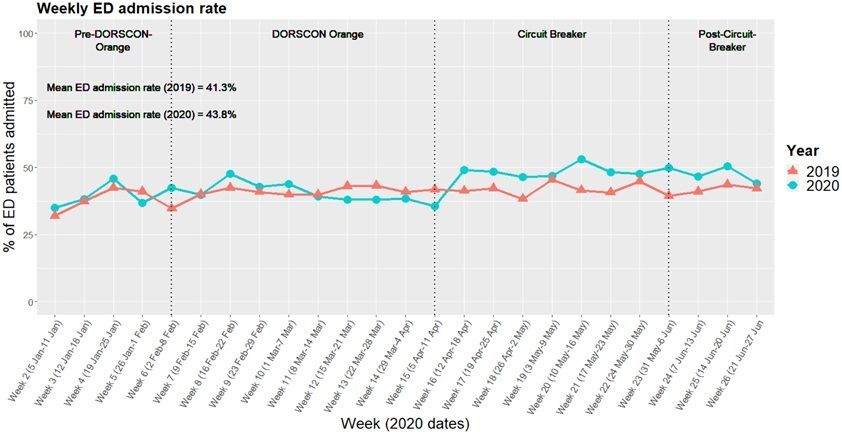
Age was condensed into 8 categories – 0-10, 11-14, 15-24, 25-34, 35-44, 45-54, 55-64, ≥65. Twenty-two ethnicities were
condensed into 4 categories – Chinese, Malay, Indian and Others. All nationalities were condensed into 2 categories –
Singapore citizens and non-citizen. Fifteen modes of arrival were condensed into 3 categories – Non-ambulance,
Singapore Civil Defence Force (SCDF) public ambulance and private ambulance.
SNOMED CT to ICD-10 Conversion for ED diagnosis
In our dataset, ED diagnoses were coded and classified according to the Systematized Nomenclature of Medicine Clinical
Terms (SNOMED CT). As International Classification of Diseases, Tenth Revision, Clinical Modification (ICD-10-CM) codes
are oriented more for statistical data collection, SNOMED CT codes were converted to ICD-10-CM and mapped to twenty-
one broad ICD-10-CM categories using the SNOMED CT to ICD-10-CM Map provided by the National Library of
Medicine23. Only the first matched ICD-10-CM code was kept in instances where multiple possible matches of ICD-10-CM
codes to one SNOMED CT code.
Statistical analysis
ED attendance was reported as mean (and standard deviation and range). Variables with skewed distribution, such as
age, was reported as median (and low and upper quartile, Q1 and Q3). The comparison of categorical variables between
pre-COVID-19 and COVID-19 periods were tabulated as frequency reduction and percentage change. A sub-analysis
comparing ED attendances and admission rates in different acuity categories during the pre-Circuit-Breaker period (1
January – 6 April 2020) and Circuit breaker period (7 April – 1 June 2020) was also tabulated. Weekly ED attendance and
admission rate were plotted over time for clear visualisation of respective trends over various phases. Plotted attendance
was stratified by febrile status and acuity categories. All data were de-identified before data processing and analysis in R
software (v4.0.0)24.
Results
ED visit records selected for analysis
Out of 120,209 ED visits records extracted, 1029 visit records outside of our study period were excluded. Further exclusion
of 4072 duplicate records and 12 distorted records left us with 115,096 ED visit records for analysis; pre-COVID-19 period
had 61,576 visit records; COVID-19 period had 53,520 visit records (Figure 1).
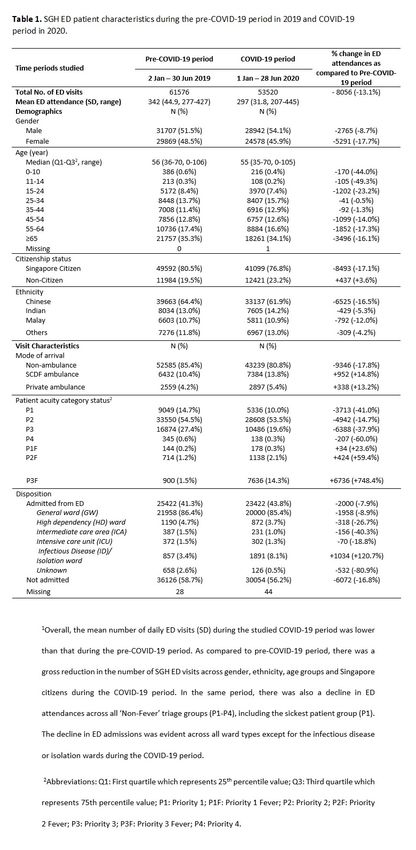
Patient demographics and visit characteristics
Table 1 shows the gross reduction in the number of ED visits at SGH across gender, ethnicity, age groups and Singapore
citizens. The median (Q1, Q3) age during the pre-COVID-19 period and COVID-19 period was similar, with 56.0 (36.0-70.0)
and 55.0 (35.0-70.0), respectively. Although there was proportional decline across age groups, we observed the largest
percentage reductions in visits by children aged below 10 years (44.0%) and 11-14 years old (49.3%). While Singapore
citizen ED attendance fell by 17.1% (41,099 vs 49,592 baseline), non-citizen ED attendance went up by 3.6% (12,421 vs
11,984 baseline), accompanied by a 3.7% increase in proportion (23.2% vs 19.5% baseline). Moreover, total numbers of
SCDF (public) and private ambulance arrival increased, contributing to a 4.6% increase in proportion of ambulance
arrivals (19.2% vs 14.6% baseline) during the COVID-19 period.
Page 4/21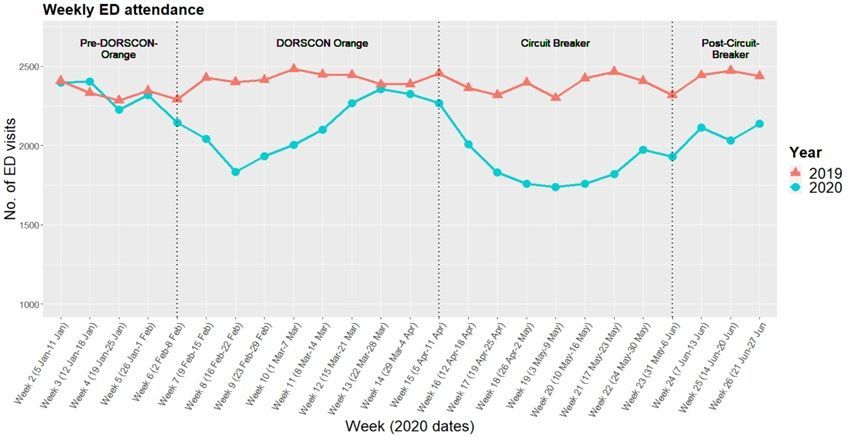
Two-phase ED attendance trend

Overall, the mean number of daily ED visits (SD) during the COVID-19 period was 297 (31.8), lower than that during the
pre-COVID-19 period (342, 44.9) (Table 1). Within the COVID-19 period, the national tally of daily infected cases started
relatively small during the pre-Circuit Breaker period (Figure 2). Thereafter, the tally rocketed to its highest during the
Circuit Breaker period. Figure 3 illustrates a two-phase ED attendance trend experienced at SGH ED within the COVID-19
period. The first phase and second phase represent visit trends during the pre-Circuit Breaker period and Circuit Breaker
period, respectively.

First phase of ED attendance trend

Approximately one week before DORSCON Orange initiation (2 February – 8 February 2020, Week 6), there was a
noticeable drop of 6.4% in weekly ED attendance (2144 vs 2291 baseline) as compared to the same week in 2019 (Figure
3). The initial downward trend in ED attendance was largely driven by the decrease in ‘Non-Fever’ visits (Figure 4). The
                                                          Page 5/21
subsequent sharp returning of ED attendance (Figure 3) corresponded with the rising numbers of “Fever” visits (Figure 4),
even though the national tally of daily infected cases was relatively low below a hundred (Figure 2). Weekly ED
attendance peaked during the last week of March, almost reaching pre-COVID-19 numbers in the same week.
Second phase of ED attendance trend
SGH ED experienced its second fall in attendance where both number of ‘Fever’ and ‘Non-Fever’ visits were declining
(Figure 3, Figure 4). The steepest drop occurred during 3 May - 9 May 2020 (Week 19), where a 27.4% dip in ED visits was
observed relative to the same week in the pre-COVID-19 period (Figure 3). This time, the new low persisted over a longer
period than what was observed in the pre-Circuit Breaker period, despite having record-breaking daily numbers of local
infected cases (Figure 2). Nevertheless, as the nation was halfway through Circuit Breaker, we observed a slow and
steady climb in SGH ED attendance that was visually distinct from the surge in the first phase (Figure 3). This gradual
recovery coincided with the rise in total ‘Non-Fever’ visits and a relatively constant number of ‘Fever’ visits (Figure 4).
Following the end of Circuit Breaker and the start of a three-phased approach to resume activities safely, ED attendances
continued to show signs of gradual recovery to baseline numbers (Figure 3).
Sub-group analysis of ED attendance by ‘Non-Fever’ and ‘Fever’ triage categories
Overall, ED attendances declined across all ‘Non-Fever’ triage groups (Figure 5). There were 4.7% and 7.8% reductions in
the proportion of Priority 1 (P1) visits (10.0% vs 14.7% baseline) and Priority 3 (P3) visits (19.6% vs 27.4% baseline),
respectively (Table 1). The proportion of P3 patients had the greatest decline over the COVID-19 period, reaching its
lowest numbers during the Circuit Breaker phase (Figure 5). In contrast, Table 1 demonstrates an increase in ED attendees
across all ‘Fever’ triage groups. Of note, there was 8.5 times more (7636 vs 900 baseline) Priority 3 Fever (P3F) ED
attendances during the COVID-19 period as compared to the Pre-COVID-19 period.
Clinical reason for ED attendance
Among 115,096 visit records, we excluded 2545 records (2.2%) with no documentation of diagnosis code in our analysis
of diagnoses. The remaining 112,551 visit records had a total of 143,995 documented SNOMED CT diagnosis codes. Out
of these, approximately 3000 documented diagnosis codes (2%) were not mapped to ICD-10 categories and these were
excluded from our analysis.
The decline in ED attendance was accompanied by decreases in nearly every diagnosis category except for diseases of
the respiratory system, which had a 9.8% increase in proportion of total recorded diagnoses (17.2% vs 7.4% baseline)
(Table 2). The greatest reduction in proportion was seen in the diagnostic category that covers injury, poisoning and
certain other consequences of external causes, with 2.6% reduction in proportion to total recorded diagnoses (9.9% vs
12.5% baseline).
Page 6/21Page 7/21
ED admission

Overall, the total number of ED admissions decreased by 7.9% during the COVID-19 period (Table 1). The decline was
evident across all ward types except for the infectious disease or isolation wards, which saw an increase of 4.7% in
proportion of admitted patients (8.1% vs 3.4% baseline). The ED admission rate represents the fraction of ED visits that
resulted in admission. The average ED admission rate during the pre-COVID-19 and COVID-19 periods were comparatively
similar (43.8% vs 41.3% baseline). However, a closer look at weekly ED admission trend during the Circuit Breaker period
revealed higher ED admission rates (Figure 6). The average ED admission rate was 48.3% during the Circuit Breaker
period, higher than the average ED admission rate of 40.7% that was observed during the pre-COVID-19 period (Table 4).
We noted a greater decline in average daily attendances of ‘Non-Fever’ triage groups during the Circuit Breaker period as
compared to preceding months, but the average number of ED admissions per day remained unchanged. In contrast,
average daily attendance of P3F patients increased slightly but a higher proportion of them were admitted during the
Circuit Breaker period as compared to pre-Circuit Breaker period.

                                                         Page 8/21
Discussion
Key findings
Since the beginning of the COVID-19 outbreak, the overall number of SGH ED visits and admissions have dipped as
compared to corresponding pre-COVID-19 period. There was also a proportional decline in visits for all diagnosis
categories, except for complaints related to the respiratory system which more than doubled during the COVID-19 period.
Notably, there were fewer visits and presentations for all diagnostic categories by SGH ED’s highest priority P1 group. This
raises the concern whether there was any delay and failure in seeking necessary medical treatments which can translate
to poorer health outcomes26,27. Amidst the decline, we noted a shift in ED patient case-mix from ‘Non-fever’ cases to
‘Fever’ cases. This likely gave rise to the two-phase ED attendance trend that we observed at SGH ED, where each phase
has its distinct trough-to-peak visit pattern. The first and second phase corresponds with the pre-Circuit Breaker and
Circuit Breaker period, respectively. Lastly, the Circuit Breaker period had a higher average ED admission rate as compared
to the pre-Circuit Breaker period. Between these two periods, the average number of ED patients admitted per day
remained relatively unchanged, except for P3F patients. The Circuit breaker period, however, saw a greater decline in
average daily ED attendance as compared to the pre-Circuit Breaker period.
Possible explanations for the two-phase ED attendance trend at SGH
The general decline in ED attendance was widely reported in several countries, including fewer visits for non-respiratory
complaints6,9 and certain medical emergencies such as stroke and acute myocardial infarction1,13-15. Here at SGH ED, we
observed a similar trend with an overall decline in visits for non-fever and non-respiratory complaints, raising the concern
that some patients needing emergency care were not seeking help at ED. With a large decrease in ED visits, one may
expect the sickest patients (P1) to continue attending ED for unquestionably needed emergency care. Nevertheless,
COVID-19’s impact on the ED attendance of P1-equivalent triage group seemed to vary by country. While two studies
Page 9/21reported no change in ED attendance of their sickest patient group28,29, several other EDs observed a significant decline in
visits of the same vulnerable group7,10,30. Like most studies, SGH ED saw fewer life-threatening presentations and a
decrease in both the number and proportion of P1 visits throughout the COVID-19 period. We speculate the following
reasons that could have contributed to the overall decline in SGH ED attendance, even amongst the most urgent cases.
Some patients may have avoided SGH ED due to fear of burdening the healthcare system22 or contracting the dreadful
virus in a public hospital that is screening and treating for COVID-1926,31. Also, social distancing measures and a partial
lockdown have likely led to lower incidences of common community infections and injuries related to work, sports, and
road traffic accidents. It is also likely that the gradual expansion of COVID-19 screening and treatment capacity in
Singapore have redirected patients from ED to alternative avenues. These avenues include community COVID-19 swab
operations and isolation facilities, teleconsultation services and general practitioner (GP) clinics adequately equipped to
manage patients with respiratory symptoms20. Furthermore, the close collaboration between Singapore’s public and
private healthcare hospitals likely expanded treatment capacity for management of chronic medical ailments and non-
life-threatening clinical conditions. Our data, however, cannot prove whether there has been a true decrease in the
incidence of diseases, or whether patients are avoiding ED or seeking treatment elsewhere. Whether there was any delay
and failure in seeking urgently needed treatments remains a major public health concern. Additional data and in-depth
analysis are required to study the relative contributions of the aforementioned factors to the decline in ED attendance.
Unlike the surge in ED attendance and number of ‘Fever’ visits that we saw during pre-Circuit Breaker period (First phase),
ED attendance declined even as daily infected cases hit record-breaking numbers during the Circuit Breaker (Second
phase). During the first phase where daily counts of newly infected community cases were relatively low, the shift in ED
patient case-mix from ‘Non-fever’ cases to ‘Fever’ cases may be contributed by suspected COVID-19 cases seeking testing
and treatment at the ED, as well as patients seeking care for flu-like symptoms for fear that they have contracted the
COVID-19 virus32. As compared to pre-COVID-19 period, the percentage change in ‘Fever’ and ‘Non-fever’ visits and
respiratory-related diagnoses during the COVID-19 period was likely an overestimation due to modified triage thresholds
at ED. Patients who met suspect case criteria for COVID-19 were likely triaged as ‘Fever’ cases and given a respiratory-
related primary diagnosis, no matter how mild their respiratory symptoms were or even if their chief complaint was of a
non-respiratory nature33. This was to facilitate the prompt placement of such patients in specific acute respiratory
inpatient wards upon admission. This contrasts with the pre-COVID-19 period, where such patients with mild respiratory
symptoms or non-respiratory presenting complaints were less likely to be given a respiratory-related diagnosis and the
‘Fever’ triage category mainly functioned to isolate patients with suspected conditions that were highly transmissible,
such as pulmonary tuberculosis, measles, chicken pox and herpes zoster4. Amidst the rise in ‘Fever’ visits during the first
phase, the overall number of ‘Non-Fever’ visits fell and this decline persisted into the Circuit Breaker period (Second
phase). On the contrary, the surge in number of infected cases during Circuit Breaker (Second phase) was largely
restricted to the densely occupied migrant worker dormitories, rather than the community4,34. The prompt gazetting of
these dormitories as isolation areas, general compliance to social distancing measures, rapid contact tracing and
systematic screening for COVID-19 have likely stemmed any widespread infection to the community. Moreover, the
scaling up of community medical facilities and services during the Circuit Breaker (Second phase) allowed quicker testing
and housing of clinically well COVID-19 patient34. These measures likely gained traction throughout Circuit Breaker and
prevented an overwhelming number of ‘Fever’ visits to SGH ED, which partially explains the persistent nadir of ED
attendance observed during the first half of Circuit Breaker.
In the second half of the Circuit Breaker, the recovery in ‘Non-Fever’ visits may be due to the delay in seeking treatment,
resulting in more severe presentations that required emergent care and admission from ED. It may also be attributed to
better public perception of the local COVID-19 situation and the declining number of new cases in the community. These
may have quelled the public’s fear of contracting the virus in the community and hospital settings.
Page 10/21Possible explanations for ED admission rate trends at SGH
The ED admission rate is one of several ED key performance indicators at SGH and it is dependent on ED attendance, the
number of patients admitted from the ED and the patient case-mix unique to SGH. It is worth noting that SGH ED is likely
to have higher than average ED admission rates as compared to other typical EDs during COVID-19 period due to its
position in the largest tertiary hospital in Singapore35. During peacetimes, a consistent trend in ED attendance allows the
reliable use of ED admission rate to reflect inpatient bed needs of ED patients. This rate, however, can be misleading
during a pandemic.
Existing few studies have reported temporal associations between declining ED attendance and rising ED admission rates
during the COVID-19 period36,37. At SGH ED, we observed obvious variability in the average ED admission rates between
the pre-Circuit Breaker period (First phase) and Circuit Breaker period (Second phase). Although the overall number of
patients admitted from the ED were the same in both periods, the trough of ED attendance persisted longer during the
Circuit Breaker period (Second phase) as compared to the pre-Circuit Breaker period (First phase). These numbers gave
rise to a higher average ED admission rate during the Circuit Breaker period despite the need for the same number of
hospital beds. Our findings suggest that the admission rate should be distilled down to its components for evaluation. It
is possible that the average acuity of presenting illness has increased across triage groups, necessitating a higher
proportion of patients admitted. Further analysis of ED resource utilisation and life-saving interventions may tell us the
severity of conditions that these patients presented to ED with. Another possible implication could be related to the
change in protocol to admit suspected COVID-19 cases or patients with respiratory symptoms, who would otherwise be
typically discharged during the pre-COVID-19 period. This included admitting patients who had difficulty self-isolating to
Acute Respiratory Infection and isolation wards to reduce community spread.
Implications
The first implication of our findings was the possible delay in P1 patients seeking life-saving interventions at ED. The
decline in SGH ED attendance might also be attributed to reduced incidence of disease in the community or a diversion
towards alternative treatment avenues. Additional data and further exploration of the factors above are needed to
conclude whether there was a true delay in seeking necessary treatments and explore the reasons behind it. The delay of
emergent care and chronic care might lead to increased morbidity and mortality in the community, and potentially
increased the need for hospital care. Further exploration of the issues above may help to identify key targets of
interventions for better health outcomes. Secondly, the sole use of ED admission rate may not reflect inpatient bed needs
reliably during a pandemic. The analysis of ED admission trends should also include admitted ward types and a good
understanding of ED workflow and protocols during the COVID-19 period. Thirdly, the pandemic presents timely
opportunities for policymakers to understand how some ED patient groups can be managed appropriately outside of ED
for better management of ED crowding in a post-COVID-19 era.
Future studies
The COVID-19 pandemic is still showing no signs of abating globally and the resurgence of outbreaks, as seen in many
other countries, is inevitable as Singapore reopens its borders. A deeper understanding on the pandemic’s indirect impact
on patient outcomes and the overall demand for emergent care across the nation is needed. As Singapore eased from
social interaction mitigation measures in a stepwise manner, further studies on patients presenting to the ED during this
period are needed to fully understand the health implications of the COVID-19 outbreak. It is also essential to explore
public perceptions on seeking treatment at ED during the COVID-19 period. Moreover, the prediction of a post-COVID-19
peak rebound in ‘Non-Fever’ visits will facilitate informed decision-makings in resource allocation. It will be useful to have
a whole-system model in the future which estimates the healthcare resources needed for health systems to adapt rapidly
Page 11/21in various outbreak scenarios. This tool will inform policy responses and minimise the impact of an evolving outbreak on
Singapore’s health systems’ outcomes.
Limitations
As this was a single-centre study based on SGH’s patient profile, and the analysis was performed using data collected
from SGH’s eHINTS-ED database, our findings may not be generalisable to other EDs in Singapore and we do not know
whether more or less patients are seeking treatment at other hospitals. Although this study was not able to prove
causation due to the nature of a descriptive analysis, our findings provide first insights on how ED utilisation at SGH has
changed across different subperiods of the COVID-19 pandemic, laying out important questions and implications that
future studies should address.
Another limitation of our study lies in our diagnosis dataset. As our dataset did not allow differentiation between primary
and secondary diagnoses for each ED visit, all documented diagnoses were studied, and the proportion of each diagnosis
category was analysed as a percentage of total number of documented diagnoses. Consequently, the results may have
under-represented some diagnosis categories as there were more documented diagnoses than ED visits, or over-
represented some diagnosis categories if secondary diagnoses were concentrated in those categories. Nevertheless, the
broad conclusion remains that the frequency of nearly every diagnosis category has declined and the number of
respiratory-related presentations have gone up during the COVID-19 period. Also, we were not able to map 3000 SNOMED
CT codes to ICD-10, which represent 232 unique SNOMED CT diagnosis. However, these were fairly distributed across
multiple diagnosis categories. As such, their exclusion will not likely alter the general conclusions of this study.
Conclusion
The COVID-19 pandemic caused a large decline in ED attendances at SGH, even amongst those with highest priority for
emergency care. This raises the concern whether patients were delaying critically needed treatment at ED, and whether
this has resulted in poorer health outcomes. Moreover, the use of ED admission rate as a key performance indicator
during a pandemic can be misleading and the individual components of admission rates should be scrutinised before
making any evaluation on inpatient bed needs. Lastly, this descriptive analysis revealed distinct ED visit trends across
different time periods. A deeper understanding of how patients are utilising healthcare services across different
healthcare institutions will provide policymakers useful insights on how ED crowding can be better managed in the post-
COVID-19 era.
Abbreviations
COVID-19: Coronavirus disease 2019
CIRB: SingHealth Centralised Institutional Review Board
DORSCON: Disease Outbreak Response System Condition
ED: Emergency Department
eHINTS: Electronic Health Intelligence System
ICD-10-CM: International Classification of Diseases, Tenth Revision, Clinical Modification
PAC: Patient Acuity Category
P1: Priority 1
Page 12/21P2: Priority 2
P3: Priority 3
P4: Priority 4
P1F: Priority 1 Fever
P2F: Priority 2 Fever
P3F: Priority 3 Fever
Q1: First quartile which represents 25th percentile value
Q3: Third quartile which represents 75th percentile value
SGH: Singapore General Hospital
SCDF: Singapore Civil Defence Force
SNOMED CT: Systematized Nomenclature of Medicine Clinical Terms
Declarations
Ethics approval and consent to participate
This was a service evaluation study which did not require further ethical deliberation by SingHealth Centralised
Institutional Review Board (CIRB Ref: 2020/2470).
Consent for publication
Not applicable.
Availability of data and materials
The datasets used and/or analysed during the current study are available from the corresponding author on reasonable
request.
Competing interests
The authors declare that they have no competing interests.
Funding
This work was supported by the National Medical Research Council (NMRC) grant (COVID19RF2-0028). The study
sponsor did not participate in the study design and the collection, analysis, and interpretation of data, as well as in the
writing of the manuscript and the decision to submit the manuscript for publication.
Authors' contributions
Ms Lim MQ, Prof Ong MEH, Asst Prof Siddiqui FJ, Assoc Prof Liu N and Asst Prof Saffari SE contributed to the study
design. Mr Lian SWQ helped with the extraction of anonymised patient data. Asst Prof Siddiqui FJ, Assoc Prof Liu N, Asst
Prof Saffari SE, Mr Lian SWQ and Ms Sim NS assisted in data cleaning. Ms Lim MQ performed all data analysis,
Page 13/21statistical analysis, and manuscript preparation. Asst Prof Saffari SE, Asst Prof Siddiqui FJ and Assoc Prof Liu N
provided their guidance on descriptive analysis. All authors made substantial contributions to result interpretation and
critical revision of the manuscript.
Acknowledgements
I am grateful to Mr Narayanan Ragavendran, who works with the Health Services Research Centre at Singhealth, for
kindly providing his expertise and service in data deidentification. I would also like to thank Dr Andrew Ho and Dr Gayathri
Devi Nadarajan for providing their valuable insights on SGH ED’s workflow. I would also like to thank Ms Loo Shin Yi,
Manager at SGH Department of Emergency Medicine, for providing her support. Lastly, I would like to express my
gratitude to my fellow MD candidates Johannes Liew and Zhong Xun for providing guidance on R coding and the
conversion of SNOMED CT diagnosis codes to ICD-10, respectively.
Authors’ information
Ms Mei Qiu Lim
MD Candidate, Duke-NUS Medical School, Singapore
Prof Marcus Eng Hock Ong
Senior Consultant, Department of Emergency Medicine, Singapore General Hospital, Singapore
Professor and Director, Health Services and Systems Research, Duke-NUS Medical School, Singapore
Asst Prof Fahad Javaid Siddiqui
Assistant Professor, Prehospital and Emergency Research Centre, Health Services and Systems Research, Duke-NUS
Medical School, Singapore
Assoc Prof Nan Liu
Associate Professor, Prehospital and Emergency Research Centre, Health Services and Systems Research, Duke-NUS
Medical School, Singapore
Associate Professor, Centre for Quantitative Medicine, Health Services and Systems Research, Duke-NUS Medical School,
Singapore
Asst Prof Seyed Ehsan Saffari
Assistant Professor, Centre for Quantitative Medicine, Health Services and Systems Research, Duke-NUS Medical School,
Singapore
Mr Sherman Wei Qiang Lian
Research Nurse, Department of Emergency Medicine, Singapore General Hospital, Singapore
Dr Boon Kiat Kenneth Tan
Head of Department and Senior Consultant, Department of Emergency Medicine, Singapore General Hospital, Singapore
Ms Nicole Simin Sim
Page 14/21Executive, Department of Emergency Medicine, Singapore General Hospital, Singapore
Dr Yuzeng Shen
Associate Consultant, Department of Emergency Medicine, Singapore General Hospital, Singapore
References
1. Metzler B, Siostrzonek P, Binder RK, Bauer A, Reinstadler SJ. Decline of acute coronary syndrome admissions in
Austria since the outbreak of COVID-19: the pandemic response causes cardiac collateral damage. Eur Heart J
2020;41:1852-3.
2. Gettleman J, Suhasini R. 8 Hospitals in 15 Hours: A Pregnant Woman’s Crisis in the Pandemic. In: The New York
Times. 2020. https://www.nytimes.com/2020/06/21/world/asia/coronavirus-india-hospitals-pregnant.html.
Accessed 21 June 2020.
3. Frias L. 'Patients are suffering across the board': A Texas ER doctor said hospitals are getting overwhelmed with
patients of varying causes as the state gets battered by coronavirus outbreaks. In: Business Insider. 2020.
https://www.businessinsider.com/texas-er-doctor-hospitals-overwhelmed-with-patients-covid-19-cases-2020-8.
Accessed 14 August 2020.
4. Quah LJJ, Tan BKK, Fua TP, et al. Reorganising the emergency department to manage the COVID-19 outbreak. Int J
Emerg Med 2020;13.
5. Perlini S, Canevari F, Cortesi S, et al. Emergency Department and Out-of-Hospital Emergency System (112-AREU 118)
integrated response to Coronavirus Disease 2019 in a Northern Italy centre. Intern Emerg Med 2020;15:825-33.
6. Hartnett KP, Kite-Powell A, DeVies J, et al. Impact of the COVID-19 Pandemic on Emergency Department Visits —
United States, 1 January, 2019–30 May, 2020. MMWR Morb Mortal Wkly Rep 2020;69:699–704.
7. Cella A, Marchetti F, Iughetti L, et al. Italian COVID-19 epidemic: effects on paediatric emergency attendance—a
survey in the Emilia Romagna region. BMJ Paediatrics Open 2020;4.
8. Walline JH, Song PP, Lim AM, Hung KK, Graham CA. Hong Kong emergency department attendance plummets during
COVID-19. Emerg Med Australas 2020;32:1093-1094.
9. Leow SH, Dean W, MacDonald-Nethercott M, MacDonald-Nethercott E, Boyle AA. The Attend Study: A Retrospective
Observational Study of Emergency Department Attendances During the Early Stages of the COVID-19 Pandemic.
Cureus 2020;12:e9328.
10. Brick A, Walsh B, Keegan C, Lyons S. COVID-19 and Emergency Department Attendances in Irish Public Hospitals. In:
Economic & Social Research Institute. 2020. https://www.esri.ie/publications/covid-19-and-emergency-department-
attendances-in-irish-public-hospitals. Accessed 20 July 2020.
11. Lazzerini M, Barbi E, Apicella A, Marchetti F, Cardinale F, Trobia G. Delayed access or provision of care in Italy
resulting from fear of COVID-19. The Lancet Child & Adolescent Health 2020;4:e10-e1.
12. De Filippo O, D'Ascenzo F, Angelini F, et al. Reduced Rate of Hospital Admissions for ACS during Covid-19 Outbreak in
Northern Italy. N Engl J Med 2020;383:88-9.
13. Lange SJ, Ritchey MD, Goodman AB, et al. Potential Indirect Effects of the COVID-19 Pandemic on Use of Emergency
Departments for Acute Life-Threatening Conditions — United States, January–May 2020. MMWR Morb Mortal Wkly
Rep 2020;69:795-800.
14. Nagamine M, Chow DS, Chang PD, Boden-Albala B, Yu W, Soun JE. Impact of COVID-19 on Acute Stroke Presentation
at a Comprehensive Stroke Center. Front Neurol 2020;11:850.
15. Oikonomou E, Aznaouridis K, Barbetseas J, et al. Hospital attendance and admission trends for cardiac diseases
during the COVID-19 outbreak and lockdown in Greece. Public Health 2020;187:115-9.
Page 15/2116. Mafham MM, Spata E, Goldacre R, et al. COVID-19 pandemic and admission rates for and management of acute
coronary syndromes in England. The Lancet 2020;396:381-9.
17. Khalik S. Surge in coronavirus infections strains healthcare system. In: The Straits Times. 2020.
https://www.straitstimes.com/singapore/surge-in-virus-infections-strains-healthcare-system. Assessed 18 April 2020.
18. What do the different DORSCON levels mean. In: Ministry of Health (MOH). 2020. https://www.gov.sg/article/what-
do-the-different-dorscon-levels-mean. Accessed 15 August 2020.
19. Shorey S, Ang E, Yamina A, Tam C. Perceptions of public on the COVID-19 outbreak in Singapore: a qualitative
content analysis. J Public Health (Oxf) 2020;42:665-71.
20. Comprehensive Medical Strategy for COVID-19. In: Ministry of Health (MOH). 2020. https://www.moh.gov.sg/news-
highlights/details/comprehensive-medical-strategy-for-covid-19. Accessed 15 August 2020.
21. Ending circuit breaker: phased approach to resuming activities safely. In: Ministry of Health (MOH). 2020.
https://www.moh.gov.sg/news-highlights/details/end-of-circuit-breaker-phased-approach-to-resuming-activities-
safely. Accessed 15 August 2020.
22. Singaporeans are confident in the Government amidst fears of the COVID-19 outbreak. In: Ipsos. 2020.
https://www.ipsos.com/en-sg/singaporeans-are-confident-government-amidst-fears-covid-19-
outbreak#:~:text=While%2074%25%20of%20Singaporeans%20agreed,downturn%20brought%20about%20by%20the.
Accessed 16 August 2020.
23. SNOMED CT to ICD-10-CM Map. In: National Library of Medicine. 2020.
https://www.nlm.nih.gov/research/umls/mapping_projects/snomedct_to_icd10cm.html. Accessed 27 September
2020.
24. R Core Team (2020). R: A language and environment for statistical computing. R Foundation for Statistical
Computing, Vienna, Austria. Available at https://www.R-project.org/. Accessed 30 April 2020.
25. Past Updates on COVID-19 Local Situation. In: Ministry of Health (MOH). 2020. https://www.moh.gov.sg/covid-
19/past-updates. Assessed 15 August 2020.
26. Sarwari AR, Goode C. Commentary: Fear of catching coronavirus is leading some patients to delay non-COVID-19
hospital visits. In: Channel News Asia. 2020. https://www.channelnewsasia.com/news/commentary/fearing-
coronavirus-patients-delaying-hospital-follow-up-doctors-12769916. Assessed 21 December 2020.
27. Czeisler MÉ, Marynak K, Clarke KEN, et al. Delay or avoidance of medical care because of COVID-19-related concerns-
-United States, June 2020. MMWR Morb Mortal Wkly Rep 2020;69:1250-1257.
28. Sung CW, Lu TC, Fang CC, et al. Impact of COVID-19 pandemic on emergency department services acuity and
possible collateral damage. Resuscitation 2020;153:185-6.
29. Kam AW, Chaudhry SG, Gunasekaran N, White AJ, Vukasovic M, Fung AT. Fewer presentations to metropolitan
emergency departments during the COVID-19 pandemic. Med J Aust 2020;213:370-1.
30. Santana R, Sousa JS, Soares P, Lopes S, Boto P, Rocha JV. The Demand for Hospital Emergency Services: Trends
during the First Month of COVID-19 Response. Port J Public Health 2020;38:30-6.
31. Wong LE, Hawkins JE, Langness S, Murrell KL, Iris P, Sammann A. Where are all the patients? Addressing COVID-19
fear to encourage sick patients to seek emergency care. NEJM Catalyst 2020;1.
32. Paulo DA, Lim AM, Yip C, Yeh R. Inside Singapore’s COVID-19 screening centre, on the front line against the disease.
In: Channel News Asia. 2020. https://www.channelnewsasia.com/news/cnainsider/inside-singapore-covid-19-
screening-centre-defence-disease-ncid-12656312. Assessed 19 April 2020.
33. Wee LE, Fua TP, Chua YY, et al. Containing COVID‐19 in the Emergency Department: The Role of Improved Case
Detection and Segregation of Suspect Cases. Acad Emerg Med 2020;27:379-387.
Page 16/2134. Baker JA, Mohan M. Stretched but coping: How Singapore's healthcare system has cranked up efforts to deal with
COVID-19. In: Channel News Asia. 2020. https://www.channelnewsasia.com/news/singapore/covid-19-singapore-
health-capacity-hospitals-treatment-12698282. Assessed 4 May 2020.
35. Low LL, Tay WY, Ng MJM, et al. Frequent hospital admissions in Singapore: clinical risk factors and impact of
socioeconomic status. Singapore Med J 2018;59:39-43.
36. Jeffery MM, D'Onofrio G, Paek H, et al. Trends in Emergency Department Visits and Hospital Admissions in Health
Care Systems in 5 States in the First Months of the COVID-19 Pandemic in the US. JAMA Intern Med 2020;180:1328-
33.
37. Feldman N, Lane R, Iavicoli L, et al. A snapshot of emergency department volumes in the "epicenter of the epicenter"
of the COVID-19 pandemic. Am J Emerg Med 2020;S0735-6757:30751-8.
Figures
Figure 1
Flowchart depicting study selection process of ED visit records for analysis. Abbreviations: ED: Emergency department; N:
number of records.
Page 17/21Figure 2
An illustration of the trend of daily newly infected cases in Singapore. Source: Ministry of Health (MOH) Singapore, Past
updates on COVID-19 (Coronavirus disease 2019) local situation, 202025. National tally of daily infected cases reached
its highest during the Circuit Breaker period and declined progressively thereafter.
Figure 3
Page 18/21Weekly SGH ED attendance between the studied COVID-19 period and its corresponding historical pre-COVID-19 period.
1Weekly ED attendance during the studied COVID-19 period remained persistently below that of pre-COVID-19 period. A
two-phase ED attendance trend was experienced at SGH ED within the studied COVID-19 period in 2020, where the first
phase and second phase represent visit trends during the pre-Circuit Breaker period and Circuit Breaker period,
respectively. 2Epi-weeks were used for plotting and only completed epi-weeks 2 to 26 of each studied period were
included in this figure.
Figure 4
Weekly ED attendance trend of ‘Non-Fever’ and ‘Fever’ triage groups during pre-COVID-19 and COVID-19 periods. During
DORSCON Orange period, the initial downward trend in total ED visits was largely driven by the decrease in ‘Non-Fever’
visits and the subsequent sharp returning of ED attendance corresponded with the rising numbers of total “Fever” visits.
During Circuit Breaker period, there was a decline in attendance of both ‘Non-Fever’ visits and ‘Fever’ visits. Midway
through the Circuit Breaker period, gradual recovery in total ED visits was observed as total ‘Non-Fever’ visits numbers
rose while total ‘Fever’ visits numbers remained relatively constant. Epi-weeks were used for plotting and only completed
epi-weeks 2 to 26 of each studied period were included in this figure.
Page 19/21Figure 5
Weekly ED attendance trend for each ‘Non-Fever’ triage group during the pre-COVID-19 and COVID-19 periods. The number
of ‘Non-Fever’ visits across all ‘Non-Fever’ triage groups (P1-P4) declined during the COVID-19 period as compared to
corresponding pre-COVID-19 period. The proportion of P3 patients had the greatest decline over the COVID-19 period,
reaching its lowest numbers during the Circuit Breaker phase. Epi-weeks were used for plotting and only completed epi-
weeks 2 to 26 of each studied period were included in this figure.
Figure 6
Page 20/21Weekly ED admission rate across time during the pre-COVID-19 period and COVID-19 period. The ED admission rate
represents the fraction of ED visits that resulted in admission. The average ED admission rates in both periods were
comparatively similar (43.8% vs 41.3% baseline). However, a closer look at weekly ED admission trend during the Circuit
Breaker period revealed higher ED admission rates than corresponding period in 2019.Epi-weeks were used for plotting
and only completed epi-weeks 2 to 26 of each studied period were included in this figure.
Page 21/21You can also read