A Machine Learning Prediction Model of Respiratory Failure Within 48 Hours of Patient Admission for COVID-19: Model Development and Validation ...
←
→
Page content transcription
If your browser does not render page correctly, please read the page content below
JOURNAL OF MEDICAL INTERNET RESEARCH                                                                                            Bolourani et al

     Original Paper

     A Machine Learning Prediction Model of Respiratory Failure Within
     48 Hours of Patient Admission for COVID-19: Model Development
     and Validation

     Siavash Bolourani1, MD; Max Brenner1, MD, PhD; Ping Wang1, MD; Thomas McGinn1, MD, MPH; Jamie S Hirsch1,
     MD; Douglas Barnaby1*, MD; Theodoros P Zanos1*, PhD, MSc, BEng; Northwell COVID-19 Research Consortium2*
     1
      Feinstein Institutes for Medical Research, Northwell Health, Manhasset, NY, United States
     2
      See Acknowledgments
     *
      these authors contributed equally

     Corresponding Author:
     Theodoros P Zanos, PhD, MSc, BEng
     Feinstein Institutes for Medical Research
     Northwell Health
     350 Community Dr
     Room 1257
     Manhasset, NY, 11030
     United States
     Phone: 1 5165620484
     Email: tzanos@northwell.edu

     Abstract
     Background: Predicting early respiratory failure due to COVID-19 can help triage patients to higher levels of care, allocate
     scarce resources, and reduce morbidity and mortality by appropriately monitoring and treating the patients at greatest risk for
     deterioration. Given the complexity of COVID-19, machine learning approaches may support clinical decision making for patients
     with this disease.
     Objective: Our objective is to derive a machine learning model that predicts respiratory failure within 48 hours of admission
     based on data from the emergency department.
     Methods: Data were collected from patients with COVID-19 who were admitted to Northwell Health acute care hospitals and
     were discharged, died, or spent a minimum of 48 hours in the hospital between March 1 and May 11, 2020. Of 11,525 patients,
     933 (8.1%) were placed on invasive mechanical ventilation within 48 hours of admission. Variables used by the models included
     clinical and laboratory data commonly collected in the emergency department. We trained and validated three predictive models
     (two based on XGBoost and one that used logistic regression) using cross-hospital validation. We compared model performance
     among all three models as well as an established early warning score (Modified Early Warning Score) using receiver operating
     characteristic curves, precision-recall curves, and other metrics.
     Results: The XGBoost model had the highest mean accuracy (0.919; area under the curve=0.77), outperforming the other two
     models as well as the Modified Early Warning Score. Important predictor variables included the type of oxygen delivery used in
     the emergency department, patient age, Emergency Severity Index level, respiratory rate, serum lactate, and demographic
     characteristics.
     Conclusions: The XGBoost model had high predictive accuracy, outperforming other early warning scores. The clinical
     plausibility and predictive ability of XGBoost suggest that the model could be used to predict 48-hour respiratory failure in
     admitted patients with COVID-19.

     (J Med Internet Res 2021;23(2):e24246) doi: 10.2196/24246

     KEYWORDS
     artificial intelligence; prognostic; model; pandemic; severe acute respiratory syndrome coronavirus 2; modeling; development;
     validation; COVID-19; machine learning

     http://www.jmir.org/2021/2/e24246/                                                           J Med Internet Res 2021 | vol. 23 | iss. 2 | e24246 | p. 1
                                                                                                                (page number not for citation purposes)
XSL• FO
RenderX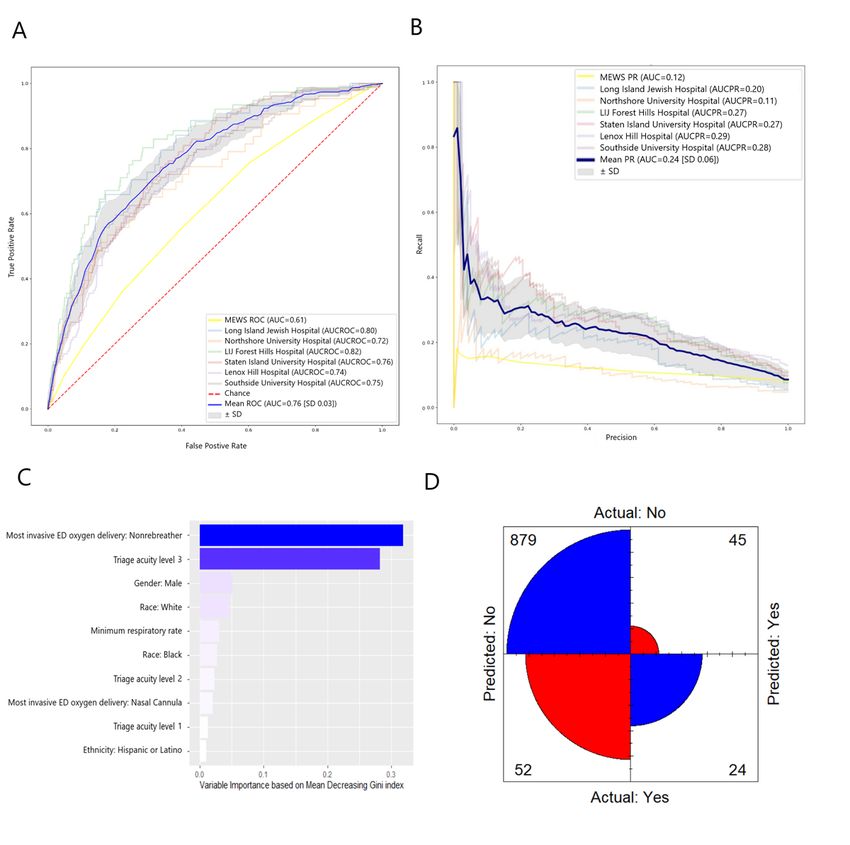
JOURNAL OF MEDICAL INTERNET RESEARCH                                                                                              Bolourani et al

                                                                           within the health system were treated as one hospital encounter.
     Introduction                                                          A total of 11,919 patients were identified. Patients were
     On March 11, 2020, COVID-19, the disease caused by                    excluded if they were placed on mechanical ventilation prior to
     SARS-CoV-2 infection, was declared a pandemic by the World            inpatient admission. A total of 11,525 patients remained for
     Health Organization [1]. As of December 16, 2020, there were          analysis. The Institutional Review Board of Northwell Health
     more than 17 million confirmed COVID-19 cases and over                approved the study protocol and waived the requirement for
     300,000 deaths in the United States. During the first wave, New       informed consent.
     York was the epicenter of the pandemic in the United States,          Data Acquisition
     with over 390,000 cases and 30,000 deaths before the summer
                                                                           Data collected from EHRs included patient demographics,
     [2].
                                                                           comorbidities, home medications, initial vitals and laboratory
     Respiratory failure is the leading cause of death among patients      values, treatments (eg, oxygen therapy, mechanical ventilation),
     with COVID-19, with up to one-third of patients admitted with         and clinical outcomes (eg, length of stay, discharge, mortality).
     COVID-19 requiring invasive mechanical ventilation (IMV)              Vitals and laboratory testing were restricted to those obtained
     [3-8]. The decision to initiate IMV in these patients is not          while the patient was in the ED.
     straightforward. Many patients with severe disease appear
     comfortable despite profound hypoxemia, and they are                  Outcomes
     commonly managed with supplemental oxygen, self-proning,              The target outcome variable was defined as intubation and
     and close monitoring [9,10]. However, some of these patients          mechanical ventilation within 48 hours of admission. In the
     subsequently deteriorate and require IMV following transfer           EHR, the admission time was recorded, and the intubation event
     from the emergency department (ED). This subgroup has worse           was defined as the first time mechanical ventilation was
     outcomes than those placed on IMV initially [11]. Before the          recorded.
     surge of COVID-19, patients initially admitted to a non–critical
                                                                           Predictive Machine Learning Model
     care setting who needed an unplanned transfer to an intensive
     care unit (ICU) had greater morbidity and mortality than those        We evaluated three predictive models: XGBoost, XGBoost +
     admitted directly to a critical care unit [12-14]. Thus, accurately   SMOTEENN (combined oversampling using SMOTE and
     identifying patients at high risk for deterioration could improve     undersampling using edited nearest neighbors) [24], and logistic
     clinical outcomes as a result of closer monitoring, direct            regression [25]. XGBoost combines a recursive
     admission to a critical care unit, or earlier discussions regarding   gradient–boosting method, called Newton boosting, with a
     patient preferences and goals of care.                                decision-tree model. Given that each tree is boosted in parallel,
                                                                           the model efficiently provides accurate predictions [26].
     Methods of identifying patients at high risk for or in the early      Furthermore, because each tree is boosted recursively and in
     stages of clinical deterioration have been actively researched        parallel, the model benefits from the high interpretability of the
     for decades. The field has generated many severity-of-illness         variable importance features.
     calculators, early warning scores, and, more recently, predictive
     analytic tools that use advanced machine learning and artificial      The XGBoost + SMOTEENN method involves combined
     intelligence [15-23]. Our goal was to derive a prediction model       oversampling using SMOTE and undersampling using edited
     that estimates the risk of short-term (1000 patients with COVID-19 in the
     health record (EHR) Sunrise Clinical Manager (Allscripts).            data set were picked for the testing sets, and a random sample
     EHRs were screened for adult patients (aged ≥21 years) who            of 1000 patients was picked to be our testing set for each fold.
     received a positive test result for SARS-CoV-2 based on a             Grid search was used to hypertune the parameters of the
     nasopharyngeal sample tested using polymerase chain reaction          respective models. The XGBoost model was tuned based on
     assays. Included patients were hospitalized and were discharged,      min_child_weight, gamma, subsample, colsample_bytree, and
     died, or spent a minimum of 48 hours in the hospital between          max_depth parameters, and the ranges of the values were 1-20,
     March 1, 2020, and May 11, 2020. For patients who had multiple        0.5-20, 0.2-1.0, 0.2-1.0, and 2-40, respectively.
     qualifying hospital admissions, only the first hospitalization
     was included. Patients who were transferred between hospitals
     http://www.jmir.org/2021/2/e24246/                                                             J Med Internet Res 2021 | vol. 23 | iss. 2 | e24246 | p. 2
                                                                                                                  (page number not for citation purposes)
XSL• FO
RenderX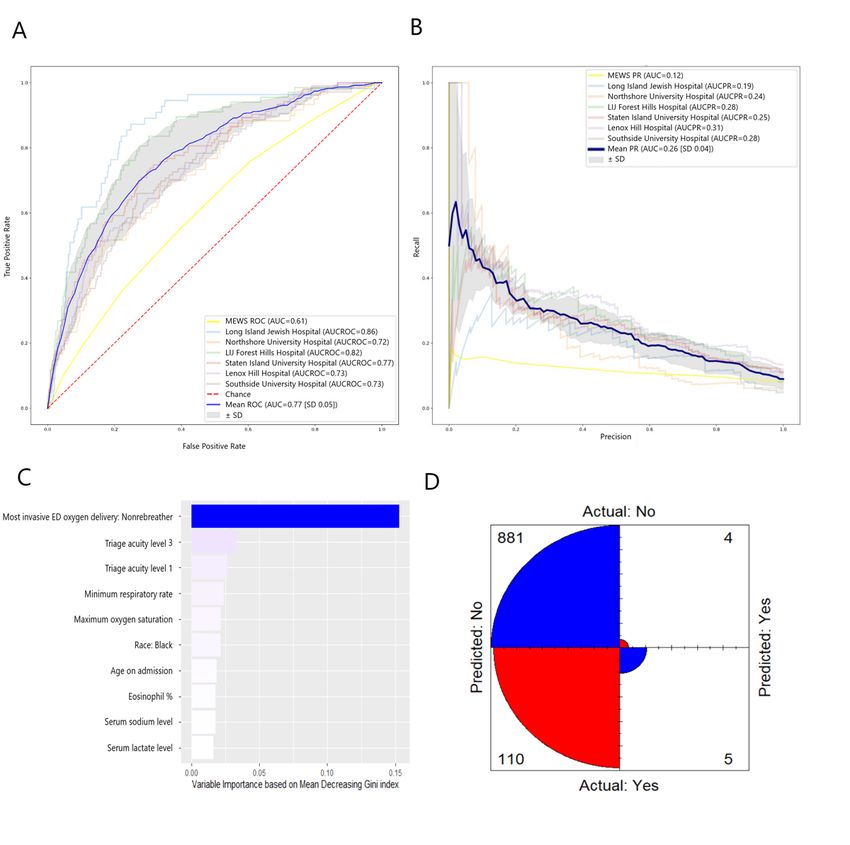
JOURNAL OF MEDICAL INTERNET RESEARCH                                                                                               Bolourani et al

     When data were missing, we imputed weighted k-nearest                  value for k=5 was not changed. OneHotEncoder from the sklearn
     neighbors [29] for numerical values and added a category               API was used to transform categorical variables to one-hot
     “missing” for categorical values. We used one-hot [30] to              numeric arrays.
     encode categorical variables as a one-hot numeric array. The
     most important variables were calculated based on a decrease
                                                                            Modified Early Warning Score
     in the mean Gini coefficient (ie, the variables most useful in         The Modified Early Warning Score (MEWS) was computed
     splitting the data to help make a prediction) for XGBoost and          from patient vital signs (Multimedia Appendix 2) and is a variant
     XGBoost + SMOTEENN; and by the absolute value of the                   of other known and used risk scores [34,35]. The MEWS ranges
     regression coefficient for logistic regression, and were calculated    from 0 to 15 and incorporates heart rate (beats per minute),
     based on the largest hospital testing set. The resulting receiver      respiratory rate (breaths per minute), systolic blood pressure
     operating characteristic (ROC) curves and corresponding                (mm Hg), and body temperature (degrees Celsius). In our data
     accuracy, recall (sensitivity), specificity, geometric mean, and       set, one MEWS subcomponent, the AVPU (alert, verbal, pain,
     Fβ-score were averaged. For the Fβ-score, the β parameter value        unresponsive) neurologic assessment, had a significant amount
     was designated as β=4 to capture a higher detriment of false           of missing data (>80%; data not shown) and was not included
     negatives than false positives (ie, if we value recall, β times as     in the MEWS calculation for this project. An elevated MEWS
     much as the precision). For definitions of these measures and          indicates a risk for clinical instability, including death or the
     how they were calculated, see Multimedia Appendix 1.                   need for ICU admission [36]. In 2012, our health system created
                                                                            a custom modification that was incorporated into the EHR. It
     Calibration curves (reliability curves) were plotted by dividing       includes automatic calculation and display of MEWS and other
     the testing sets (for each hospital fold) into 10 bins randomly        modules via Arden Syntax Medical Logic Modules [37]. Based
     with an increasing fraction of patients that had respiratory failure   on local health system guidelines, any score ≥7 requires an
     in the sample. The fraction positives (patients who had                escalation in intensity of care. For example, MEWS >7 requires
     respiratory failure) and their mean corresponding predicted            increased frequency of vital sign measurement (every 2 hours),
     value from the corresponding model were depicted and averaged          MEWS >8 requires evaluation by a licensed independent
     into 10 bins. The Brier score was calculated for each external         provider, MEWS >9 requires consideration of evaluation by a
     hospital fold and the mean Brier score and standard deviation          rapid response team, and MEWS >10 requires a change in the
     were calculated and depicted in the legend of the calibration          level of service per a defined protocol. For the MEWS, we chose
     curve. For further explanation of these measures and how they          the highest value the patient had while in the ED.
     were calculated, see Multimedia Appendix 1.
     Python 2.6 (Python Software Foundation) was used to                    Results
     implement our machine learning framework. The respective
     prediction models of XGBoost and logistic regression from the          Patient Characteristics
     scikit-learn application programming interface (API) in Python         During the study period, we identified 11,525 patients admitted
     were used [31]. GridSearchCV from the scikit-learn API was             from the ED with a diagnosis of COVID-19. Of these, 933
     used to perform the grid search and hypertune the parameters.          (8.0%) were placed on IMV within 48 hours of admission.
     We used the default imblearn API version of the SMOTEENN               Baseline characteristics (demographics, baseline vital signs,
     [27]. SimpleImputer [32] was used for imputations, which were          and laboratory measurements) for all patients are shown in Table
     replaced with a new category, “missing.” KNNImputer [33]               1, stratified by study outcome. Comorbidities were captured
     was used to impute the missing numerical data [29]. The default        from ICD-10 codes listed in the EHR.

     http://www.jmir.org/2021/2/e24246/                                                              J Med Internet Res 2021 | vol. 23 | iss. 2 | e24246 | p. 3
                                                                                                                   (page number not for citation purposes)
XSL• FO
RenderX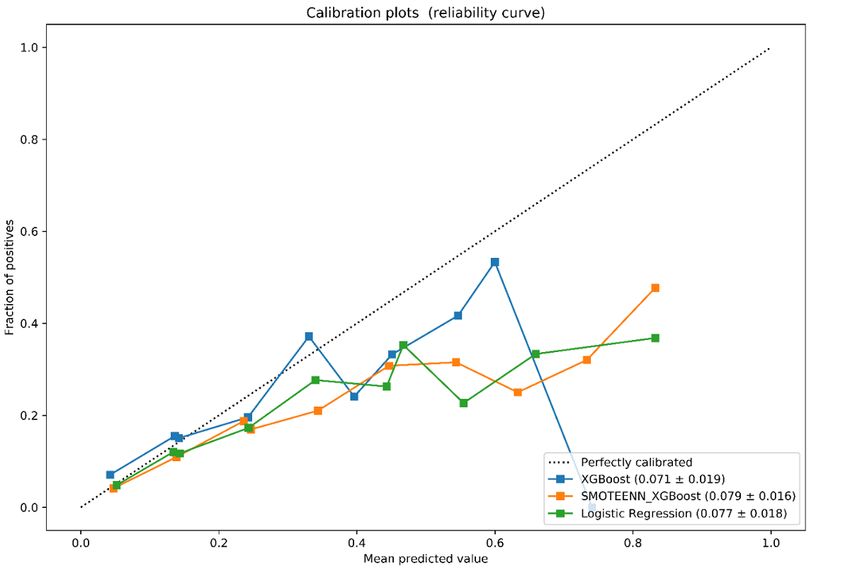
JOURNAL OF MEDICAL INTERNET RESEARCH                                                                                                    Bolourani et al

     Table 1. Demographic, clinical, and laboratory data from hospitalized patients.
      Variables                                                    Not intubated (n=10,592)   Intubated (n=933)                          Missing (%)
      Demographic characteristics
           Age (years), median (IQR)                               65.00 (54.00-77.00)        66.00 (56.00-75.00)                        0
           Female, n (%)                                           4530 (42.8)                327 (35.0)                                 0
           Primary language, English, n (%)                        8498 (80.2)                746 (80.0)                                 0
      Race, n (%)                                                                                                                        0
           Black                                                   2199 (20.8)                236 (25.3)                                 N/Aa
           Asian                                                   889 (8.4)                  77 (8.3)                                   N/A
           White                                                   4148 (39.2)                310 (33.2)                                 N/A
           Declined                                                71 (0.7)                   8 (0.9)                                    N/A
           Other                                                   2884 (27.2)                268 (28.7)                                 N/A
           Unknown                                                 401 (3.8)                  34 (3.6)                                   N/A
      Ethnicity, n (%)                                                                                                                   0.1
           Hispanic or Latino                                      2238 (21.1)                202 (21.7)                                 N/A
           Not Hispanic or Latino                                  7685 (72.6)                648 (69.5)                                 N/A
           Declined                                                43 (0.4)                   1 (0.1)                                    N/A
           Unknown                                                 618 (5.8)                  82 (8.8)                                   N/A
      Vital signs
           Systolic blood pressure (mm Hg), median (IQR)           134.00 (118.00-150.00)     134.00 (115.00-151.75)                     0.5
           Diastolic blood pressure (mm Hg), median (IQR)          79.00 (70.50-87.00)        77.00 (69.00-86.00)                        0.6
           Heart rate (beats/minute), median (IQR)                 94.00 (85.00-102.00)       97.00 (88.50-112.00)                       0.4
           Respiratory rate (breaths/minute), median (IQR)         21.00 (18.00-25.00)        24.00 (20.00-32.00)                        0.8
           Temperature (°C), mean (SD)                             37.77 (0.97)               37.86 (1.11)                               1.6
           Oxygen saturation (%), median (IQR)                     97.00 (95.00-98.00)        96.00 (93.00-98.00)                        1.7
           BMI, mean (SD)                                          29.12 (7.79)               30.39 (9.21)                               47.1
      Laboratory data

           White blood cell count (× 109/L), median (IQR)          7.34 (5.45-9.92)           8.25 (6.20-11.50)                          9

           Absolute neutrophil count (× 109/L), median (IQR)       5.68 (3.95-8.11)           6.84 (4.76-9.62)                           11.5

           Absolute lymphocyte count (× 109/L), median (IQR)       0.90 (0.63-1.27)           0.80 (0.56-1.13)                           11.5

           Hemoglobin (g/dL), mean (SD)                            12.93 (2.12)               13.14 (2.11)                               9
           Platelets (K/μL), mean (SD)                             230.17 (101.93)            217.19 (87.45)                             9.1
           Sodium (mmol/L), mean (SD),                             136.64 (6.21)              135.38 (5.74)                              11.9
           Carbon dioxide (mmol/L), mean (SD)                      23.61 (3.79)               22.67 (4.68)                               11.9
           Creatinine (mg/dL), median (IQR)                        1.03 (0.80-1.46)           1.20 (0.92-1.75)                           12
           Bilirubin (mg/dL), median (IQR)                         0.50 (0.40-0.70)           0.60 (0.40-0.80)                           12.5
           Ferritin (ng/mL), mean (SD)                             1283.50 (2732.65)          1731.05 (2631.38)                          73.2
           Procalcitonin (ng/mL), mean (SD)                        1.22 (10.96)               2.12 (8.16)                                66.3
           D-dimer (ng/mL), mean (SD)                              1871.84 (5306.42)          2659.09 (6798.96)                          65.4
           Lactate dehydrogenase (U/L), mean (SD)                  455.61 (213.04)            611.05 (272.16)                            71
           pH (arterial), mean (SD)                                7.42 (0.09)                7.39 (0.11)                                96.7
           Partial pressure of oxygen (arterial, mm Hg), mean (SD) 99.90 (65.17)              85.26 (61.42)                              94.8

     http://www.jmir.org/2021/2/e24246/                                                                  J Med Internet Res 2021 | vol. 23 | iss. 2 | e24246 | p. 4
                                                                                                                       (page number not for citation purposes)
XSL• FO
RenderX
JOURNAL OF MEDICAL INTERNET RESEARCH Bolourani et al
Variables Not intubated (n=10,592) Intubated (n=933) Missing (%)
Partial pressure of carbon dioxide (arterial, mm Hg), 34.66 (9.38) 35.38 (11.45) 94.7
mean (SD)
Comorbidities
Hypertension, n (%) 1183 (11.2) 115 (12.3) 0
Diabetes, n (%) 685 (6.5) 77 (8.3) 0
Coronary artery disease, n (%) 148 (1.4) 15 (1.6) 0
Asthma/chronic obstructive pulmonary disease, n (%) 242 (2.3) 20 (2.1) 0
Chronic kidney disease, n (%) 99 (0.9) 8 (0.9) 0
HIV, n (%) 26 (0.2) 1 (0.1) 0
a
N/A: not applicable.
Based on the XGBoost + SMOTEENN model, the mean AUCs
Prediction Models for Respiratory Failure of the ROC and PR curves were 0.76 (SD 0.03) and 0.24 (SD
Based on XGBoost, the mean area under the curve (AUC) of 0.06), respectively (Figure 2). The 10 most important variables,
the ROC (AUCROC) curve was 0.77 (SD 0.05) and the mean in order of decreasing importance, were as follows: most
AUC of the PR curve (AUCPR) was 0.26 (SD 0.04; Figure 1). invasive mode of oxygen delivery being a nonrebreather mask,
The 10 most important variables, in order of decreasing ESI value of 3, male gender, White race, minimum respiratory
importance, were as follows: most invasive mode of oxygen rate, Black race, ESI value of 2, most invasive mode of oxygen
delivery being a nonrebreather mask, Emergency Severity Index delivery being nasal cannula, ESI value of 1, and Hispanic
(ESI) values of 1 and 3, maximum respiratory rate, maximum ethnicity (Figure 2). The mean confusion matrix showed that
oxygen saturation, Black race, age on admission, eosinophil most false predictions were false positives (those who were
percentage, serum sodium level, and serum lactate level (Figure predicted to require intubation but were not intubated within
1). The confusion matrix for the model’s largest hospital testing 48 hours). False negatives (those who were predicted to not
set showed that most false predictions were false negatives require intubation but were intubated within 48 hours) were the
(those who were predicted to not require intubation but were minority of predictions (Figure 2). Although this model did not
intubated within 48 hours). False positives (those who were have the highest accuracy, it achieved the highest mean recall,
predicted to require intubation but were not intubated within geometric mean, and Fβ-score of 0.228 (SD 0.095), 0.508 (SD
48 hours) were the minority of predictions (Figure 1). The model 0.063), and 0.226 (SD 0.010), respectively. The corresponding
had a mean accuracy of 0.919 (SD 0.028). The corresponding mean accuracy, precision, and specificity were 0.893 (SD 0.016),
mean precision, recall, specificity, geometric mean, and Fβ-score 0.303 (SD 0.089), and 0.955 (SD 0.005), respectively (Table
were 0.521 (SD 0.329), 0.051 (SD 0.030), 0.994 (SD 0.005), 2).
0.337 (SD 0.042), and 0.054 (SD 0.029), respectively (Table
2).
http://www.jmir.org/2021/2/e24246/ J Med Internet Res 2021 | vol. 23 | iss. 2 | e24246 | p. 5
(page number not for citation purposes)
XSL• FO
RenderXJOURNAL OF MEDICAL INTERNET RESEARCH Bolourani et al
Figure 1. The XGBoost model for predicting respiratory failure within 48 hours. (A) ROC curve and (B) PR curve based on a cross-hospital validation
performed by leaving a hospital out as a testing set and using the rest in the training set. Only hospitals with >1000 patients with COVID-19 were
selected for testing sets. The mean ROC and PR curves are shown in dark blue and their corresponding standard deviations are shown in gray. The
MEWS metrics are shown in light yellow. (C) Measurement of the 10 variables with the highest relative importance based on the amount they reduced
the Gini coefficient for the largest hospital testing set. (D) Confusion matrix visually represents the predicted values versus actual prediction for the
largest hospital testing set. AUC: area under the curve of ROC; AUCPR: area under the curve of the precision-recall curve; ED: emergency department;
LIJ: Long Island Jewish; MEWS: Modified Early Warning Score; PR: precision-recall; ROC: receiver operating characteristic.
http://www.jmir.org/2021/2/e24246/ J Med Internet Res 2021 | vol. 23 | iss. 2 | e24246 | p. 6
(page number not for citation purposes)
XSL• FO
RenderXJOURNAL OF MEDICAL INTERNET RESEARCH Bolourani et al
Table 2. Mean area under the curve of the receiver operating characteristic curve, area under the curve of the precision-recall curve, accuracies,
precisions, recalls, specificities, geometric means, and Fβ-score (β=4) for models investigated.
Measure XGBoost, mean XGBoost + SMOTEENN, Logistic regression, Modified Early
(SD) mean (SD) mean (SD) Warning Score
Area under the curve of the receiver operating character- 0.77 (0.05) 0.76 (0.03) 0.70 (0.05) 0.61
istic curve
Area under the curve of the precision-recall curve 0.26 (0.04) 0.24 (0.06) 0.18 (0.06) 0.12
Accuracy 0.919 (0.028) 0.893 (0.016) 0.915 (0.027) 0.913
Precision 0.521 (0.329) 0.303 (0.089) 0.322 (0.375) 0.165
Recall 0.051 (0.030) 0.228 (0.095) 0.009 (0.013) 0.017
Specificity 0.994 (0.005) 0.955 (0.005) 0.998 (0.002) 0.992
Geometric mean 0.337 (0.042) 0.506 (0.063) 0.285 (0.051) 0.296
Fβ-score 0.054 (0.029) 0.226 (0.088) 0.010(0.014) 0.018
http://www.jmir.org/2021/2/e24246/ J Med Internet Res 2021 | vol. 23 | iss. 2 | e24246 | p. 7
(page number not for citation purposes)
XSL• FO
RenderXJOURNAL OF MEDICAL INTERNET RESEARCH Bolourani et al
Figure 2. The XGBoost + SMOTEENN model for predicting respiratory failure within 48 hours. (A) ROC curve and (B) PR curve based on a
cross-hospital validation performed by leaving one hospital out as a testing set and using the remaining hospitals for the training set. Only hospitals
with >1000 patients with COVID-19 were selected for testing sets. The mean ROC and PR curves are shown in dark blue and their corresponding
standard deviations are shown in gray. The MEWS metrics are shown in light yellow. (C) The 10 variables with the highest relative importance measured
by the amount the variable reduced the Gini coefficient. (D) Mean confusion matrix visually represents the predicted values versus actual prediction.
AUC: area under the curve of ROC; AUCPR: area under the curve of the precision-recall curve; ED: emergency department; LIJ: Long Island Jewish;
MEWS: Modified Early Warning Score; PR: precision-recall; ROC: receiver operating characteristic.
We also examined the performance of a logistic regression geometric mean, and Fβ-score were 0.913, 0.165, 0.017, 0.992,
model. The mean AUCs of the ROC and PR curves were 0.70 0.296, and 0.018, respectively.
(SD 0.05) and 0.18 (SD 0.06), respectively. Mean accuracy,
precision, recall, specificity, geometric mean, and Fβ-score were The calibration curves showed that all three models were well
calibrated among all hospital folds, although all three deviated
0.915 (SD 0.027), 0.322 (SD 0.375), 0.009 (SD 0.013), 0.994
from perfect calibration as the fraction of positives increased
(SD 0.005), 0.285 (SD 0.051), and 0.010 (SD 0.014),
(Figure 3). The corresponding mean Brier score for XGBoost,
respectively (Figure 3 and Table 2). MEWS was used to
XGBoost + SMOTEENN, and logistic regression was 0.071
compare ROC and PR curves. MEWS resulted in AUCs of the
(SD 0.019), 0.079 (SD 0.016), and 0.077 (SD 0.018),
ROC and PR curves of 0.61 and 0.12, respectively (Figures
respectively (Figure 3).
1-3). For MEWS, accuracy, precision, recall, specificity,
http://www.jmir.org/2021/2/e24246/ J Med Internet Res 2021 | vol. 23 | iss. 2 | e24246 | p. 8
(page number not for citation purposes)
XSL• FO
RenderXJOURNAL OF MEDICAL INTERNET RESEARCH Bolourani et al
Figure 3. The logistic regression model for predicting respiratory failure within 48 hours. (A) ROC curve and (B) PR curve based on a cross-hospital
validation performed by leaving a hospital out as a testing set and using the rest for the training set. Only hospitals with >1000 patients with COVID-19
were selected for testing sets. The mean ROC and PR curves are shown in dark blue and their corresponding standard deviations are shown in gray.
The MEWS metrics are shown in light yellow. (C) The 10 variables with the highest relative importance measured by the absolute value of the regression
coefficient. (D) Mean confusion matrix visually represents the predicted values versus actual prediction. AUC: area under the curve of ROC; AUCPR:
area under the curve of the precision-recall curve; LIJ: Long Island Jewish; MEWS: Modified Early Warning Score; PR: precision-recall; ROC: receiver
operating characteristic.
earlier discussions about goals of care) and improve patient
Discussion outcomes.
We presented three models (two of which were based on We evaluated three machine learning models: XGBoost,
XGBoost) for predicting early respiratory failure in patients XGBoost + SMOTEENN, and logistic regression [38-40].
given a diagnosis of COVID-19 and admitted to the hospital XGBoost is widely used due to its high efficiency and
from the ED. One model was tilted toward precision and predictability, and it has been used to predict health care
specificity (XGBoost) and the other was tilted toward recall outcomes in patients with [41,42] and without [43-45]
(XGBoost + SMOTEENN). These models are based on baseline COVID-19. In our study, XGBoost was the most accurate
characteristics, ED vital signs, and laboratory measurements. prediction model, with an accuracy of 0.919 (SD 0.028) and
Using an automated tool to estimate the probability of precision of 0.521 (SD 0.329; Figure 1), similar to the findings
respiratory failure could identify at-risk patients for earlier of another study that examined combined outcomes [46].
interventions (eg, closer monitoring, critical care consultation, However, what is different in our model is that it achieves
http://www.jmir.org/2021/2/e24246/ J Med Internet Res 2021 | vol. 23 | iss. 2 | e24246 | p. 9
(page number not for citation purposes)
XSL• FO
RenderXJOURNAL OF MEDICAL INTERNET RESEARCH Bolourani et al
cross-hospital validation. Such accuracy showcases the ability 2). Both models share important predictors, such as information
of the model to separate intubations from nonintubations within about the mode of oxygen delivery, triage acuity, demographic
the 48-hour window of interest. Such a model would be useful information, and respiratory rate. However, XGBoost (the more
for physicians as it more accurately and consistently identifies accurate model with higher precision) adds serum lactate,
patients at high risk for intubation. sodium, and eosinophil percentage to the top 10 most important
variables. This indicates that when precision is important,
We also constructed an XGBoost + SMOTEENN model.
measures such as lactate can rule out the most severe cases by
SMOTEENN was used to improve the sensitivity of our
becoming strong predictors. Among hospitals in Northwell
prediction, as our data set was imbalanced (ie, only ~8% of our
Health, certain hospitals such as Long Island Jewish (which is
COVID-19 cohort were intubated), while keeping deviation
one of the largest in terms of number of patients with
from accuracy and calibration of the model to a minimum.
COVID-19) had a high drop in their predictive ability when
Compared to XGBoost, the XGBoost + SMOTEENN model
logistic regression was used. When Long Island Jewish was
had lower accuracy and precision, but greater recall (or
being validated, the 0.86 AUCROC of the XGBoost model
sensitivity; 0.228 [SD 0.095]; Figure 2). This higher sensitivity
dropped to 0.68 for logistic regression. This could partially be
can identify more patients who require IMV, suggesting that
due to the nature of the outcome predicted (choice of ventilation
this model may be more suitable for broad or automated
from hospital staff), where one would expect different hospitals
screening of patients.
to possibly exhibit higher variability, not only for patient
We also examined the performance of a logistic regression demographics, but also for hospital staff therapy choices.
model to determine whether a compact, linear model could
Variable importance metrics revealed that the linear logistic
accurately predict patient risk (Figure 3 and Table 2). Model
regression models use laboratory variables primarily, whereas
performance was inferior to the XGBoost model. This supports
nonlinear XGBoost-based models prioritize clinical and
earlier reports that machine learning techniques outperform
demographic variables that better capture hospital-specific
classic models of logistic regression in their ability to predict
behavior (eg, oxygen delivery types prior to intubation) and
many prognostic and health outcomes [47-49]. Finally, we
increase the robustness of the model. However, we need to
compared the performance of our predictive machine learning
validate whether providing these variables along with the
models to the widely used MEWS [36]. MEWS was inferior to
probability of respiratory failure would decrease the rate of
all three models described above in most of the measures
identifying at-risk patients. Further prospective studies and
examined.
randomized clinical trials are needed for this validation.
Using the most important variables for our models, we identified
When examining the calibration of the models (Figure 4), we
clinically relevant measures that can best inform clinical
found that all models were well calibrated, yet as the fraction
decision making (Figures 1, 2). The XGBoost model was
of positive cases increased, calibration suffered. This suggests
accurate and precise, as reflected by the low number of false
that if a specific population of patients has a greater likelihood
positives of the model predictions (Figure 1). A more sensitive
of intubation (eg, those aged >70 years, or with specific
alternative to this model would be the XGBoost + SMOTEENN
comorbid conditions), the model would need to be retrained to
model, which had fewer false negatives than XGBoost (Figure
increase its accuracy and calibration.
http://www.jmir.org/2021/2/e24246/ J Med Internet Res 2021 | vol. 23 | iss. 2 | e24246 | p. 10
(page number not for citation purposes)
XSL• FO
RenderXJOURNAL OF MEDICAL INTERNET RESEARCH Bolourani et al
Figure 4. Calibration plots (reliability curve) of the XGBoost, XGBoost + SMOTEENN, and logistic regression models for respiratory failure within
48 hours. Calibration is based on the precision probability (using predict_proba in Python). For creating the plots, sklearn.calibration.CalibratedClassifierCV
(in Python) was used by inserting a fraction of positives and mean predicted values into 10 bins with an increasing fraction of positives (respiratory
failures) for each hospital fold. The mean Brier score (SD) across all hospitals tested corresponding to the model is shown in the figure legend in
parentheses.
Our study has several limitations. We extracted data on nonrebreather oxygen flow in the ED were intubated within 48
intubation timing from our EHR, which may have minor hours. In addition, given that these variables are available to
inaccuracies. Although a consistent temporal inaccuracy could clinicians and part of their decision making, we included them
create bias in underestimating/overestimating the intubation in our model. Finally, we used supervised learning on a
rate, we believe that these small inaccuracies are overcome by homogenous database. Although we used cross-hospital
the average calculated from our large number of cases. Another validation and retrospectively validated our learning method,
limitation is that we relied on data from a multicenter, single external generalizability of these learning methods to other
health system for both implementation and validation. Thus, health systems requires validation in prospective studies and
we were unable to externally validate the models in other health randomized trials. Such high-quality evidence could provide
systems and hospitals with different protocols, which might more clues on clinical and economic impacts, as well as
affect the model’s performance. In addition, because the study measures to improve them.
is retrospective, we can only suggest associations and
COVID-19 has evolved into an extremely challenging clinical
correlations rather than identify the main contributors that lead
and public emergency worldwide, especially in the New York
to intubation and mechanical ventilation. Furthermore, the
City metropolitan area. As public health measures attempt to
numerical missing variables were imputed with weighted
mitigate this disaster by slowing the spread and alleviating the
k-nearest neighbors. Thus, the conclusions made from these
heavy burden placed on health care systems, clinicians must
variables assume uniformity in patient data based on those
make important decisions quickly and hospital administrators
missing values. In the case of nonuniformity, the order of
must manage resources and personnel. Furthermore, as predicted
variable importance might change. Additionally, some clinical
by many models [50-52], we are in the midst of a second wave
variables included in the model may appear to be obvious
of infection. Our models could inform clinical care by offering
correlates of the clinical decision for intubation within 48 hours
complementary performance characteristics (one model with
(eg, having nonrebreather oxygen flow as the most invasive
superior recall, the other with greater precision) and supporting
form of ventilation). However, the association of all included
clinical decision making as we tackle this unprecedented public
variables is not deterministic: only 453 of 2633 patients on
health crisis.
http://www.jmir.org/2021/2/e24246/ J Med Internet Res 2021 | vol. 23 | iss. 2 | e24246 | p. 11
(page number not for citation purposes)
XSL• FO
RenderXJOURNAL OF MEDICAL INTERNET RESEARCH Bolourani et al
Acknowledgments
This work was supported by R24AG064191 from the National Institute on Aging, R01LM012836 from the National Library of
Medicine, and R35GM118337 from the National Institute for General Medical Sciences (all National Institutes of Health).
Members of the Northwell COVID-19 Research Consortium include: Matthew Barish, Stuart L Cohen, Kevin Coppa, Karina W
Davidson, Shubham Debnath, Lawrence Lau, Todd J Levy, Alexander Makhnevich, Marc D Paradis, and Viktor Tóth.
We acknowledge and honor all of our Northwell team members who consistently put themselves in harm’s way during the
COVID-19 pandemic. We dedicate this article to them, as well as all patients, as their vital contributions to knowledge about
COVID-19 made it possible.
Authors' Contributions
SB, DPB, and TPZ conceptualized and designed the study. SB, JSH, and TPZ had full access to all data in the study and are
responsible for the integrity of the data. SB and JSH performed data extraction and cleaning. MB, PW, TM, and JSH contributed
to many discussions during manuscript development. SB, DPB, and TPZ contributed to drafts of the manuscript. SB trained and
validated the models. SB and TPZ designed and created the figures. DBP and TPZ critically reviewed the paper, and PW and
TPZ obtained funding. The Northwell COVID-19 Research Consortium prioritized this manuscript, organized meetings between
contributing authors, and provided support in finalizing the manuscript for submission. All named authors read and approved the
final submitted manuscript.
Conflicts of Interest
None declared.
Multimedia Appendix 1
Definitions of accuracy, precision, recall, specificity, geometric means, and Fβ-score.
[DOCX File , 8 KB-Multimedia Appendix 1]
Multimedia Appendix 2
Modified Early Warning Score calculation based on vital sign measurements.
[DOCX File , 8 KB-Multimedia Appendix 2]
References
1. WHO Director-General's opening remarks at the media briefing on COVID-19 - 11 March 2020. World Health Organization.
2020 Mar 11. URL: https://www.who.int/dg/speeches/detail/who-director-general-s-opening-remarks-at-the-
media-briefing-on-covid-19---11-march-2020 [accessed 2021-02-01]
2. Coronavirus in the US: Latest Map and Case Count. The New York Times. 2020 Mar 3. URL: https://www.nytimes.com/
interactive/2020/us/coronavirus-us-cases.html [accessed 2020-05-08]
3. Richardson S, Hirsch J, Narasimhan M, Crawford J, McGinn T, Davidson K, the Northwell COVID-19 Research Consortium,
et al. Presenting Characteristics, Comorbidities, and Outcomes Among 5700 Patients Hospitalized With COVID-19 in the
New York City Area. JAMA 2020 May 26;323(20):2052-2059 [FREE Full text] [doi: 10.1001/jama.2020.6775] [Medline:
32320003]
4. Myers L, Parodi S, Escobar G, Liu V. Characteristics of Hospitalized Adults With COVID-19 in an Integrated Health Care
System in California. JAMA 2020 Jun 02;323(21):2195-2198 [FREE Full text] [doi: 10.1001/jama.2020.7202] [Medline:
32329797]
5. Tsertsvadze T, Ezugbaia M, Endeladze M, Ratiani L, Javakhishvili N, Mumladze L, et al. Characteristics and outcomes of
hospitalized adult COVID-19 patients in Georgia. MedRxiv Preprint published online on October 27, 2020. [doi:
10.1101/2020.10.23.20218255]
6. Ruan Q, Yang K, Wang W, Jiang L, Song J. Clinical predictors of mortality due to COVID-19 based on an analysis of data
of 150 patients from Wuhan, China. Intensive Care Med 2020 May;46(5):846-848 [FREE Full text] [doi:
10.1007/s00134-020-05991-x] [Medline: 32125452]
7. Ruan Q, Yang K, Wang W, Jiang L, Song J. Correction to: Clinical predictors of mortality due to COVID-19 based on an
analysis of data of 150 patients from Wuhan, China. Intensive Care Med 2020 Jun;46(6):1294-1297 [FREE Full text] [doi:
10.1007/s00134-020-06028-z] [Medline: 32253449]
8. Goyal P, Choi J, Pinheiro L, Schenck E, Chen R, Jabri A, et al. Clinical Characteristics of Covid-19 in New York City. N
Engl J Med 2020 Jun 11;382(24):2372-2374 [FREE Full text] [doi: 10.1056/NEJMc2010419] [Medline: 32302078]
9. Levitan R. Opinion: The Infection That's Silently Killing Coronavirus Patients. The New York Times. 2020 Apr 20. URL:
https://www.nytimes.com/2020/04/20/opinion/sunday/coronavirus-testing-pneumonia.html [accessed 2020-05-08]
http://www.jmir.org/2021/2/e24246/ J Med Internet Res 2021 | vol. 23 | iss. 2 | e24246 | p. 12
(page number not for citation purposes)
XSL• FO
RenderXJOURNAL OF MEDICAL INTERNET RESEARCH Bolourani et al
10. Tobin MJ. Basing Respiratory Management of COVID-19 on Physiological Principles. Am J Respir Crit Care Med 2020
Jun 01;201(11):1319-1320 [FREE Full text] [doi: 10.1164/rccm.202004-1076ED] [Medline: 32281885]
11. Kangelaris KN, Ware LB, Wang CY, Janz DR, Zhuo H, Matthay MA, et al. Timing of Intubation and Clinical Outcomes
in Adults With Acute Respiratory Distress Syndrome. Crit Care Med 2016 Jan;44(1):120-129 [FREE Full text] [doi:
10.1097/CCM.0000000000001359] [Medline: 26474112]
12. Serin SO, Karaoren G, Esquinas AM. Delayed admission to ICU in acute respiratory failure: Critical time for critical
conditions. Am J Emerg Med 2017 Oct;35(10):1571-1572. [doi: 10.1016/j.ajem.2017.04.026] [Medline: 28502761]
13. Renaud B, Santin A, Coma E, Camus N, Van Pelt D, Hayon J, et al. Association between timing of intensive care unit
admission and outcomes for emergency department patients with community-acquired pneumonia. Crit Care Med 2009
Nov;37(11):2867-2874. [doi: 10.1097/CCM.0b013e3181b02dbb] [Medline: 19770748]
14. Liu V, Kipnis P, Rizk NW, Escobar GJ. Adverse outcomes associated with delayed intensive care unit transfers in an
integrated healthcare system. J Hosp Med 2012 Mar;7(3):224-230. [doi: 10.1002/jhm.964] [Medline: 22038879]
15. Churpek MM, Carey KA, Dela Merced N, Prister J, Brofman J, Edelson DP. Validation of Early Warning Scores at Two
Long-Term Acute Care Hospitals. Crit Care Med 2019 Dec;47(12):e962-e965 [FREE Full text] [doi:
10.1097/CCM.0000000000004026] [Medline: 31567342]
16. Churpek MM, Yuen TC, Winslow C, Meltzer DO, Kattan MW, Edelson DP. Multicenter Comparison of Machine Learning
Methods and Conventional Regression for Predicting Clinical Deterioration on the Wards. Crit Care Med 2016
Feb;44(2):368-374 [FREE Full text] [doi: 10.1097/CCM.0000000000001571] [Medline: 26771782]
17. Dziadzko MA, Novotny PJ, Sloan J, Gajic O, Herasevich V, Mirhaji P, et al. Multicenter derivation and validation of an
early warning score for acute respiratory failure or death in the hospital. Crit Care 2018 Oct 30;22(1):286 [FREE Full text]
[doi: 10.1186/s13054-018-2194-7] [Medline: 30373653]
18. Yu S, Leung S, Heo M, Soto G, Shah R, Gunda S, et al. Comparison of risk prediction scoring systems for ward patients:
a retrospective nested case-control study. Crit Care 2014 Jun 26;18(3):R132 [FREE Full text] [doi: 10.1186/cc13947]
[Medline: 24970344]
19. Subbe CP, Slater A, Menon D, Gemmell L. Validation of physiological scoring systems in the accident and emergency
department. Emerg Med J 2006 Nov;23(11):841-845 [FREE Full text] [doi: 10.1136/emj.2006.035816] [Medline: 17057134]
20. Debnath S, Barnaby D, Coppa K, Makhnevich A, Kim E, Chatterjee S, Northwell COVID-19 Research Consortium. Machine
learning to assist clinical decision-making during the COVID-19 pandemic. Bioelectron Med 2020;6:14 [FREE Full text]
[doi: 10.1186/s42234-020-00050-8] [Medline: 32665967]
21. Ferrari D, Milic J, Tonelli R, Ghinelli F, Meschiari M, Volpi S, et al. Machine learning in predicting respiratory failure in
patients with COVID-19 pneumonia-Challenges, strengths, and opportunities in a global health emergency. PLoS One
2020;15(11):e0239172 [FREE Full text] [doi: 10.1371/journal.pone.0239172] [Medline: 33180787]
22. Assaf D, Gutman Y, Neuman Y, Segal G, Amit S, Gefen-Halevi S, et al. Utilization of machine-learning models to accurately
predict the risk for critical COVID-19. Intern Emerg Med 2020 Nov;15(8):1435-1443 [FREE Full text] [doi:
10.1007/s11739-020-02475-0] [Medline: 32812204]
23. Haimovich A, Ravindra N, Stoytchev S, Young H, Wilson F, van Dijk D, et al. Development and Validation of the Quick
COVID-19 Severity Index: A Prognostic Tool for Early Clinical Decompensation. Ann Emerg Med 2020 Oct;76(4):442-453
[FREE Full text] [doi: 10.1016/j.annemergmed.2020.07.022] [Medline: 33012378]
24. Batista GEAPA, Prati RC, Monard MC. A study of the behavior of several methods for balancing machine learning training
data. SIGKDD Explor Newsl 2004 Jun 01;6(1):20. [doi: 10.1145/1007730.1007735]
25. Yu H, Huang F, Lin C. Dual coordinate descent methods for logistic regression and maximum entropy models. Mach Learn
2010 Nov 11;85(1-2):41-75. [doi: 10.1007/s10994-010-5221-8]
26. Chen T, Guestrin C. XGBoost: A Scalable Tree Boosting System. 2016 Apr 13 Presented at: Proceedings of the 22nd ACM
SIGKDD International Conference on Knowledge Discovery and Data Mining; 2016; San Francisco, CA p. 785-794.
27. Lemaître G, Nogueira F, Aridas C. Imbalanced-learn: A Python Toolbox to Tackle the Curse of Imbalanced Datasets in
Machine Learning. J Mach Learn Res 2017;18(17):5 [FREE Full text]
28. More A. Survey of resampling techniques for improving classification performance in unbalanced datasets. arXiv Preprint
posted online on August 22, 2016. [FREE Full text]
29. Troyanskaya O, Cantor M, Sherlock G, Brown P, Hastie T, Tibshirani R, et al. Missing value estimation methods for DNA
microarrays. Bioinformatics 2001 Jun;17(6):520-525. [doi: 10.1093/bioinformatics/17.6.520] [Medline: 11395428]
30. Harris SL, Harris DM. Sequential Logic Design. In: Digital Design and Computer Architecture. Burlington, MA, USA:
Morgan Kaufmann; 2012.
31. Buitinck L, Louppe G, Blondel M, Pedregosa F, Mueller A, Grisel O, et al. API design for machine learning software:
experiences from the scikit-learn project. arXiv Preprint posted online on September 1, 2013.
32. Pedregosa F, Varoquaux G, Gramfort A, Michel V, Thirion B, Grisel O, et al. Imputation transformer for completing
missing values. Scikit-learn: Machine Learning in Python. 2011. URL: https://scikit-learn.org/stable/modules/generated/
sklearn.impute.SimpleImputer.html [accessed 2020-05-08]
http://www.jmir.org/2021/2/e24246/ J Med Internet Res 2021 | vol. 23 | iss. 2 | e24246 | p. 13
(page number not for citation purposes)
XSL• FO
RenderXJOURNAL OF MEDICAL INTERNET RESEARCH Bolourani et al
33. Pedregosa F, Varoquaux G, Gramfort A, Michel V, Thirion B, Grisel O, et al. Imputation for completing missing values
using k-Nearest Neighbors. Scikit-learn: Machine Learning in Python. 2011. URL: https://scikit-learn.org/stable/modules/
generated/sklearn.impute.KNNImputer.html [accessed 2020-05-08]
34. Gerry S, Birks J, Bonnici T, Watkinson P, Kirtley S, Collins G. Early warning scores for detecting deterioration in adult
hospital patients: a systematic review protocol. BMJ Open 2017 Dec 03;7(12):e019268 [FREE Full text] [doi:
10.1136/bmjopen-2017-019268] [Medline: 29203508]
35. Bilben B, Grandal L, Søvik S. National Early Warning Score (NEWS) as an emergency department predictor of disease
severity and 90-day survival in the acutely dyspneic patient - a prospective observational study. Scand J Trauma Resusc
Emerg Med 2016 Jun 02;24:80 [FREE Full text] [doi: 10.1186/s13049-016-0273-9] [Medline: 27250249]
36. Subbe CP, Kruger M, Rutherford P, Gemmel L. Validation of a modified Early Warning Score in medical admissions.
QJM 2001 Oct;94(10):521-526. [doi: 10.1093/qjmed/94.10.521] [Medline: 11588210]
37. Hripcsak G. Writing Arden Syntax Medical Logic Modules. Comput Biol Med 1994 Sep;24(5):331-363. [doi:
10.1016/0010-4825(94)90002-7] [Medline: 7705066]
38. Sheppard C. Tree-based Machine Learning Algorithms: Decision Trees, Random Forests, and Boosting. Scotts Valley,
CA: Createspace Independent Publishing Platform; Sep 09, 2017.
39. Mani I, Zhang I. kNN approach to unbalanced data distributions: a case study involving information extraction. 2003
Presented at: International Conference on Machine Learning. Workshop on Learning from Imbalanced Datasets II; 2003;
Washington, DC URL: https://www.site.uottawa.ca/~nat/Workshop2003/jzhang.pdf
40. Yu H, Huang F, Lin C. Dual coordinate descent methods for logistic regression and maximum entropy models. Mach Learn
2010 Nov 11;85(1-2):41-75. [doi: 10.1007/s10994-010-5221-8]
41. Yan L, Zhang H, Goncalves J, Xiao Y, Wang M, Guo Y, et al. An interpretable mortality prediction model for COVID-19
patients. Nat Mach Intell 2020 May 14;2(5):283-288. [doi: 10.1038/s42256-020-0180-7]
42. Kumar A, Gupta PK, Srivastava A. A review of modern technologies for tackling COVID-19 pandemic. Diabetes Metab
Syndr 2020;14(4):569-573 [FREE Full text] [doi: 10.1016/j.dsx.2020.05.008] [Medline: 32413821]
43. Xu Z, Wang Z. A Risk Prediction Model for Type 2 Diabetes Based on Weighted Feature Selection of Random Forest and
XGBoost Ensemble Classifier. : IEEE; 2019 Presented at: 11th International Conference on Advanced Computational
Intelligence (ICACI); 2019; Guilin, China. [doi: 10.1109/icaci.2019.8778622]
44. Sharma A, Verbeke WJMI. Improving Diagnosis of Depression With XGBOOST Machine Learning Model and a Large
Biomarkers Dutch Dataset (n = 11,081). Front Big Data 2020 Apr 30;3:1. [doi: 10.3389/fdata.2020.00015]
45. Zabihi M, Kiranyaz S, Gabbouj M. Sepsis Prediction in Intensive Care Unit Using Ensemble of XGboost Models. : IEEE;
2019 Sep Presented at: Computing in Cardiology Conference (CinC); 2019; Singapore, Singapore URL: https://ieeexplore.
ieee.org/document/9005564 [doi: 10.22489/cinc.2019.238]
46. Liang W, Liang H, Ou L, Chen B, Chen A, Li C, China Medical Treatment Expert Group for COVID-19. Development
and Validation of a Clinical Risk Score to Predict the Occurrence of Critical Illness in Hospitalized Patients With COVID-19.
JAMA Intern Med 2020 Aug 01;180(8):1081-1089 [FREE Full text] [doi: 10.1001/jamainternmed.2020.2033] [Medline:
32396163]
47. Kourou K, Exarchos TP, Exarchos KP, Karamouzis MV, Fotiadis DI. Machine learning applications in cancer prognosis
and prediction. Comput Struct Biotechnol J 2015;13:8-17 [FREE Full text] [doi: 10.1016/j.csbj.2014.11.005] [Medline:
25750696]
48. Liu NT, Salinas J. Machine Learning for Predicting Outcomes in Trauma. Shock 2017 Nov;48(5):504-510. [doi:
10.1097/SHK.0000000000000898] [Medline: 28498299]
49. Ferroni P, Zanzotto F, Riondino S, Scarpato N, Guadagni F, Roselli M. Breast Cancer Prognosis Using a Machine Learning
Approach. Cancers (Basel) 2019 Mar 07;11(3):328 [FREE Full text] [doi: 10.3390/cancers11030328] [Medline: 30866535]
50. Xu S, Li Y. Beware of the second wave of COVID-19. Lancet 2020 Apr 25;395(10233):1321-1322 [FREE Full text] [doi:
10.1016/S0140-6736(20)30845-X] [Medline: 32277876]
51. Bibkov B, Bibkov A. Communication on COVID-19 to community - measures to prevent a second wave of epidemic. OSF
Preprints. Preprint published online on March 24, 2020 [FREE Full text] [doi: 10.31219/osf.io/ea9jm]
52. Strzelecki A. The second worldwide wave of interest in coronavirus since the COVID-19 outbreaks in South Korea, Italy
and Iran: A Google Trends study. Brain Behav Immun 2020 Aug;88:950-951 [FREE Full text] [doi:
10.1016/j.bbi.2020.04.042] [Medline: 32311493]
Abbreviations
AUC: area under the curve
AUCPR: area under the curve of the precision-recall curve
AUCROC: area under the curve of the receiver operating characteristic curve
ED: emergency department
EHR: electronic health record
ESI: Emergency Severity Index
http://www.jmir.org/2021/2/e24246/ J Med Internet Res 2021 | vol. 23 | iss. 2 | e24246 | p. 14
(page number not for citation purposes)
XSL• FO
RenderXJOURNAL OF MEDICAL INTERNET RESEARCH Bolourani et al
ICU: intensive care unit
IMV: invasive mechanical ventilation
MEWS: Modified Early Warning Score
PR: precision-recall
ROC: receiver operating characteristic
SMOTE: synthetic minority oversampling
SMOTEENN: oversampling using SMOTE and cleaning using edited nearest neighbors
Edited by G Eysenbach; submitted 10.09.20; peer-reviewed by Y Xiang, S Nagavally, M Elbattah; comments to author 30.11.20;
revised version received 18.12.20; accepted 18.01.21; published 10.02.21
Please cite as:
Bolourani S, Brenner M, Wang P, McGinn T, Hirsch JS, Barnaby D, Zanos TP, Northwell COVID-19 Research Consortium
A Machine Learning Prediction Model of Respiratory Failure Within 48 Hours of Patient Admission for COVID-19: Model Development
and Validation
J Med Internet Res 2021;23(2):e24246
URL: http://www.jmir.org/2021/2/e24246/
doi: 10.2196/24246
PMID: 33476281
©Siavash Bolourani, Max Brenner, Ping Wang, Thomas McGinn, Jamie S Hirsch, Douglas Barnaby, Theodoros P Zanos,
Northwell COVID-19 Research Consortium. Originally published in the Journal of Medical Internet Research (http://www.jmir.org),
10.02.2021. This is an open-access article distributed under the terms of the Creative Commons Attribution License
(https://creativecommons.org/licenses/by/4.0/), which permits unrestricted use, distribution, and reproduction in any medium,
provided the original work, first published in the Journal of Medical Internet Research, is properly cited. The complete bibliographic
information, a link to the original publication on http://www.jmir.org/, as well as this copyright and license information must be
included.
http://www.jmir.org/2021/2/e24246/ J Med Internet Res 2021 | vol. 23 | iss. 2 | e24246 | p. 15
(page number not for citation purposes)
XSL• FO
RenderXYou can also read