A windthrow model for urban trees with application to storm "Xavier"
←
→
Page content transcription
If your browser does not render page correctly, please read the page content below
B      Meteorologische Zeitschrift, PrePub DOI 10.1127/metz/2018/0905
       © 2018 The authors
                                                                                                                  Urban Meteorology

A windthrow model for urban trees with application to storm
“Xavier”
Günter Gross∗

Institut für Meteorologie und Klimatologie, Universität Hannover, Germany
(Manuscript received January 21, 2018; in revised form May 17, 2018; accepted June 11, 2018)

             Abstract
             A three-dimensional meteorological micro-scale model was combined with a forestry windthrow tool to study
             the risk of urban trees under stormy conditions. The numerical results for an isolated individual tree are
             compared to general findings from forestry and pulling experiments in the field. It was found that the model
             is suitable to capture the critical wind speed in the right order of magnitude which causes strong hazards to
             trees. The new tool was applied to a limited real city environment during storm “Xavier”, where significant
             and extensive tree damage have been observed. A comparison of the numerical results with the observations
             demonstrates a very reasonable agreement not only for the onset of windthrow but also for the right areal
             distribution during different phases of the storm.
             Keywords: Micro-scale simulation, windthrow model, urban trees, “Xavier”

1 Introduction                                                               uprooting increases with an effective root-soil plate an-
                                                                             chorage. However, urban trees are more vulnerable be-
Trees are indispensable and integral parts of the urban                      cause the anchorage is reduced by a limited root volume
environment because of the multitude of advantages.                          and modifications in root architecture, and wind forces
Caused by modifications in the surface energy budget,                        are enhanced by specific air flow features in streets and
temperatures in residential areas may occasionally be                        around individual buildings. During high wind speed sit-
more than 10 K warmer than the nearby countryside                            uations there is a potential safety risk posed to the pub-
(Kuttler, 2011). Trees reduce this heat island effect                        lic and infrastructure from falling branches and trees as
by lowering the air temperature through shade and an                         happened in the very recent past. In 2014 high wind
increased evapotranspiration. This results also in lower-                    speeds triggered by the storm “Ela” damaged and up-
ing heat stress levels and a significant improvement of                      rooted more than 20,000 urban trees in the city of Düs-
outdoor thermal comfort for city residents (Lee et al.,                      seldorf (Germany). For a rather similar situation in 2017
2013). In a future climate, where we expect a tempera-                       during the passage of depression “Xavier” severe dam-
ture increase of 3–4 K, blue and green design elements                       age on several thousands of urban trees have been ob-
are, in addition to a conversion of rural to urban areas                     served in many cities in the northern part of Germany.
and the essential reduction of air pollutant emissions,                          Uprooting, stem breakage and other failures of trees
very effective and helpful measures to improve the ur-                       by wind loads lead to significant costs for communities,
ban climate (Gross, 2017; Shashua-Bar and Hoff-                              extensive damage to urban infrastructure and danger to
man, 2004). Urban trees as an individual tree, an avenue                     people. In order to enhance current knowledge and to
or a park are known to have a wide range of benefits to                      understand the multitude of interactions between trees,
plan and develop resilient and liveable cities (Salmond                      wind and the environment, many experimental studies
et al., 2016).                                                               have been carried out in the field (e.g. Milne, 1991;
    Besides the powerful advantages, trees may consti-                       Cermak et al., 2015) and in wind tunnels (e.g. Ruck and
tute also a danger to the residents. Depending on the                        Schmitt, 1986; Wood, 1995) to identify the causes of
species and the history of environmental stress during                       tree failure.
their lifespan like soil compaction, drainage problems,                          In addition, models of different complexity are avail-
droughts and air pollution (Roloff, 2016), many trees                        able to assess and forecast air flow and wind effects on
can grow to large objects. With increasing tree height the                   individual trees (e.g. Gross, 1993; Kormas et al., 2016)
wind forces acting upon stem and branches can be large,                      and larger forest stands (Gardiner et al., 2008). Also
and as a last consequence major damage to parts or even                      in forestry it is of great importance to estimate possible
stem breaking or uprooting of the entire tree may result                     damage and economic losses due to storms. Two mecha-
during strong wind conditions. The resistance to such an                     nistic wind damage risk models are widely used for cal-
                                                                             culating the danger of windthrow for specific synoptic
∗ Corresponding author: : Günter Gross, Institut für Meteorologie und Kli-   situations. The key component of the models HWIND
matologie, Universität Hannover, Herrenhäuser Str. 2, 30419 Hannover, Ger-   (Peltola and Kellomäki, 1993) and GALES (Gar-
many, e-mail: gross@muk.uni-hannover.de                                      diner et al., 2000) is the calculation of a critical wind

                                                                                                                         © 2018 The authors
DOI 10.1127/metz/2018/0905                                   Gebrüder Borntraeger Science Publishers, Stuttgart, www.borntraeger-cramer.com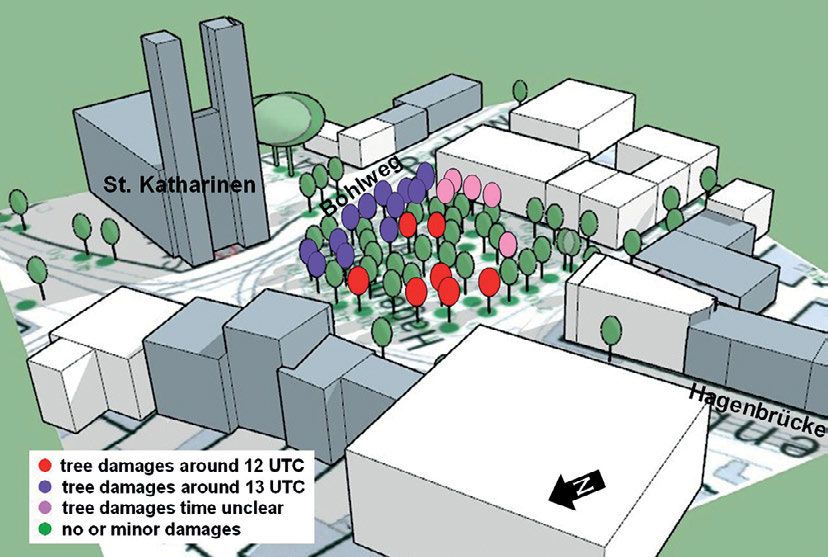
2         G. Gross: A windthrow model for urban trees with application to storm “Xavier”          Meteorol. Z., PrePub Article, 2018

speed in excess of which severe storm damage of forests           with empirical drag coefficient cd , air density ρ [kg m−3 ],
can no longer be prevented. In GALES, wind is calcu-              mean wind speed U [m s−1 ] and leaf area density b
lated 10 m above the displacement height of a larger ho-          [m2 m−3 ]. For increasing wind speed the tree stream-
mogeneous coniferous forest, and model parameteriza-              lines but wind-induced force is not growing as strong as
tions are adjusted to typical situations in Scotland. In          Eq. (2.1) calculates. This effect is considered by a mod-
the HWIND model, the necessary wind information is                ification of cd in line with Mayhead (1973) and Wood
calculated 10 m above ground downwind of the forest               (1995):
edge, and verification has been demonstrated for typical
forests in Finland. Although both models are extremely                           cd = 0.6 exp(−0.0009779U 2 ).                (2.2)
helpful tools for practical applications, shortcomings are
identified for other tree species and for complex stands          When the wind force Fu deflects the tree away from the
and landscapes (Gardiner et al., 2008).                           vertical axis, an additional gravitational force is acting:
    The distribution of meteorological variables within a                                  Fg (z) = M(z)g.                    (2.3)
city environment is significantly determined by existing
trees. This has been demonstrated by urban applications           M [kg] is the green mass of the stem and crown at a
of various building and stand resolved micro-scale mod-           certain height, and g [m s−2 ] is the gravitational constant.
els (Gross, 2012; Salim et al., 2015). In Bruse (2016)            The resulting turning moment T [N m] acting on the tree
the wind risk of urban trees is addressed as well as              is calculated by
longer term effects like vulnerabilities with respect to
pests or water stress.                                                          T (z) = {Fu (z)z + Fg (z)x(z)} gust.          (2.4)
    In the paper presented here, the basic findings from          z [m] is the height above the base of the tree, and x [m]
forestry mechanistic models are included in a micro-              is horizontal displacement from the vertical which is
scale meteorological model. This new analysis tool can            estimated by (Peltola and Kellomäki, 1993):
be used for urban tree protection by identifying wind
endangered areas within a building environment.                              Fu                   a      l(z)
                                                                  x(z) =           a htree 3 −
                                                                                    2
                                                                                                      −3              z≥a
                                                                          6 MEL I               htree    htree
                                                                                                                        .
2 The model system                                                           Fu               l(z) − d (l(z) − d)3
                                                                  x(z) =            a 2−3
                                                                                      2
                                                                                                       +              z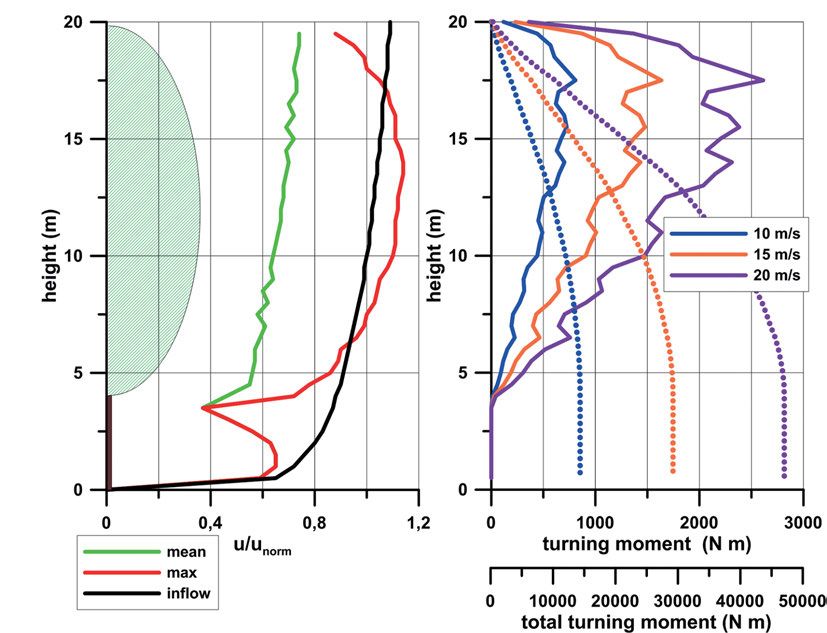
Meteorol. Z., PrePub Article, 2018           G. Gross: A windthrow model for urban trees with application to storm “Xavier”      3

                                                                     Schindler, 2002; Peltola et al., 1999; Jäger, 2014).
                                                                     In this study, a gust factor of gust = 2.0 is used.
                                                                     2.2 The wind model
                                                                     It appears from the above presentation that tree failure
                                                                     depends strongly on local wind force. To calculate wind
                                                                     distribution in a highly complex urban environment with
                                                                     buildings and trees, a micro-scale numerical model is
                                                                     used and combined with the tree model described above.
                                                                         Mean wind and turbulence are calculated with the
                                                                     model ASMUS, which is based on the Navier-Stokes
                                                                     equations, the continuity equation and the first law of
                                                                     thermodynamics. The eddy exchange coefficient, intro-
                                                                     duced by Reynolds averaging and flux-gradient param-
                                                                     eterization, is determined via the turbulence kinetic en-
                                                                     ergy E by an additional prognostic equation. A detailed
                                                                     model description is given in Gross (2014). The tree
                                                                     canopy is considered as a porous structure with a three-
                                                                     dimensional distribution of leaf area density b. The ef-
                                                                     fects of a tree canopy on the meteorological variables are
Figure 1: Schematic presentation of the tree model.
                                                                     parameterized following the pioneering work of Rau-
                                                                     pach and Shaw (1982) with an additional drag term.
Table 1: Tree model parameters.                                      Mean wind components ui are reduced according to
   leaf area density [m2 m−3 ]              1.0                                         ∂ui
                                                                                            = . . . − cd bui U                (2.8)
   stem density [kg m−3 ]                   850                                         ∂t
   taper                                    1:100
   modulus of elasticity MEL [MPa]          7,000                    and turbulence is enhanced
   modulus of rupture MOR [MPa]             30                                           ∂E
   depth of root-soil plate [m]             hsoil = 0.9 htree /20                            = . . . cd bU 3 .                (2.9)
                                                                                         ∂t
   diameter of root-soil plate [m]          dsoil = 1.35 htree /20
   Contribution of root-soil plate weight   30                           The boundary conditions for the mean wind at the
   to total anchorage [%]                                            ground and at the building surfaces are zero, and tur-
   soil density [kg m−3 ]                   1,500                    bulence kinetic energy is proportional to the local fric-
                                                                     tion velocity squared. The friction velocity is calculated
                                                                     assuming a logarithmic wind profile between the sur-
tree parameters are shown in Fig. 1. In the crown with               face and the closest grid value in the atmosphere. At
diameter dcr and height hcr , leaves are concentrated in             the upper boundary an undisturbed situation is assumed
the outer two grid volumes. The stem with a prescribed               with given values for wind and turbulence kinetic en-
diameter at breast height DBH tapers from below to tree              ergy, while at the lateral boundaries no-flux conditions
height htree , and for the root-soil plate, responsible for          for all variables are used.
the anchorage, depth hsoil and diameter dsoil must be                    The model equations are solved on a numerically
specified. Because of a lack of local tree information,              staggered grid where all scalar quantities are arranged in
plausible magnitudes of the parameter, which are within              the centre of the grid volume, while velocity components
the range of observations, are adopted here to run the               are defined at the corresponding side walls. The pressure
analysis tool. Except where noticed otherwise, tree char-            disturbance is calculated by solving a three-dimensional
acteristics necessary for the tree model as listed in Ta-            discrete Poisson equation directly by Gaussian elimina-
ble 1 are used here (adopted and derived from Peltola                tion in the vertical and fast Fourier transforms in the hor-
and Kellomäki, 1993 and Peltola et al., 1999).                       izontal directions. Depending on the numerical study, a
    For typical and persistent wind conditions trees have            fine grid resolution of 0.5–2 m is used for all directions.
developed an optimized structure to resist dynamical
loads. During strong wind conditions this load will be               3 Results
much greater, as caused by occasional and sporadic wind
gusts. At least in a crude approximation this effect can be          The model system described above was used to study the
considered by an empirical gust factor (Gardiner et al.,             effects of high wind conditions on individual idealized
2008). The attempt to describe the complex interaction               trees. First, a study with a single tree in a plain was
between turbulent wind and a single tree by a simple                 performed to test the interactions against knowledge and
term results in a wide range of estimated gust factors.              findings from forestry. The application of the model for
However, the range is not too large, and typical values              a realistic storm scenario in an urban environment will
are in the order of 1.5 to 2.5 (Mayer, 1985; Mayer and               be discussed afterwards.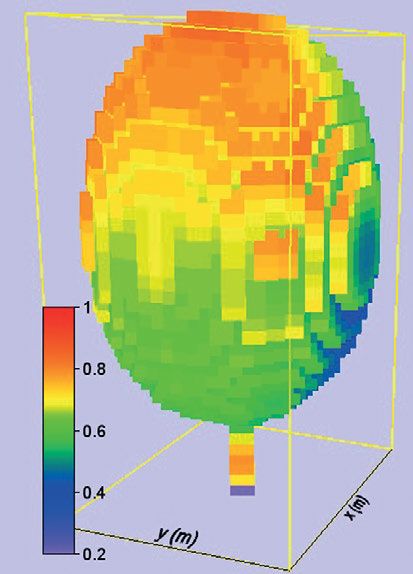
4           G. Gross: A windthrow model for urban trees with application to storm “Xavier”             Meteorol. Z., PrePub Article, 2018

Figure 2: Mean wind speed normalized with the undisturbed 10 m value. Left: three dimensional distribution above the tree surface.
Right above: horizontal cross section at a height of 12 m (middle of the crown) Right below: vertical cross section along the centre. Grey
areas indicate leaf area.

3.1 Numerical experiment with a single tree                           subsections of the total simulation region is presented
                                                                      in a horizontal cross-section through the centre of the
The air flow around and through individual trees has                  crown and a vertical cross-section along the middle of
been studied in wind tunnels (e.g. Ruck and Schmitt,                  the tree. From the vertical cross-section it is evident that
1986; Gromke and Ruck, 2008) and with numerical                       the oncoming wind is forced to avoid the obstacle by
models (e.g. Gross, 1993; Mochida et al., 2008). Based                an over- and underflow. High wind speeds are simulated
on these experiments a number of characteristic fea-                  near the top of the tree on the windward side and a
tures are known, like higher winds near the top and                   secondary maximum in the trunk space. The air flow
along the sides of the tree, a wake region behind and                 is strongly reduced in front of the tree but nevertheless
a strong underflow in the stem region. These typical fea-             enters the crown due to the streamlining of the tree
tures of the air flow will be compared to the simulated               elements.
results presented below. A 20 m high model tree with                      The dominant feature behind the obstacle is a wake
a 4 m stem and a ball-shaped crown with dcr = 10 m                    region with low wind speed. The specific structure of
and hcr = 16 m was adopted here. Leaves are arranged                  this wake depends strongly on the strength of the super-
in the outer two grid cells with constant leaf area den-              imposed wind and the permeability of the tree with recir-
sity of b = 1 m2 m−3 . The grid resolution in all di-                 culation zone being smaller, extended, or even detached
rections is 0.5 m. For a neutral stratified atmosphere a              compared e.g. to solid bodies. The air flow is forced not
logarithmic wind profile with surface roughness length                only to go over the obstacle but also around by a lateral
of 0.01 m and a superimposed mean wind along the x-                   movement causing a wind speed maximum on both sides
direction with U = 10 m s−1 at 10 m is prescribed.                    of the tree. This feature together with the lateral exten-
    In Fig. 2 the oncoming wind component, normalized                 sion of the wake is shown in the horizontal cross-section
with the undisturbed value at 10 m height, for small                  in Fig. 2.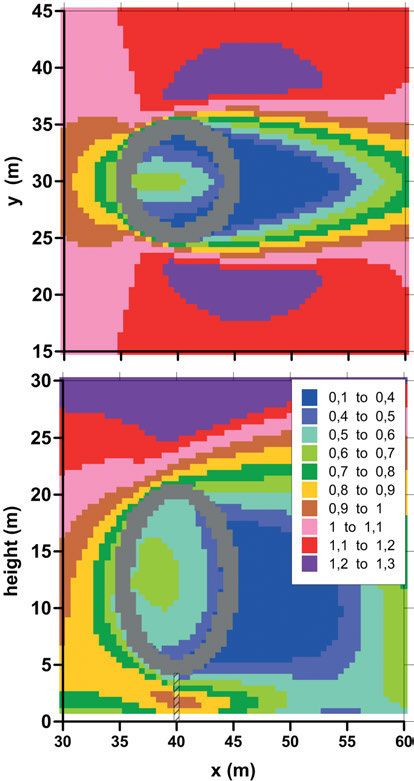
Meteorol. Z., PrePub Article, 2018         G. Gross: A windthrow model for urban trees with application to storm “Xavier”         5

Figure 3: Left: Vertical profiles for mean wind and maximum wind along the windward-side of the tree normalized with the undisturbed
10 m wind. Right: Vertical profiles of local (solid line) and total (dashed line) turning moment for different wind speeds at 10 m.

    The mean wind acting on the outer parts of the tree is         1-m segments along the stem are calculated and inte-
the important parameter for estimating the load and the            grated down from tree top to bottom. Such calculations
risk for windthrow and stem breakage. The simulated                were carried out for different wind speeds, and results
near surface distribution around the tree of the local,            are given in Fig. 3. The increasing mean wind speed with
normalized wind is given in Fig. 2. High wind speeds               height is the reason for the larger values of T in the up-
are calculated in the upper part and in the trunk zone,            per part of the tree, and the stronger the oncoming wind
while the beginning of the wake region is indicated at             the larger the turning moments for 1-m segments are.
the lee side.                                                      The upper part of the tree provides a larger portion to
    For calculating the empirical estimates for wind load          the total turning moment than the lower part with weak
after e.g. Peltola et al. (1999) a representative vertical         winds. For a mean wind at 10 m height between 10 m s−1
profile of mean wind is essential. In a first approxima-           and 20 m s−1 , a maximum turning moment of 15 kN to
tion, gusts are included in this calculation by an empiri-         45 kN is calculated for the model tree assumed in this
cal constant gust factor, but the effects of swaying trees,        study.
probably important for specific weather situations, are                However, the results depend strongly on the numer-
not considered here. In order to calculate the required            ous and specific input data and parameters necessary to
vertical distribution, local winds are integrated horizon-         calculate the wind force and the resistance of the tree
tally along the windward side of the tree. The resulting           against e.g. uprooting. In a parameter study, the band-
profile is given in Fig. 3 together with the maximum               width of tree load for a variation of different factors
wind close to the tree surface at different heights and            is calculated. For the reference run b = 0.5 m−2 m−3 ,
the logarithmic inflow profile. Due to the wind reduction          DBH = 0.21 m, G = 2.0 and hsoil = 0.7 m have been
near the obstacle, mean wind around the tree is weaker             chosen as default. The critical wind speeds for uproot-
than the unaffected situation. However, caused by the              ing uUP                        ST
                                                                         crit and stem breakage ucrit are used as measures
deflection of the air flow around the tree, maximum wind           for this comparison. Assuming similarity of the air flow,
is slightly larger than the inflow value at the same height.       these values are calculated by successively increasing
    The force caused by wind action on the crown mul-              the wind speed until the thresholds of UP (Eq. (2.6))
tiplied by the lever arm results in a turning moment T             and ST (Eq. (2.7)) are attained and exceeded. For the
according to Eq. (2.4). In order to estimate the total turn-       basic parameter set, the simulated critical wind speed
                                                                                                    −1 and for stem break-
ing moment at the base of the stem the contributions of                               crit = 17 m s
                                                                   for uprooting is uUP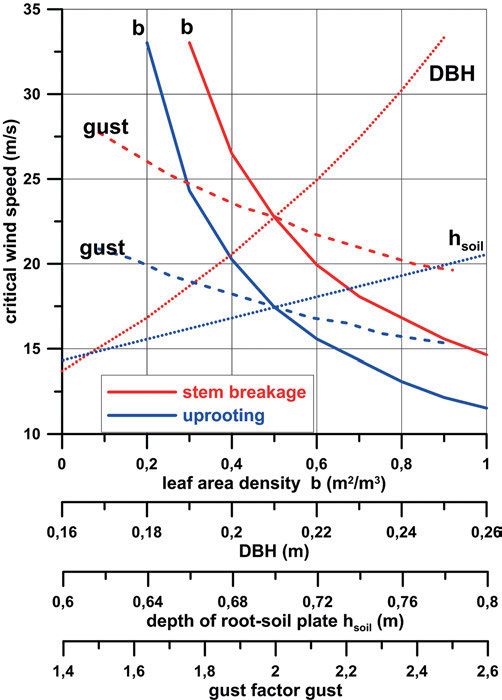
6           G. Gross: A windthrow model for urban trees with application to storm “Xavier”           Meteorol. Z., PrePub Article, 2018

                                                                      Figure 5: Wind observations on October 5, 2017 at measuring sites
                                                                      of the Technical University of Braunschweig (TU-BS) and of the
                                                                      German Weather Service (DWD).

                                                                      3.2 Urban tree damage during the storm
                                                                          “Xavier”

                                                                      Simulated results presented above are encouraging and
                                                                      suggest to use the model system for further studies with
Figure 4: Impact of input data variation on critical wind speed for   regard to wind loads on trees. However, it is important
uprooting and stem breakage.                                          to keep in mind that the robustness and quality of the re-
                                                                      sults depend strongly on the input data and parameters,
                                                                      which are partly unknown or at least inaccurate. Never-
                                                                      theless, an attempt is made to apply the method to a real
                                                                      storm situation where large damages on urban trees have
                                                                      been observed.
                         −1 (Fig. 4). These values are in
age is uSTcrit = 23 m s                                                   On 5 October 2017, storm “Xavier” passed over the
the order given also in Peltola and Kellomäki (1993)                  northern part of Germany and caused enormous damage.
where they found corresponding numbers for Scots pine                 Train and flight cancellation, power line failures and
                                −1 and uST = 20–30 m s−1
trees with uUP crit = 10–20 m s         crit                          damage to buildings have been only some of the obvious
depending on taper and crown to stem weight ratio.                    consequences. With gust wind speeds up to 120 km h−1
A strong impact on the critical wind speeds is given                  also the larger cities of Hamburg, Hannover and Berlin
by a variation of leaf area density (cd acts in a simi-               were hit by the storm. Especially the urban trees were
lar way) since the acting force on the tree depends di-               severely affected. For Berlin it is reported that more than
rectly on this parameter (Eq. (2.1)). For an increase from            40,000 trees show related damage of various degrees up
b = 0.2 m2 m−3 up to 1.0 m2 m−3 , critical wind speed                 to a total failure.
for uprooting decreases by a factor of three down to                      Because of the wealth of existing data, a hot spot in
12 m s−1 . For a variation of the gust factor by ±30 %                the city of Braunschweig was selected as the study area
around the basic value of gust = 2.0, uUPcrit decreases from          to apply the model system introduced here. Regional
       −1            −1
21 m s to 15 m s for a higher gustiness of the air flow.              mean wind was measured at the rural synoptic station
One parameter which determines the anchorage of the                   of the German Weather Service DWD and at the uni-
tree and the resistance against uprooting is the depth of             versity in an urban environment (Weber, 2017). At the
the root-soil plate hsoil . For larger values of hsoil from           rural site, wind speed increased from 12.9 m s−1 from
0.6 m to 0.8 m, the root-soil plate becomes heavier and               250° at 1200 UTC to a maximum value of 16.2 m s−1
the critical wind speed to uproot the tree increases by               from 290° at 1300 UTC followed by a sharp decrease
about 30 % from 15 m s−1 to 21 m s−1 . The threshold for              (Fig. 5). In general, wind speed at the university mea-
stem breakage according to (Eq. (2.7)) is proportional to             surement station was much lower except for the passage
DBH3 , and therefore critical wind speed uUP   crit is increas-       of “Xavier” around 1300 UTC. Also wind direction dif-
ing drastically for trees with a larger diameter.                     fered by around 30–40° which might be the result of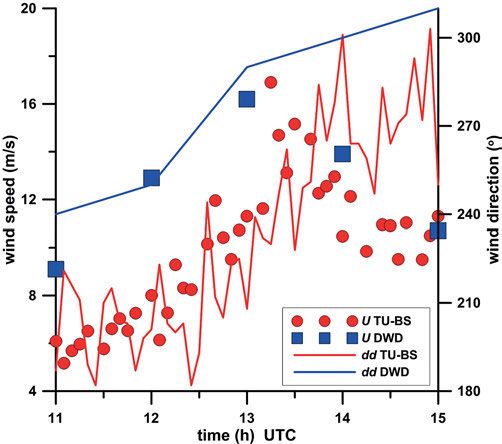
Meteorol. Z., PrePub Article, 2018           G. Gross: A windthrow model for urban trees with application to storm “Xavier”            7

Figure 6: Schematic view of buildings and trees in the simulation region “Hagenmarkt”. Coloured trees are damaged during different phases
of “Xavier”.

the urban environment with a larger number of obsta-                  Robinia pseudoacacia of comparable age with a typi-
cles and a much higher roughness. However, in general                 cal height of 15–18 m, a crown diameter of 6–8 m and a
trends in mean wind speed as well as for wind direction               diameter at breast height of 0.33–0.38 m. Only south of
were quite similar. Due to the high wind speed, a neu-                St. Katharinen two Platanus acerifolia have much larger
trally stratified atmosphere is assumed here.                         dimensions with a height and a crown diameter larger
     Besides the very detailed data for location and                  than 20 m. Buildings and trees are defined on a numer-
height of the individual buildings, also some informa-                ical grid with 1 m grid resolution in all three directions.
tion about the urban trees according to the tree inven-               Above 30 m this grid is expanded up to 4 m at a height
tory (BS, 2017) is available. For each tree, species, tree            of 150 m.
height, DBH and diameter of the crown are listed in this                  All trees damaged during storm “Xavier” are marked
database. However, only limited information about an-                 with different colours in this figure. In the first phase
chorage and root system is available. For these and other             of the storm a mean wind from 250° increases con-
unknowns, default values described earlier are used.                  tinuously up to a strength of 6 on the Beaufort scale
Along roads and sidewalks soil needs to be compacted                  (Bf = 6) around 1200 UTC. According to an eyewitness
to withstand traffic loads. In these areas soil for the trees         (Riebau, 2017) the first severe wind damage occurred
is limited and tree root growth is partly or completely re-           at 1145 UTC and at 1215 UTC when the trees at the
stricted with consequences for the anchorage. Based on                northwestern edge of the park as well as at the end
a site inspection (Bollmann, 2017) a rough distinction                of the promenade inside the park facing southeast are
was made for trees growing up within a strong sealing of              windthrown (red trees in Fig. 6). These preferred tar-
the soil (e.g. street), a medium sealing (e.g. along side-            gets for wind damage have also been reported by videos
walks) and inside the park with sufficient space for the              (BSZ, 2017; Video, 2017). One hour later, in the second
roots. Depending on the location of each individual tree,             phase of the storm, mean wind speeds up to 16 m s−1
the anchorage is enhanced for sidewalks (Asoil = 20 %)                at 10 m height are observed at the rural station, while
and for streets (Asoil = 10 %).                                       wind direction shifts to 290–300°. Now, tree damage up
     A schematic view of the local situation around the               to total failure have been observed along the Bohlweg at
Hagenmarkt, the hot spot in Braunschweig during storm                 the eastern side of the park (Bollmann, 2017) indicated
“Xavier” considered in this study, is given in Fig. 6.                by purple coloured trees in Fig. 6. For trees coloured in
The Hagenmarkt is surrounded by multi-storey office                   pink, observed damage cannot be attributed to any par-
and apartment buildings and the church St. Katharinen                 ticular time or trees have been removed after the storm
with a steeple of more than 80 m height. A larger num-                for safety reasons.
ber of urban trees are arranged along the streets and                     The location of wind endangered areas with wind-
in particular in the park. Nearly all tree species are                throw of trees during the passage of the storm “Xavier”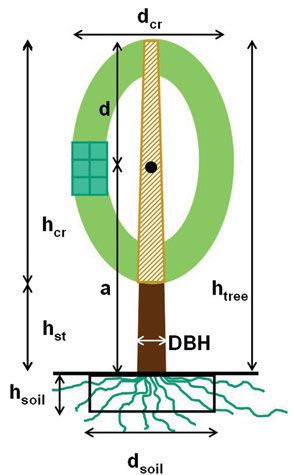
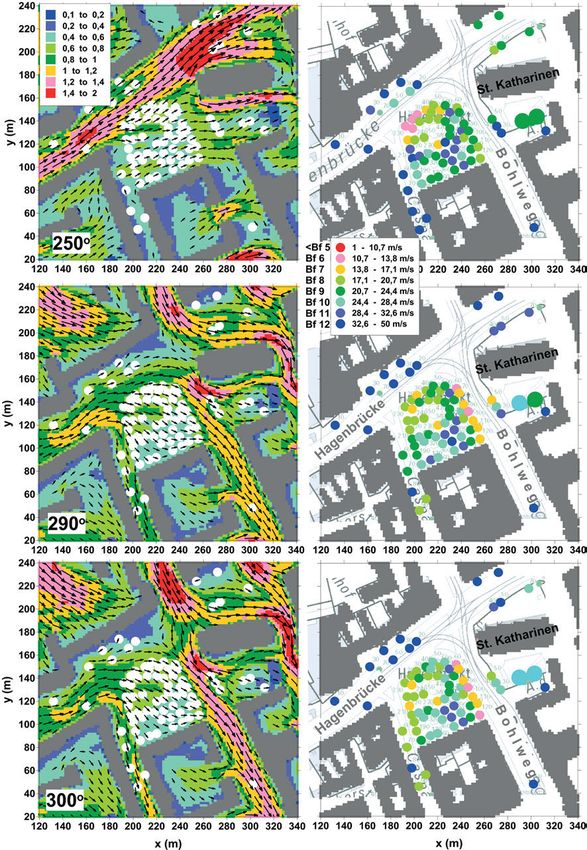
8           G. Gross: A windthrow model for urban trees with application to storm “Xavier”              Meteorol. Z., PrePub Article, 2018

Figure 7: Left: Wind vectors and normalized (reference value is rural 10 m wind) mean wind speed at 10 m above ground for different rural
wind directions. Grey blocks: buildings, white circles: trees. Right: Necessary 10 m rural mean wind speed for different wind directions for
windthrow of individual trees. Grey blocks: buildings at 2 m height.
Meteorol. Z., PrePub Article, 2018     G. Gross: A windthrow model for urban trees with application to storm “Xavier”   9

are significantly separated and suitable for testing the           The model introduced here was used for a parame-
model system introduced here. For different wind di-           ter study for an individual tree in order to identify im-
rections dd and speeds U at the rural DWD-station, the         portant tree parameters for uprooting and stem break-
air flow within the complex urban environment has been         age. In combination with high wind speeds, leaf area
simulated.                                                     density is the most important parameter to estimate the
    For the 1200 UTC situation with a mean southwest-          wind force on the tree. A strong anchorage in the soil
erly wind (dd = 250°) of U = 12.9 m s−1 the air flow           with a large depth of the root-soil plate prevents uproot-
is channelled within the streets oriented in the same di-      ing, while larger trunk diameter counteracts very effi-
rection while calm situations are simulated else (Fig. 7).     ciently against stem breakage. This study demonstrates
Horizontal mean wind at 10 m height is represented in          the accuracy of the different input data required for a
this figure by wind vectors and by wind speed normal-          reliable and promising application of the model. While
ized with the value at the rural station. Locally along        the above-ground tree information is reasonably avail-
the streets, mean wind speed is more than 40 % higher          able, details in the ground below the tree are sparse with
than the value of the oncoming wind, increasing the risk       large uncertainties.
for the exposed urban trees significantly. The assessment          During the strong storm event “Xavier” in the north-
of the danger level for windthrow is based on the ru-          ern part of Germany a large number of urban trees were
ral wind which must prevail in order to uproot the en-         affected and severely damaged. This meteorological sit-
tire tree. For a rural wind of Bf 6 (10.7–13.8 m s−1 ) the     uation was used to apply the model for a limited real
turning moments exceed root anchorage of the trees at          city environment where detailed information about all
the northwestern corner of the Hagenmarkt. This area is        individual trees, including the storm damage, has been
strongly endangered for windthrow at this time. In ac-         available. The developed tool was able to identify the
cordance with observations the numerical model iden-           nearby areas with observed windthrow of trees for the
tifies nearly the same location of the most vulnerable         different phases of the storm.
urban trees during the first phase of the storm. Also for          All numerical experiments show very encouraging
some other individual trees inside the park an increased       results compared to observations and findings from
risk for winds from Bf 7 on is simulated. The largest          forestry, and applications for real cities can be envisaged
wind load is simulated for the trees north of St. Kathari-     as a future prospect and idea. This would allow the iden-
nen where a strong increase of the air flow is simulated.      tification and mapping of the wind risk of urban trees
However, the anchorage within a sealed and highly com-         depending on season (leaf area density) and for differ-
pressed near road surface is much larger than in the park      ent wind speeds and directions. Prior to a storm it would
with natural soil, and a wind strength of Bf 8 would here      be possible to close probable endangered zones for pub-
be necessary for uprooting at this time.                       lic safety and to secure buildings for property value. On
    In the following hour, synoptic wind speed increases       the other hand, such results could help to optimize fu-
up to Bf 7 and wind direction turns to 290–300° (Fig. 7).      ture greening and planting to minimize the danger of tree
This change is associated with a complete modification         damage to an acceptable level and to guarantee sustain-
of the urban near surface wind distribution. Now, the          ability. In urban areas with a high wind risk estimated
calm wind conditions in the north-south running streets        by the model, species with limited growth height can be
are replaced by high wind situations with extreme wind         selected, accompanied with appropriate measures for an
loads on the trees along the Bohlweg. For the complete         effective tree anchorage.
tree row, a high wind risk for windthrow is simulated              It should be mentioned here that the numerical model
for wind strength of 6 to 7 on the Beaufort scale. Again       provides detailed and very valuable insight on wind risk
the observations for this time show a large number of          for trees in a complex urban environment. However,
uprooted trees in the same area. For this synoptic situa-      shortcomings of this method caused by the lack of input
tion an increased risk for isolated individual trees inside    data, model characteristics like grid resolution or param-
the park is simulated as well. Only uprooting damages          eterizations or effects not included here (e.g. tree sway,
are simulated and observed although stem breakage cri-         soil moisture, pre-damage) define the limits of applica-
terion has been calculated as well.                            tion.

4 Conclusions
A three-dimensional micro-scale model was used to
                                                               Acknowledgements
study the interactions of strong winds and individual ur-
ban trees. Storms can exert extreme forces resulting in        The author would like to thank the reviewer for the
major damage to parts or the entire tree. Besides the          extremely valuable comments.
physical damage, aesthetic, financial and social losses           This paper is part of the MOSAIK-project, which is
become a concern to people as well as risk and liability       funded by the German Federal Ministry of Education
for residents of the surrounding property. These aspects       and Research (BMBF) under grant 01LP1601 within
are of special importance for city planners and emer-          the framework of Research for Sustainable Development
gency services.                                                (FONA; www.fona.de).
10 G. Gross: A windthrow model for urban trees with application to storm “Xavier” Meteorol. Z., PrePub Article, 2018
References Mayer, H., 1985. Baumschwingungen und Sturmgefährdung
des Waldes. – Wiss. Mitteilungen 51, Univ. München, Meteo-
Bollman, A., 2017: personal communication. – University Han- rol. Inst.
nover. Mayer, H., D. Schindler, 2002: Forstmeteorologische Grund-
Bruse, M., 2016: Windrisk und Stadtbäume: Zwischen lagen zur Auslösung von Sturmschäden im Wald in Zusam-
Stadtklimaverbesserung und Sturmgefahr. – Conference pa- menhang mit dem Orkan „Lothar“. – Allg. Forst- u. J.-Ztg.
per FLL Verkehrssicherheitstage 2015, Berlin, https://www. 173, 200–208.
researchgate.net/publication/308415508. Mayhead, G.J., 1973: Some drag coefficients for British forest
BS, 2017: Baumkataster. – Geoportal FRISBI – Stadt Braun- trees derived from wind tunnel studies. – Agric. Meteor. 12,
schweig. 123–130
BSZ, 2017: braunschweiger-zeitung.de/video Milne, R., 1991: Dynamics of swaying of Picea sitchensis. –
Cermak, J., N. Nadezhdina, M. Trcala, J. Simon, 2015: Tree Physiology 9, 383–399.
Open field-applicable instrumental methods for structural and Mochida, A., Y. Tabata, T. Iwata, H. Yoshino, 2008: Exam-
functional assessment of whole trees and stands. – iForest 8, ining tree canopy models for CFD prediction of wind envi-
226–278. ronment at pedestrian level. – J. Wind Eng. Ind. Aerodyn. 96,
Coutts, M.P., 1986: Components of tree stability in Sitka 1667–1677.
Spruce on Peaty Gley soil. – Forestry 59, 173–197. Peltola, H., S. Kellomäki, 1993: A mechanistic model for
Gardiner, B., H. Peltola, S. Kellomäki, 2000: Comparison calculating windthrow and stem breakage of Scots pines at
of two models for predicting the critical wind speeds required stand edge. – Silva Fenn. 27, 99–111.
to damage coniferous trees. – Ecol. Model. 129, 1–23. Peltola, H., S. Kellomäki, H. Väisänen, V.-P. Ikonen, 1999:
Gardiner, B., K. Bryrne, S. Hale, K. Kamimura, A mechanistic model for assessing the risk of wind and snow
S.J. Mitchell, H. Peltola, J.-C. Ruel, 2008: A re- damage to single trees and stands of Scots pine, Norway
view of mechanistic modelling of wind damage risk to spruce, and birch. – Can. J. For. Res. 29, 647–661.
forests. – Forestry 81, 447–463. Raupach, M.R., R.H. Shaw, 1982: Averaging procedures for
Gromke, C., B. Ruck, 2008: Aerodynamic modelling of trees flow within vegetation canopies. – Bound.-Layer Meteor. 22,
for small-scale wind tunnel studies. – Forestry 81, 243–258. 79–90.
Gross, G., 1993: Numerical simulation of canopy flows. – Riebau, G., 2017: personal communication. – Braunschweig.
Springer Verlag Heidelberg. Roloff, A. (Ed.), 2016. Urban Tree Management for Sustainable
Gross, G., 2012: Effects of different vegetation on temperature Development of Green Cities. – John Wiley. Chichester, UK.,
in an urban building environment. Micro-scale numerical ex- 274. ISBN 978-1-118-95458-4.
periments. – Meteorol. Z. 21, 399–412. Ruck, B., F. Schmitt, 1986: Das Strömungsfeld der Einzel-
Gross, G., 2014: On the estimation of wind comfort in a building baumumströmung. – Forstwiss. Centralbl. 105, 178–196.
environment by micro-scale simulation. – Meteorol. Z. 23, Salim, M.H., K.H. Schlünzen, D. Grawe, 2015: Including
51–62. trees in the numerical simulations of the wind flow in urban
Gross, G., 2017: Some effects of water bodies on the urban areas: Should we care? – J. Wind Eng. Ind. Aerodyn. 144,
environment – numerical experiments. – J. Heat Island Inst. 84–95.
Inter. 12–2. Salmond, J.A., M. Tadaki, S. Vardoulakis, K. Arbuth-
Jäger, S., 2014: Examination of gust wind speed from observa- nott, A. Coutts, M. Demuzere, K.N. Dirks, C. Heavi-
tions and GFS reanalysis during strong wind events. – Master side, S. Lim, H. Macintyre, R.N. McInnes, B.W. Wheeler,
thesis, KIT Karlsruhe. 2016: Health and climate related ecosystem services provided
Kormas, A., J.M. Prospathopoulos, P.K. Chaviaropoulos, by street trees in the urban environment. – Env. Health 15,
K. Yakinthos, 2016: Wind flow simulation over forested 95–111.
areas using a 3D RANS solver with a tree-scale approach. – Shashua-Bar, L., M.E. Hoffman, 2004: Quantitative evalua-
J. Wind Eng. Ind. Aerodyn. 155, 149–158. tion of passive cooling of the UCL microclimate in hot regions
Kuttler, W., 2011: Climate change in urban areas, Part 1, in summer, case study: urban streets and courtyards with trees.
Effects. Environmental Science Europe (ESEU). – Springer Building and Environment 39, 1087–1099.
open, DOI:10.1186/2190-4715-23-11, 1–12. Video, 2017: https://www.youtube.com/watch?v=0_
Lee, H., J. Holst, H. Mayer, 2013: Modification of human- q-TpFUJ6K.
biometeorologically significant radiant flux densities by Weber, S., 2017: personal communication. – University Braun-
shading as local method to mitigate heat stress in sum- schweig.
mer within urban street canyons. – Adv. Meteor 312572, Wood, C.J., 1995: Understanding wind forces on trees. – In:
DOI:10.1155/2013/312572. Coutts, M.P., Grace, J. (Eds): Wind and wind related
damage to trees. – Cambridge University Press, Cambridge,
133–164.You can also read