The Common Warehouse Model and Profit Distribution of the Express Industry - MDPI
←
→
Page content transcription
If your browser does not render page correctly, please read the page content below
algorithms
Article
The Common Warehouse Model and Profit Distribution
of the Express Industry
Li Wang             *, Xi Wang        and Xilong Cai

                                           School of Modern Post, Beijing University of Posts and Telecommunications, Beijing 100876, China;
                                           daytoy_wangxi@163.com (X.W.); 2508418876@bupt.edu.cn (X.C.)
                                           * Correspondence: wang_li@bupt.edu.cn

                                           Abstract: The sharing mode of the logistics industry can effectively solve the new problems arising
                                           from the rapid development of the express industry. However, only when the interests are reasonably
                                           distributed can the sharing mode be implemented for a long time. This paper discusses the conno-
                                           tation of unified warehouse and distribution, designs the operation mode of a unified warehouse
                                           and distribution, and solves the profit distribution problem of a unified warehouse and distribution
                                           alliance based on the improved Shapley value method. Firstly, the traditional Shapley value method
                                           is improved by using a comprehensive correction factor, including the proportions of investment,
                                           risk, and innovative research contributions. Secondly, each factor’s weight is determined by the
                                           analytic hierarchy process (AHP), and the profits are distributed according to the contribution of each
                                           express enterprise to the alliance. Finally, an example is given to verify the validity of the modified
                                           algorithm. It proves that the modified Shapley value method can effectively solve the problem of
                                           profit distribution.

                                           Keywords: improved Shapley value method; correction factor; unified warehouse and distribution;
                                           shared logistics model


Citation: Wang, L.; Wang, X.; Cai, X.      1. Introduction
The Common Warehouse Model and
                                                 In recent years, the booming of e-commerce has led to the rapid development of the
Profit Distribution of the Express
Industry. Algorithms 2021, 14, 50.
                                           express industry and gave birth to new problems. In 2019, the business of express delivery
https://doi.org/10.3390/a14020050
                                           exceeded 60 billion pieces, contributing over 50% to the growth of the world’s express
                                           industry. However, at the same time, problems such as “out of stock during holidays” and
Academic Editor: Maciej Drozdowski         “slow express” have been exposed successively, which have not only affected customer
Received: 29 December 2020                 experience but also reduced efficiency and kept costs high, hindering the healthy and rapid
Accepted: 28 January 2021                  development of the express industry. The outbreak of the problem is related to the lack
Published: 4 February 2021                 of effective cooperation in China’s express industry. At present, each express delivery
                                           enterprise in China operates in its own way. Limited by the ability and resources of each
Publisher’s Note: MDPI stays neu-          express enterprise, each express enterprise plans its sorting center, distribution network,
tral with regard to jurisdictional clai-   and distribution route. The distribution network is unreasonable, and the distribution route
ms in published maps and institutio-       is not scientific. Besides, transportation means and express-related materials are not shared
nal affiliations.                          among express enterprises, which leads to the lack of efficiency of the industry as a whole.
                                           When there are idle resources, the industry cannot meet the demand for express during
                                           peak periods, thereby causing a waste of resources. With the rapid increase of express
Copyright: © 2021 by the authors.
                                           delivery volume in China, the demand for resources in the express industry increases
Licensee MDPI, Basel, Switzerland.
                                           accordingly. If resources are still not fully utilized efficiently, the difficulty of meeting
This article is an open access article
                                           the demands will become more and more prominent. Therefore, "sharing," as a means to
distributed under the terms and con-       optimize scattered and idle resources, is of great significance to solve the above problems.
ditions of the Creative Commons At-              Throughout the whole field of logistics, scholars from all over the world put forward
tribution (CC BY) license (https://        the sharing model to realize the industry’s transformation. From the cloud warehouse’s
creativecommons.org/licenses/by/           resources sharing mode concentrating on storage aspects and the unit (pallet, turnover box,
4.0/).                                     etc.) in cyclic sharing mode, to common distribution and shared logistics mode focused

Algorithms 2021, 14, 50. https://doi.org/10.3390/a14020050                                                 https://www.mdpi.com/journal/algorithms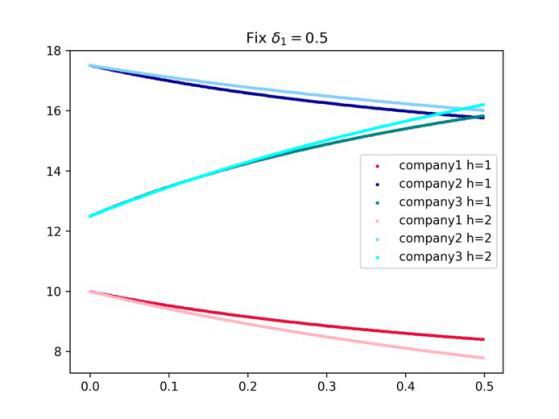
Algorithms 2021, 14, 50                                                                                              2 of 15

                          on the distribution and logistics crowdsourcing sharing mode, “sharing” broke the space
                          and time limits of resources, and realized the integrated use of idle and scattered resources,
                          thereby effectively reducing the costs of enterprise management. However, the express
                          delivery industry in China has not formed a real scale sharing system in recent years,
                          and some existing sharing logistics modes only achieve the common express cabinets and
                          public outlets at the end, and each express delivery enterprise still operates independently
                          in transportation, storage, distribution, and other operations. There are two main reasons.
                          On the one hand, the express delivery industry is restricted by these problems:
                          •    Research of sharing in the field of logistics and express delivery started late, with little
                               experience and much copying;
                          •    Size and distribution proposals for warehouses are unreasonable;
                          •    The degree of digital intelligence for distribution and storage areas is low;
                          •    There are not enough effective coordination mechanisms.
                               On the other hand, the industry lacks an effective incentive to promote cooperation
                          and resource sharing between enterprises. Thus when discussing the unified warehouse
                          and distribution, it is necessary to specifically discuss a fair and effective allocation method,
                          in order to effectively guarantee the express companies gain greater profits from “sharing”—
                          promoting the express delivery enterprises to actively participate in the sharing. Besides, it
                          is worth noting that resource sharing is inseparable from the angle of profit distribution.
                          Scholars adopted the Shapley value method, Raiffa method, Nash negotiation solution,
                          and other sharing enterprises to make reasonable profit distributions to ensure the fair and
                          stable operation of the model.
                               This paper uses the existing shared logistics model for reference and combines it with
                          the operational characteristics of the express industry to amend the Shapley value method
                          to solve the profit distribution problem of the express enterprise alliance under this model.

                          2. Literature Review
                          2.1. Logistics Sharing Mode
                                Logistics includes transportation, storage, handling, loading, unloading, information
                          management, etc. The existing sharing logistics mode often discusses one of those links.
                          Scholars’ research on the shared logistics model is mainly carried out on five aspects:
                          social and economic profits brought by the shared logistics model, the innovation of
                          shared logistics model, the location problem of shared logistics, cost minimization (benefit
                          maximization) problem, and the profit distribution problem.
                                The research on the social and economic profits of the shared logistics model, namely,
                          the research and understanding of the positive significance of the shared logistics model,
                          mainly verifies the enterprise profits and social profits of the shared logistics model in
                          environmental protection, cost reduction, service quality improvement, and other aspects.
                          As for location problem of the distribution center, scholars at home and abroad concentrate
                          on the study of the impacts of the distribution center and location method, adopting the
                          method of combining quantitative or qualitative or both, often through the establishment
                          of the mathematical model, using the queuing theory, nonlinear programming method,
                          the heuristic algorithm, the fuzzy clustering method, and the mixed integer programming
                          method to solve the problem, in order to determine the reasonable location of a distribution
                          center [1]. Most of the research on cost minimization focuses on the warehouse. Among
                          them, Sarkar and Saren [2] used different demand patterns to check the optimum profits
                          for different situations for the inventory in the article, in order to maximize average profit
                          per unit time for retailer. Shin et al. [3] added the service level limitation into the model so
                          that the out-of-stock costs were avoided. Kumar et al. [4] considered the cost minimization
                          of the double warehouse system with demand and time varying. In this part, scholars tried
                          to control the cost from many different aspects, including but not limited to supply and
                          demand, time in and out of the warehouse, service level, and management standard, so as
                          to scientifically reduce the cost of a warehouse from multiple perspectives.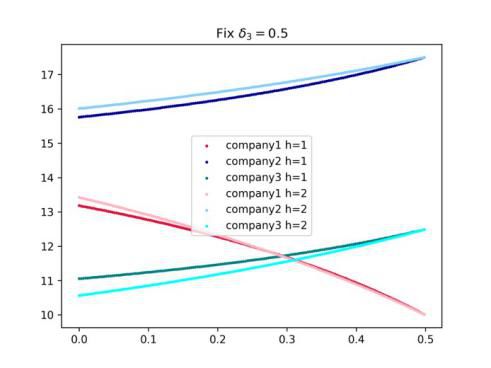
Algorithms 2021, 14, 50                                                                                           3 of 15

                                As for innovation of the mode, scholars focused on the different practical problems,
                          from each link of logistics put forward many types of sharing logistics mode, from different
                          shared objects took a different way of sharing, and formed a variety of operating modes.
                          With the collaborative principle, Li et al. [5] built the sharing storehouse with three sharing
                          mechanisms: formation mechanism, the implementation mechanism, and the guarantee
                          mechanism, based on a study of the content and motivations in a shared warehouse. On
                          this basis, they put forward the basis of development of the shared warehouse and analyzed
                          the implementation of a unified warehouse and distribution. Yang et al. [6] mainly focused
                          on the design of the joint distribution mode under the background of “Internet +”; and
                          discussed how to solve “the last kilometer” and “the last one hundred meters” problems
                          through the joint distribution mode innovation. They put forward the electronic commerce
                          and express logistics distribution mode, and the express end joint distribution service mode
                          in a limited urban area, and proposed perfecting the urban express joint distribution system
                          at the end through building a cloud platform, and establishing a large data analysis system
                          and O2O e-commerce system. Such innovations combined new technologies and took into
                          account new practical problems, which had great positive impacts on the development
                          and implementation of the model. Li [7] analyzed mutual urban community logistics
                          service mode from four aspects, the organization mechanism, the cooperation mechanism,
                          information sharing, and the collaborative decision-making mechanism, and mentioned
                          that only by forming a complete operating mechanism could people achieve the goal of
                          common good. The organizational mechanism is the prerequisite. The cooperation mecha-
                          nism is the power source. The sharing mechanism is the necessary support information.
                          The collaborative decision-making mechanism is the basic guarantee. The design of the
                          system was more comprehensive, but the construction of a complete system was difficult
                          and not easy to achieve. Wu [8] built a new joint distribution alliance model of electrical
                          business logistics ends and put forward the concrete implementation strategy. That is,
                          Wu did so by joint investment and receipt, establishing a shared information platform,
                          improving the express formula, making a cost allocation mechanism, forming a reasonable
                          cooperation organization mode to achieve effective operation of the model involving a
                          storage center, making a joint distribution center, and coordinating a distribution network.
                          Shi [9] and Li [10,11] studied the joint distribution method of America and Japan. Ge [12]
                          analyzed the categories of joint distribution patterns, such as one-to-many and many-
                          to-many. One-to-many mode is an orderly delivery activity conducted by a distribution
                          enterprise for multiple customers according to the distribution needs and routes, and the
                          targeted users (users involved in the “last kilometer problem” such as individual users and
                          users with high frequency, large quantities, and various categories such as supermarkets
                          and drugstores). Many-to-many mode refers to the cooperation of multiple enterprises,
                          overall arrangement of distribution, and joint service for multiple customers. This mode
                          is mainly used in the joint distribution and transportation of long distance bulk goods by
                          sea, air, and railway. The many-to-many model saves resources and costs because it can
                          increase load rates and reduce redundant transportation by sharing space.
                                By comparing and analyzing the shared logistics model proposed by scholars, at
                          present we summarize four shared logistics modes: cloud warehouse resource sharing
                          mode, logistics equipment sharing mode, logistics crowdsourcing sharing model and the
                          joint distribution and shared logistics model. Among them, logistics equipment sharing
                          mode is limited to the sharing of things such as warehousing and freight equipment,
                          with limited economic benefits and failure to form large-scale and systematic sharing,
                          which limits the possibility of continuous evolution and innovation of this mode. Logistics
                          crowd-sourcing mode focuses on the sharing of personnel in the distribution field, and
                          is not closely related to the cooperation mode and profit among enterprises. Thus it is
                          not considered in this paper. By combining the characteristics of the express industry—
                          scattered and irregular demand for express delivery and the demand for door-to-door
                          delivery—this paper hopes to draw lessons from the cloud warehouse resource sharing
                          mode and the shared distribution logistics mode of joint distribution in order to construct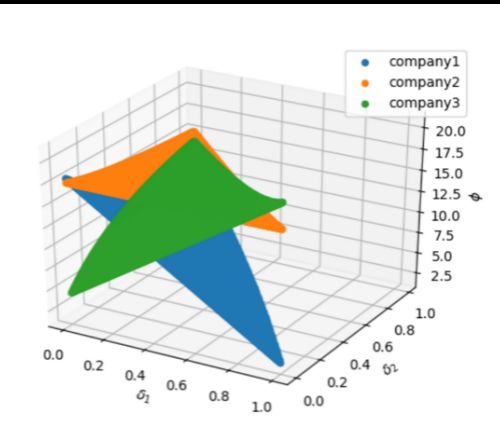
Algorithms 2021, 14, 50                                                                                               4 of 15

                          the shared distribution mode of the unified warehouse and distribution in the express
                          industry. That is, to realize the “sharing” of storage and distribution. The operation process
                          of the cloud warehouse is shown in Figure 1:

                          Figure 1. The operation flow of the cloud warehouse.

                               The core idea of cloud warehouse mode lies in the realization of a unified warehouse
                          through sharing. That is, the effect of combining various scattered warehouses in the same
                          logistics field to form a “warehouse network.” In other words, express enterprises ally
                          to integrate their existing warehouses through cooperation. Each warehouse is a node
                          in the warehouse network with exchanges and sharing. The key to the joint distribution
                          model lies in the means of “sharing,” that is, the sharing of personnel, information, and
                          resources. Such sharing in many aspects can make full use of the member enterprises’
                          existing resources in the alliance to reduce costs and idle resources.

                          2.2. The Problem of Profit Distribution
                               At present, domestic and foreign scholars mainly apply game theory and multi-person
                          cooperation theory to study profit distribution, and the research is mainly focused on
                          distribution methods [13]. Zhao [14] set up the new distribution mode meeting profit
                          demands of rural chain stores, third-party express enterprises, and joint distribution
                          information platforms, and he put forward a distributing method of joint distribution’s
                          expected profits considering the business of the platform and the risk of express, in order
                          to resolve conflict which exists between the three parties of interest. Shi [15] pointed out
                          that when total effectiveness is uncertain, one can use the AHP method, the ANP method,
                          and the fuzzy comprehensive evaluation method to estimate the possible utility values of
                          different combinations of the union state, in order to get a more reasonable utility value
                          under different alliance composite state, and obtain data needed for the Shapley value
                          method, using Shapley value method on specific distribution calculations. Li [16] analyzed
                          the influencing factors of the profit distribution of a retail chain’s joint distribution alliance.
                          She obtained the ranking of the importance of each influencing factor measure index,
                          namely, benefit > investment > risk > contribution > cost. Then she used AHP and GEM
                          methods to determine the weights of the influencing factors, and used the Raiffa method
                          to distribute the interests of the small and large alliances according to how much each
                          enterprise in the retail chain alliance brought benefits to the alliance. Zhang [17] built a
Algorithms 2021, 14, 50 5 of 15
profit distribution model between intelligent logistics park and resident enterprises based
on dynamic Bayes, and discussed how the park or enterprises updated their understanding
of each other’s state based on dynamic Bayes, and determined their expected returns, so
as to make decisions. The game reaches equilibrium when both parties find the optimal
stable solution. Xu et al. [18] used the network analysis method to distribute the profits of
the participants for the first time, and then adjusted the benefits of the first time according
to the consumers’ evaluation of the service level of each participant on the cloud logistics
platform to achieve the incentive effect. Zhang [19] utilized the TOPSIS method to construct
the profit distribution model.
It can be found from the existing literature that researchers not only tried a variety
of methods (Shapley value method, Nash negotiation method, Raiffa solution, etc.) but
also combined the algorithm with the practice respectively, while considering various
realistic factors to improve the algorithm. However, the limitation lies in that scholars
cannot comprehensively consider all influencing factors and often just directly give the
reference values such as cost and risk as factors to improve the allocation method, without
discussing these factors themselves and the possible relationships between them.
Among many methods, the Shapley value method distributing the profit for members
of the alliance embodies the thought of sharing of profits based on contributions, so as
to avoid making members of the group feel injustice has been done. Compared with
other allocation means, the Shapley value method is more reasonable and fair, with more
emphasis on the actual contributions to the interests of the whole alliance rather than
the allocation methods which only refer to resource efficiency or the investments, or the
combination of them. Besides, the Shapley value method reflects the process of a game
for each member. In this way, each member of the alliance can be encouraged to make
greater contributions to the alliance in order to share more profits, which is conducive to the
overall benefit maximization and long-term development of the alliance. In other words, the
Shapley value method has a considerable incentive and makes a good attempt at fairness.
2.3. Using the Shapley Value Method to Solve the Problem of Profit Distribution
The traditional Shapley value method must satisfy the following four axioms before
the profit distribution: symmetry, validity, redundancy, and additivity. These four axioms
are the premise for the Shapley value method to realize fair and reasonable allocation. On
the basis of satisfying the above axioms, Shapley [20] gives the following allocation scheme:
ϕi ( v ) = ∑ ω (|s|)[v(s) − v(s − {i})] (1)
s ∈ Si
(s − 1)!(n − |s|)!
ω (|s|) = (2)
n!
Among them, ω (|s|) is the weighted factor. Si is the set formed by all subsets contain-
ing members in I. |s| is the number of elements in the set s. v(s) − v(s − {i }) indicates
the contribution made by the member i in the cooperative group. Such cooperation has a
total of (s − 1)! · (n − |s|)! occurrence modes, so the probability of occurrence of each kind
is ω (|s|).
As the principle "distribution according to contribution" of the Shapley value method
is more realistic, a large number of scholars choose to optimize the method of profit distri-
bution and solve the problem of profit distribution by revising the Shapley value method.
Cai and Hu [21] established the cooperative game model of self-lifting point alliance to
integrate end-distribution resources, and distributed the benefits gained from joint distri-
bution and joint self-lifting points among enterprises respectively through Shapley value
method and Owen value method. Li [22] modified the Shapley method by synthesizing
risk, enterprise distribution service quality, time to join the union, and core competitiveness.
Then he set the weights of the above factors by APH method. Peng et al. [23] introduced
the contribution parameter to modify the Shapley value method and distributed more
profits to the member enterprises whose contribution rates were higher than the averageAlgorithms 2021, 14, 50 6 of 15
contribution rate. The value of the contribution rate was given by the scoring team com-
posed of managers dispatched by each member enterprise. Qu [24] used the Shapley value
method to solve the profit distribution model of third-party logistics joint distribution,
and emphasized that the application of the Shapley value method not only reflected the
rationality of the joint distribution participants, but also ensured an incentive and fairness.
Runhong Zhang and Luo [25] considered the personalized service cost borne by enterprises
in the distribution process so as to revise the Shapley value method. Yang [26] considered
the existing risks of the cooperative alliance, namely, the success rate of cooperation, and
introduced cooperation risk factors in order to improve the Shapley value method to
solve the problem of rising transaction costs caused by cooperation risks in the process
of cooperation. Mu [27] suggested that the risks faced by the joint distribution alliance
in the specific operation process should be divided through quantitative and qualitative
analysis, and the risks borne by each member enterprise in the joint operation should be
fully considered so as to make a profit distribution more fair and reasonable through risk
compensation. Yang [28] took the input resource factor as the consideration factor of output
profit distribution and optimized the original calculation model. Xu et al. [29] constructed
a comprehensive correction model of the Shapley value for the joint distribution model of
transit stations, and combined it with the influence of customer delivery order caused by
the shared distribution of transit stations on customer satisfaction, taking the delivery time,
namely, the time cost paid by each express delivery enterprise, as one of the bases for profit
distribution. Li [30] considered the risk cost, brand trust, and alliance loyalty, and used
the comprehensive correction factor to establish the profit distribution model of dynamic
logistics alliance based on the improved Shapley value method. Sun and Zhang [31] intro-
duced the three factors affecting the profit distribution of the enterprise: comprehensive
strength, the investment amount, and the amount of risk taking to build the improved
Shapley model of the profit distribution of the alliance of small and medium-sized logistics
enterprises under the platform business model.
The above scholars only considered one realistic factor when revising the traditional
Shapley value method, but the realistic factors influencing the profit distribution scheme
are often diverse and correlated with each other. In view of this, this paper introduces a
comprehensive adjustment factor when revising the Shapley value method to consider
three realistic factors in the allocation method at the same time, and we analyzed the
correlations between factors and their influences on the allocation scheme.
3. Model Construction
3.1. Sharing Mode of the Express Industry
With the idea of cloud warehouse mode and joint distribution mode, combined
with the characteristics of scattered distribution and seasonal blow-up of the express
delivery industry, this paper believes that unified warehouse and distribution mode is
very suitable for the express industry sharing mode. This mode, starting from storage and
distribution, directly captures the key to the operation of the express industry. In the aspect
of warehousing and distribution, the information, personnel, and resources sharing and the
overall arrangement of the alliance should be satisfied. In other words, express enterprises
should realize the sharing of warehouses, personnel, information, and resources, coordinate
and arrange together, and reasonably select and arrange the warehouse according to the
actual situation of the distribution area and each warehouse. This paper establishes a
flowchart of the model of unified warehouse and distribution in the express industry, as
shown in Figure 2.Algorithms 2021, 14, 50 7 of 15
Figure 2. The flowchart of the model of a unified warehouse and distribution.
3.2. The Improved Shapley Value Method
Based on the actual situation and the research of scholars, this paper selects three
factors that have an influence on the income of the express enterprise alliance, namely, the
input capital contribution, risk contribution, and innovation research contribution.
The input capital contribution is used to measure the contribution of member enter-
prises to the whole alliance in transportation means, moving and unloading equipment,
construction cost and site cost of the distribution center, human capital, financing cost, and
other aspects.
Risk contribution is used to describe the proportion of risks taken by each member
enterprise in the alliance. This kind of risk combines a variety of factors, including the
market environment, industry competition environment, and the enterprise’s situation.
The alliance should evaluate the risks taken by each member enterprise and give certain
income incentives to the high-risk member enterprises. For example, the earlier the member
enterprises join the alliance, the greater the cooperation risk will be. Compared with the
enterprises that enter the alliance when the alliance is of high yield and low risk, the
member enterprises that join the alliance early deserve to receive more profits in the
profit distribution.
The innovation research contribution is used to measure the contribution of member
enterprises in the innovation research and development work of the alliance. The concept
of innovative research contribution was put forward mainly because innovation is of great
significance to the development of the future mode of the alliance, but the investment in
innovation and research is large, and it is not easy to see the results in the short term. In
order not to discourage the enthusiasm of member enterprises in the field of innovation and
research, the alliance should give appropriate encouragement to the member enterprises
that make contributions in this part, even if the profits gained from cooperation cannot
directly reflect the efforts of member enterprises in this part.
Thus the thought block diagram can be obtained, shown in Figure 3.Algorithms 2021, 14, 50 8 of 15
Figure 3. The thought block diagram of the improved Shapley value method.
The revised profit distribution scheme is:
ϕi0 = ϕi + ∆λi × v(s) (3)
1
∆λi = λi − (4)
n
m
∑ δk × xi
(k)
λ1 = (5)
k=1
Among them, the weights of these three factors in Equation (5) can be obtained by
AHP. ϕi0 is member i’s share of the profits after amended. ϕi is member i’s share of the
profits calculated by traditional Shapley value method. λi is the comprehensive correction
factor. Ei is the weight of three factors: investment capital, risk, and sharing of innovative
(k)
research. xi is the value of member i on the kth factor. m is the number of factors. ∆λi is
the difference between the comprehensive evaluation and the average evaluation. As the
contribution of members is calculated according to n1 , ∆λi reflects the deviation according
to n1 . Thus below must be satisfied:
n
∑ ∆λi = 0 (6)
i =1
n
∑ λi = 1 (7)
i =1
After considering the three factors simultaneously, this paper designs the correlation
among the three factors through the causal diagram shown in Figure 4, and describes the
risk as a factor jointly determined by the input capital contribution, innovative research
contribution, and one other factor, and further revises the risk contribution as follows:
ϑi = k 1 f ( θ i ) + k 2 g ( ρ i ) + k 3 (8)
k1 + k2 + k3 = 1 (9)
Among them, k i is the weight constant, where k3 is a constant value used to reflect
the influence of other factors that influence the risk. The value of k i can be determined by
further research and discussion between the alliances. In the equation, f (θi ) represents
the impact of the input capital contribution on the risk in the causal diagram, and g(ρi )
represents the impact of innovative research contributions on risk, while the influence of
other factors is included in the k3 .Algorithms 2021, 14, 50 9 of 15
Figure 4. Three identified risk factors.
Through such a causal equation, we can clearly show the complex causal or association
relationships that may exist among different factors. The relationship presented in this
paper is flexible and can vary according to the number and types of factors considered in
the model. In the following part of the experiment, we will give the predefined f (θi ) and
g(ρi ) functions and examine their impact on the final profit allocation.
Finally, this paper continues to modify the Shapley value method while considering the
influences of the changing of factors on profit distribution. The purpose of the modification
is to make the distribution scheme more reasonable and fair, to provide an incentive for the
allied enterprises. For example, the proportions of the risks borne by a member enterprise
rise from 10% to 30% and from 30% to 60%. According to the traditional algorithm, the
increase of the same magnitude brings the enterprise the same value of increment of profits.
However, the actual situation is that the difficulty and determination of member enterprises
to bear the increasing of the proportion of the risk under the condition of 10% and 30% of
the risk are different. Therefore, for the latter situation, which is more complicated, it can
only be realized by encouraging and distributing more profits. In this paper, the influence
of factor change on the distribution result is reflected by changing the power number of
factor terms. For example, Equation (10) changes the power number of risk contribution to
two, and the updated comprehensive correction factor is:
(2) 2
h i
(1) (3)
λi = δ1 xi + δ2 xi + δ3 xi (10)
Then we normalize all of the λi , so it ends up with
∑in=1 λ1
λ10 = λ1 − (11)
n
4. Simulation Experiment
The results of the correction method are verified by examples and experiments. The
experiment proves that when the weights of different factors change, the improved Shapley
value method can make the enterprises making more contributions to factors with higher
weights get more profits.
Now assume that there are three express enterprises 1, 2, and 3, and their operating
expenses are CNY 170,000, CNY 250,000, and CNY 300,000 respectively. Their cooperation
may be as follows:
1. Enterprises 1, 2 carry out cooperation, and enterprise 3 carries out business alone. The
total cost at this time is CNY 500,000.
2. Enterprises 1, 3 carry out cooperation, and enterprise 2 carries out business alone. The
total cost at this time is CNY 520,000.
3. Enterprises 2, 3 carry out cooperation, and enterprise 1 carries out business alone The
total cost at this time is CNY 450,000.
4. Enterprises 1, 2, 3 carry out cooperation The total cost at this time is CNY 320,000.Algorithms 2021, 14, 50 10 of 15
According to the traditional Shapley value method, the following calculation can be
carried out to obtain the distribution profits of enterprises 1, 2, and 3 in the alliance in
Tables 1–3.
Table 1. Profit distribution table of enterprise 1.
(s) (1) (1, 2) (1, 3) (1, 2, 3)
v(s) 0 22 20 40
v(s − {1}) 0 0 0 27
v(s) − v(s − {1}) 0 22 20 13
|s| 1 2 2 3
ω (|s|) 1/3 1/6 1/6 1/3
ω (|s|)[v(s) − v(s − {1})] 0 3.67 3.33 4.33
Table 2. Profit distribution table of enterprise 2.
(s) (2) (1, 2) (2, 3) (1, 2, 3)
v(s) 0 22 27 40
v(s − {2}) 0 0 0 20
v(s) − v(s − {2}) 0 22 27 20
|s| 1 2 2 3
ω (|s|) 1/3 1/6 1/6 1/3
ω (|s|)[v(s) − v(s − {2})] 0 3.67 4.5 6.67
Table 3. Profit distribution table of enterprise 3.
(s) (3) (1, 3) (2, 3) (1, 2, 3)
v(s) 0 20 27 40
v(s − {3}) 0 0 0 22
v(s) − v(s − {3}) 0 20 27 18
|s| 1 2 2 3
ω (|s|) 1/3 1/6 1/6 1/3
ω (|s|)[v(s) − v(s − {3})] 0 3.33 4.5 6
Therefore, according to the traditional Shapley value method, the profits of enterprises
can be obtained as ϕ1 = 0 + 3.67 + 3.33 + 4.33 = 11.33 (ten thousand CNY) ϕ1 = 0 + 3.67 +
4.5 + 6.67 = 11.33 (ten thousand CNY) ϕ1 = 0 + 3.67 + 4.5 + 6.67 = 11.33 (ten thousand
CNY). Hence, we get three ϕi in the correction algorithm. The following experiment shows
the benefit distribution effect of the modified algorithm in the case of this example.
This paper assumes that k1 = 0.2, k2 = 0.1, k3 = 0.7 and the values in Table 4. The
piecewise function of the investment fund contribution and innovation research contri-
bution in Equation (8) is also given. The specific value of risk contribution is determined
by Equation (8). When constructing functions f (θi ) and g(ρi ), combined with practical
considerations, the following expression can be obtained:
3 1
5 θi , 0 ≤ θi < 3
4 1 1 1
f ( θi ) =
5 θi − 15 , 3 ≤ θi < 2 (12)
4 1 1
3 θi − 3 , 2 ≤ θi ≤ 1
1 1
6 , 0 ≤ ρi < 3
5 1 1
12 , 3 ≤ ρi < 2
g ( ρi ) = 7 1 2
(13)
12 , 2 ≤ ρi < 3
1, 23 ≤ ρi ≤ 1
Algorithms 2021, 14, 50                                                                                                  11 of 15

                          Table 4. Assumed θi and ρi of three enterprises.

                                                          Enterprise 1              Enterprise 2              Enterprise 3
                                      θi                       0.1                       0.4                       0.5
                                      ρi                       0.5                       0.4                       0.1

                                 In the experiment, we fixed the above data (enterprise cost, k i , θi and ρi of three
                          enterprises, f (θi ) and g(ρi )). Then we modified the weights of different factors, and
                          traversed all (δ1 , δ2 , δ3 ) satisfying δ1 + δ2 + δ3 = 1. After that we combined and calculated
                          the corresponding profit distribution results, as is shown in Figure 5.
                                 In Figure 5, the change of the benefit distribution result (axis z) with the weight of
                          each factor is plotted (axis x refers to δ1 , axis y refers to δ2 , accordingly; δ3 = 1 − δ1 − δ2 ).
                          For every eligible (δ1 , δ2 , δ3 ), the corresponding result of profit distribution can be directly
                          drawn from the graph as a line perpendicular to plane xy and its intersection point is
                          (δ1 , δ2 ). The value ϕ corresponding to the three intersection points of the plane in the figure
                          is the final benefit distribution result ϕi0 . It can be seen from the figure that the correction
                          algorithm conforms to our expectation. For example, we can find from the form of the
                          blue curved surface that as δ1 increases, the shared interests of enterprise 1 is in decline,
                          because the increase of δ1 represents that when allocating profits, the alliance focuses on
                          distributing more benefits to the enterprises that contribute more capital. Among the three
                          enterprises, the investment capital contribution of enterprise 1 only accounts for 10% of the
                          whole alliance, so as the alliance pays more attention to the input capital contributions, the
                          benefits of enterprise 1 will decrease.

                          Figure 5. The variation of the result of profit distribution with the weight of each factor.

                                In the previous chapter, the weight of each factor was obtained by comparing the given
                          importance matrix with AHP. Since the expert score cannot be obtained, this experiment
                          traverses the possible weight space to study the influences of different weights on the final
                          benefit distribution. As the results in this experiment contain all weighing possibilities,
                          that is, the ratings given by possible experts, they are more general and broader.
                                In addition, in order to more intuitively reflect the relationship between the results
                          of benefit distribution and different variables, we drew three groups of experimental
                          results, as shown in Figures 6–8, respectively, showing the changes of the results of benefit
                          distribution with a certain factor.
Algorithms 2021, 14, 50 12 of 15
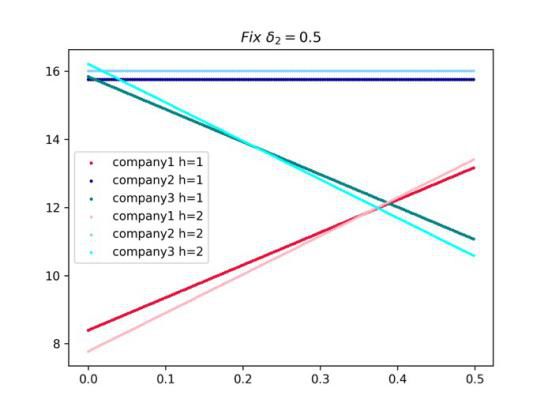
Figure 6. The result of the distribution of profits varies with δ1 (δ3 is fixed).
Figure 7. The result of the distribution of profits varies with δ3 (δ2 is fixed).
Figure 8. The result of the distribution of profits varies with δ2 (δ1 is fixed).
Among them, the horizontal axis represents the weight of change and the vertical axis
represents the result of profit distribution. In each figure, the weight of one factor was
fixed at 0.5 to change other weights, and the final profit distribution results were compared
under the conditions of power being one and power being two. However, this experiment
has given the specific values of three factors of three enterprises, so the experiment fails to
reflect the influence of the power in the algorithm.
ϕ20 = ϕ2+ ∆λ2 × v(s)
1
(14)
= ϕ2 + δ1 θ2 + δ2 ϑ2h + δ3 ρ2 − N × v(s)Algorithms 2021, 14, 50 13 of 15
Take Figure 7 for example. It can be seen that when δ2 = 0.5 is fixed, the profits of
enterprise 2 remain unchanged along with the change of δ3 . This is due to the numerical
particularity of the examples used in this experiment, since Equation (14) is used to calculate
the interests of enterprise 2 when the power is 1 and the power is 2 (where N is the number
of participating enterprises and the value is 3). Besides, the weight of risk δ2 is fixed. As
the weight of innovation research contribution factor δ3 changes, the weight of capital
investment factor δ1 = 0.5 − δ3 also changes. However, in enterprise 2 in the example
θ2 = ρ2 = 0.4, the change of δ3 does not affect the interests of enterprise 2 under the
condition of fixing δ2 . In addition, it can be seen that, with the increase of δ3 , shared
interests of enterprise 1 become bigger and bigger. This is consistent with our expectations,
because enterprise 1 has the largest contribution to the enterprise’s innovation study of
the three companies, accounting for 50%, so when assigning greater weights to innovative
research contributions, namely, the innovation research contribution to measure supply
chain member alliance, there seemed to be no more important contributions; members
whose contributions in innovation research are greater will share more profits. It can be
seen that the modified algorithm conforms to the expected effect.
However, the experiment in this paper has some shortcomings. That is, it fails to
test the influence of power’s change on the result of profit distribution. The experiment
proves that the modified algorithm can consider the influences of three factors on the
profit distribution at the same time, and adjust the result of the profit distribution ac-
cording to the different weights of the factors to realize the fairness and rationality of the
profit distribution.
5. Conclusions
Firstly, based on other modes and practices of shared logistics, we put forward some
explanations of the connotations of shared logistics. Then we designed the operation mode
of shared logistics based on the understanding of the connotations of shared logistics and
the theory of other shared logistics modes in warehousing and distribution, and used
the flow chart to reflect it. The member enterprises in the alliance share machines and
manpower, and more importantly, form a warehouse network within the alliance, share
information, and manage together to realize the whole operation of the alliance.
Secondly, it is difficult for independent enterprises in the express delivery industry
to cooperate, and the cooperation mechanism lacks effective incentives, which is less
attractive to express delivery enterprises. Besides, there are inevitable interest disputes
when enterprises reach an alliance, which will affect the long-term cooperation of the
alliance. In order to make the system’s warehouse distribution patterns more likely come
into practice, and in order to promote express enterprises’ transformation from separate
operations to cooperative operations by encouraging express enterprises to participate
in the system storehouse of distribution alliance, this article emphatically discusses the
alliance of interests distribution, and fixes the Shapley value method used for the evaluation
of the contributions of members of the enterprise in the allocation process, making it more
practically significant. While adhering to the idea of the Shapley value method being
used to distribute benefits according to contributions, this paper has modified its unique
calculation method in three aspects. Through an example, we used the traditional Shapley
value method to calculate and change the weights according to the correction algorithm
proposed in this paper. Then we used the matplotlib library for displaying all positions
with the interests of the three members of the alliance distribution—results varied with
the weights of different factors (namely, δi ) by 3D image, and we used the 2D images to
compare the effects of the linear and nonlinear allocation methods (the power was 1 or 2),
which are in line with the expectations of a correction algorithm.
On the design of the mode of unified warehouse and distribution, due to the lack of
practical investigations and enough internal data and cases, there may be assumptions
that do not fit the reality. At present, for China’s express enterprises, warehousing and
distribution are the two key links and the main sources of high cost. Further combinationsAlgorithms 2021, 14, 50 14 of 15
of research results and practical experience from other shared logistics modes at home and
abroad will also be conducive to the further improvement and development of the mode
of warehouse distribution, so as to promote the cooperation of express delivery enterprises,
and help the express delivery industry to reduce costs and increase efficiency, and reform
and innovate.
The improvement of the benefit distribution problem is based on the Shapley value
method, so it fails to avoid the inherent use of many runs of the Shapley value method.
However, by adding a comprehensive correction factor, using linear and nonlinear cal-
culation methods, and considering the correlations between factors, the revised benefit
distribution scheme is more practical and has more incentive significance. In the future,
further in-depth study is needed, and other algorithms such as Raiffa are likely to be used
to further improve the solution.
Author Contributions: Conceptualization, L.W.; methodology, writing—original draft, X.W.; writing—
review and editing, X.C. All authors have read and agreed to the published version of the manuscript.
Funding: This research was funded by the National Key Research and Development Program of
China grant number 2018YFB1403101.
Institutional Review Board Statement: Not applicable.
Informed Consent Statement: Not applicable.
Conflicts of Interest: The authors declare no conflict of interest.
References
1. Wang, L. Research on Joint Distribution Model and Location Selection in the Sharing Economy; University of International Business and
Economics: Beijing, China,2017.
2. Sarkar, B.; Saren, S. Ordering and transfer policy and variable deterioration for a warehouse model. Hacet. J. Math. Stat. 2017,
46, 985–1014.
3. Shin, D.M.; Guchhait, R.; Sarkar, B.; Mittal, M. Controllable lead time, service level constraint, and transportation discounts in a
continuous review inventory model. Rairo Oper. Res. 2016, 50, 924–934.
4. Kumar Sett, B.; Sarkar, B.; Goswami, A. A two-warehouse inventory model with increasing demand and time varying deteriora-
tion. Sci. Iran. 2012, 19, 1969–1977.
5. Li, J.; Wang, W.; Sun, X.; Wang, B.; Wang, M. Sharing mechanism construction and pattern analysis of shared warehouse and
distribution system. Commod. Qual. 2018, 35, 166, 172.
6. Yang, M.; Zhou, X. Construction of collaborative distribution pattern at the terminal of express under the background of “Internet
Plus”. J. Beijing Univ. Posts Telecommun. Soc. Sci. Ed. 2015, 17, 45–50,57.
7. Li, C. Analysis on the co-mode and operation mechanism of urban community logistics service. Commer. Age 2013, 10, 45–46.
8. Wu, G. Construction of a new mode of joint distribution alliance at the end of e-commerce logistics. Bus. Econ. Res. 2018,
20, 90–92.
9. Shi, Z. Foreign joint distribution system construction practice and experience for reference. Shanxi Sci. Technol. 2019, 34, 76–79.
10. Li, N. The theory and practice of logistics mutualization in Japan. Chin. Circ. Econ. 2019, 33, 27–39.
11. Li, N. Analysis on the evolution and development mode of logistics colocalization in Japan. Mod. Jpn. Econ. 2015, 4, 77–86.
12. Ge, R. Research on the construction of urban common distribution system based on resource sharing. North. Econ. Trade 2017,
2, 62–63.
13. Li, M.; Zhang, H.; Wang, Y. Research review of urban joint distribution model and income distribution. Bus. Econ. Res. 2017, 8, 73–75.
14. Zhao, T. Research on Profit Distribution Mechanism of Rural Chain Supermarket Joint Distribution; Southwest Jiaotong University:
Chengdu, Chian, 2016.
15. Shi. S. Research on the Formation and Operation Mechanism of Knowledge Alliance; Nankai University Press: Tianjin, China, 2015.
16. Li, L. Study on the Influencing Factors and Methods of Benefit Distribution of Chain Retail Joint Distribution Alliance; Hebei University
of Technology: Tianjin, China, 2015.
17. Zhang, Y.; Chen, L.; Yuan, Y.; Mao, H.; Peng, F.; Study on the profit distribution mechanism between intelligent logistics park and
settled enterprises based on dynamic Bayes. Pract. Underst. Math. 2020, 50, 299–307.
18. Xu, S.; Li, N.; Ruan, Y.; Jiao, L.; Wang, C.; Ding, X.; Profit distribution model of agricultural products based on improved shapley
value of cloud logistics. Knowl. Trib. 2018, 25, 59–59.
19. Zhang, X. Study on profit distribution of small and medium-sized logistics enterprises in agricultural products logistics organiza-
tion cooperation. Logist. Technol. 2020, 43, 12–16.
20. Shapley, L.S. A Value for n-Person Games. Ann. Math. Stud. 1953, 28, 307–318.Algorithms 2021, 14, 50 15 of 15
21. Cai, R.; Hu, D. Research on the construction and profit distribution of express terminal service alliance based on cooperative
game. Logist. Technol. 2019, 42, 9–14.
22. Li, H. Research on profit distribution of end joint distribution alliance of express delivery enterprises: based on the improved
Shapley value method. J. Zhengzhou Inst. Aviat. Ind. Manag. 2016, 34, 71–77.
23. Peng, M.; Zou, L.; Wei, X. A preliminary study on profit distribution based on joint distribution model. Chin. Mark. 2016, 49, 21–22.
24. Qu, J. Research on profit distribution model of third-party logistics joint distribution based on the Shapley value method. Guide
Sci. Educ. Electron. Ed. Mid 2015, 1, 136–137,149.
25. Zhang, R.; Luo, R. Research on Benefit Assignment of Common Delivery Based on Shapley Value Method. J. Wuhan Univ. Technol.
2008, 30, 150–153.
26. Yang, D. Research on distribution Center Selection and Profit Distribution under Joint Distribution; Dalian Maritime University: Dalian,
China, 2005.
27. Mu, L. Analysis of Revenue Allocation Model for Joint Distribution Operation of Circulation Enterprises Based on Shapley Value
Method. Tech. Methods 2014, 3, 212–215.
28. Yang, L. Application of Shapley Value Modified Model to Benefit Distribution of Supply Chain Alliance in Cross-border
E-commerce Environment. Logist. Eng. Manag. 2018, 40, 105–107.
29. Xu, M.; Zhou, X.; Cui, L.; Liu, Y.; Yu, G.; Low distribution density regional express joint distribution mode and profit distribution.
Comput. Integr. Manuf. Syst. 2020, 26, 181–190.
30. Li, T. Benefit Distribution of Dynamic Logistics Alliance Based on Improved Shapley Value Method. Logist. Technol. 2020,
39, 106–110.
31. Sun, P.; Zhang, B.. Research on profit distribution of small and medium-sized logistics enterprise alliance based on Shapley value
modification under platform business mode. Bus. Res. 2019, 26, 123–128.You can also read