INVESTOR PRESENTATION - August 2019 - based on second quarter, June 30, 2019 financial data Investor Contact: ...
←
→
Page content transcription
If your browser does not render page correctly, please read the page content below
INVESTOR PRESENTATION
August 2019 – based on second quarter, June 30, 2019 financial data
Investor Contact: TrinityInvestorRelations@trin.net
Website: www.trin.net
Investor Presentation – August 2019
I.     Trinity Industries, Inc. Overview and Key Investment Considerations   4
II.    Railcar Market Overview                                               11
III.   Trinity’s Integrated Rail Platform                                    16
       –    Railcar Leasing and Management Services Group                    20
       –    Rail Products Group                                              25
IV. Financial Discussion and Strategic Objectives                            30
V.     Appendix                                                              37

                                                                                  2
Forward Looking Statements
Some statements in this presentation, which are not historical facts, are “forward‐looking statements” as defined by the Private Securities
Litigation Reform Act of 1995. Forward‐looking statements include statements about Trinity's estimates, expectations, beliefs, intentions or
strategies for the future, and the assumptions underlying these forward‐looking statements, including, but not limited to, future financial and
operating performance, future opportunities and any other statements regarding events or developments that Trinity believes or anticipates will
or may occur in the future. Trinity uses the words “anticipates,” “assumes,” “believes,” “estimates,” “expects,” “intends,” “forecasts,” “may,”
“will,” “should,” “guidance,” “projected,” “outlook,” and similar expressions to identify these forward‐looking statements. Forward‐looking
statements speak only as of the date of this presentation, and Trinity expressly disclaims any obligation or undertaking to disseminate any
updates or revisions to any forward‐looking statement contained herein to reflect any change in Trinity’s expectations with regard thereto or any
change in events, conditions or circumstances on which any such statement is based, except as required by federal securities laws. Forward‐
looking statements involve risks and uncertainties that could cause actual results to differ materially from historical experience or our present
expectations, including but not limited to risks and uncertainties regarding economic, competitive, governmental, and technological factors
affecting Trinity’s operations, markets, products, services and prices, and such forward‐looking statements are not guarantees of future
performance. For a discussion of such risks and uncertainties, which could cause actual results to differ from those contained in the forward‐
looking statements, see “Risk Factors” and “Forward‐Looking Statements” in Trinity’s Annual Report on Form 10‐K for the most recent fiscal
year, as may be revised and updated by Trinity’s Quarterly Reports on Form 10‐Q, and Trinity’s Current Reports on Form 8‐K.

                                                                                                                                                    3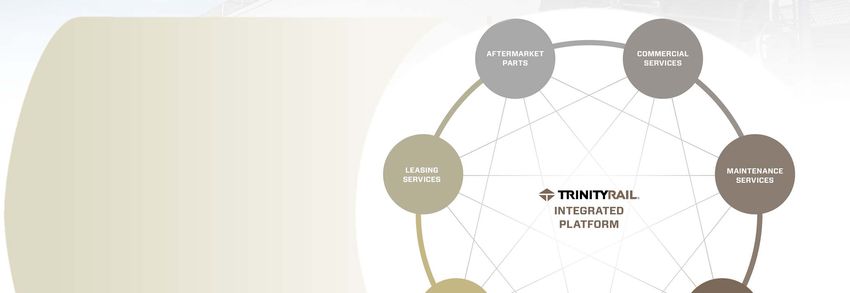
Trinity Industries, Inc. Overview
• Trinity Industries, Inc. owns market‐leading businesses
  that provide railcar products and services in North
  America marketed under the trade name TrinityRail®

• The Company services its customers through a unique
  integrated rail platform that combines premier railcar
  leasing and management services and a flexible rail
  manufacturing footprint to provide a single source for
  comprehensive rail transportation solutions

• Trinity reports its financial operations through three
  business segments:
     – Railcar Leasing and Management Services Group
     – Rail Products Group                                     External Revenue by Business Group(2)
     – All Other Group

• In November 2018, the Company completed a spin‐off
  of its infrastructure‐related businesses effected
  through a tax‐free dividend to Trinity shareholders

• Total Revenue and EBITDA* for LTM June 2019 was
  approximately $2.7 billion and $642 million respectively
     – Market Cap as of 6/30/19: $2.7 Billion
     – Enterprise Value as of 6/30/19: $7.2 Billion
                                                                                                                                        (4)
     – Current Shares Outstanding: ~ 128 million(1)          (in $mms)
                                                                                                                                                (3)

                                                                         * See appendix for footnotes and reconciliation of non‐GAAP measures         4
Key Investment Considerations: a Value, Growth, and Capital Return Story

        Railcars are an attractive long‐term investment in a tax‐advantaged asset class that transport
        goods and commodities in a sustainable, environmentally‐friendly way

        Trinity’s integrated platform comprises leading market positions that offer distinct
        opportunities for growth and generates significant cash flow

        Heightened focus on driving return on equity performance and aspires to mid‐double digits
        returns over the railcar cycle

        Disciplined capital allocation approach for deploying a flexible and underlevered balance
        sheet

        Strong corporate cultural expectation for premier performance and experienced
        management team aligned with shareholder interests

                                                                                                         5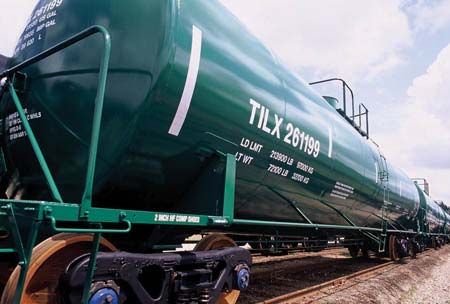
Trinity’s Integrated Rail Platform:
A Collaboration of Businesses Focused on a Strategic Purpose

   The TrinityRail platform includes a broad
  portfolio of railcar products and services
 across a wide landscape of end markets
 enabling customized solutions to fulfill
 each customer’s unique needs

  TrinityRail’s integrated platform of
  businesses work together to deliver
   innovative solutions that optimize the
     life‐cycle ownership and usage of
       railcar equipment

                                                               6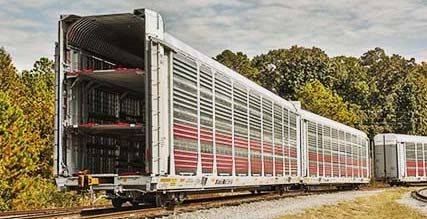
A Legacy of Evolutionary Growth and Focus on the Future

  A proven history of market leadership:                                A strong focus on market transformation:
  1930’s‐   Trinity’s earliest legacy company was founded               ‐   Optimize the ownership and usage of railcars to make rail
                                                                            transportation more economically attractive and compelling
  1960’s‐   Enters railcar manufacturing industry                            ‐ Identify product design features and technology applications that
                                                                               enhance the productivity of railcars within their rail supply chain
  1970’s‐   Enters railcar equipment leasing business
                                                                             ‐ Leverage data analytics and digital tools to enhance the customer
                                                                               experience
  1980’s‐   Establishes a leading railcar manufacturing platform and
            enters railcar repair business                                   ‐ Pursue new value propositions from innovative service solutions
                                                                               that generate premium recurring revenue sources
  1990’s‐   Enters railcar management services business                 ‐   Scale the lease fleet across the owned and managed platform in a
                                                                            disciplined, capital‐efficient manner
  2000’s‐   Launches Railcar Investment Vehicle (RIV) platform for
            discrete institutional investment in railcar assets         ‐   Expand railcar maintenance services business to offer industry‐
  2010’s‐                                                                   leading turn times for maintenance and compliance events
            Establishes market leadership position in railcar leasing
                                                                        ‐   Invest in advanced manufacturing technologies to enhance the
  2018‐     Tax‐free spin‐off to concentrate focus on railcar               flexibility of the manufacturing platform
            businesses

                                                                                                                       See appendix for footnotes    7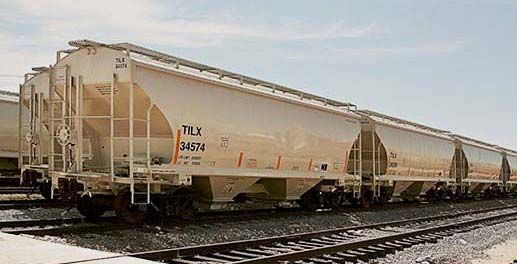
Trinity’s Rail Platform is Built to Deliver Shareholder Value
The combined strength and cash flow generation Strong Free Cash Flow* Generation before Leasing CapEx
capability of the integrated rail platform enables Trinity
Pre‐Spin Current Year Future Goal
to meaningfully invest in high‐return growth
opportunities AND return substantial capital to
shareholders
The integrated rail platform generates predictable ~$750M+
cash flows from long‐term leases and captures upside FCF
demand in the rail cycle to maximize shareholder
value (in $mms)
Potential Range
The synergies from TrinityRail’s integrated platform
create financial, operational, and strategic advantages: Stable Growth and Potential for Maximum Profitability
$700
Stable and predictable recurring revenues
Significant free cash flow generation $600
Cost‐advantaged railcar equipment sourcing $500 37%
Tax‐advantaged lease fleet investment enhances economic $400
Leasing
growth
profit and offsets manufacturing taxable income
$300
Valuable sales channel to originate low‐risk organic growth
Actionable rail market intelligence $200
Increased customer touchpoints that generate new $100
products and services $0
(in $mms) 2014 2015 2016 2017 2018 2019 (P)
Economic Profit ‐ Leasing Economic Profit ‐ Rail Products
* See appendix for reconciliation of non‐GAAP measures
8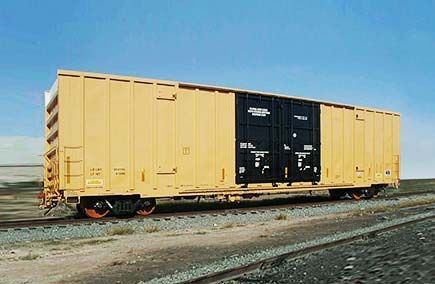
Strategic Objectives to Improve Returns and Unlock Shareholder Value

                                                                 3 Yr
    Pre‐Spin                             2019 (P)                                                            Long‐Term
                                                              ROE* Target
    ROE*(1)                               ROE*                                                               ROE* Target
                                                               11 ‐ 13%
     6.3%                                 9.5%                  Average                                      Mid Teens

                Financial Levers to Generate                          Operational Levers to Drive
               Improvement in Returns in the                        Greater Returns and Growth over
                         Near Term                                          the Longer Term

    • Reduce Trinity’s cost of capital through a more       • Align corporate overhead to go‐forward Trinity
      optimized balance sheet                                 business needs

    • Opportunistically deploy capital on high‐return       • Expand operating margins through advanced
      accretive business investments to improve               manufacturing and cost saving initiatives
      return on equity
                                                            • Grow our maintenance services business to
    • Disciplined investment in the lease fleet utilizing     improve service levels and reduce fleet
      a tax‐ and capital‐efficient approach                   maintenance costs

    • Disciplined capital allocation framework with         • Innovate value‐add service solutions that
      meaningful and steady return of capital to              generate additional recurring revenue sources
      shareholders

                                                                      *See appendix for footnotes and reconciliation of non‐GAAP measures   9
Improving Company Outlook for FY 2019 (as of 7/25/19)

                                                                                            2018 Results                   2019 Guidance                    YoY Δ Expected

                               Total EPS:                                               $0.70 per share                   ~ $1.15 ‐ $1.35                ~ +79% at midpoint
                               Corporate expenses:                                      $149mm                            ~ $105 ‐ $115mm                ~ ‐26% at midpoint
 Total Company

                               Leasing & Management Revenues:                            $729mm                           ~ $760 ‐ $775mm                ~ +5% at midpoint
                               Leasing & Management OP:                                  $292mm                           ~ $320 ‐ $330mm                ~ +11% at midpoint

Leasing Group

                               Rail Products Revenue:                                     $2.3B                            ~ $3.0 – $3.2B                 ~ +32% at midpoint
                               Rail Products Operating Margin:                            7.3%                             ~ 9.0 – 9.5%                   ~ +200 basis points at
                                                                                                                                                          midpoint
 Rail Products
    Group
                                                                                                                             Positive Impact to EPS | Negative impact to EPS

 Any forward‐looking statements made by the Company speak only as of the date on which they are made. Except as required by federal securities law, the Company is under no obligation to, and
 expressly disclaims any obligation to, update or alter its forward‐looking statements, whether as a result of new information, subsequent events or otherwise.

                                                                                                                                                                 See appendix for footnotes      10
Railcar Market Overview
11Railcars are an Attractive Long‐term Investment in an
Undervalued Asset Class
Stable and predictable Tax‐advantaged Serves
50 yearashard
a natural
asset
cash flows asset class interest rate hedge
with inflation
protection
• Stable, predictable cash flows through • Superior risk‐adjusted returns; tax‐ • Rising interest rate environments
long‐term leases with historically high advantaged return of capital have historically led to higher lease
utilization throughout rail cycles • Traditional 7 year MACRS rates
• Essential‐use assets that are vital to depreciation schedule compared to • Rent yields have historically shown
lessee’s operations and revenue 35 year straight‐line book correlation with interest rates,
generation depreciation to a 10% residual value Producer Price Index (PPI) and
• Low credit defaults and prioritized • Low volatility for residuals industrial production
asset class in event of bankruptcy • 100% immediate deduction for
• Strong incentives for incumbent capital equipment under the 2017
lessee renewal Tax Act
A green way to fuel the
50 year hard asset with Direct correlation to North American
inflation protection GDP fundamentals supply chain
• Railcars have economic useful lives of • Rail transportation and its • Railroads produce 75% less greenhouse
35‐50 years infrastructure are critical components gas emissions than trucking.
• Long‐lived, essential‐use, servicing‐ of the supply chain that is core to U.S. • Railroads move 1/3 of all U.S. exports
intensive equipment, with positive industrial production and domestic intercity freight volume,
yield relationship to inflation • Railcar loading volumes directly but only account for 0.6% of total
• Low risk of technological correlate to overall GDP greenhouse emissions.
obsolescence fundamentals and encapsulate the • At the end of their useful lives, railcars
• Active secondary market provides dynamics of specific railcar are generally sold for scrap
support for strong asset valuations submarkets, each with different • A railcar can be fully recycled through
demand drivers scrap and salvage
See appendix for source info 12Rail Transportation is an Integral Component of the North
American Industrial Supply Chain
U.S. Freight Ton Miles Connecting the Consumer
by Mode(1) to the Global Market
Pipeline
19%
1.7 mm 3,500
Air Railcars in North commodities3
< 1% America2
Truck
47%
Water
6.2 trillion
35% 80%
8% of railroad revenue is of U.S. grain
total ton miles
driven by exported to Mexico
international trade4 moves by rail5
85% 84%
of auto assembly in of Canadian propane
Rail Mexico moves by rail6 exports move by rail7
25%
See appendix for footnotes 13The Railcar Industry Spans Five Commercial End Markets
Energy Refined Products Construction Consumer
& Chemicals Agriculture & Metals Products
• Natural Gas Liquids
• Coal • Refined Products • Grains • Construction • Autos
• Biofuels • Plastics • Grain Mill Products Materials • Paper
• Frac Sand • Petro‐chemicals • Distillers Dried • Aggregates • Intermodal
• U.S. Crude • Chlor Alkali Grains/Feed • Steel/Iron
• Canadian Crude • Sulfur Products • Fertilizers
29% of 12% of 21% of 16% of 22% of
North American North American North American North American North American
railcar loadings railcar loadings railcar loadings railcar loadings railcar loadings
~80 distinct ~1,100 distinct ~680 distinct ~600 distinct ~940 distinct
commodities commodities commodities commodities commodities
See appendix for source info 14The Ownership Landscape for Railcars is Changing
Ownership of Railcars Built has Trended Favorably to Lessors
The number of railcars in the North American railcar fleet
has grown less than 6.5% since 2001 (CAGR of 0.3%) and
totals 1.7 million railcars at the end of 2018
Railcar ownership has shifted towards leasing companies
as Class 1 Railroads place the onus on industrial shippers
to source their own railcars
Trinity is uniquely positioned to provide railcars for sale
or lease to industrial shippers and other equipment
providers through the integrated rail platform
Lease Fleet Growth Accelerated in Early 2000’s
Trinity’s rail platform creates a commercial channel that
enables low‐risk organic growth for the lease fleet and
has resulted in a CAGR of 14% of the owned and
managed lease fleet since 2002
Trinity’s ready access to the capital markets, strong
balance sheet, and RIV platform support our strong
capability to originate new leases and acquire assets in
the secondary market to continue growing the lease fleet
See appendix for source info 15Trinity’s Integrated Rail Platform
16Trinity’s Integrated Rail Platform Delivers Value to Stakeholders
The TrinityRail® integrated platform is strategically “Built to Deliver,” leveraging our deep
rail industry knowledge from our broad market view point to differentiate the value
proposition to all of our stakeholders
17Trinity’s Integrated Rail Platform Meets Customer Demand
with a Broad Product Portfolio
TrinityRail offers:
• The broadest array of railcar types for every commodity – over 100 different models
• Quality, craftsmanship, and superior product service support
• Custom design configurations covering all potential end market opportunities
• The option to purchase or lease railcars
TANK CARS COVERED HOPPERS AUTORACKS
FLAT & INTERMODAL GONDOLAS OPEN HOPPERS BOX CARS
18Trinity’s Integrated Rail Platform Delivers to the Needs of
Each Customer Channel
Shippers Railroads Leasing Rail Investors (RIVs)
Ownership1 %
N.A. Fleet
Bringing investment
17% 31% 52% scale to our market
approach
Services Used
by Customer
Products
Channels
Products Products Products
Leasing Leasing Leasing Leasing
Services Services Services Services
Key Customers
Pension funds
Insurance companies
See appendix for source info
19Trinity’s Integrated Rail Platform:
Railcar Leasing and Management Services Group
20Solid Financial Performance with Multiple Sources of Revenue
Leading provider of comprehensive railcar leasing Leasing & Management Revenues and Profit (Excludes Car Sales)(1)
and management services
Leasing and Management Revenue has grown 24% since
2013
Future committed lease revenue totals $2.6 billion as of
Q2 2019
Owned and partially‐owned portfolio of leased
railcars includes 102,140 railcars at June 30, 2019
with a net book value of approximately $7.3 Billion
The backlog value of leased railcars at June 30, 2019 was (in $mms)
(2)
approximately $974 million, representing approximately
7,300 railcars to be added to the fleet in the near term
Recurring Source of Income from Secondary Markets (in $millions)
Trinity’s owned, partially‐owned, and managed portfolio
of leased railcars includes 124,650 railcars at quarter end 2013 2014 2015 2016 2017 2018
Proceeds Car Sales > 1Yr $ 131.6 $ 265.8 $ 514.6 $ 37.7 $ 360.7 $ 230.5
Leased railcars historically retain their asset value as Revenue Car Sales < 1YR 58.5 486.3 404.9 126.1 99.6 113.9
reflected in strong valuations in the secondary Total Proceeds from Car Sales $ 190.1 $ 752.1 $ 919.5 $ 163.8 $ 460.3 $ 344.4
markets
Profit Car Sales > 1Yr $ 20.4 $ 92.3 $ 166.1 $ 13.5 $ 83.5 $ 50.4
Trinity completed $344 million of leased railcar sales to
Profit Car Sales < 1YR 9.1 136.1 109.0 34.1 19.7 21.5
our RIV partners and in the secondary market during
Total Profit from Car Sales $ 29.5 $ 228.4 $ 275.1 $ 47.6 $ 103.2 $ 71.9
2018 and expects approximately $350 million during
2019
See appendix for footnotes 21Premier Portfolio Management and Asset Placement
Trinity’s portfolio management team manages risk Strong Portfolio Management of Lease Fleet Assets
exposure by commodity, end‐market, railcar type,
customer concentration and credit profile
The commercial team’s track record for renewal success
Years
of scheduled expirations and assignment of available
railcars leads to strong levels of utilization for the leased
railcar portfolio
Trinity’s average remaining lease term for the portfolio of
leased railcars has averaged 3.4 years since 2010 –
renewing the leased railcar portfolio approximately every
7 years
Balances Commercial Risk Exposure with Quality Customers
In line with the lease term, approximately 15% of the
railcars in the portfolio (or ~ 1/7th) are scheduled for Largest customer
renewal each year Top 20 customers account
represents 5% of total lease
for 38% of lease revenue
2019 scheduled expirations: ~ 12,900 railcars (~ 13%) revenue
Through the integrated rail platform, Trinity Industries Avg relationship tenure of
Avg 10 year write‐ off
Leasing Company (TILC) commercially serves over 700 Top 10 customers is 23
history < 0.2%
customers years
22Diversified Portfolio of Assets Across End Markets and Railcar Designs
Trinity maintains a well‐balanced portfolio diversified across end markets and railcar
designs to minimize risk and exposure concentrations throughout the railcar cycle
Commercial End Markets / Commodities
Construction & Consumer Refined Products &
Car Type Agriculture Energy Total
Metals Products Chemicals
Open Hopper/Gondolas Aggregates, Steel and Metals Coal 12%
Freight Car = 55%
Cement, Construction
Small Covered Hopper (< 5K cu/ft) Fertilizer
Materials, Steel and Metals
Frac Sand 12%
Major Railcar Category Types
DDG and Feeds, Grain Mill
Large Covered Hopper (> 5K cu/ft) Products, Grains, Food and Lumber (Wood Chips) Other Chemical (Soda Ash) 14%
Other Ag, Fertilizer
Specialty Covered Hopper Grain Mill Products Aggregates, Cement Coal (Fly Ash) Plastics 8%
Lumber, Steel and Metals,
Other Freight Food
Cement
Autos, Paper, Intermodal Other Chemicals 9%
NGL, Chlor Alkali, Petro‐
Pressure Tank Cars Fertilizer
chemical, Other Chemicals 9%
Sulfur Products, Chlor Alkali,
Gen. Service Tank Cars (< 20K gal) Grain Mill Products Aggregates (Clay Slurry)
Other Chemicals
4%
Tank Car = 45%
Refined Products, Petro‐
Gen. Service Tank Cars (20K‐25K gal) Fertilizer, Food, Animal Feed
chemicals, Other Chemicals 5%
Refined Products, Petro‐
Gen. Service Tank Cars (25K‐30K gal) Grain Mill Products, Food Crude Oil, Biofuels
chemicals, Other Chemicals 10%
Refined Products,
Gen. Service Tank Cars (> 30K gal) Crude Oil, Biofuels Petrochemicals, Other 12%
Chemicals, NGLs
Chlor Alkali, Other Chemicals,
Specialty Tank Cars Fertilizer
Sulfur Products
5%
Total 22% 8% 8% 31% 31%
~ 900 Different Commodities ~ 270 Different Railcar Designs
23Strong Economic Profit and Healthy Cash on Cash Returns
from a Young Lease Portfolio
Trinity’s railcar leasing business generates stable and Growing Economic Profit* from Lease Operations (in $millions)
predictable cash flows from long‐term leases 2013 2014 2015 2016 2017 2018
Leasing & Mgmt Revenue $ 586.9 $ 632.0 $ 699.9 $ 700.9 $ 743.6 $ 728.9
Leasing & Mgmt Profit 267.3 287.9 331.1 312.5 341.3 291.8
Economic profit is a key measure of the business OP Margin 45.5% 45.6% 47.3% 44.6% 45.9% 40.0%
cash flows and takes into consideration operational (Less): Interest Expense (157.3) (153.3) (138.8) (125.2) (125.8) (142.3)
cash flows (including leasing rental revenues, Profit Before Tax (Ex. Railcar Sales) $ 110.0 $ 134.6 $ 192.3 $ 187.3 $ 215.5 $ 149.5
maintenance and repair, property taxes and PBT Margin 18.7% 21.3% 27.5% 26.7% 29.0% 20.5%
(Add): Depreciation 129.0 130.0 142.3 156.2 172.3 196.6
insurance) and interest expense
Economic Profit (Ex. Railcar Sales) $ 239.0 $ 264.6 $ 334.6 $ 343.5 $ 387.8 $ 346.1
A primary benefit of Trinity’s integrated rail platform Young Lease Fleet is Yielding Solid Cash on Cash Returns*
is that the Company invests in leased railcars at cost,
which is reflected in the net book value of property,
plant, and equipment in the Consolidated Balance
Sheet
Using a cash‐on‐cash return metric highlights the
return profile of a young and growing railcar lease
fleet
The average age of the Trinity lease fleet is 9.3 years
(in $mms)
as of June 30, 2019 compared to the industry railcar
average of approximately 20 years
* See appendix for reconciliation of non‐GAAP measures 24Trinity’s Integrated Rail Platform:
Rail Products Group
25Elevating our Financial Performance through the Railcar Cycle
Leading manufacturer of railcars in North America with Rail Products Revenues and Profit Cycle is Inflecting Positive(1)
the broadest product offering and a focus on advanced
engineering designs
Flexible manufacturing footprint with emphasis on
streamlined manufacturing efficiencies and centralized
sourcing to enhance cost savings
High variable cost business due to material input costs;
pricing and operating leverage enhanced by capacity
availability and specialized, commodity‐specific designs,
and long production runs of similar railcar types in high (in $mms)
(2)
demand
Trinity delivered 19,035 railcars representing 36% of Healthy Backlogs Enable Strong Production Visibility (units)
industry shipments during LTM June 2019; Trinity
received orders for 20,875 railcars representing 32% of
the industry total during the same time period
Trinity’s $2.9 billion order backlog of 23,170 railcars
accounts for 33% of industry backlog as of June 2019 and
includes a broad mix of railcar types across many
industrial sectors
(2)
See appendix for footnotes 26Building Premier Products and Services
Innovative Durability and Superior Performing
Designs Reliability Products
Innovative Durability & Superior
• Innovative railcar designs
Designs • Reliability
Lower life‐cycle Performing
• Maximize the in‐service time
that optimize and
enhance a railcar’s
maintenance costs for the Products
of a customer’s railcar
railcar owner
performance for a • Cycle loading/unloading
customer • 35‐50 year assets require efficiencies
sound engineering
• Attention to loading and
unloading features
Investing in product development that continues to differentiate our product portfolio
for customers and drive operational performance
27Flexibility in Manufacturing is Key to Our Operations
Trinity has invested significantly in its manufacturing footprint, establishing a strong manufacturing
platform and ability to respond to changes in market demand
Flexibility
Trinity's manufacturing flexibility across railcar
products – both tank cars and freight railcars –
and maintenance services enhances our ability
to opportunistically respond to changes in
market demand
Cost‐Effective
Trinity’s manufacturing scale,
vertical integration, and presence
in the Southern U.S. and Mexico
provide cost effective benefits
across our integrated rail
platform
28Growing Maintenance Services to Benefit Leasing Operations and
Enhance the Flexibility of the Manufacturing Platform
Trinity plans to grow its Maintenance Services business in key geographic areas with high railcar
traffic to support the lease fleet’s growing need for more maintenance capacity
Leasing Requires More Maintenance Capacity
Future Tank Car Fleet Compliance Schedule
(units)
29Financial Discussion & Strategic Objectives
30Trinity’s Business Segments
Trinity Industries, Inc. (LTM June 2019 Financials)
Total Revenues: $2.7B
Operating Profit: $364M
Income from Continuing Operations: $125M
EBITDA*: $642M
Railcar Leasing and Intersegment
Management Services Rail Products Group All Other
Group
Eliminations
Revenue: $932M $2,508M $367M ($1,125)M
Operating
Profit: $379M $191M $30M ($110)M
▪ Railcar leasing services ▪ Tank and freight railcars ▪ Highway Products ▪ Intersegment Eliminations,
primarily from the sale of
▪ Asset management ▪ Maintenance services ▪ Trinity Logistics Group railcars from the Rail
▪ Railcar investment vehicle ▪ Railcar parts and heads Products Group to the
(RIV) sales Railcar Leasing and
Management Services Group
for new railcar equipment
supported by a firm
customer contract for the
lease
* See appendix for reconciliation of non‐GAAP measures 31Improving Company Outlook for FY 2019 (as of 7/25/19)
2018 Results 2019 Guidance YoY Δ Expected
Total EPS: $0.70 per diluted share ~ $1.15 ‐ $1.35 ~ +79% at midpoint
Corporate expenses: $149mm ~ $105 ‐ $115mm ~ ‐26% at midpoint
Interest Expense, net: $167mm ~ $220 ‐ $230mm ~ +35% at midpoint
Tax rate: 28% ~ 26.5% ~ ‐150 basis points
Total Company Manufacturing & Corporate CapEx: $37mm ~ $120 ‐ $140mm ~ +251% at midpoint
Leasing & Management Revenues: $729mm ~ $760 ‐ $775mm ~ +5% at midpoint
Leasing & Management OP: $292mm ~ $320 ‐ $330mm ~ +11% at midpoint
Total proceeds from sales of leased railcars: $344mm ~ $350 ‐ $510mm(1) ~ +25% at midpoint
Net investment in lease fleet: $948mm ~ $0.9 – $1.1B ~ +5% at midpoint
Leasing Group
Rail Products Revenue: $2.3B ~ $3.0 – $3.2B ~ +32% at midpoint
Rail Products Operating Margin: 7.3% ~ 9.0 – 9.5% ~ +200 basis points at midpoint
Railcar deliveries: 20,105 ~ 23,000 – 24,500 ~ +18% at midpoint
Revenue elimination from sales to Leasing Group: $990mm ~ $1.5B ~ +52%
Profit elimination from sales to Leasing Group: $95mm ~ $175mm ~ +84%
Rail Products
Group
Operating Profit: $36mm ~ $15 ‐ $20mm ~ ‐51% at midpoint
All Other Group
Positive Impact to EPS | Negative impact to EPS
Any forward‐looking statements made by the Company speak only as of the date on which they are made. Except as required by federal securities law, the Company is under no obligation to, and
expressly disclaims any obligation to, update or alter its forward‐looking statements, whether as a result of new information, subsequent events or otherwise.
See appendix for footnotes 32Balance Sheet Positioned for Deployment of Capital
Trinity’s balance sheet positions the Company for opportunistic deployment of
capital with an under‐levered leasing company and strong liquidity
Wholly‐Owned Partially‐
Total Company
Lease Fleet Owned Fleet
NBV, PP&E + All Cash NBV, PP&E + All Cash
$5,636 mm $1,831 mm $7,086 mm
Sources* Sources*
Total Debt* $2,919 mm $1,299 mm Total Debt* $4,616 mm
Loan to Value 53% 72%
(Total Debt/NBV PP&E)
Approximate Leasing Stockholders
$2,717 mm $532 mm $2,530 mm
Book Equity (excl Deferred Profit) Equity*
Shares Outstanding(1) 128 mm
Unencumbered Railcars Total Liquidity (Cash,
$1,285 mm Corporate Revolver, Railcar $756 mm
Available for Financing Warehouse)
*Selected Balance Sheet Items as of 06/30/19
See appendix for footnotes
33Financial and Operational Priorities for Improving Returns
Optimize the capital structure while growing the business through disciplined investment to
drive growth and enhance returns for shareholders
Target high‐return capital
Invest in value‐creating investments that position
business opportunities the manufacturing footprint
to meet strong demand Optimize corporate
Operational that grow the lease fleet
opportunities, and scale the
Levers and build out our service rail maintenance business
costs to align with
offerings for leasing and expand geographically Trinity’s go‐forward
customers to lower maintenance costs business model
Optimize the capital Lower overall cost of Regularly and
Financial structure through added capital through prudent meaningfully return
Levers leverage on the Leasing balance sheet cash to shareholders
company balance sheet management and through a consistent
enhanced returns on dividend and additional
investments share repurchases
34Strong Progress on Near Term Strategic Financial Priorities
Target Progress/Current State
Scale lease fleet with $0.9 ‐ $1.1 Billion in Net Lease
Lease fleet growth disciplined growth Fleet Investment (2019(P)(1))
Invest in the manufacturing footprint to Announced plans to greenfield
~ 50 % of Lease fleet
enhance delivery capabilities and facility in Iowa to serve
maintenance requirements
geographic presence of the maintenance needs of lease
handled internally
maintenance business fleet
Optimize the balance sheet through Dec 2017: 25% LTV
60 – 65% LTV Dec 2018: 47% LTV
added leverage to the Leasing (On Wholly‐owned Lease Fleet) Dec 2019(P) (1): ~ 57‐59%
Company LTV
Completed $350mm ASR
Announced new $350mm repurchase
Return capital to shareholders Methodical & Opportunistic
program
Raised dividend 31%
Maintain competitive S&P: BBB‐ / Negative
Balance the risk/reward between credit cost of debt through Moody’s: Ba2 / Stable
ratings and leverage ratios investment grade ratings or Fitch: BB / Stable
structured financings Rail ABS 2019: A (S&P & Kroll)
See appendix for footnotes 35Commitment to Environmental, Social, & Governance Practices
Environmental Commitment Social Responsibility
Operating our business in a way that minimizes impact Attracting and retaining a diverse and empowered workforce
on natural resources and the environment
• Railcars are a green way to fuel the North American • Fostering a workplace that is inclusive and
supply chain. U.S. freight railroads can move one collaborative
ton of freight 479 miles per gallon of fuel, producing
far less greenhouse gas emissions than other modes • Hiring and retaining the best talent and promoting
of commercial transport opportunities for professional development
• Operate our businesses in a way that minimizes • Improving the wellbeing of our employees and other
impact on natural resources and the environment stakeholders
• Responsibly support customers’ products at each • Contributing to the communities in which we operate
stage of the product lifecycle
Governance Excellence Risk Management
Promoting the long‐term interests of stakeholders, Strong track record of operational excellence and safety
strengthening accountability and inspiring trust
• Goal of zero injuries and incidents
• Independent Chairman (split CEO/Chairman roles),
and diverse and independent Board
• Actively engage stakeholders in environmental,
health, and safety (EHS) initiatives and continually
• Incentive compensation programs aligned with
improve EHS processes, practices, and performance
shareholder interests and Board members
• Internally developed and proprietary Safety and
• Senior‐level committee tasked with overseeing
Environmental Certification Process parallels several
ESG improvement and initiatives
of the ISO standards.
See appendix for source info 36Appendix
37Lease Accounting Financial Overview:
Income Statement to Balance Sheet Transaction Flow
1 In 2018, $990mm of new railcar assets and
maintenance services were sold from the Rail
Products Group to the Leasing Group. This
Revenues Operating revenue was eliminated within the Income
2018 Income Statement Items External Intersegment Total Profit (Loss) Statement, and the value of the capitalized
Rail Products Group $ 1,356.4 $ 990.3 $ 2,346.7 $ 172.1 equipment and services delivered included
Eliminations ‐ Lease Subsidiary $ (990.0) $ (990.0) $ (95.1) within this total was added to the Leasing
Total External Sales (Rail Products Group) $ 1,356.4 $ 0.3 $ 1,356.7 $ 77.0 Group’s balance sheet at the original
purchase value (“market transfer price”).
2
1 As a result of these intercompany
Wholly‐ Partially‐ Manu‐ 2
transactions, the capitalizable portion of the
Owned Owned facturing/
$95.1mm of Deferred Profit was added to the
Selected 2018 Balance Sheet Info Subsidiaries Subsidiaries Corporate Total
Balance Sheet to reflect Trinity’s original cost
Property, Plant & Equipment, Net $ 4,976.5 $ 1,814.7 $ 370.9 $ 7,162.1 basis in these transactions.
Ca s h & Ca s h Equi va l ents /Res tri cted Ca s h 140.9 36.6 173.3 350.8
Net Deferred Profit on Railcars The change in the value of PP&E from 2017
Sold to the Leasing Group (827.7)
3
to 2018 reflects the capitalized value of new
railcars and modifications and additional
3 4 secondary market purchases added to the
Wholly‐ Partially‐ Manu‐ wholly‐owned fleet, less the annual
Owned Owned facturing/ depreciation expense and the net book value
Selected 2017 Balance Sheet Info Subsidiaries Subsidiaries Corporate Total of railcars sold from the lease fleet.
Property, Plant & Equipment, Net $ 4,140.0 $ 1,822.7 $ 395.8 $ 6,358.5
Ca s h & Ca s h Equi va l ents /Res tri cted Ca s h 135.5 62.9 1,094.9 1,293.3 The change in Deferred Profit from 2017 to
Net Deferred Profit on Railcars
4 2018 reflects the current year’s profit on
Sold to the Leasing Group (800.7) capitalized equipment and services less the
annual amortization of deferred profit
(recognized within the Leasing Group’s
Income Statement) and the recognition of
the remaining accumulated deferred profit
balance of railcars sold from the fleet during
2018.
38Rail Products Group Quarterly Revenue and Operating Profit
As Previously Reported vs. Recast Post‐Spin (Unaudited)
Rail Products Group Q1‐2017 Q2‐2017 Q3‐2017 Q4‐2017 Q1‐2018 Q2‐2018 Q3‐2018 Q4‐2018
‐ Recast post‐spin
Revenue $ 469.0 $ 455.8 $ 481.2 $ 638.0 $ 588.1 $ 566.2 $ 497.6 $ 694.8
Operating Profit 50.1 29.8 43.0 73.4 51.5 48.5 28.0 44.1
Operating Profit Margin % 10.7% 6.5% 8.9% 11.5% 8.8% 8.6% 5.6% 6.3%
Rail Group Q1‐2017 Q2‐2017 Q3‐2017 Q4‐2017 Q1‐2018 Q2‐2018 Q3‐2018 Q4‐2018
‐ Previously reported
Revenue $ 478.3 $ 465.9 $ 492.4 $ 647.2 $ 598.5 $ 575.2 $ 506.8 ‐
Operating Profit 50.5 36.7 50.5 78.4 58.9 57.7 32.9 ‐
Operating Profit Margin % 10.6% 7.9% 10.3% 12.1% 9.8% 10.0% 6.5% ‐
39EBITDA Reconciliation
Last 12 Months ‐ June 30, 2019
Income from Continuing Operations $ 125.3
Interest Expense 198.9
Provision for income taxes 47.4
Depreciation and Amortization Expense 270.3
EBITDA $ 641.9
EBITDA is defined as net income from continuing operations plus interest expense, income taxes, and depreciation and amortization.
EBITDA is a non‐GAAP financial measure; however, the amounts included in the EBITDA calculation are derived from amounts included
in our GAAP financial statements. This information is provided to assist investors in making meaningful comparisons of our operating
performance between periods. We believe EBITDA is a useful measure for analyzing the performance of our business. We also believe
that EBITDA is commonly reported and widely used by investors and other interested parties as a measure of a company’s operating
performance and debt servicing ability because it assists in comparing performance on a consistent basis without regard to capital
structure, depreciation or amortization (which can vary significantly depending on many factors). EBITDA should not be considered as an
alternative to net income as an indicator of our operating performance, or as an alternative to operating cash flows as a measure of
liquidity. The EBITDA measure presented in this presentation may not be comparable to similarly titled measures by other companies
due to differences in the components of the calculation.
40Free Cash Flow Reconciliation
Free Cash Flow Calculation 2016 2017 2018
Net Cash Provided by Operating Activities, Continuing Operations $ 837.5 $ 610.1 $ 274.2
Add: Proceeds from railcar lease fleet sales owned more than
one year at the time of sale 37.7 360.7 230.5
Net Cash Provided by Operating Activities, Adjusted $ 875.2 $ 970.8 $ 504.7
Total Manufacturing CapEx (49.5) (22.0) (37.3)
Dividends Paid (66.7) (72.6) (77.4)
Free Cash Flow (before Leasing CapEx) $ 759.0 $ 876.2 $ 390.0
Free Cash Flow is a non‐GAAP financial measure and is defined as Net Cash Provided by Operating Activities from Continuing Operations as
computed in accordance with GAAP, plus cash proceeds from sales of leased railcars, less cash payments for manufacturing capital
expenditures and dividends. We believe Free Cash Flow is useful to both management and investors as it provides a relevant measure of
liquidity and a useful basis for assessing our ability to fund our operations and repay our debt. Free Cash Flow is reconciled to Net Cash
Provided by Operating Activities from Continuing Operations, the most directly comparable GAAP financial measure, in the table above. No
quantitative reconciliation has been provided for the forward‐looking Free Cash Flow targets presented on slide 8 because of the inherent
difficulty in forecasting and quantifying the amounts necessary under GAAP. Non‐GAAP measures should not be considered in isolation or as
a substitute for our reporting results prepared in accordance with GAAP and, as calculated, may not be comparable to other similarly titled
measures for other companies.
41Economic Profit Reconciliation
Economic Profit ‐ Leasing 2014 2015 2016 2017 2018
Profit from Operations $ 287.9 $ 331.1 $ 312.5 $ 341.3 $ 291.8
(Less): Interest Expense (153.3) (138.8) (125.2) (125.8) (142.3)
Profit Before Tax (from Operations) $ 134.6 $ 192.3 $ 187.3 $ 215.5 $ 149.5
(Add): Depreciation 130.0 142.3 156.2 172.3 196.6
Economic Profit (from Operations) $ 264.6 $ 334.6 $ 343.5 $ 387.8 $ 346.1
Economic Profit ‐ Rail Products 2014 2015 2016 2017 2018
Rail Products Segment Profit 712.8 900.7 449.4 196.3 172.1
(Less): Corporate Interest Expense (40.1) (55.9) (56.7) (58.2) (37.0)
(Less): Leasing Eliminations (133.1) (259.6) (180.7) (96.5) (95.1)
Profit Before Tax $ 539.6 $ 585.2 $ 212.0 $ 41.6 $ 40.0
(Add): Depreciation 26.5 34.5 38.3 35.1 30.3
Economic Profit $ 566.1 $ 619.7 $ 250.3 $ 76.7 $ 70.3
Economic Profit is a non‐GAAP financial measure derived from amounts included in our GAAP financial statements.
For the Leasing Group, Economic Profit is defined as Leasing & Management Operating Profit as computed in accordance with GAAP,
adjusted to deduct interest expense and add back depreciation expense. For the Rail Products Group, Economic Profit is defined as Rail
Products Group Segment Operating Profit, adjusted to deduct corporate interest expense, to add back depreciation expense, and to
eliminate the operating profit related to sales to the Leasing Group.
These non‐GAAP measures are reconciled to segment Operating Profit, the most directly comparable GAAP financial measure, in the
table above. Management believes that Economic Profit is useful to both management and investors in their analysis as it is a key
measure of our businesses’ cash flows and takes into consideration operational cash flows and interest expense. Non‐GAAP measures
should not be considered in isolation or as a substitute for our reporting results prepared in accordance with GAAP and, as calculated,
may not be comparable to other similarly titled measures for other companies.
42Pre‐Tax ROE Reconciliation
FY 2017 FY 2018 LTM 2019
Numerator:
Income from continuing operations before income taxes $ 195.4 $ 151.6 $ 172.7
Net income attributable to non‐controlling interest (11.1) (3.8) (6.7)
Adjusted Profit Before Tax $ 184.3 $ 147.8 $ 166.0
Denominator:
Stockholders' Equity $ 4,858.0 $ 2,562.0 $ 2,529.6
Non‐controlling interest (356.9) (351.2) (350.8)
Accumulated other comprehensive loss 104.8 116.8 127.4
Adjusted Stockholders' Equity $ 4,605.9 $ 2,327.6 $ 2,306.2
Average Stockholders' Equity $ 2,338.0 $ 2,316.9
Pre‐tax Return on Equity 6.3% 7.2%
Pre‐tax Return on Equity (“Pre‐Tax ROE”) is a non‐GAAP measure that is derived from amounts included in our GAAP financial
statements. We define Pre‐Tax ROE as a ratio for which (i) the numerator is calculated as income from continuing operations before
income taxes, adjusted to exclude the net income or loss attributable to non‐controlling interest and (ii) the denominator is calculated as
average stockholders’ equity (which excludes noncontrolling interest), adjusted to exclude accumulated other comprehensive income or
loss.
In the table above, the numerator and denominator of our Pre‐Tax ROE calculation are reconciled to income from continuing operations
before income taxes and stockholders’ equity, respectively, which are the most directly comparable GAAP financial measures. No
quantitative reconciliation to a GAAP measure is provided for the Pre‐tax ROE targets presented on slide 9 because of the inherent
difficulty in forecasting and quantifying the amounts necessary under GAAP.
Management believes that Pre‐Tax ROE is a useful measure to both management and investors as it provides an indication of the
economic return on the Company’s investments over time, and considers the Company’s expected tax position in the near‐term. Non‐
GAAP measures should not be considered in isolation or as a substitute for our reporting results prepared in accordance with GAAP and,
as calculated, may not be comparable to other similarly titled measures for other companies.
43Lease Operations Cash on Cash Return Reconciliation
2012 2013 2014 2015 2016 2017 2018 LTM 2019
Revenue from Leasing Operations $ 528.5 $ 586.9 $ 632.0 $ 699.9 $ 700.9 $ 743.6 $ 728.9 $ 746.6
Profit from Operations 242.6 267.3 287.9 331.1 312.5 341.3 291.8 299.7
OP Margin 45.9% 45.5% 45.6% 47.3% 44.6% 45.9% 40.0% 40.1%
(Less): Interest Expense (174.3) (157.3) (153.3) (138.8) (125.2) (125.8) (142.3) (174.9)
Profit Before Tax (from Operations) $ 68.3 $ 110.0 $ 134.6 $ 192.3 $ 187.3 $ 215.5 $ 149.5 $ 124.8
PBT Margin 12.9% 18.7% 21.3% 27.5% 26.7% 29.0% 20.5% 16.7%
(Add): Depreciation 120.5 129.0 130.0 142.3 156.2 172.3 196.6 216.7
Economic Profit (from Operations) $ 188.8 $ 239.0 $ 264.6 $ 334.6 $ 343.5 $ 387.8 $ 346.1 $ 341.5
Cash on Cash Return Calculation 2012 2013 2014 2015 2016 2017 2018 LTM 2019
Economic ("Cash") Profit (from Lease Operations) $ 188.8 $ 239.0 $ 264.6 $ 334.6 $ 343.5 $ 387.8 $ 346.1 $ 341.5
Net Leasing PP&E $ 4,205.9 $ 4,649.7 $ 4,599.1 $ 5,064.9 $ 5,803.2 $ 5,962.7 $ 6,791.2 $ 7,350.7
Restricted Cash $ 223.2 $ 260.7 $ 234.7 $ 195.8 $ 178.1 $ 195.1 $ 171.5 $ 113.6
Deferred Income Balance $ 446.2 $ 549.7 $ 557.2 $ 674.0 $ 798.1 $ 800.7 $ 827.7 $ 861.9
Total Debt $ 2,691.3 $ 2,613.0 $ 2,729.8 $ 2,394.4 $ 2,238.0 $ 2,403.9 $ 3,631.8 $ 4,218.3
Net Leasing PP&E (Avg Yr/Yr) $ 4,203.5 $ 4,427.8 $ 4,624.4 $ 4,832.0 $ 5,434.1 $ 5,883.0 $ 6,377.0 $ 7,071.0
Restricted Cash (Avg Yr/Yr) $ 231.8 $ 242.0 $ 247.7 $ 215.3 $ 187.0 $ 186.6 $ 183.3 $ 142.6
Less: Deferred Income Balance (Avg Yr/Yr) $ (488.9) $ (498.0) $ (553.5) $ (615.6) $ (736.1) $ (799.4) $ (814.2) $ (844.8)
Less: Total Debt (Avg Yr/Yr) ######## $ (2,652.2) $ (2,671.4) $ (2,562.1) $ (2,316.2) $ (2,321.0) $ (3,017.9) $ (3,925.1)
Equity/Cash Contribution Total $ 1,290.5 $ 1,519.7 $ 1,647.3 $ 1,869.6 $ 2,568.8 $ 2,949.2 $ 2,728.2 $ 2,443.7
Cash on Cash Return 14.6% 15.7% 16.1% 17.9% 13.4% 13.1% 12.7% 14.0%
Cash on Cash Return is a non‐GAAP measure that is derived from amounts included in our GAAP financial statements. We define Cash on Cash
Return as a ratio for which (i) the numerator is Economic Profit, a non‐GAAP measure that has been defined on slide 42 and reconciled in the table
above, and (ii) the denominator is calculated by taking the sum of the average net book value (net of deferred profit) of the Leasing Group’s Plant,
Property & Equipment and Restricted Cash balances less the Leasing Group’s average Debt balances.
Management believes that Cash on Cash Return is a useful measure to both management and investors in their analysis of investments for the
Company’s leasing business. Non‐GAAP measures should not be considered in isolation or as a substitute for our reporting results prepared in
accordance with GAAP and, as calculated, may not be comparable to other similarly titled measures for other companies.
44Footnotes
Slide 4 – Trinity Industries, Inc. Overview
(1) Shares outstanding as of July 18, 2019 – presented on the face of the second quarter Form 10‐Q
(2) Intersegment Revenues are eliminated
(3) FY 2017 EPS excludes a $3.06 non‐cash benefit related to the effects of the Tax Cuts and Jobs Act
(4) FY 2019 projections (“2019(P)”) represent management’s estimates as of 7/25/19. Any forward‐looking statements made by the Company speak
only as of the date on which they are made. Except as required by federal securities law, the Company is under no obligation to, and expressly
disclaims any obligation to, update or alter its forward‐looking statements, whether as a result of new information, subsequent events or
otherwise.
Slide 7 – A Legacy of Evolutionary Growth and Focus on the Future
Timeline references solely indicate current entities of Trinity Industries consisting of rail‐related businesses, and the highway and logistics businesses
Slide 9 – Strategic Objectives to Improve Returns and Unlock Shareholder Value
(1) The Company utilizes a Pre‐tax Return on Equity (ROE) metric to evaluate financial performance; the definition of Pre‐tax ROE is provided on slide 43
Slide 12 – Railcars are an Attractive Long‐term Investment in an Undervalued Asset Class
https://www.aar.org/wp‐content/uploads/2019/02/AAR‐Sustainability‐Fact‐Sheet‐2019.pdf
Slide 13 ‐ Rail Transportation is an Integral Component of the North American Industrial Supply Chain
(1) FTR Associates 9/17/2018
(2) Company Annual Reports and Bloomberg, 9/17/18
(3) Umler®, January 2018 report; The Umler® system is an electronic resource that contains critical data for North American transportation
equipment. Originally created in 1968, Umler maintains data for more than two million pieces of equipment used in rail, steamship and highway
service
(4) AAR Economic Impact
(5) http://www.grainnet.com/article/140832/importance‐of‐rail‐for‐moving‐grain‐to‐mexico
(6) http://automotivelogistics.media/news/in‐depth‐analysis‐strong‐logistics‐and‐supply‐base‐central‐to‐fords‐new‐mexico‐plant
(7) https://apps.neb‐one.gc.ca/CommodityStatistics/ExportVolumeByTransportModeSummary.aspx?commodityCode=PR
Slide 14 – The Railcar Industry Spans Five Commercial End Markets
(1) All statistics cited on this slide: 2016 STB Waybill Sample – reflects vast majority of commodity types
(2) Umler® North American fleet ownership data
Slide 15 – The Ownership Landscape for Railcars is Changing
Umler ® North American fleet ownership data
45Footnotes (continued)
Slide 19 – Trinity’s Integrated Rail Platform Delivers to the Needs of Each Customer Channel
Umler ® North American fleet ownership data
Slide 21‐ Solid Financial Performance with Multiple Sources of Revenue
(1) Leasing and Management Operating Profit Margin calculated using only revenues and profit from Leasing Operations including Partially Owned
Subsidiaries and excluding Car Sales
(2) FY 2019 projections (“2019(P)”) represent management’s estimates as of 7/25/19. Any forward‐looking statements made by the Company speak
only as of the date on which they are made. Except as required by federal securities law, the Company is under no obligation to, and expressly
disclaims any obligation to, update or alter its forward‐looking statements, whether as a result of new information, subsequent events or
otherwise.
Slide 26 – Elevating our Financial Performance through the Railcar Cycle
(1) Intersegment Revenues are eliminated and Group revenues were not recast prior to 2016 following the Company’s spin‐off of Arcosa, Inc.
(2) FY 2019 projections (“2019(P)”) represent managements estimates as of 7/25/19. Any forward‐looking statements made by the Company speak
only as of the date on which they are made. Except as required by federal securities law, the Company is under no obligation to, and expressly
disclaims any obligation to, update or alter its forward‐looking statements, whether as a result of new information, subsequent events or
otherwise.
Slide 32 – Improving Company Outlook for FY 2019
(1) Total proceeds from sales of leased railcars of $350mm to $510mm includes the effect of approximately $160mm of sales‐type leases for a
specific customer.
Slide 33 – Balance Sheet Positioned for Deployment of Capital
(1) Shares outstanding as of July 18, 2019 – presented on the face of the second quarter Form 10‐Q
Slide 35 – Strong Progress on Near Term Strategic Financial Priorities
(1) FY 2019 projections (“2019(P)”) represent management’s estimates as of 7/25/19. Any forward‐looking statements made by the Company speak
only as of the date on which they are made. Except as required by federal securities law, the Company is under no obligation to, and expressly
disclaims any obligation to, update or alter its forward‐looking statements, whether as a result of new information, subsequent events or
otherwise.
Slide 36 – Commitment to Environmental, Social, and Governance Practices
https://www.aar.org/wp‐content/uploads/2019/02/AAR‐Sustainability‐Fact‐Sheet‐2019.pdf
46You can also read