Style Similarity as Feedback for Product Design
←
→
Page content transcription
If your browser does not render page correctly, please read the page content below
Style Similarity as Feedback for Product Design

 Mathew Schwartz, Tomer Weiss, Esra Ataer-Cansizoglu, and Jae-Woo Choi
arXiv:2105.12256v1 [cs.CV] 25 May 2021

 Abstract Matching and recommending products is beneficial for both customers
 and companies. With the rapid increase in home goods e-commerce, there is an
 increasing demand for quantitative methods for providing such recommendations
 for millions of products. This approach is facilitated largely by online stores such
 as Amazon and Wayfair, in which the goal is to maximize overall sales. Instead of
 focusing on overall sales, we take a product design perspective, by employing big-
 data analysis for determining the design qualities of a highly recommended product.
 Specifically, we focus on the visual style compatibility of such products. We build off
 previous work which implemented a style-based similarity metric for thousands of
 furniture products. Using analysis and visualization, we extract attributes of furniture
 products that are highly compatible style-wise. We propose a designer in-the-loop
 workflow that mirrors methods of displaying similar products to consumers browsing
 e-commerce websites. Our findings are useful when designing new products, since
 they provide insight regarding what furniture will be strongly compatible across
 multiple styles, and hence, more likely to be recommended.

 1
2 Schwartz, Weiss, Cansizoglu, and Choi

Fig. 1: The nodes of the reduced dataset. Color corresponds to the product group
type and size corresponds to the degree of the node.

1 Introduction

Interior designers and architects are experienced in creating cohesive styles of an
interior space. However, the cost of such a professional is prohibitive for most people.
Such professionals use intuition, experience, rules in composition, and color theory
to drive decision making, along with modes of visual communication such as drawing
and 3D rendering. For the typical consumer, interior design and home decoration
are a balance of personal taste and guesswork. One of the more difficult barriers
to overcome on the general consumer side is the visualization of multiple products
within their context (i.e., a room all products will reside in). Similarly, the sorting of

Mathew Schwartz
New Jersey Institute of Technology, Newark,NJ, e-mail: cadop@umich.edu
Tomer Weiss
New Jersey Institute of Technology, Newark NJ, e-mail: tweiss@njit.edu
Esra Ataer-Cansizoglu
Facebook, Boston MA, e-mail: cansizoglu@ieee.org
Jae-Woo Choi
Wayfair, Boston MA, e-mail: jchoi@wayfair.com
Style Similarity as Feedback for Product Design 3

massive online catalogs of products and matching these products in a desirable way
can be overwhelming.
 One sorting approach is through using a set of attributes and labels assigned to
products in the catalog. Through such attributes, item-based filtering can be applied,
in which items sharing certain features, such as color, are recommended to a user.
While this technique is a standard industry practice, it is limited in usefulness for
large datasets containing hundreds of thousands of products. Additionally, certain
attributes are more abstract and difficult to ascertain, requiring multiple ratings and
labels by experts–some of which might not agree on such subjective matter. One
such attribute is the style of a given space, which includes multiple components such
as: fabric, color scheme, material, furniture style and flooring. In this work, we use
such components as the basis of 4 major room styles:modern, traditional, cottage,
coastal, that are popular within an interior product e-commerce website (Wayfair).
We elaborate on descriptions of these styles in Table 1.
 An emerging trend in the e-commerce space is to use image-based analysis for
identifying similarities of products. This is useful in online situations where products
must have an image (or 3D rendering) for customer display, while not being fully
labelled with information describing subjective style-related attributes. In this paper
we propose a synergy between the methods used for recommendation algorithms
to a consumer and the design of the products to be recommended. Background and
implementation of past work is presented, along with an in-depth discussion on
the resulting analysis of our dataset. This dataset is of images labeled with product
Stock Keeping Units (SKUs) and similarly, associated with a product group (Fig. 1)
from the Wayfair company. By organizing data into a network structure, we are able
to visualize and explore connectivity and relationships between various attributes
and types. Finally, we present a flowchart for how such image-based analysis of
style similarities can be integrated within a product designers workflow, in a not too
dissimilar way to that of a consumer browsing online.

2 Related Work

Understanding a user’s preferences lies at the heart of many e-commerce web-
sites [1, 21, 15]. An accurate representation of customer’s style preferences–enables
better product recommendations, and a more personalized shopping experience. The
gap in matching an individuals preference with a product is in the extraction and cate-
gorization of style-related attributes of a product. Researchers have proposed multiple
quantitative methods for understanding (i.e., extracting) subjective attributes related
to aesthetics and fashionablity that compose a style [12, 22, 7, 23, 20, 19] with a few
that focus on interiors [20, 19, 27].
 Quantitative methods for style recognition are typically data-driven and employ a
variety of machine learning techniques. Recently, neural networks, and specifically
deep neural networks, have become paramount for automatically assessing images [8]
and in general are effective for image recognition tasks [25]. A large body of work
4 Schwartz, Weiss, Cansizoglu, and Choi

exists on the categorization of images using such deep neural networks. To find an
image’s category, a deep neural network learns a lower dimensional representation,
which we refer to as style embeddings (See Sec. 3), based on labeled data. These
embeddings represents an image’s category in an abstract category space, such as
weightings within various style types. Distances between embeddings representing
different images can then be evaluated to find whether they are similar [11]. The
two most frequently used data types used by researchers to learn style and visual
compatibility are images and/or 3D models.
 Using 3D models, Hu et al. [13] presents a method for discovering elements
that characterize a given style, where the elements are co-located across different 3D
models associated with such style. Both Liu and Lun et al. [18, 19] propose to learn 3D
model style based on perceptual geometric elements. They employ crowd-sourcing
to quantify the different geometric style components. Building on this work, Lim
and colleagues [17] use neural networks to directly identify the style of 3D models,
without geometric features, by extracting images of the target 3D model. While the
Wayfair e-commerce data consists of 3D models, we focus on the more general
use-case of image data for determining style-similarity. Using images, Karayev et
al. [16] learn the style of paintings and common photographs using linear classifiers.
Thomas and Kovashka [26] use style to identify a photograph’s artist, which could
have implications for brand-identity. Considering a products connection to other
products and within societal context, Simo-Serra and colleagues [24] propose to
predict an outfits’ fashionabilty using neural networks and Gu et al. [9] identify
fashion trends from street photos. Similar to our work, but focusing directly on
product images rather than overall style, [3] used deep networks for a visual search
system that can aid in interior design through product image similarity.
 For design-based companies, understanding consumer interests and brand recog-
nition is strongly linked to visual style attributes. Studies into quantifying design aes-
thetics for consumer decisions have provided valuable insights through eye-tracking
and interactive modeling [14]. As elaborated by Burnap and colleagues [6], the im-
portance of brand recognition, and the difficulty in balancing with design freedom,
is imperative for companies in brand-conscious spaces. While that work was within
the automotive industry, cohesion between various single products for a complete
style in an interior space is equally important. This cohesion among products as seen
by a consumer should be achieved on both the e-commerce side–through intuitive
and appropriate recommendations to a consumer; as well as the product design side–
by varied designs useable in both different multiple product groupings (a range of
styles) and along with other products (including with competing brands).

3 Learning Image Style with Neural Networks

Our work relies on deep neural networks to learn furniture styles through images.
Training images were collected in a previous study [1, 28] and each was labeled
with a designated style by multiple experts (Section 3.1). Our neural network is
Style Similarity as Feedback for Product Design 5

Table 1: Descriptions of 4 major room styles: modern, traditional, cottage, coastal.
Major style features include fabric, color, material, furniture, and flooring.

 Modern Traditional Cottage Coastal

Fabric heavy texture, damask or jacquard,soft florals, linen, linen, stripes,
 leathers, linens velvet or silk, chintz
 checks and gingham, nautical
 or florals toile
Color muted solids in blue, dark red, hunter
 muted blues, pinks, blue, white, red,
Scheme neutrals, greys and green and brown reds and greens, green
 blacks white, pale yellows,
 soft greens
Furniture sleek, low to the dark wood, gold slightly distressed, whitewashed,
 ground, clean lines, accents, antique vintage distressed, beadboard
 straight legs on base inspired,skirted sofas accents, bamboo and
 or chairs, feminine rattan
 accents, wooden
 signs
Material mixed marble, gold, cherry white washed or reclaimed or painted
 or mahogany wood cherry wood, straw wood, seeded glass
 baskets and worn or beach glass, beach
 metals wood
Flooring stripes or natural ornately patterned braided cotton, soft stripes or woven,
 fiber rugs such as carpets floral or checked rugs seascape prints, sisal
 jute or sisal or jute

trained to estimate an approximate style of an image, and in doing so, provides
a comparative stylistic differences between the images (Section 3.2). This stylistic
difference is determined by a 16-dimensional layer in the neural network which we
denote as style embeddings. Given such embeddings, we are able to retrieve similar
style images (Section 3.3), and by doing so, recommend similar-style products. For
a more detailed explanation than the following overview, please refer to the previous
work, done in conjunction with Wayfair’s Data Science team [1, 28].

3.1 Labeling Image Style

Our initial dataset contains 672, 000 images of interior scenes and products collected
from various sources: (i) Staging a scene in a physical room, and then capturing it
with a camera, (ii) Captured from a virtual scene, curated by a 3D artist, and (iii)
Scraped from 3rd parties. However, due to noisy image metadata, an image’s origin
source might not always be known. Each image is designated with an interior style
label which includes: modern, traditional, cottage, coastal (Figure 2), where each
style is described with certain criteria about fabric, color scheme, material, furniture
style and flooring (Table 1).
6 Schwartz, Weiss, Cansizoglu, and Choi

 Style labeling is a subjective task prone to noise and variation among multiple
people, including stylists. To alleviate discrepancies in dataset labeling, 10 inde-
pendent experts were used to designate a style label to images. All data, including
discrepancies between the expert labels were recorded, leading to a noisy dataset of
labels–a common issue when training a neural network–as it is prone to inaccurate
estimations. Such challenges were overcome by having the neural network compare
images within the same dataset and their attributed labels from multiple experts. This
assumes the existence of tangible differences between each label that knowledgeable
experts may discern between, similar to the methods described in [4].
 A new set of comparison labels were generated based on the expert-determined
style labels. During training of the neural network a randomly selected sample of
images were used in which, for each style, and for each pair of images, a comparison
label is generated with respect to the relative order of the number of style labels each
image receives. Formally, for a given style and an image pair, a comparison label will
be +1 if in that style, the first image has more expert votes than the second image
in the pair, and −1 if it has less votes. Variations of these values of voting thresholds
were experimented with, i.e., = 1, 2, ... and any image pair was discarded that fell
outside of the defined range.

3.2 Neural Network Configuration

We use an architecture inspired by siamese neural networks [5] that extends the
Bradley-Terry [4], a neural network that learns from comparisons. VGG16 [25]
forms the base of our siamese neural network. The last layer of VGG16 is removed
and instead consecutively add two fully connected layers: a 16-dimensional layer,

 Modern Traditional

 Cottage Coastal

 Fig. 2: Examples of major room styles.
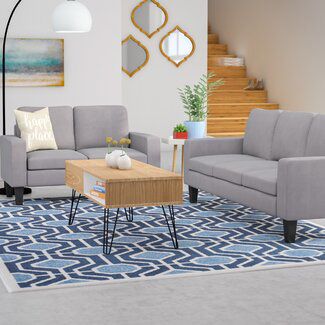
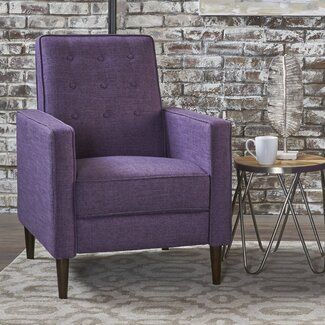
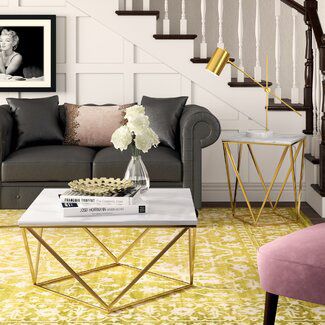
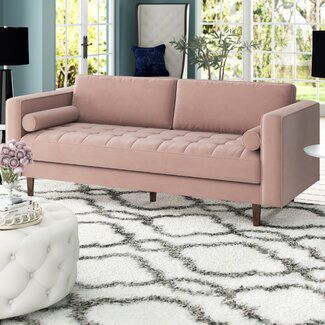
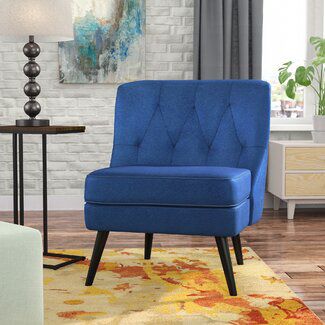
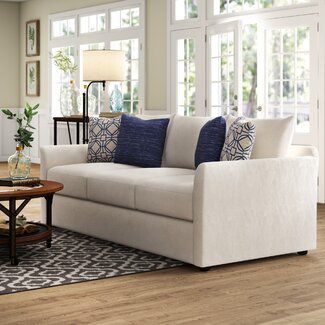
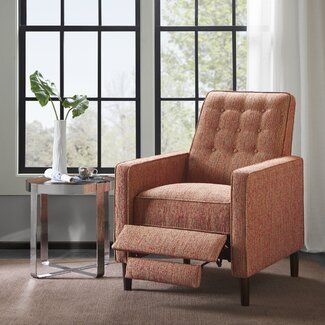
Style Similarity as Feedback for Product Design 7

Fig. 3: Our neural network model learns furniture style from images. Given a context
image with a target furniture piece (left), we predict its style embeddings.

which informs us of an image’s style embeddings, and a 4-dimensional layer, which
was used to estimate style.
 For the model, 80% of images were allocated for training, 10% for validation,
and 10% for testing. Thus, images in the training set were not paired with images
in the validation or test sets for generating comparison labels. Our style estimation
model was trained on comparisons selected uniformly at random over the training
dataset. Next, the resulting models were evaluated on the validation set to determine
the optimal neural network parameters. This model was implemented with Python
and Tensorflow, where training the neural network model took about 5 hours on a
NVIDIA Tesla V100 GPU.

3.3 Style Estimation

Since our goal is to accurately estimate an image’s style, we preformed several exper-
iments to assess our neural network performance. Each experiment involved random
subsets of our image dataset, and different neural network parameter combinations,
including thresholding of expert votes for the comparison labels. Such multiple
experiments aid in finding the optimal set of parameters that can most accurately
estimate the style of a given image.
 For estimating an image’s style, we use the last layer of the neural network,
which has 4 dimensions, each of which provide a probabilistic estimation of an
image’s style as modern, traditional, cottage, and coastal (Figure 3). To evaluate the
estimation accuracy, we found the maximum estimation values over all predicted
style labels. Our model achieved an average style estimation accuracy of 79% for a
random image in our dataset. This estimation accuracy varied by style, with 86.9%
estimation accuracy for an image labeled as modern, 74.6% for traditional, 71.6%
for cottage, and 67.9% for coastal. One possible explanation to the differences in
accuracy is that images with style labels such as coastal can also be subjectively
considered as part of another style, such as modern or traditional. Adding more
images to our dataset might improve the estimation accuracy per style-class.
 For recommending similar style images, we use the second to the last layer, which
includes 16 dimensions. Given a seed image, we consider this layer as the style
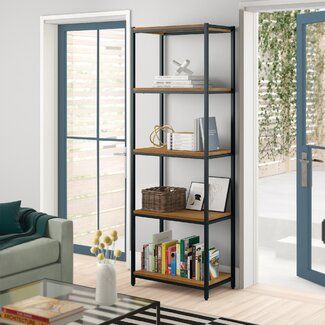
8 Schwartz, Weiss, Cansizoglu, and Choi

Fig. 4: Product images used for recommendations. Given the furniture image on the
left, our model suggests the recommendations on the right.

embeddings of the image. To evaluate our framework’s ability to recommend similar
style images, we retrieved the nearest image(s) by using the Euclidean distance
from the seed image’s embeddings. Figure 4 demonstrates the 5 closest images
to a given seed image, ranked from left to right, ordered by the distance to the
seed image. To measure our recommendation performance, we checked if the style
labels of the retrieved images match the style of the seed image. Our network’s
retrieval performance is 73.9% on an randomly sampled image, which is a significant
improvement over previous work [1].

4 Analysis of Style for Product Design

4.1 Data Processing

We use Networkx [10] in python for constructing a graph from the relationship
data. This graph is then imported to Gephi [2] for visualization. We refer to a given
SKU, or SKU and its subsequent options–as a product. By taking the resulting style
embeddings comparison for the images of the product dataset from the Wayfair
e-commerce site, the graph is constructed by associating products as nodes and the
euclidean distance between image style embeddings (Section 3.3) as weights. As
the distance between images is bi-directional, the result is a weighted undirected
 1
graph. To visually analyze such relationships, edge weights are recalculated to ,
so that a higher weight corresponds to stylistically stronger similarity. As our data is
based on raw e-commerce listings, the staging and advertising of products overlaps
between images. To reduce strong connections between images in which the same
products exist albeit in a different setting, the edges within the graph of overlapping
products (when this is known) are removed.
 For a more fine-grained analysis of our dataset, we needed to further reduce the
resulting graph. After duplicate data processing, a total of 17, 819 products and
2, 485, 878 weights existed in the graph, with weights ranging from 0.001 to over
100000, the latter in which images are nearly identical. To remove such noise from
the dataset, we cut the graph to include only edges with a weight between 1 and
10. Next, we removed products that were in a group category with less than 10
other products. The remaining graph is composed of 8, 947 nodes and 33, 154 edges.
Style Similarity as Feedback for Product Design 9

Important to keep in mind, the model we use for this paper was designed for style-
similarity, which as pointed out in [3], is different than image similarity as an image
can be visually similar and hence likely stylistically similar, but similar styles may
be different visually.

4.2 Product Relationships

Figure 5 depicts a total of 30 nodes representing a group, where the size of each node
relates to its degree. Edges drawn between product groups represent the cumulative
weighting of the underlying product connections in the graph. The most common
group is the End Table with 1, 201 products, followed by Bar Stools with 808, and
Accent Chairs with 784. Crates and Carriers, Gliders, and Shoe Storage all having
10 nodes.

 Teen Dressers
 Sec�onals

 Gliders

 Beds

 Hall Trees
 Crates and Carriers

 Futons
 Accent Chests Recliners
 / Cabinets
 End Tables
 TV Stands &
 Entertainment Centers
 Living Room
 Table Sets
 Bar Stools Dining Tables
 Teen Nightstands

 Nightstands

 Kids Beds Table Lamps
 Bookcases Dining Chairs

 Sofas

 Coffee &
 Cocktail Tables Accent Chairs
 Dressers & Chests
 Benches
 Breakroom Tables

 Living Room Sets
 O�omans Recep�on Sofas
 & Loveseats

 Shoe Storage

 Fig. 5: Connections between the product groups.
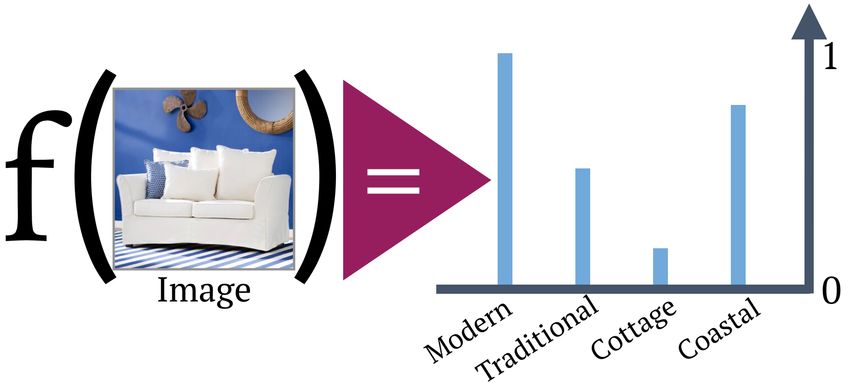
10 Schwartz, Weiss, Cansizoglu, and Choi

 When viewing the consolidated network, trends among the product groups be-
come apparent. First, we notice the product type itself heavily influences connections
to other products as distinct groupings emerge, such as the strongly connected re-
lationship between Bar Stools, Dining Tables, and Dining Chairs. As discussed
previously, dataset noise may be a strong factor, since it is likely for similar products
to be seen within product images, such as using a Dining Table as staging products
for a Dining Chair image. Second, while the total number of End Tables exceeds
all other product groups, the sum degree of the Bar Stools group is greater. This
relationship may suggest a higher diversity in the styles and relationships a Bar Stool
can be recommended for than End Tables.

 x
 x
 x

 x

(a) (One) TV Stands &
Entertainment Center (b) (One) Bar Stool (c) (One) Accent Chair (d) (All) Beds

Fig. 6: Similar products of a selected product displayed in red. The groups are colored
by the same scheme in Fig. 1. The most frequently recommended product is chosen
as the target in the first three images (Fig. 6a-6c), while the last image (Fig. 6d) shows
the recommendations from all of the products in the Bed group (the red cluster on
right side of graph).

 To further understand group connectivity we explore relationships between the
most connected products in Entertainment Centers, Bar Stools, and Accent Chairs
(Fig. 6). We find that Accent Chairs are commonly recommended for other categories
(e.g., Entertainment Centers or Bar Stools), yet the most commonly recommended
Accent Chair has no connection to other products within its own group (i.e., other
Accent Chairs). This could be a result of weakly connected products within the
same group being filtered out at the initial steps, or interestingly, a result of the style
embeddings determining that the features of one Accent Chair do not strongly match
those of other Accent Chairs. In this latter case, we interpret this relationship to
mean that part of the style attributes associated with an Accent Chair is the inherent
Accent, in which combining this chair with others would be unlikely. Naturally the
style itself can be similar between these chairs, yet as seen in the example data (Fig. 4,
images are a combination of the products within a scene or environment, possibly
skewing the relationships to that of a more practical setting in which products exist
rather than in isolation. In contrast to the wide-ranging connections between various
product groups in Figures 6a- 6c, Figure 6d highlights (in red) the connections of all
products in the Bed group (located on the right side). Such highlighting emphasizes
Style Similarity as Feedback for Product Design 11

product recommendations are limited to only a few groups: End Tables, Nightstands,
Accent Chests / Cabinets, Dressers and Chests, and the smaller categories of Teen
Dressers and Teen Nightstands. These results can be interpreted similarly to the
Accent Chairs in which the training data lacked examples in which Beds appear in
the same image as Bar Stools.

 { (a) Accent Chair
 { (b) Bar Stool

Fig. 7: Nine most strongly connected recommendations for the most commonly
recommended Accent Chair (Fig. 7a) and Bar Stool(Fig. 7b).

 Keeping in mind an error rate of the machine learning algorithm on a more
individual image scale, by exploring strong relationships to the most popular products
in a group, we gain additional insights as to how a product may contain stylistic
attributes determined by our neural network. One key point we found is that product
groups found to be strongly connected to an input product generally do not seem
to be dominated by color (Fig. 7a). When viewing the strongly connected products
in Figure 7b, a theme of large, open, and box-like recommendations seem more
common than in Figure 7a.

5 Product Design Loop

In the previous sections we describe how the neural network works and provide
a discussion on some of the results. From this basis, we propose a method for
integrating a product design workflow in a manner similar to that of the consumers
interaction with the neural network on the e-commerce side. To support future
work and continued use of our findings as algorithms in style analysis develop, the
abstracted and generalized use case discussed in this section are independent of the
speculative and data-exploratory methods we employed in the previous sections.
 Current E-Commerce systems use a variety of methods to propose alternative and
additional products to a consumer; from reviews to collaborative filtering. In Figure 8,
the left side illustrates this current practice with the right side demonstrating the
12 Schwartz, Weiss, Cansizoglu, and Choi E-Commerce Process Designer Integration Fig. 8 (Left) E-Commerce E-Commerce Data process for showing related products to a consumer based Style Analysis on their query and shopping Designer Exploration E-Commerce Website preferences. (Right) A mir- rored example utilized by the designer to find product simi- Consumer Query Feature Implementation larities of a proposed design. Related Product Matching Product Similarity Score Consumer Decision Redesign | Finish Designer in-the-loop process proposed here. In both cases, a list of possible products on the e-commerce site are run through an image-based neural network to create a graph of recommendations. On the consumer side, a query is given to the website on a particular product, which results in additional related product matches being displayed. The consumer can then choose from one of these options, after which such choice is updated at an e-commerce backend server (either as a purchase for reducing inventory, or stored for additional filtering methods). Alternatively, the consumer can perform a new query and repeat the process. For the designer, an initial exploration process begins with finding either gaps in the dataset where products are not being connected, or by finding strongly connected features between important/popular products. After implementing such desired features in a design, the rendered image (As the machine learning model is trained on both real and 3D rendered images), can be fed to the algorithm which provides the designer with a product similarity score. From these connections, designer can either redesign and iterate, or finish the design, adding the finalized design to the e-commerce website listings. We propose that this process could enable automated brand cohesion checking as well. 6 Discussion A main challenge and limitation in the final interpretation of our dataset relates to the uncertainty in the style-based analysis and image matching, as we rely on a subset of the output from the company-provided model. This has posed a few issues with extending our analysis and inferring additional aspects of product style. For one, there are many images that include the same or similar products. While we have a subset of the images labeled with SKUs within them, additional staging props or noise in this list can be meaningful in the recommendations. Similarly, while our data comes from one of the largest e-commerce companies, it is by no means a complete set of products and styles. Further implementations and additional product comparison data could provide insights to the addition of external styles.
Style Similarity as Feedback for Product Design 13

For example, we are unsure of what would happen if a style not included in the
training data is given to the model. Additionally, the subjective aspect of style can
be a hindrance to the machine learning model as culturally and over time the labels
and attributes a human perceives as a certain style may change. However, with the
increasing accuracy of machine learning models, or with more analysis options for a
designer to regenerate style groupings to provide results they more easily understand,
our proposed approach may provide a new process for integrating design and big-data
analysis for e-commerce use cases.
 Wayfair, one of the largest e-commerce websites in the home and decor space,
focuses on the huge selection, consistent experience, rich product information, fric-
tionless tools, beautiful content, clear shipping and delivery, and great service to
ensure that the experience of shopping for the home is easy and fun. As a market-
leading platform, beyond the customer’s needs, we focus on the supplier experience
by providing the ability to tell a product’s story, get to market quickly, and support
their business. The capability to find a product design using qualities found in highly
recommended products can fill a niche that may currently be underserved in the
market and would enable the customers to quickly provide demand signals towards
emerging market trends to suppliers. Reducing the overall time in the feedback loop
between suppliers and customers in the home and decor space will ensure suppliers
have more complete information on market demand and will lead to a revolution in
their planning and production process.

Acknowledgements We thank Ilkay Yildiz and Hantian Liu for their preliminary work at Wayfair
for the design and experimentation with the neural network style estimation model.

Appendix

References

 1. Ataer-Cansizoglu, E., Liu, H., Weiss, T., Mitra, A., Dholakia, D., Choi, J.W., Wulin, D.: Room
 style estimation for style-aware recommendation. In: 2019 IEEE International Conference on
 Artificial Intelligence and Virtual Reality (AIVR), pp. 267–2673. IEEE (2019)
 2. Bastian, M., Heymann, S., Jacomy, M.: Gephi: An open source software for exploring and
 manipulating networks (2009). URL http://www.aaai.org/ocs/index.php/ICWSM/09/
 paper/view/154
 3. Bell, S., Bala, K.: Learning visual similarity for product design with convolutional neural
 networks. ACM Transactions on Graphics (TOG) 34(4), 98 (2015)
 4. Bradley, R.A., Terry, M.E.: Rank analysis of incomplete block designs: I. the method of paired
 comparisons. Biometrika 39(3/4), 324–345 (1952)
 5. Bromley, J., Guyon, I., LeCun, Y., Säckinger, E., Shah, R.: Signature verification using a
 "siamese" time delay neural network. In: Advances in Neural Information Processing Systems,
 pp. 737–744 (1994)
 6. Burnap, A., Hartley, J., Pan, Y., Gonzalez, R., Papalambros, P.Y.: Balancing design freedom
 and brand recognition in the evolution of automotive brand styling. Design Science 2 (2016)
 7. Dhar, S., Ordonez, V., Berg, T.L.: High level describable attributes for predicting aesthetics
 and interestingness. pp. 1657–1664. IEEE (2011)
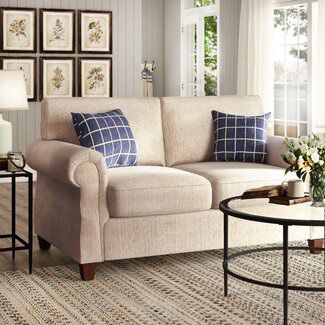
14 Schwartz, Weiss, Cansizoglu, and Choi

Fig. 9 Top-25 most frequently
recommended images out of
the 37,421 in our sample
dataset, with the overall sim-
ilarity threshold. Such image
collection is independent of
the products themselves, and
exists across all of the original
data, including low scoring
similarities.

 8. Goodfellow, I., Bengio, Y., Courville, A.: Deep learning. MIT press (2016)
 9. Gu, X., Wong, Y., Peng, P., Shou, L., Chen, G., Kankanhalli, M.S.: Understanding fashion
 trends from street photos via neighbor-constrained embedding learning. In: Proceedings of the
 25th ACM international conference on Multimedia, pp. 190–198 (2017)
10. Hagberg, A., Swart, P., S Chult, D.: Exploring network structure, dynamics, and function using
 networkx. Tech. rep., Los Alamos National Lab.(LANL), Los Alamos, NM (United States)
 (2008)
11. Hoffer, E., Ailon, N.: Deep metric learning using triplet network. In: International Workshop
 on Similarity-Based Pattern Recognition, pp. 84–92. Springer (2015)
12. Hsiao, W.L., Grauman, K.: Learning the latent “look”: Unsupervised discovery of a style-
 coherent embedding from fashion images. pp. 4213–4222. IEEE (2017)
13. Hu, R., Li, W., van Kaick, O., Huang, H., Averkiou, M., Cohen-Or, D., Zhang, H.: Co-locating
 style-defining elements on 3D shapes. ACM Trans. Graph. 36(3), 33:1–33:15 (2017)
14. Hyun, K.H., Lee, J.H., Kim, M.: The gap between design intent and user response: identifying
 typical and novel car design elements among car brands for evaluating visual significance.
 Journal of Intelligent Manufacturing 28(7), 1729–1741 (2017)
15. Jing, Y., Liu, D., Kislyuk, D., Zhai, A., Xu, J., Donahue, J., Tavel, S.: Visual search at pinterest.
 In: Proceedings of the 21th ACM SIGKDD International Conference on Knowledge Discovery
 and Data Mining, pp. 1889–1898. ACM (2015)
16. Karayev, S., Trentacoste, M., Han, H., Agarwala, A., Darrell, T., Hertzmann, A., Winnemoeller,
 H.: Recognizing image style. In: Proceedings of the British Machine Vision Conference. BMVA
 Press (2014). DOI http://dx.doi.org/10.5244/C.28.122
17. Lim, I., Gehre, A., Kobbelt, L.: Identifying style of 3d shapes using deep metric learning. In:
 Computer Graphics Forum, vol. 35, pp. 207–215. Wiley Online Library (2016)
18. Liu, T., Hertzmann, A., Li, W., Funkhouser, T.: Style compatibility for 3d furniture models.
 ACM Transactions on Graphics (TOG) 34(4), 1–9 (2015)
19. Lun, Z., Kalogerakis, E., Sheffer, A.: Elements of style: learning perceptual shape style simi-
 larity. ACM Transactions on graphics (TOG) 34(4), 84 (2015)
20. Pan, T.Y., Dai, Y.Z., Hu, M.C., Cheng, W.H.: Furniture style compatibility recommendation
 with cross-class triplet loss. Multimedia Tools and Applications 78(3), 2645–2665 (2019)
21. Sachidanandan, S., Luong, R., Joergensen, E.S.: Designer-driven add-to-cart recommenda-
 tions. In: Proceedings of the 13th ACM Conference on Recommender Systems, pp. 525–525
 (2019)
Style Similarity as Feedback for Product Design 15

22. Schifanella, R., Redi, M., Aiello, L.M.: An image is worth more than a thousand favorites:
 Surfacing the hidden beauty of flickr pictures. In: International AAAI Conference on Web and
 Social Media (2015)
23. Simo-Serra, E., Fidler, S., Moreno-Noguer, F., Urtasun, R.: Neuroaesthetics in fashion: Mod-
 eling the perception of fashionability. pp. 869–877 (2015)
24. Simo-Serra, E., Ishikawa, H.: Fashion style in 128 floats: Joint ranking and classification using
 weak data for feature extraction. In: Proceedings of the IEEE Conference on Computer Vision
 and Pattern Recognition, pp. 298–307 (2016)
25. Simonyan, K., Zisserman, A.: Very deep convolutional networks for large-scale image recog-
 nition. arXiv:1409.1556 (2014)
26. Thomas, C., Kovashka, A.: Seeing behind the camera: Identifying the authorship of a photo-
 graph. In: Proceedings of the IEEE conference on computer vision and pattern recognition,
 pp. 3494–3502 (2016)
27. Weiss, T., Litteneker, A., Duncan, N., Nakada, M., Jiang, C., Yu, L.F., Terzopoulos, D.: Fast and
 scalable position-based layout synthesis. IEEE Transactions on Visualization and Computer
 Graphics (2018)
28. Yildiz, I., Cansizoglu, E., Liu, H., Golbus, P., Tezcan, O., Choi, J.W.: Deep ranking for style-
 aware room recommendation. In: Proceedings of AAAI (2020). Student Abstract
You can also read