Analytical Report n20 - COPERNICUS DATA FOR THE OPEN DATA COMMUNITY Analytical Report 20 - European Data Portal's
←
→
Page content transcription
If your browser does not render page correctly, please read the page content below
Analytical Report n20

Analytical Report 20
COPERNICUS DATA FOR THE OPEN DATA COMMUNITY

This study has been prepared by the con.terra as part of the European Data Portal. The European Data Portal is
an initiative of the European Commission, implemented with the support of a consortium led by Capgemini
Invent, including Intrasoft International, Fraunhofer Fokus, con.terra, Sogeti, 52°North, Time.Lex, the Lisbon
Council, and the University of Southampton. The Publications Office of the European Union is responsible for
contract management of the European Data Portal.

For more information about this paper, please contact:

European Commission
Directorate General for Communications Networks, Content and Technology
Unit G.1 Data Policy and Innovation
Daniele Rizzi – Policy Officer
Email: daniele.rizzi@ec.europa.eu

European Data Portal
Gianfranco Cecconi, European Data Portal Lead
Email: gianfranco.cecconi@capgemini.com

Written by:
Matthias Seuter
Email: m.seuter @conterra.de
Dr. Thore Fechner
Email: t.fechner@conterra.de
Antje Kügeler
Email: a.kuegeler@conterra.de

Reviewed by:
Eline N. Lincklaen Arriëns
Email: Eline.lincklaen.arriens@capgemini.com

Last update: 11.03.2021
www: https://europeandataportal.eu/
email: info@europeandataportal.eu

DISCLAIMER
By the European Commission, Directorate-General of Communications Networks, Content and Technology. The
information and views set out in this publication are those of the author(s) and do not necessarily reflect the
official opinion of the Commission. The Commission does not guarantee the accuracy of the data included in this
study. Neither the Commission nor any person acting on the Commission’s behalf may be held responsible for
the use, which may be made of the information contained therein.

Luxembourg: Publications Office of the European Union, 2021
© European Union, 2021

OA-BF-21-002-EN-N            ISBN: 978-92-78-42414-5            ISSN:2600-0601            doi: 10.2830/309367

The reuse policy of European Commission documents is implemented by the Commission Decision 2011/833/EU
of 12 December 2011 on the reuse of Commission documents (OJ L 330, 14.12.2011, p. 39). Except otherwise
noted, the reuse of this document is authorised under a Creative Commons Attribution 4.0 International (CC-BY
4.0) licence (https://creativecommons.org/licences/by/4.0/). This means that reuse is allowed provided
appropriate credit is given and any changes are indicated.

                                                                                                             2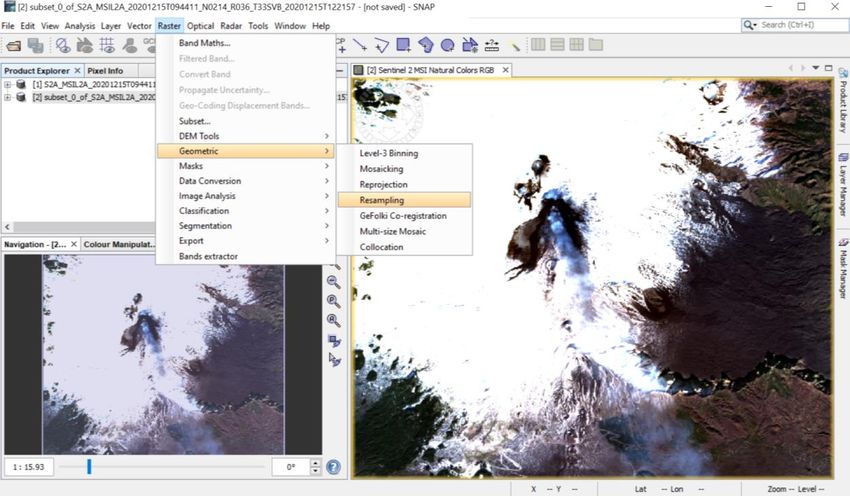
Table of Contents
Executive Summary ................................................................................................................................................. 4
Introduction ............................................................................................................................................................ 5
    Copernicus Data .................................................................................................................................................. 5
    Aim of this report................................................................................................................................................ 6
    Approach ............................................................................................................................................................ 6
The Copernicus Programme .................................................................................................................................... 6
Exploring Copernicus Data Use Cases ..................................................................................................................... 9
    Use Cases ............................................................................................................................................................ 9
    Understanding the data .................................................................................................................................... 12
Finding and Using Copernicus Data....................................................................................................................... 14
    Downloading Sentinel-2 Data Products ............................................................................................................ 14
    Processing with SNAP ....................................................................................................................................... 18
    Automatic Downloading and Processing .......................................................................................................... 25
Conclusion and Recommendations ....................................................................................................................... 26
    The usefulness of Copernicus data ................................................................................................................... 26
    The need for in situ data ................................................................................................................................... 26
    Finding Copernicus Data on the European Data Portal .................................................................................... 26
References ............................................................................................................................................................ 27
Appendix A: Data Access Platforms ...................................................................................................................... 28
Appendix B: Processing workflow for use with SNAP/GDP ................................................................................... 29

                                                                                                                                                                          3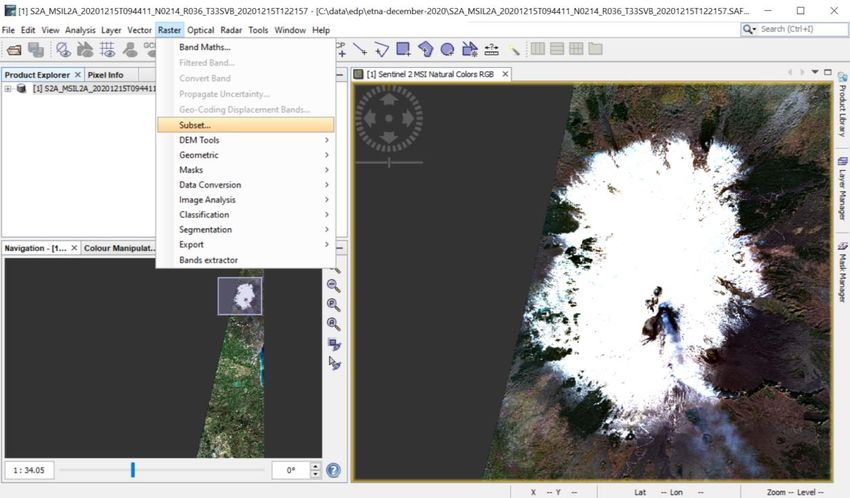
Executive Summary
The Copernicus programme generates valuable data from satellites and in situ sensors – and makes vast amounts
of earth observation data available, in line with the European Data Portal’s goal to increase the accessibility and
value of open data. This analytical report aims to help open data enthusiasts with leveraging the potential of
Copernicus data for earth observation applications. While earth observation professionals may have the required
knowledge and tools readily available, open data users are likely to face three basic questions:

         (1) What can I do with Copernicus data?

         (2) How can I access the data?

         (3) What tools do I need for using the data?

This report will address these questions using information found on the European Data Portal, specialised
catalogues, and by examining practical examples of Copernicus data applications. It first reviews some of the
many possible uses of Copernicus Data such as (1) observing plastic pollution of the oceans, land change through
mining activities, volcanic activities, ice loss, creation of artificial islands, and various impacts on nature, e.g.,
deforestation, wildfires, storms, or pests. It then further covers one example application in-depth, demonstrating
how an (2) application can download data from the Copernicus Open Access Hub, and (3) process the
downloaded data using specialised tools. Thus, our desk research demonstrates the practical use of the different
product types provided by the Copernicus missions and highlights how the open data community can access and
process Copernicus data for building applications that allow for earth observation insights.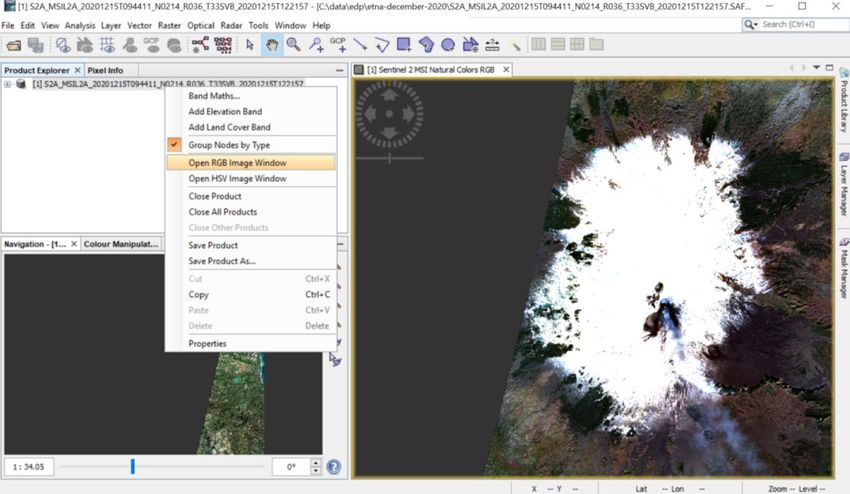
Introduction
Copernicus Data
Copernicus is the European Union’s earth observation programme, committed to being Europe’s eyes on Earth.
The European Commission is heading this initiative in partnership with organisations such as the European Space
Agency (ESA). The ESA1 states:

“Copernicus is the most ambitious Earth observation programme to date. It will provide accurate, timely and
easily accessible information to improve the management of the environment, understand and mitigate the
effects of climate change and ensure civil security. […] Copernicus will help shape the future of our planet for the
benefit of all.”

                   F IGURE 1: W HAT IS THE C OPERNICUS PROGRAMME ? (SCREENSHOT FROM VIDEO 2)

The Copernicus missions deliver vast amounts of global data (12 terabytes per day3) from satellites and other
measurement systems, as well as services based on these data sources 4 . Most of these data products and
information services are freely and openly accessible to its users, in line with the European Data Portal’s goal to
increase the accessibility and value of open data and promoting its use.

Copernicus data is relevant to many users because of the data’s high temporal resolution and the range of
possible applications. Each programme’s satellite mission has a different focus5, e.g., Sentinel-1 focuses more on
emergency response, Sentinel-2 on land monitoring, Sentinel-3 and 6 on monitoring the oceans and waters, and
Sentinel-4 and 5 on the atmosphere. Another benefit of Copernicus data is its up-to-dateness. For example, the
Sentinel-2 satellites systematically revisit most land areas of the world every five days6.

Open data users can apply data provided by the Copernicus missions to observe, detect, or monitor a wide range
of phenomena such as plastic pollution of the oceans, land change through mining activities, volcano eruptions,

1
  ESA – Overview: https://www.esa.int/Applications/Observing_the_Earth/Copernicus/Overview3
2
  What is the Copernicus Programme? – YouTube: https://www.youtube.com/watch?v=MGJss4lDaBo
3
  Accessing data – the where and how: https://www.copernicus.eu/en/accessing-data-where-and-how
4
  About Copernicus: https://www.copernicus.eu/en/about-copernicus
5
  Guido Leverini (ESA) about the Sentinels in the overview video1.
6
  User Guides - Sentinel-2 MSI - Revisit and Coverage - Sentinel (esa.int):
https://sentinel.esa.int/web/sentinel/user-guides/sentinel-2-msi/revisit-coverage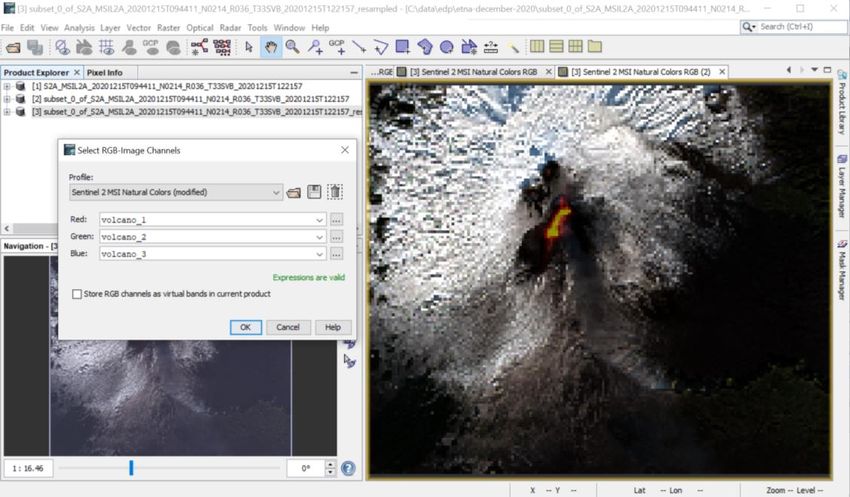
marine and land ice loss, the appearance of (artificial) islands, as well as impacts on nature from pests, storms,
deforestation, or wildfires.

Copernicus data recently becomes an increasingly popular source for showing the bigger picture in the media.
News and blog posts use Copernicus data to report on economic activity, climate change, or the COVID-19
pandemic.

Responses to the European Data Portal Thinkathon 7 during the INSPIRE 2018 Conference showed that while
there is high interest in Copernicus data, there seems to be some confusion on what data is available, as well as
how the data can be discovered and used.

Aim of this report
This analytical report aims to help open data enthusiasts leverage the potential of Copernicus data. In contrast
to Earth observation professionals who have the required knowledge and tools readily available, open data users
are likely to face the following basic questions:

(1)     What can I do with Copernicus data?

(2)     How can I access the data?

(3)     What tools do I need to use the data?

This report will address these questions using information found on specialised catalogues, and by examining
practical examples of Copernicus data applications.

Approach
To help users with finding answers to their basic questions, we conducted a desk research as described in the
following paragraph. The results of this research first give a broad introduction to use cases and then delve
deeper into one of these use cases.

The first part covers a range of potential use cases to answer the question of what can be done with Copernicus
data on a general level. We drew the relation between the various use cases described in the literature and
addressed in real-life applications and match them with the Copernicus programme’s thematic areas, relevant
instruments, and product types available.

The second part of the research focuses on one particular use case in depth. We walk through the whole process
of finding suitable Copernicus data, accessing it, and processing the data for use in a real-life application. This
part demonstrates how an application can periodically download data from the Copernicus Open Access Hub,
process the data using specialised tools, and focus on a particular area of interest.

Thus, this analytical report highlights how the open data community can access and process Copernicus data for
building applications that allow for earth observation insights.

The Copernicus Programme
The introduction so far touched on some background aspects of the topic of Copernicus data. The following
provides a more in-depth background, covering background information that can be of interest to users.

The European Commission manages the programme, while its implementation involves partnerships with the
Member States, the European Space Agency (ESA), the European Organisation for the Exploitation of
Meteorological Satellites (EUMETSAT), the European Centre for Medium-Range Weather Forecasts (ECMWF), EU
Agencies, and Mercator Océan2. The website further explains Copernicus’ goal to benefit all European citizens
and that all data and information services are free and openly accessible. Therefore, the name Copernicus is an

7
 The European Data Portal Thinkathon 2018: https://www.europeandataportal.eu/en/highlights/european-
data-portal-thinkathon-during-inspire-2018-conference

                                                                                                                 6
homage to Nicolaus Copernicus, who made pioneering contributions to astronomy and geographical sciences8,2
from which humanity still greatly benefits.

The Copernicus programme collects data from several dedicated and contributing satellite missions as well as
from in situ systems on the ground. The Sentinels are major components of the programme. They are Satellite
missions, each consisting of a family of dedicated satellites, or instruments aboard other satellites, to serve
different aspects of earth observation2, 9, 10, 11.

    •   The Sentinel-1 family is dedicated to covering weather and daylight independent monitoring of land
        and ocean using Synthetic Aperture Radar (SAR) instruments.
    •   The dedicated Sentinel-2 satellites focus on optical land monitoring such as imagery of vegetation, soil
        and water cover, inland waterways, and coastal areas. Their Multi Spectral Instrument (MSI) senses light
        reflected from the earth in various wavelengths, including visible red, green, blue, and infrared.
    •   Sentinel-3 uses optical, radar and altimetry instruments for marine and land services, and is dedicated
        to measuring aspects such as sea-surface topography, sea- and land-surface temperature, ocean colour,
        and land colour with high-end accuracy and reliability.
    •   The Sentinel-4 mission (starting 2023) will provide atmospheric composition monitoring. It will monitor
        air quality over Europe and will orbit earth aboard EUMETSAT's Meteosat Third Generation satellites12.
        It will provide data at high spatial resolution and high revisit frequency (hourly).
    •   Sentinel-5 (starting 2021) will also provide atmospheric composition monitoring, delivering data on
        global air quality and climate-related trace gases and aerosols in the atmosphere. The Sentinel-5
        instrument will orbit earth aboard EUMETSAT's Metop - Second Generation satellites13. While Sentinel-
        5 is planned, a precursor mission named Sentinel-5P is already in orbit and provides data until the start
        of the Sentinel-5 instrument.
    •   The Sentinel-6 provides highly accurate altimetry of global sea-surface height to support, for example,
        oceanography and climate studies.
    •   The in situ component also plays a key role for data products provided by the Sentinels and the
        Copernicus programme; e.g., in situ sensors are needed for calibration and validation of the satellite
        data to provide robust information. Examples of in situ resources include weather balloons, sensors
        aboard airplanes or ships, as well as topographic maps, to add information to the satellite data that is
        not available from space 14, 15.

For further readings on the Copernicus’ space and ground components users can refer to the Copernicus in detail
page on the Copernicus website 16 and the Copernicus brochure 17.

The produced data can be accessed through access points provided by ESA and EUMETSAT, depending on the
mission and type of data, as well as through the Data and Information Access Services (DIAS) platforms that
provide (partial) mirrors of the data3, 18,19. The DIAS nodes also commercially offer advanced computing services

8
  E.g., De revolutionibus orbium coelestium (Copernicus, 1543)
9
  Infrastructure Overview | Copernicus:
https://www.copernicus.eu/en/about-copernicus/infrastructure-overview
10
   Discover our satellites | Copernicus:
 https://www.copernicus.eu/en/about-copernicus/infrastructure/discover-our-satellites
11
   Sentinel series | EUMETSAT: https://www.eumetsat.int/our-satellites/sentinel-series
12
   Meteosat Third Generation (MTG) | EUMETSAT: https://www.eumetsat.int/meteosat-third-generation
13
   Metop - Second Generation | EUMETSAT: https://www.eumetsat.int/metop-sg
14
   Copernicus In Situ Component: https://www.eumetsat.int/metop-sg
15
   In situ component | Copernicus:
https://www.copernicus.eu/en/about-copernicus/infrastructure/situ-component
16
   Copernicus in detail | Copernicus: https://www.copernicus.eu/en/about-copernicus/copernicus-detail:
17
   Copernicus Brochure:
https://www.copernicus.eu/sites/default/files/Brochure_Copernicus_2019%20updated_0.pdf
18
   Copernicus Open Access Hub: https://scihub.copernicus.eu/
19
   Data and Information Access Services: https://www.copernicus.eu/en/access-data/dias

                                                                                                               7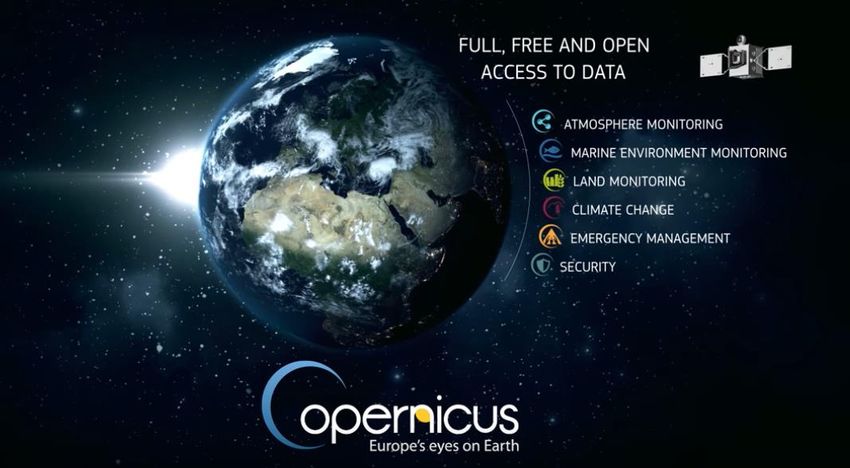
in addition to access to their data mirrors. Furthermore, the Copernicus Services provide higher level products
for each thematic area of the programme20; i.e., for Atmosphere, Marine, Climate, Emergency Management,
Land, and Security21. These services provide products derived from the original satellite data. For example, the
Global Land Service provides products such as land cover or leaf area index22. A service catalogue is available on
the Copernicus website23. Products offered by the Copernicus Services are often very specific to their domain
but easier to use than the uninterpreted satellite images.

This continuously growing pool of data is open to the public and can be downloaded and used free of charge 24.
All data products and services provided by the Copernicus programme are publicly available (only the security
service is not public). However, prior to downloading, the Copernicus license must be accepted, and one needs
to be registered with the platform. Copernicus states that most of the data and services are made freely available
and accessible. While Copernicus data is generally open, the European Commission’s strategy also includes
distributing the data via commercial platforms to support establishing a data ecosystem – i.e., data access via
the DIAS nodes. These access nodes provide download mirrors but can also offer paid services for processing the
data in the cloud using their infrastructure, tools, and computing power 19. In contrast, the Copernicus Open
Access Hub maintained by ESA does not offer computing resources, but free and open access to Copernicus
data25. Despite this clear commitment to free and open access, e.g., for Sentinel-2 data, users need to register
and login with the Copernicus Open Access Hub. This is because ESA needs to track user data for reporting, e.g.,
to the European Union, and the public26. Yearly reports, such as the report for 201927, include figures such as
downloads per country and active users per domain. For this exhaustive reporting, it is necessary to track in
which domains the data is used and should not be considered a limitation of access. The following focuses on
open data use cases and will not cover paid services.

There is an ongoing integration of Copernicus Data catalogues with the European Data Portal. Making Copernicus
data or services discoverable via the European Data Portal requires harvesting metadata. A metadata catalogue
that is already being harvested by the European Data Portal is the EUMETSAT Product Navigator 28 (see Figure 2).
The European Data Portal currently contains more than 600 individual collections from the EUMETSAT Product
Navigator, which link to the EUMETSAT distribution systems, e.g., the ordering application where products can
be selected for ordering outside of the European Data Portal. While users can find already find these datasets,
the process of making Copernicus Data discoverable via the European Data Portal raises two challenges related
to data representation and availability of the required metadata: Firstly, data must be represented in the
European Data Portal in a meaningful way so that the users can interact with the information intuitively.
Secondly, metadata must be readily available to be harvested to serve the required standards and meaningful
representation. These challenges will be highlighted in the discussion section because they relate to the users'
challenge of discovering relevant earth observation data products.

20
   Thematic Areas - Sentinel (esa.int): https://sentinel.esa.int/web/sentinel/thematic-areas
21
   Copernicus Services | Copernicus: https://www.copernicus.eu/en/copernicus-services
22
   Copernicus Global Land Service: https://land.copernicus.eu/global/products/
23
   Copernicus services catalogue | Copernicus:
 https://www.copernicus.eu/en/accessing-data-where-and-how/copernicus-services-catalogue
24
   COMMISSION DELEGATED REGULATION (EU) No 1159/2013 of 12 July 2013:
http://data.europa.eu/eli/reg_del/2013/1159/oj
25
   Legal notice on the use of Copernicus Sentinel Data and Service Information
https://sentinels.copernicus.eu/documents/247904/690755/Sentinel_Data_Legal_Notice
26
   Open Access Hub (copernicus.eu) – Terms and Conditions:
https://scihub.copernicus.eu/twiki/do/view/SciHubWebPortal/TermsConditions
27
   Open Access Hub (copernicus.eu) – Annual Reports Archive: https://scihub.copernicus.eu/reportsandstats/
28
   EUMETSAT Product Navigator: https://navigator.eumetsat.int/start

                                                                                                                8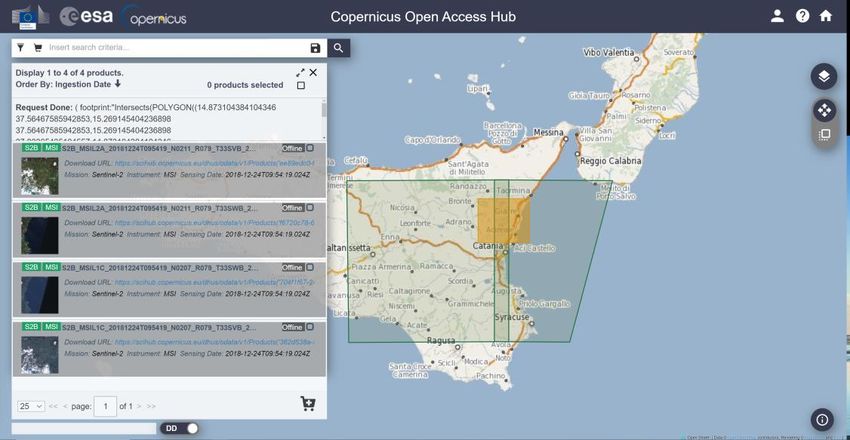
F IGURE 2: METADATA FROM THE EUMETSAT PRODUCT NAVIGATOR (SCREENSHOT)

Exploring Copernicus Data Use Cases
This chapter explores potential use cases and matches them with the Copernicus’ thematic areas, missions, and
instruments. The results of our desk research are presented in Table 1, and Table 2.

Use Cases
Copernicus services address six thematic areas: land, marine, atmosphere, climate change, emergency
management, and security. The Copernicus Services section21 on the Copernicus website (shown in Figure 3) links
to each thematic area with a service devoted to it and a subdomain on the Copernicus website.

Other sources of inspiration for applications of Copernicus data could include a search on the internet to reveal
satellite data applications29. The ESA website highlights applications30 and success stories31. For example, the
Emergency Management news on the Emergency Management section of their website 32 . The Copernicus
programme’s website, too, presents opportunities33, or image of the day posts34. Users can describe their Use
Case and submit it to be published on the Copernicus programme’s website35.

29
   Examples of satellite data applications found on the internet:
https://gijn.org/2021/01/05/how-to-use-satellite-imagery-in-your-next-investigation/
https://www.geospatialworld.net/blogs/satellite-images-capture-major-events-of-2020/
30
   ESA – Applications/Observing_the_Earth/Copernicus/Overview3:
https://www.esa.int/Applications/Observing_the_Earth/Copernicus/Overview3
31
   Sentinel Success Stories - News - Sentinel (esa.int): https://sentinel.esa.int/web/sentinel/news/success-stories
32
   Thematic Areas - Emergency Management - Sentinel (esa.int):
https://sentinel.esa.int/web/sentinel/thematic-areas/emergency-management
33
   Opportunities | Copernicus: https://www.copernicus.eu/en/opportunities
34
   Image of the day | Copernicus: https://www.copernicus.eu/en/media/image-day
35
   Use cases | Copernicus: https://www.copernicus.eu/en/use-cases

                                                                                                                 9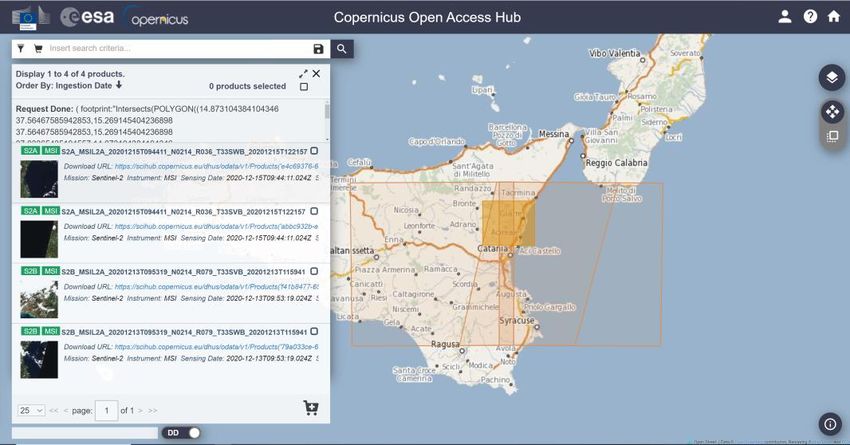
F IGURE 3: C OPERNICUS SERVICES SECTION ON THE PROGRAMME ’S WEBSITE (SCREENSHOT )

Table 1 lists use cases we selected from these and other sources to address some of the many potential
application areas. Listed are use cases from different sources to allow for a broader impression. The table
matches the selected use cases with the Copernicus thematic areas, and with the tools reported.

                           T ABLE 1: USE CASES MATCHED WITH USED DATA PRODUCTS AND TOOLS
 Use Case                                                 Copernicus       Instruments, Data Products, and
                                                          Thematic Areas   Tools
 Land cover classification:                               Land             Copernicus Land Monitoring Service
 https://land.copernicus.eu/global/products/lc

 UV index forecasting:                                    Atmosphere       Copernicus Atmosphere Monitoring
 https://atmosphere.copernicus.eu/charts/cams/uvindex-                     Service
 forecasts

 Sea ice berg concentration and individual                Marine           Copernicus Marine Environment
 icebergs:                                                                 Monitoring Service
 https://resources.marine.copernicus.eu/?option=com_cs
 w&view=details&product_id=SEAICE_ARC_SEAICE_L4_N
 RT_OBSERVATIONS_011_007

 Monthly climate bulletin explorer (mapping               Climate Change   Copernicus Climate Change Service
 ground temperature anomalies):
 https://cds.climate.copernicus.eu/cdsapp#!/software/ap
 p-c3s-monthly-climate-bulletin-explorer

                                                                                                                10
Mapping disasters or risks; Emergency Copernicus Emergency Management
Copernicus Emergency Management Service Service
– Mapping
https://emergency.copernicus.eu/mapping/copernicus-
emergency-management-service
Coral bleaching of the Great Barrier Reef: Marine Sentinel-2 MSI
http://www.esa.int/Applications/Observing_the_Earth/C
opernicus/Sentinel-2/Sentinel-
2_captures_coral_bleaching_of_Great_Barrier_Reef
Rapid Action on Coronavirus and EO (RACE): Marine, Sentinel-2 MSI, in situ data from other
https://race.esa.int/ Atmosphere, sources
Land, Climate
Change,
Emergency
Prozessierung von Sentinel-5P-Daten in der Atmosphere Sentinel-5P TROPOMI, S5P_L2_NO2__,
ArcGIS-Plattform: R, ArcGIS Pro
https://storymaps.arcgis.com/stories/ffb2678bf09f466b
9744d30c5fb902a2
SenSituMon (flood mapping): Emergency, Land Sentinel-1 SAR, and in situ data from
https://www.sensitumon.eu/ other sources
Inspecting active volcanoes: Emergency, Land, Sentinel-1 SAR, Sentinel-2 MSI,
https://medium.com/sentinel-hub/active-volcanoes-as- Atmosphere Sentinel-5P, EO Browser/Volcano
seen-from-space-9d1de0133733 Theme, band combination
Corradino, C.; Ganci, G.; Cappello, A.; Bilotta, Emergency, Land Sentinel-2 MSI, machine learning, in
G.; Hérault, A.; Del Negro, C. Mapping Recent situ / ground-based measurements for
Lava Flows at Mount Etna Using Multispectral validation
Sentinel-2 Images and Machine Learning
Techniques. Remote Sens. 2019, 11, 1916.
https://www.mdpi.com/2072-4292/11/16/1916
Biermann, L., Clewley, D., Martinez-Vicente, Marine Sentinel-2 MSI, machine learning,
V. et al. Finding Plastic Patches in Coastal custom in situ data for validation
Waters using Optical Satellite Data. Sci
Rep 10, 5364 (2020).
https://www.nature.com/articles/s41598-020-62298-z
Ban, Y., Zhang, P., Nascetti, A. et al. Near Emergency (also Sentinel-1 SAR, machine learning, in
Real-Time Wildfire Progression Monitoring related to Land, situ data from on-site inspection with
with Sentinel-1 SAR Time Series and Deep Atmosphere, drones
Learning. Sci Rep 10, 1322 (2020). Climate Change)
https://www.nature.com/articles/s41598-019-56967-x
One of the use cases from Table 1 will be covered as the example in chapter Finding and Using Copernicus Data:
Copernicus Emergency Management Service – Mapping of the Copernicus Emergency Management Service which
deals with mapping events related to (possible) disasters such as the latest event Etna Volcano eruption in Sicily,
Italy 36,37. The instruments listed in Table 1 are usually specific to a few thematic areas. However, this does not
mean that usage of data from certain instruments would be limited to the originally intended use cases or
thematic areas. For example, Biermann et al. used Sentinel-2 data and machine learning techniques for detecting
36
An article about the volcanic eruption mapping event in the EMS:
https://emergency.copernicus.eu/mapping/ems/copernicus-ems-monitors-volcanic-eruption-and-earthquakes-
italy
37
The mapped EMS event for the Etna eruption – Event Time (UTC): 2018-12-24 06:00:
https://emergency.copernicus.eu/mapping/list-of-components/EMSR336
11plastics in coastal waters. The authors used Sentinel-2 data, which is originally focused on land observation.
However, the data proved useful for their marine application too.
Many applications rely on or use additional in situ data, e.g., indirectly when data products are improved based
on in situ data or directly when incorporating in situ data. For example, Biermann et al. and Ban et al. used ground
truth data in their research. Another example is the SenSituMon project, which aims to harness the potential of
Copernicus data (i.e., high frequency and large area coverage), in addition to using in situ data such as from water
level sensors, which are fixed to one location. This data is used to gather information on flooding events for
applications for the insurance industry and agriculture.
Currently impacts of the COVID-19 pandemic are often shown in the news or in blog posts using data from the
Sentinel-2 mission such as footage of parking cruise ships38 or aeroplanes39. The Rapid Action on Coronavirus and
EO (RACE) application makes such information available (see Table 1). Figure 4 shows a screenshot from RACE
depicting the impact of the pandemic on the airport Fraport in Germany. The application shows the airport on
January 20, 2020, when it operated normally, and on April 4, 2020, during the lockdown. The automatic detection
of aeroplanes by the application clearly shows (yellow bounding boxes in the image) the unused, parking
aeroplanes on the north western runway. The application is described in detail by Sara Aparício on
medium.com40.
F IGURE 4: SENTINEL -2 SCENES OF FRAPORT ’S NORTH WESTERN RUNWAY , BEFORE (LEFT) AND DURING LOCKDOWN (RIGHT )
– SCREENSHOTS OF USING THE RACE DASHBOARD .
Understanding the data
This report so far provides an initial overview, ideas, and insights into applications of Copernicus data from
industry, education, and research domains. It points out some important details for applications, including
methods applications can use and instruments that example applications can get suitable data from.
38
Locked down afloat: why dozens of cruise ships ended up stranded in Manila Bay | The Guardian:
https://www.theguardian.com/environment/2020/jun/02/locked-down-afloat-why-dozens-of-cruise-ships-
ended-up-stranded-in-manila-bay
39
Parking in a Pandemic: Where Are All the Airplanes and Cruise Ships During COVID-19? (scitechdaily.com):
https://scitechdaily.com/parking-in-a-pandemic-where-are-all-the-airplanes-and-cruise-ships-during-covid-19/
40
The pandemic disruption of air traffic — as seen from Space | by Sara Aparício | Euro Data Cube | Medium:
https://medium.com/euro-data-cube/the-pandemic-disruption-of-air-traffic-as-seen-from-space-
6dad64201b9a
12To decide which data is suitable for a specific use case, some additional knowledge is needed on data products
offered by the different missions and what data the individual instruments will deliver. This part of the report is
meant to provide an overview and a starting point for gaining further information.
The full background and specifications about the missions, the instruments used to gather the data, and data
products are provided in the respective user guides (see links in Table 2). To provide an overview and entry point,
Table 2 matches the different instruments and thematic areas as they are listed in the respective user guides.
The table also links to the respective user and technical guides for reference. This structured overview can help
users to find out how their envisioned application might relate to the Copernicus missions and where to find
more information. The user guide can then help to get started with using a data product, and the technical guide
provides instrument specification. The next chapter covers one of these instruments by showing how to
download and use Sentinel-2 data for a particular use case.
T ABLE 2: OVERVIEW OF INSTRUMENTS AND THEMATIC AREAS COMPILED FROM THE INDIVIDUAL USER GUIDES LISTED
Instrument Applications and links to the guides
Sentinel-1 Maritime Monitoring,
SAR Land Monitoring,
Emergency Management
User Guides - Sentinel-1 SAR - Applications - Sentinel Online - Sentinel (esa.int)
Sentinel-1 SAR - Technical Guide - Sentinel Online - Sentinel (esa.int)
Sentinel-2 Land Monitoring,
MSI Emergency Management,
Security
User Guides - Sentinel-2 MSI - Applications - Sentinel Online - Sentinel (esa.int)
Sentinel-2 MSI - Technical Guide - Sentinel Online - Sentinel (esa.int)
Sentinel-3 Maritime Monitoring,
OLCI Land Monitoring,
Atmospheric Monitoring,
Climate Change Monitoring
User Guides - Sentinel-3 OLCI - Applications - Sentinel Online - Sentinel (esa.int)
Sentinel-3 OLCI - Technical Guide - Sentinel Online - Sentinel (esa.int)
Sentinel-3 Maritime Monitoring,
SLSTR Land Monitoring,
Atmospheric Monitoring,
Climate Change Monitoring
User Guides - Sentinel-3 SLSTR - Applications - Sentinel Online - Sentinel (esa.int)
Sentinel-3 SLSTR - Technical Guide - Sentinel Online - Sentinel (esa.int)
Sentinel-3 Land Monitoring,
Synergy Security,
Climate Change Monitoring
User Guides - Sentinel-3 Synergy - Applications - Sentinel Online - Sentinel
(esa.int)Sentinel-3 Synergy - Technical Guide - Sentinel Online - Sentinel (esa.int)
Sentinel-3 Oceanography,
Altimetry Coastal Zones,
Ice and Sea-Ice,
Inland Waters and Land,
Climate,
Geodesy and Geophysics
User Guides - Sentinel-3 Altimetry - Applications - Sentinel Online - Sentinel (esa.int)
Sentinel-3 Altimetry - Technical Guide - Sentinel Online - Sentinel (esa.int)
13Sentinel-5P Air Quality, Stratospheric Ozone Layer and Climate Change Monitoring, and Forecasting
TROPOMI Applications – Sentinel-5P TROPOMI User Guide – Sentinel Online - Sentinel (esa.int)
Products and Algorithms - Sentinel-5P Technical Guide - Sentinel Online - Sentinel (esa.int)
The next chapter will cover how to download the appropriate Copernicus data and build applications with it. The
entry point for this is the Copernicus website, which provides an overview of how to access the data, including a
brief description of the conventional data access points and links 41. Using the information from Table 2 users can
determine which instrument is likely to provide the data needed. In our example this is Sentinel-2 MSI. Users will
need to look for a suitable access point for a particular product type of interest. Please refer to Appendix A: Data
Access Platforms, for a list of access points. For our example, Sentinel-2 data products can be downloaded from
the Copernicus Open Access Hub: https://scihub.copernicus.eu/, which is based on the Data Hub Software
(DHuS) 42 software. The access point provides a web-based data finder and well-written documentation43. While
its web frontend allows users to search for relevant scenes and download them manually, programmers can also
use the API for automated searching and downloading.
Finding and Using Copernicus Data
After having covered a range of potential use cases to answer the question of what can be done with Copernicus
data on a general level, this chapter focuses on one particular use case in depth: Mapping of lava flow from the
Etna volcano using data from the Copernicus Emergency Management Service.
This use case was chosen because of the obvious need for monitoring the impact of volcanic activities on nature
and urban areas. This chapter focuses on the Etna volcano, and events in December 2020 and December 2018
for a “hands on” example on how to work with Copernicus data. It first demonstrates how to search and
download data for this area of interest. It will feature downloading and using Sentinel-2 products from the
Copernicus Open Access Hub. It then demonstrates the use of the ESA Sentinel Application Platform (SNAP)44
tool to view lava flow. At the end of this chapter some insights into automating the workflow with the Open
Access Hub API and the SNAP graph tool are provided.
Downloading Sentinel-2 Data Products
The Copernicus Open Access Hub is used to download Sentinel-2 products which can be processed and used as
true colour photographs from space. Figure 5 shows the necessary steps for searching and downloading Sentinel-
2 scenes from the Copernicus Open Access Hub. In the first step, the user navigates to the area of interest, which
they can draw on the map for the search. Filter options are shown in the second step, including the sensing
period and the checkbox for Sentinel-2 data products. Other parameters and the product names in the results
will become apparent in the following. The search result appears as a list of matching scenes and a preview of
the results’ spatial extents on the map. After the search, the third step is to select and download the relevant
scenes.
Figure 6 illustrates the necessary steps for downloading older data products. This process is needed because the
ESA maintains data storage for data products that are older than 12 months in an offline fashion called long term
archive (LTA)45. As shown in the first step, such archived data products are presented on a grey background in
the search results. Users can trigger retrieval from the LTA for temporary online access via the normal download
link. Scenes that were retrieved from the LTA change their status and can be downloaded. As seen in the figure,
41
Conventional Data Access Hubs | Copernicus: https://www.copernicus.eu/en/accessing-data-where-and-
how/conventional-data-access-hubs
42
DHuS Open Source Portal (sentineldatahub.github.io): http://sentineldatahub.github.io/DataHubSystem/
43
Open Access Hub (copernicus.eu): https://scihub.copernicus.eu/userguide/WebHome
44
The Sentinel Application Platform (SNAP): https://step.esa.int/main/toolboxes/snap/
45
Open Access Hub (copernicus.eu) – LTA: https://scihub.copernicus.eu/userguide/LongTermArchive
14in the next steps, the shopping cart widget of the data hub web interface is particularly helpful for tracking the
requested products because the retrieval can take many hours.
F IGURE 5: SEARCHING AND DOWNLOADING SENTINEL -2 SCENES FROM THE C OPERNICUS OPEN ACCESS H UB –
SCREENSHOTS FROM SCIHUB .COPERNICUS .EU / DHUS /
15F IGURE 6: D OWNLOADING SCENES FROM THE LONG TERM ARCHIVE ( LTA ) – SCREENSHOTS FROM
SCIHUB .COPERNICUS .EU / DHUS /
16Users will need to understand two things about the search results: Firstly, the tiles of the scenes are overlapping
as one can see after the search. This overlap can be useful if a small area of interest lies directly on the border of
two tiles as one does not need to download both and stitch them together. Secondly, images for a tile can have
large black areas such as in Figure 9; or in the preview of the found data products in Figure 5, and Figure 6. This
missing coverage of a tile can happen because the instrument's field of view is limited, and the satellites' orbit is
not aligned with the fixed tile grid. Therefore, tiles can be either completely covered or only partly during a revisit.
To understand the search parameters and to prepare for working with the data products, the user needs to be
familiar with the missions’ instrument and its data formats. The following section will cover an introduction to
the Sentinel-2 mission, to gain an understanding of the data needed to be able to work with it. Further
information about the mission can be found in the Sentinel-2 handbook46. Other data products and different
Copernicus missions are each described in the corresponding mission section and user guide.
The Sentinel-2 mission features two satellites, S2A and S2B. The satellites’ Multi Spectral Instrument (MSI) covers
13 different ranges of the electromagnetic spectrum called bands47. These include wavelengths centred about
492nm, 559nm, and 664nm in the bands 2, 3, and 4 respectively, which correspond to the blue, green, and red
visible components of the light. While these bands have a spatial resolution of 10m, other bands have lower
resolutions such as the narrow near infrared ranged band 8a, which has a spatial resolution of 20m.
Sentinel-2 data products are images of fixed 100km x 100km granules, which are also called tiles. These ortho-
images are in UTM/WGS84 projection and the Sentinel-2 tiling grid of the earth is available for download as a
.kml file46. Products are either Level 1 (L1), Top of Atmosphere (TOA), or Level 2 (L2), Bottom of Atmosphere
(BOA) reflectance46 – meaning that users can either download L2 data products, which are already processed by
the Copernicus ground segment, including correction of atmospheric distortions; or L1 data products, which may
be available sooner after acquisition by the satellite. Alternatively, users can also download L1 data products and
build the L2 products locally using the SNAP tool.
F IGURE 7: GRAPHICAL REPRESENTATION OF SENTINEL-2 C ORE PRODUCTS (S OURCE : ESA ’S SENTINEL -2 DATA PRODUCT
DESCRIPTION 46; E UROPEAN SPACE AGENCY - ESA)
The data format of a particular product type is described by ESA in the corresponding user guide48. Downloaded
Sentinel-2 scenes are contained in a .zip-file, which contains a .safe folder49, and its name reflects on the above
described details. For example, the scene downloaded and processed below is named
S2A_MSIL2A_20210114T094341_N0214_R036_T33SVB_20210114T123758.SAFE, and reflects on the satellite
(S2A), instrument (MSI), processing level (L2A), data take time (20210114T094341, processing baseline (N0214),
46
Sentinel-2 - Data Products - Sentinel Handbook - Sentinel (esa.int):
https://sentinel.esa.int/web/sentinel/missions/sentinel-2/data-products
47
MSI Instrument – Sentinel-2 MSI Technical Guide – Sentinel Online - Sentinel (esa.int):
https://sentinel.esa.int/web/sentinel/technical-guides/sentinel-2-msi/msi-instrument
48
User Guides - Sentinel (esa.int): https://sentinel.esa.int/web/sentinel/user-guides
49
Sentinel-2 MSI - Naming Convention:
https://sentinel.esa.int/web/sentinel/user-guides/sentinel-2-msi/naming-convention
17orbit (R036), tile (T33SVB), and processing time (20210114T123758). The contents of a Sentinel-2 product’s .safe
folder are shown in Figure 8.
The product metadata file is of particular interest as it is needed for working with the scene using the SNAP tool.
Users can open this file in SNAP to start working with it. The IMG folder in a granule folder contains the actual
data, a .JPEG2000 (pixel or raster-based) file for each band.
F IGURE 8: SENTINEL -2 PRODUCT FILES (S OURCE : ESA USER GUIDE 50; E UROPEAN SPACE AGENCY - ESA)
Processing with SNAP
To get a first view of a Sentinel-2 scene, users can view it as an image from space by assigning the red, green,
and blue (true image) bands to the three colour channels their viewer software. Options for tools that can be
used for this procedure include commercial software such as ArcGIS Pro 51, free GIS tools such as QGIS52, open-
source processing tools such as SNAP, or programming libraries such as GDAL 53 (e.g., via the python library
rasterio54).
To get a preview in SNAP the user needs to open a scene, use its context menu under Open RGB Image Window,
and assign the Sentinel 2 MSI Natural Colors as shown in Figure 9. For the illustrated image, the B04, B03, B02
bands from the Granule/Img folder are interpreted as input. This process of assigning bands to the viewer's
colours is called band combination and executed in the following step. While here only three bands are assigned
to show the scene as a true colour image, the next steps will use other bands to visualise information from the
MSI instrument that are not in the visible area of the electromagnetic spectrum.
50
Data Formats - User Guides - Sentinel-2 MSI - Sentinel (esa.int):
https://sentinel.esa.int/web/sentinel/user-guides/sentinel-2-msi/data-formats
51
ArcGIS Pro: https://pro.arcgis.com/
52
QGIS: https://www.qgis.org/
53
GDAL — GDAL documentation: https://gdal.org/
54
GitHub - mapbox/rasterio: https://github.com/mapbox/rasterio
18F IGURE 9: V IEWING A SENTINEL -2 SCENE AS A TRUE RGB IMAGE IN SNAP BY SELECTING THE BANDS B4 (RED ), B3
(GREEN), AND B2 (BLUE) BANDS .
Users may need to reduce the data size, e.g., when working with true image data or a small area of interest only.
Figure 10 shows the raster/subset tool in SNAP and some of its options, including for selecting a subset of the
scene or bands. Here, the volcano crater is of interest and thus selected and clipped. The result is a subset of the
original scene that can be used in further steps as a normal scene.
19F IGURE 10: CREATING A SUBSET OF A SCENE IN SNAP WITH OPTIONS FOR SELECTING AN AREA , BANDS , AND METADATA .
Another basic processing step is the resampling of the needed bands to a common resolution. This step is often
necessary because the different bands of the MSI instrument deliver data of different resolution. For example,
the RGB Image Window in Figure 9 offers only combinations for bands with the same resolution. If users want to
combine differing bands in a processing step (or for visualising lower resolution bands), the resampling operation
in SNAP and some of its options are shown in Figure 11.
20F IGURE 11: RESAMPLING BANDS TO A COMMON RESOLUTION IN SNAP RESULTS IN MORE PREDEFINED BAND
COMBINATIONS IN THE VIEWER .
The natural colours combination of bands introduced before is just one option to view an area of interest of a
Sentinel-2 scene. After resampling a scene, the RGB Image Window offers a larger set of predefined combinations
as illustrated in Figure 11.
21F IGURE 12: A CUSTOM BAND COMBINATION FROM 55 IN SNAP FOR INSPECTING A VOLCANO .
Users can also enter custom combinations as illustrated in Figure 12, which adopts a combination described in
an article by Sabina Dolenc on medium.com55. SNAP also offers a function called band maths, which is used in
Figure 13 to define new bands for the viewer and which can be used to define bands for assessing lava, which is
otherwise black and not visible in a true colour image 55.
55
Active Volcanoes as Seen from Space | by Sabina Dolenc | Sentinel Hub Blog | Medium:
https://medium.com/sentinel-hub/active-volcanoes-as-seen-from-space-9d1de0133733
22F IGURE 13: CUSTOM BAND DEFINITIONS USING THE BAND MATH FUNCTION IN SNAP . BANDS AND COMBINATION FROM 55 .
While the .jp2 files in the .safe format represent the individual bands, users can generate a single .tif file as shown
in Figure 14, which is often easier to handle, or even needed for use with other GIS tools. The export as .tif means
that the bands are composed in one file, which does not mean that the bands are tied to those of a viewer in a
fixed manner. A scene requires the included bands to be of the same resolution. Users may need to apply
resampling first. Because upsampling and exporting full scenes with all bands often results in files of multiple
gigabytes, it can be useful to pre-process a scene before exporting so that it contains only the needed subset of
the 13 Sentinel-2 MSI bands or to clip it to a smaller area of interest.
23F IGURE 14: E XPORTING A SCENE AS GEOTIFF / B IGTIFF IN SNAP
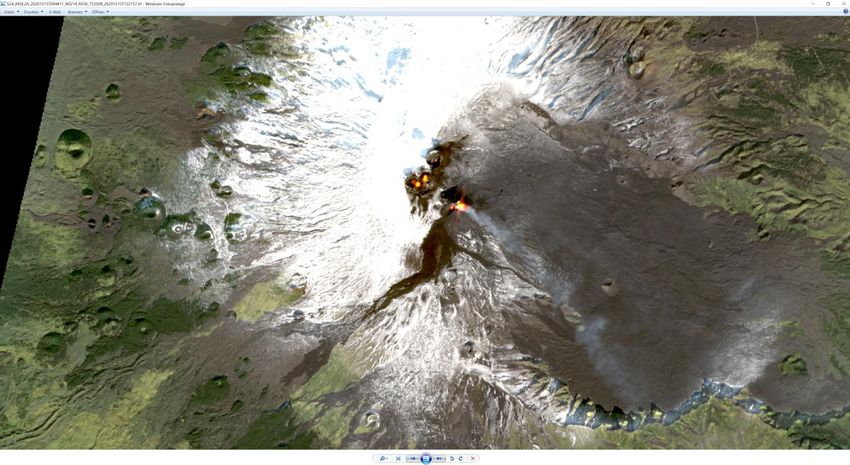
After processing the scene with these steps, the image can be opened and viewed in a GIS tool or even with a
normal photo viewer as shown in Figure 15. The described steps can be automated as described in the following
section.
F IGURE 15: T HE PROCESSED SCENE OPENED IN A PHOTO VIEWER
More information can be found in the tutorials on the SNAP tool on the ESA website56, including, e.g., mosaicking
– the process of stitching multiple scenes together.
56
SNAP Tutorials – STEP (esa.int): https://step.esa.int/main/doc/tutorials/snap-tutorials/
24Automatic Downloading and Processing
Figure 16 shows the process comprising the above steps implemented in SNAP’s Graph Processing Tool (gpt).
Users can store such created graphs and edit the .xml definition in a text editor of choice. Editing makes sense,
for example when one wants to implement parameters or for reusing parts of the process. Appendix B:
Processing workflow for use with SNAP/GDP, shows the edited process. The processing graph can be executed
via the command line by first navigating to the working directory and then executing it via SNAP’s gpt programme
as shown below.
F IGURE 16: AUTOMATION OF THE WORKFLOW USING THE GRAPH BUILDER IN SNAP AND THE IMAGE OPENED IN A VIEWER
The ambitious user can now create a programme or script that searches for, downloads, and processes new Etna
volcano scenes, e.g., daily; in three steps.
The first step is the implementation of the search via the Open Access Hub API. An example of a search URL looks
as follows:
https://scihub.copernicus.eu/dhus/api/stub/products?filter=(%20footprint:%22Intersects(POLYGON((14.855
741003796286%2037.640483194408375,15.099451859023652%2037.640483194408375,15.099451859023
652%2037.82494043411195,14.855741003796286%2037.82494043411195,14.855741003796286%2037.64
0483194408375)))%22%20)%20AND%20(%20beginPosition:[2021-01-14T00:00:00.000Z%20TO%202021-01-
19T23:59:59.999Z]%20AND%20endPosition:[2021-01-14T00:00:00.000Z%20TO%202021-01-
19T23:59:59.999Z]%20)%20AND%20(%20%20(platformname:Sentinel-
2%20AND%20producttype:S2MSI2A%20AND%20cloudcoverpercentage:[0%20TO%2010]))&offset=0&limit=
25&sortedby=ingestiondate&order=desc
The second step is then to select the scene identifier from each search result and to execute the download. An
example of a download URL looks as follows:
https://scihub.copernicus.eu/dhus/odata/v1/Products('89bb7585-47d7-434c-b9d7-2ce44d5a6948')/$value
Ideally, the search targets only the T33SVB tile (see Figure 5), so that the script needs to check few search results
only. The programme then only needs to check if the scene was downloaded before. In other use cases, the
25programme may also need to check if the area of was downloaded and processed before with an overlapping
scene.
In the third step, after downloading the scene, the processing of the new scene can be achieved by running the
gpt processing with the newly downloaded scene as the read argument:
> CD C:\data\edp\
> C:\"Program Files"\snap\bin\gpt etna.xml -
Pread=".\S2A_MSIL2A_20210114T094341_N0214_R036_T33SVB_20210114T123758.SAFE" -
Pwrite=".\out\S2A_MSIL2A_20201215T094411_N0214_R036_T33SVB_20201215T122157.tif"
Conclusion and Recommendations
The usefulness of Copernicus data
This analytical report has focused on the platforms and tools concerned with the ecosystem around the
Copernicus programme. It became apparent that the extent to which open data users can leverage Copernicus
data is only limited by the extent to which users are willing and able to familiarise themselves with the involved
platforms and needed tools. While using Copernicus data may not be considered a straightforward or easy
process, this analytical report shows that the necessary tools and resources are readily available. For example,
the volcano monitoring use case exercised in the final chapter used information from tutorials and blog entries
to make lava flows visible in Sentinel-2 images. This analytical report can thus serve as a blueprint and guide open
data users who want to use Copernicus data.
The need for in situ data
This analytical report showed that Copernicus data can enable many applications to deliver the bigger picture
using Copernicus data. This report guides users with little background in earth observation so they can realise,
e.g., volcano monitoring or capturing the impact of COVID-19 on economy. However, users should be aware that
reliable in situ data will be required at some point for most use cases. The Copernicus programme itself uses data
from sensors on earth, e.g., for calibration and validation of their satellite data products, as well as for the
delivery of the Copernicus services. Other users may rely on orthophotos at very high resolution taken from
aeroplanes, which are perhaps only available every five years. To complete the big picture Sentinel-2 imagery
can potentially fill this gap, when a lower resolution can be acceptable until the next in situ measurement. In
general, applications ultimately rely on in situ data. For example, while remote sensing can add a new dimension
to monitoring waters, water level sensors can only be implemented in situ. For users looking for in situ data for
their own projects, the European Data Portal can be one future starting point.
Finding Copernicus Data on the European Data Portal
It would be worthwhile to discuss making more Copernicus data discoverable through the European Data Portal.
While it would be possible to display each product as an individual search result, this is not the best approach
from a user perspective because the different product types would look very similar in the search results. Without
further options to explore and compare products, such as with the Copernicus Open Access Hub, it would be very
difficult for the users to identify the products relevant to them. Furthermore, the total number of available
datasets would increase significantly possibly reducing the impact/discoverability of the already existing
datasets. For example, a user using the European Data Portal’s gazetteer to search available datasets by a specific
location might result in large number of Sentinel datasets that are all relatively similar, while other unique
datasets are only shown at the very end of the list. A better approach would be to reduce the number of search
results by harvesting only the high-level collection metadata and then link to the corresponding catalogue
application, preferably with predefined search parameters. This way a user looking for SAR data would only find
one result for the collection of Sentinel-1 data instead of all the Sentinel-1 products that have been collected
since the start of the programme. Besides the actual satellite images collected by the Copernicus Program, also
the products derived from them should be taken into consideration. Integrating these products may be especially
interesting for users with less experience with earth observation data. While satellite images often require
additional processing steps or special knowledge to be used, the products of the Copernicus Services are already
processed to serve specific use cases. They also provide very descriptive metadata that can already be harvested
26with the existing geo harvester. Harvesting them would add a few very interesting datasets to the European Data
Portal while the total number of products will remain manageable.
References
The references are provided in the footnotes.
27Appendix A: Data Access Platforms
Conventional Data Access Points
ESA Copernicus Open Access Hub https://scihub.copernicus.eu/
Copernicus Space Component https://spacedata.copernicus.eu/web/cscda/home
Data Access (CSCDA)
EUMETSAT EUMETCast https://www.eumetsat.int/eumetcast
EUMETSAT Copernicus Online https://eoportal.eumetsat.int/cas/login
Data Access (CODA)
Data and Information Access Services (DIAS)
Sobloo
URL https://sobloo.eu
APIs Collections:
https://sobloo.eu/api/v1/services/explore/ogc/csw
Example GetRecords-Request
OpenSearch:
https://sobloo.eu/api/v1/services/opensearch/
List of search template URLs
https://sobloo.eu/api/v1/services/explore/collections/catalog-sentinel-3
ONDA
URL https://www.onda-dias.eu/cms/
APIs Documentation Discovery API:
https://www.onda-dias.eu/cms/de/services/catalogues/discovery/
OData interface:
https://catalogue.onda-dias.eu/dias-catalogue/Products
OpenSearch:
https://catalogue.onda-dias.eu/opensearch/OpenSearchDescription
mundiwebservices
URL https://mundiwebservices.com
APIs CSW Collections:
https://mundiwebservices.com/acdc/catalog/proxy/search/collections/csw
CSW Products (e.g., Sentinel-1):
https://mundiwebservices.com/acdc/catalog/proxy/search/Sentinel1/csw
OpenSearch Collections:
https://mundiwebservices.com/acdc/catalog/proxy/search/collections/opensearch/description.xml
OpenSearch Products (e.g., Sentinel-1):
https://mundiwebservices.com/acdc/catalog/proxy/search/Sentinel1/opensearch/description.xml
CREAODIAS (formerly called EOCLOUD)
URL https://creodias.eu/
APIs CSW URL:
http://catalogue.creodias.eu/srv/en/csw?request=GetCapabilities&service=CSW&version=2.0.2
WEkEO
URL https://www.wekeo.eu/
APIs CSW URL:
https://www.wekeo.eu/elastic-csw/service?request=GetCapabilities&service=CSW
28You can also read