Investor Presentation - April 2018 - Owens & Minor

Page created by Esther Maldonado
 
CONTINUE READING
Investor Presentation - April 2018 - Owens & Minor
Investor Presentation
April 2018
Investor Presentation - April 2018 - Owens & Minor
Safe Harbor
This presentation is intended to be disclosure through methods reasonably designed to provide broad, non-exclusionary distribution to the public in compliance
with the Securities and Exchange Commission (“SEC”) Fair Disclosure Regulation. This release contains certain “forward-looking'' statements, which are made
pursuant to the Safe Harbor provisions of the Private Securities Litigation Reform Act of 1995. These statements include, but are not limited to, statements related
to the expectations of Owens & Minor, Inc. (the “Company”) regarding the performance of its business, its financial results, its liquidity and capital resources, the
Company’s ability to complete the transaction with Halyard Health Inc. (“Halyard”) referenced herein and any financial or Halyard or Company operational items
related to the transaction or following the closing of the transaction, the ability of the Company to successfully implement the expense reduction and productivity
and efficiency increasing initiatives of the Rapid Business Transformation, and other non-historical statements. Forward-looking statements involve known and
unknown risks and uncertainties that may cause the Company’s actual results in future periods to differ materially from those projected or contemplated in the
forward-looking statements. Important factors that could cause actual events or results to be materially different from the Company’s expectations with respect to
the transaction with Halyard include, but are not limited to: the effect of the announcement of the transaction on the Company’s business relationships, operating
results, share price or business generally; the occurrence of any event or other circumstances that could give rise to the termination of the definitive agreement
relating to the transaction; the outcome of any legal proceedings that may be instituted against the Company related to the transaction; the failure to satisfy any of
the conditions to completion of the transaction, including the receipt of all required regulatory approvals and antitrust consents; and the failure to realize the
expected synergies and cost savings resulting from the transaction. Investors should refer to the Company’s Annual Report on Form 10-K for the year ended
December 31, 2017, filed with the SEC and subsequent Quarterly Reports on Form 10-Q and Current Reports on Form 8-K filed with or furnished to the SEC, for a
discussion of certain other known risk factors that could cause the Company’s actual results to differ materially from the Company’s current estimates. These filings
are available at www.owens-minor.com. Given these risks and uncertainties, the Company can give no assurances that any forward-looking statements will, in fact,
transpire and, therefore, caution investors not to place undue reliance on them. The Company specifically disclaims any obligation to update or revise any forward-
looking statements, whether as a result of new information, future developments or otherwise.

This presentation contains non-GAAP financial measures. For a reconciliation of the most directly comparable GAAP measure to each non-GAAP financial measure,
see the Appendix. These non-GAAP financial measures should not be considered a substitute for, or superior to, financial measures calculated in accordance with
GAAP, and the financial results calculated in accordance with GAAP and the reconciliations set forth in the Appendix should be carefully evaluated.

This presentation is not an offer to sell, or a solicitation of an offer to buy, any securities of the Company. Any such offer would only be made pursuant to a
prospectus, offering memorandum or other offering document.

The Company has filed a registration statement (including a base prospectus) with the SEC and will file a prospectus supplement in connection with any offering
thereunder. Before you invest in any such offering, you should read the base prospectus in that registration statement, the applicable preliminary prospectus
supplement and the other documents the Company has filed with the SEC for more complete information about the Company and such offering. You may get these
documents for free by visiting EDGAR on the SEC website at www.sec.gov.

Owens & Minor uses its website, www.owens-minor.com, as a channel of distribution for material company information, including news releases, investor
presentations and financial information. This information is routinely posted and accessible under the Investor Relations section. The information contained in, or
that can be accessed through, the Company’s website is not part of this presentation.
Investor Presentation - April 2018 - Owens & Minor
Agenda and Presenters

   Company Overview            Randy Meier
                                Executive Vice President,
   Strategy and                Chief Financial Officer, and
    Transformation Overview     President, International
   Target Overview
                                Jon Leon
   Key Investment Highlights   Vice President and
                                Corporate Treasurer
   Historical Financial
    Overview
   Appendix

3
Investor Presentation - April 2018 - Owens & Minor
COMPANY OVERVIEW
Investor Presentation - April 2018 - Owens & Minor
Company Overview
                                                                                 FY 2017 Net Revenue by Geography                    FY 2017 Net Revenue by Segment
     Leading global healthcare solutions company
                                                                                          Europe & Other, 4%                                      Proprietary Products, 5%
                                                                                                                               International
      that connects the world of medical products to                                                                                4%

      the point of care

     Operations focused on delivering point of care
      services and providing our customers with a
                                                                                                   United                                            Domestic
      service portfolio that covers procurement,                                                   States                                              91%
                                                                                                    96%
      inventory management, delivery and sourcing of
      products for the healthcare market

     Customers include hospitals, integrated                                                                     $9+ billion of net revenue, Fortune 500 company;
                                                                                 A Global Healthcare               136-year history, listed on NYSE (Ticker: OMI)
      healthcare systems, group purchasing                                        Services Company
                                                                                                                  ~8,600 teammates
      organizations, home health agencies, and the
      U.S. federal government                                                                                     60+ facility network across 15 countries
                                                                                 Connecting Medical
                                                                                                                  Supports millions of point-of-care solutions globally
                                                                                 Products to Point of
     For the year ended December 31, 2017, Owens                                                                  on an annual basis
                                                                                        Care
      & Minor generated Net Revenue and Adjusted                                                                  Thousands of healthcare provider customers

      EBITDA of $9.3 billion and $257 million,                                                                    Addressing complexity for both providers and
                                                                                                                   manufacturers
      respectively                                                                Unique Position
                                                                                                                  Partnering with manufacturers, providers, and payors
                                                                                                                   to enhance care

5   ____________________
    Note: For a reconciliation of Net Income to Adjusted EBITDA, see slide 40.
Investor Presentation - April 2018 - Owens & Minor
Current Business Segments

                          Distribution, logistics and value-added services for leading        Total Revenue
    Domestic

                           providers and manufacturers                                            FY 2017
                          Network of distribution centers reaching multiple points of care    Net Revenue:
                           nationwide                                                            $8,794mm
                          Includes supplier management, analytics, inventory management,      (91% of Total)
                           outsourced resource management, and clinical supply
                           management

                                                                                               Total Revenue
    International

                          Pan European network with locations across Europe
                          Contract logistics services to the pharma, biotech and medical         FY 2017
                           device industries                                                   Net Revenue:
                          Warehousing and transportation offerings include cold-chain,           $392mm
                           controlled-substances, repacking & kitting, and other value-added    (4% of Total)
                           services

                          Operations in U.S. and Ireland and a presence in China and
                                                                                               Total Revenue
    Proprietary

                           Malaysia
                          Help manufacturers and healthcare providers by sourcing,               FY 2017
                           assembling, and delivering custom procedure kits and minor          Net Revenue:
                           procedure kits & trays to the point-of-care efficiently and            $504mm
                           effectively                                                          (5% of Total)
                          Includes own proprietary MediChoice private label products
                           which are sourced internally

6         ____________________
          Note: Excludes intersegment revenue.
Post-Closing Business Segments
                                 Post-transaction, Owens & Minor expects to operate two strategic business units:
                                                      Global Solutions and Global Products
                                                       What We Do                                                                                                Selected Examples

                            Provider Solutions
    Global Solutions

                            Manufacturer Solutions

                            Third Party Payor Solutions

                            Pro forma FY 2017 percentage of Net
                             Revenue: 86% (1)

                            Private label

                            Clinical & Procedural Solutions – Medical
    Global Products

                             Action & ArcRoyal                                                                                                                          S&IP Business
                            Global Sourcing

                            Halyard S&IP

                            Pro forma FY 2017 percentage of Net
                             Revenue: 14% (1)

7            ____________________
             (1) Includes full year FY 2017 revenue contribution from Byram of $467 million. Assumes that Global Products segment will consist of the Proprietary Products segment and S&IP.
Primary Customers & Suppliers

                  Customers & GPOs                                                                           Suppliers / Manufacturers
       Hospitals, Alternate Site Channels
                                                                                                          Purchase products from or provide
        (“ASCs”), and Physicians
                                                                                                           services to most global manufacturers
       Integrated Delivery Networks (“IDNs”)
                                                                                                          Includes largest and most influential
       Group Purchasing Organizations                                                                     healthcare manufacturers in the
        (“GPOs”)                                                                                           industry
       Third Party Payors                                                                                Includes pharmaceutical,
       Customers and GPO relationships                                                                    biotechnology and medical device
        include:                                                                                           manufacturers
                                                                                                          Suppliers include:

         Owens & Minor provides medical products and services to the point of care, often on a daily basis, enabling provider partners to
          choose among leading healthcare brands without substitution
         State-of-the-art technologies and healthcare services and solutions expertise that manufacturers can trust
         Constant data gathering and analysis to help manufacturer and provider partners make informed strategic decisions

8   ____________________
    Note: Logos are the trademarks of their respective parties.
Strategic Partner of Choice for Providers &
Manufacturers
      Owens & Minor is a strategic partner to both providers and suppliers as they face challenges in the global healthcare market

    Primary Owens & Minor Counterparties
                                                       Complexity Faced                                Key Counterparty Needs
         Type               Examples

                                                                                                     Partners to deliver optimal mix
                                                 Pressure on pricing and                             of services and products
                      U.S. and EU-based:
                                                  reimbursement
                        Hospitals                                                                   Change management
                                                 Regulatory uncertainty
                        IDNs
      Providers                                  Transition to value-based                          Ability to operate across
                        Home Health
                                                  payments                                            continuum of care
                        Third Party
                                                 Shift to lower-cost sites
                            Payors                                                                   Data and analytics to improve
                                                 Evolving competitor set
                                                                                                      quality & efficiency

                                                                                                     Outsource functions to
                      U.S. and EU-based:         Pressure / scrutiny on pricing                      maximize efficiency & savings
                        Pharma
                        Biotech                 Need to replenish pipeline of                      Transparency in demand at
    Manufacturers                                 clinically differentiated products                  point of care
                        Med Devices
     & Suppliers
                        Med Supplies            R&D cost pressure                                  Data and analytics to allocate
                        Third Party                                                                  resources
                            Payors               Value-based pricing models
                                                                                                     Programs that drive volume

9
STRATEGY AND TRANSFORMATION
          OVERVIEW
A History of Growth
                                                                                                                                                  2018
                                                                                                                                                  Expected to
                                                                                                                                                  acquire
                                                                                                     2006                                         Halyard S&IP
                                                                  Acquires acute-care medical and surgical                               2014
                                                                        distribution business of McKesson                                Acquires:
       1882
       Owens & Minor Drug                                                            2002
       Company opens its first                                    Creates MediChoice, the
       location in Richmond,                                       Company’s first private
       Virginia                    1971                                         label line
                        Owens & Minor
                             goes public

1880       1950          1960          1970       1980            1990                  2000                        2010                         2017

                                                          1988             1992                             2008     2012
                                               Owens & Minor         Divestiture                         Acquires    Begins expansion into the
                                              begins trading on      of the drug                         Burrows     global market through              2017
                                                the NYSE under          business                        Company      acquisition of                     Acquires
                                               the symbol OMI
                                                                                    1994
                                                                                 Acquires
                                                                           Stuart Medical

     Over the last 136 years, Owens & Minor has followed a path of reinvention to
                align its business with changes in the healthcare market

11
Transformational Plan to Strengthen Competitive
Position
          Why Change is Needed                   Executing the Strategy

    Market consolidation                  Executing on a transformational plan to
                                            strengthen O&M’s competitive position
                                           Rapid business transformation process
    Increased complexity                   has identified measures deliverable by
                                            2020 that would generate approximately
    Outcomes based reimbursement           $100-150 million of positive contribution
                                            to operating earnings on a run-rate basis
                                           Two transformative and synergistic
    Universal cost control pressures       acquisitions
                                           Refocusing our owned products strategy
    Consumerization of healthcare         Organizing into two strategic business
                                            units (Global Solutions and Global
    Regulatory Pressures                   Products) with seasoned leadership
                                           New business model creating
                                            shareholder value via new sources of
                                            profitable growth
                                           Prioritization of deleveraging

12
Key Transformation Strategies

       Transformation
                                                                   Achievements to Date
          Strategy
 1
                             Connecting leading manufacturers to leading IDNs with technology and data to drive efficiencies
         Build Most
     Intelligent Route to    Investing in point of care technology and services
            Market           Halyard Health S&IP acquisition is expected to provide scale to existing product portfolio

 2
       Expand Along          Entry to direct-to-patient market via Byram Healthcare acquisition
     Continuum of Care       Remain focused on ASCs and Physician Offices

 3
     Become Preferred
      Outsourcer for         Winning new business in the U.S. and Europe
         Leading             Great progress; pilot programs continue to expand
      Manufacturers

 4
     Transform via Data,     Progress with new value proposition and solution offering
        Analytics, and
          Services           Beginning to aggregate and analyze data for our customers to reduce complexity

13
Strategy Expands Our Addressable Market and
         Strengthens Margin Profile
                                      Expands Addressable Market                                                                Enhances Margin Profile
                   Leading player in the acute care setting                                                 Focused vertical strategy bolsters owned-brand product portfolio

                   Entered direct-to-patient services market through the acquisition of                     Profitability improves as business diversifies across continuum of care
                    Byram                                                                                     into non-acute care market

                   S&IP acquisition brings an experienced, global sales force with direct                   Market-leading S&IP brands support margin due to premium products
                    channel access to acute care and non-acute care markets                                  Data analytics enables the Company to provide higher margin value-
                                                                                                              added services

                    $70

                    $60
                                                                                                              Acute Care Solutions
                                                                                         Healthcare Data            Provider
                    $50                                                                     Analytics
Market Size ($bn)

                                                                                             ~$10bn                      Continuum of Care
                    $40                                                                                                  Solutions Provider

                                                                   $63                                                                Owned-Brand
                    $30
                                                                                                                                     Product Portfolio
                                                                                            Disposable
                    $20              $40                                                                                                        Market-Leading
                                                                                           Equipment &
                    $10
                                                                                             Supplies                                              Brands
                                                                                          (International)
                                                                                             ~$100bn                                                      Data / Analytics
                     $0
                                                                                                                                                             Solutions
                          US Acute Disposable US Total Disposable
                             Equipment &         Equipment &
                               Supplies            Supplies                                                                              Operating Margin
                                                                                       Adds New Legs of
                                   Expands Core Market                                     Growth

        14            ____________________
                      Source: IBIS World, Marketline, Technavia and company filings.
Rapid Business Transformation
    In Q1 2017, Owens & Minor unveiled its Rapid Business Transformation (“RBT”) process to reduce expenses, increase
     efficiency and productivity and add significant operating income (to replace lost margin)
    Throughout 2017, the RBT process identified and implemented initiatives designed to drive better earnings and cash
     flow through efficiency and productivity gains, expense reduction and diversification of our services
    The RBT cost control and productivity initiatives include, but are not limited to, implementing warehouse and delivery
     efficiencies, reducing occupancy costs, information technology restructuring, and outsourcing certain manufacturer
     services
    These initiatives exceeded our initial RBT financial goals by achieving an approximately $50 million positive contribution
     to operating earnings in 2017 (on an actual basis) through cost reductions and operational improvements
    Owens & Minor has further identified additional measures deliverable by 2020 that, taken together with the measures
     implemented in 2017, would generate approximately $100 – $150 million of positive contribution to operating earnings
     on a run-rate basis (inclusive of the positive run-rate contribution achieved in 2017)
    Owens & Minor estimates the total non-recurring costs incurred to deliver the approximately $100 – $150 million of
     positive contribution will be in the range of approximately $55 million to $65 million, of which approximately $30
     million was incurred in 2017

                                              Rapid Business Transformation

                                  2017 Positive Contribution Achieved               2020 Deliverable Contribution

                Total                             ~$50mm                                     ~$100 - $150mm

15
Strategic Acquisitions

                                                                                                                                                                     S&IP Business

      Transaction Value                                                             $380mm                                                                            $710mm

        Announcement
            Date                                                                May 2, 2017                                                                       November 1, 2017

                                                                 FY 2017 Revenue: $467mm                                                               FY 2017 Revenue: $1,013mm(1)
              Financials
                                                          FY 2017 Adjusted EBITDA: $37mm                                                            FY 2017 Adjusted EBITDA: $83mm

                                                                                                                                              Anticipated ~$13.5 million in 12 months
     Expected Synergies                                                                    --
                                                                                                                                            post transaction close with potential upside
                                                           A leading direct to patient home                                                            Focused, market leading global
                                                            solutions provider                                                                           medical products
                                                           Portfolio of over 600 payor contracts                                                        – Surgical drapes & gowns, medical
       Other Highlights                                    Dedicated infrastructure to support                                                             exam gloves, sterilization wraps,
                                                            claims filing and collections processes                                                         facial protection, protective
                                                           More than 900 teammates                                                                         apparel
                                                                                                                                                        Expected to enhance cash flow

16   ____________________
     Note: For a reconciliation of Net Income to Byram Adjusted EBITDA, see slide 41. For a reconciliation of Net Income to S&IP Adjusted EBITDA, see slide 42.
     (1) Represents total annual revenue with approximately $750 million of incremental revenue (deducts for S&IP revenue from Owens & Minor).
Byram Acquisition
               Strategic Rationale                                    Transaction Overview
    Attractive channel with strong growth,                   Owens & Minor acquired Byram Healthcare on
     supported by aging of U.S. population                     August 1, 2017 for approximately $380 million
                                                               representing a 12.1x transaction multiple
    Extends O&M presence across the continuum of
     care                                                     Byram is a leading domestic distributor of medical
                                                               supplies sold directly to patients and home health
    Cultural fit                                              agencies
    Expands capabilities and expertise                         ―    The acquisition diversifies the Company’s
                                                                     revenue streams with higher margin business
      ―     Complements transaction processing                       and aligns the Company’s strategy to expand
                                                                     along the continuum of care and adapt to a
      ―     Gain expertise in managing third party
                                                                     changing healthcare landscape
            reimbursement
                                                                ―    Establishes a significant presence in a
      ―     Customer-facing sales force                              fragmented market (Byram is a leading
                                                                     player) and allows the Company to pursue a
      ―     Relevant to acute care customers
                                                                     higher margin, higher growth business
    Financially attractive                                   Byram contributed $209 million of revenue to the
                                                               Domestic segment in FY 2017 (five months)
      ―     $467 million revenue for FY 2017 with a
            more attractive historical growth profile as      Following the acquisition, Owens & Minor has
            compared to O&M’s recent trends                    successfully transitioned Byram under the O&M
                                                               umbrella
      ―     Accretive to earnings
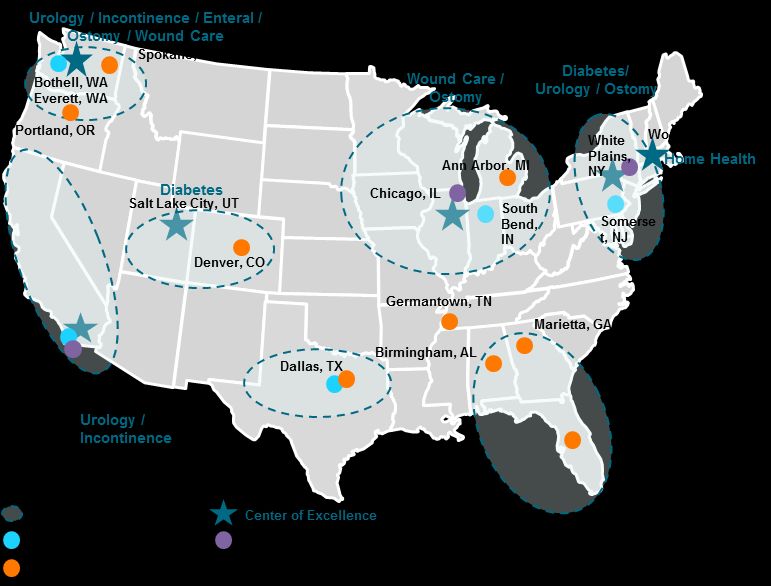
17
Byram Healthcare Business Overview

                             Business Description                   Top Customers
      Direct-to-patient distributor of medical supplies in the
       United States, reimbursed by health insurance providers
      Major product segments: ostomy, diabetes, urology,
       wound care, incontinence and breast pumps
      Chronic conditions that require regular care; both direct-
       to-patient and via home health agencies

                                     Key Highlights                   Footprint
 Leading market player
 Targeted market strategy
      – Population density
      – Attractive demographics
 Unrivalled Managed Care access
      – Continued market shift to Managed Care
      – Attractive state Medicaid programs in target markets
 Product specialization through Centers of Excellence (COEs)

18   ____________________
     Note: Logos are the trademarks of their respective parties.
Strategic Rationale of S&IP Transaction
                            Strategic Rationale                                                                                         Transaction Overview
          Augments owned-brand portfolio                                                                                 Owens & Minor announced the S&IP transaction
                                                                                                                           on November 1, 2017 for approximately $710
              –        Gain scale with targeted vertical integration                                                       million, acquiring over $1.0 billion(1) of annual
                                                                                                                           revenue and $83 million of Adjusted EBITDA(2) for
              –        Leverages existing relationships in acute
                                                                                                                           the year ended December 31, 2017
                       and non-acute care settings
                                                                                                                              –        Approximately $13.5 million of annual cost
          Expands global presence
                                                                                                                                       synergies expected to be achieved within
                                                                                                                                       12 months following transaction closing
          Accelerates strategy to deliver value at the point
                                                                                                                                       followed by potential synergy upside (3)
           of care

              –        Product opportunity extends along the
                       continuum of care to the direct-to-patient
                       market

          Financially and strategically compelling

              –        Opportunity to increase profitability of
                       Proprietary Products segment

              –        Expands sourcing scale and capabilities

     ____________________
19   (1) Represents total annual revenue with approximately $750 million of incremental revenue (deducts for S&IP revenue from Owens & Minor).
     (2) For a reconciliation of Net Income to S&IP Adjusted EBITDA, see slide 42.
     (3) Expected cost to achieve synergies is not currently estimable but could be significant.
Evolution from Distributor to Global Healthcare
Solutions Provider
                    Historical Position:                                                                                            Well Positioned for the Future:

                                                                                                         Valued-added partner to providers and manufacturers across continuum
                                                                                                          of care

                                                                                                         Bundle branded products with services and technology that solve
                                                                                                          complexity, lowering total cost & elevating quality of care
                   U.S.-based medical                                                                    Post S&IP transaction, owned products expected to increase from 5% to
                  supplies distributor to                                                                 14% of pro forma 2017 net revenue (1)
                   acute care hospitals
                                                                                                         Global footprint, supply chain solutions
                                                                                                         Strategic business units to drive accountability and results
                                                                                                         Long-term earnings growth, underpinned by top-line growth and
                                                                                                          productivity improvements

                                                                                            Net Revenue by Segment

     FY 2010 Net Revenue                                       FY 2014 Net Revenue                                          FY 2017 Net Revenue (2)                        PF FY 2017 Net Revenue (2)
                                                                        Int'l 5%                                             Byram Proprietary Products, 5%              Proprietary Products, 5%
                                                                                                                              5%
                                                                                                                    Int'l                                                Byram         S&IP
                                                                                                                     4%
                                                                                                                                                                          4%            9%
                                                                                                                                                                        Int'l
                                                                                                                                                                         4%
              Domestic
               100%
                                                                                                                                                                                              Domestic
                                                                                                                                            Domestic
                                                                                Domestic                                                                                                    (excl Byram)
                                                                                                                                          (excl Byram)
                                                                                  95%                                                                                                           78%
                                                                                                                                              86%

20   ____________________
     (1) Owned product portfolio expected to consist of Proprietary Products segment and S&IP.
     (2) Includes full year 2017 revenue impact from Byram of $467 million, excludes deduction for intersegment revenue, and includes $1,013 million of S&IP revenue.
TARGET OVERVIEW
Halyard S&IP Business Snapshot
             Leading global provider of medical supplies and solutions for the                          FY 2017 Net Sales by Geography (1)
             prevention of healthcare-associated infections across the acute and                                          LATAM
             alternate site channels                                                                                        2%
                                                                                                             APAC
                                                                                                             14%
                       Main product categories consist of surgical drapes and gowns,
                        medical exam gloves, sterilization wraps, facial protection, and
                        protective apparel
                                                                                                 EMEA
                                                                                                  13%
#1           Market leader with a portfolio of high-end differentiated products
                       #1 US acute market position by dollar sales in surgical drapes and                                                        North America
                                                                                                                                                       71%
                        gowns, sterilization wraps and facial protection in 2016
                       Leading U.S. positions in its other product categories, including
                        medical exam gloves, protective apparel, and other
                       Strong brand recognition across developed markets (U.S., Japan,            FY 2017 Net Sales by Product Category (1)
                        Australia, Western Europe)                                                           Protective    Other
                                                                                                              Apparel       3%
             Global sales force with broad healthcare market access: markets and                    Facial
                                                                                                                7%
                                                                                                                                                 Surgical Drapes
             sells directly to hospitals, clinicians, and end users in approximately 90           Protection                                        & Gowns
             countries                                                                               10%                                               34%

              World class manufacturing and supply chain: Manufactures a majority of
                                                                                             Sterilization
              its products in facilities throughout the US, Thailand, Honduras, and             Wrap
              Mexico                                                                             15%

                      S&IP uses a wide variety of raw materials and other inputs in its
                       production process and delivery systems
                      Procurement strategies have been developed for the two major                                                Exam Gloves
                       categories of spend, polymer and nitrile                                                                       31%

22   ____________________
     (1) Excludes sales to Kimberly-Clark of approximately $54 million.
Leading Market Positions
                                                  % of 2017            U.S. Market
     Category                Product                                                                                           U.S. Market Position
                                                    Sales              Position (1)
     Surgical                                                                                       Over 600+ patents for advanced non-woven fabrics
     Drapes                                                                                         Unique product designs, along with proprietary materials, enable S&IP to
                                                       34%                     #1
       and                                                                                           create low cost OR solutions
     Gowns                                                                                          Recognized brands include MICROCOOL, AEROBLUE, and AEROCHROME

                                                                                                    Nitrile and vinyl exam gloves provide a latex-free portfolio with multiple
     Medical
                                                                                                     levels of protection from exposure to blood-borne pathogens
      Exam                                             31%                     #3
                                                                                                    Leading brands, including PURPLE, LAVENDER, and STERLING have
     Gloves
                                                                                                     patented technology

                                                                                                    Provides complete portfolio to keep sterilized surgical instruments
Sterilization                                                                                        protected and ready to use
                                                       15%                     #1
   Wraps                                                                                            Latest wraps provide bacterial filtration >99%

                                                                                                    Includes standard and fluid-resistant masks, particulate respirators,
   Facial                                                                                            eyewear, and face shields
                                                       10%                     #1
 Protection                                                                                         FLUIDSHIELD is a market leader in fluid-resistant facial protection with
                                                                                                     trademark orange color

                                                                                                    Among the leading providers of protective apparel in the U.S.
 Protective
                                                        7%                     #2                   Provides isolation gowns, lab coats, professional jackets as well as
  Apparel
                                                                                                     headwear and footwear

23    ____________________
      (1) Represents acute market share based on dollar spend for the year ended December 31, 2016 per IMS.
Overview of Customers

                                                                                              FY 2017 Net Sales by Geography
             S&IP’s direct and end customer base consists of a wide variety of
              IDNs, GPOs, and hospitals, with Owens & Minor representing its
              largest direct customer
                                                                                                      RoW
             S&IP supports customer sales through a dedicated global sales force                     29%
              of approximately 150 professionals
                                                                                                                  North
                                                                                                                 America
                 –         Sales professionals are supported by clinical field specialists,                        71%
                           field sales trainers, and customer service representatives
                 –         Direct sales focuses effort on acute care hospitals by accessing
                           multiple call points, including the OR and infection prevention
                           services to maximize sales of the S&IP suite of products           FY 2016 North America Net Sales
                                                                                                      by Care Setting
                 –         Sales to large IDNs and GPOs are assisted by a national sales
                           account team

                                                            Select Customers                         Alternate
                                                                                                        Site
                                                                                                        25%

                                                                                                                 Acute
                                                                                                                  75%

24   ____________________
     Note: Logos are the trademarks of their respective parties.
Overview of Expected Cost Synergies

             Owens & Minor has a clear, executable plan to integrate S&IP’s operations and achieve significant synergy potential
                             (1)
                    $13.5
                                                                        Expected savings from local sales representation in all
                                                                         geographies (less outsourcing), rationalization of marketing
                                                                         costs, and reallocation of Owens & Minor resources to direct
                                    SG&A and                             sales
                     $3.4           Corporate                           Rationalization of redundant corporate expenses such as
                                    Overhead                             corporate offices, finance, human resources, and legal and
                                                                         business services

                                                                        Strategically sourcing common carrier rates and lanes for full
                                                                         truck load shipments (consolidation of suppliers and aggregate
                                                                         spend)
                                                                        Insourcing of less than truck load shipments and leverage our
                     $5.0          Logistics &                           private fleet
                                   Distribution                                                                                             Additional run-rate synergy
                                                                        Consolidation of the S&IP distribution center in Ontario, CA         upside expected to be
                                                                         with three to four Owens & Minor distribution centers,               deliverable by 2020 (1)
                                                                         elimination of third party logistics profit by insourcing
                                                                         warehouse and logistics management, and eliminate handling
                                                                         of S&IP products by multiple distribution centers
                     $1.7          Procurement                          Expected benefits from increased spend given scale and
                                                                         supplier concentration, contract renegotiation, and competitive
                                                                         bidding; estimate is conservative given limited overlap in major
                                                                         direct material categories between Owens & Minor and S&IP
                                   Eliminated Cost
                     $3.4          Paid to Third
                                                                        Cost reductions of distributing higher margin S&IP products
                                   Parties for Certain
                                                                         instead of higher cost comparable products sourced from third
                                   Products
                                                                         parties and substituting S&IP gloves in place of comparable
                                                                         products
    12 months following closing
25 ____________________
    (1)   Expected cost to achieve synergies is not currently estimable but could be significant.
KEY INVESTMENT HIGHLIGHTS
Leading Global Healthcare Solutions Company

                                                                Well Positioned
                                                                 to Succeed
                                             Meaningful
                                             Synergies from
                            Focused
                                             Channel Access +
                            Vertical
                                             Market Leading
                            Approach
                New                          Owned / Sourced
                Markets      S&IP Business
                                             Products
                Across
                Continuum
     Strong     of Care
     Core
     Acute
     Care
     Offering

27
Key Investment Highlights

     1
           Transformation to a Global Healthcare Solutions Business with a Diversified
                        Business Model and Focused Vertical Approach

     2
            Strong and Diverse Customer Base and Manufacturing Relationships with
                                    Market-Leading Brands

     3
         Global Scale and Expected Synergies Position Owens & Minor for Future Growth

     4
                                Experienced Management Team

28
1
     Transformation to a Global Healthcare Solutions Business with
     a Diversified Business Model and Focused Vertical Approach

                         Focused Vertical Approach                                                       S&IP Products
  OMI is a manufacturing partner that helps manufacturers launch, market                S&IP has strong brand recognition across
   and sell products                                                                      developed markets in which Owens & Minor
      – Addition of a market leading manufacturing capability raises OMI’s                does business
        importance to customers                                                               – #1 U.S. market positions for the surgical
  Owens & Minor expects to leverage its significant scale as a services                        drapes and gowns, sterilization wraps
   company to increase the scale of S&IP’s product distribution                                 and facial protection product groups as
                                                                                                of 2016
      – Further private label penetration is a potential catalyst for increased
        sales growth to OMI’s existing customers                                              – Leading market positions for its other
                                                                                                products as of 2016
      – Several S&IP products are expected to be used post-acquisition in the
        Company’s kitting business in lieu of third party products                       S&IP’s global sales force and manufacturing
                                                                                          capabilities expected to enhance Owens &
      – Expected to increase S&IP volume from direct channel access to
                                                                                          Minor’s owned brand portfolio
        Owens & Minor’s existing customers, additional service-based
        revenue and enhancing operating margins

                                                       S&IP Manufacturing Facilities
                 Plant                           Country                                  Main Product Categories
          Lexington, NC Mill                       USA                Sterilization wraps, surgical drapes and gowns, protective apparel
                 Acuna                           Mexico                              Facial protection, sterilization wrap
              Nogales III                        Mexico                                  Surgical drapes and gowns
          Avent de Honduras                     Honduras                                 Surgical drapes and gowns
         Safeskin – SSMT Mill                   Thailand                                    Medical exam gloves

29
2
      Strong and Diverse Customer Base and Manufacturing
      Relationships with Market-leading Brands

       Owens & Minor has a diversified mix of products and services across the care continuum

            –       A market leader in the acute care setting

            –       Other services diversified across non-acute care settings, such as ambulatory surgery centers,
                    physician offices and home health settings

       Acquisition of Byram brought access to its network of patients and home health agencies

       Acquisition of S&IP expected to add trusted products through direct channel access to both acute care and
        non-acute care markets

Selected Acute Care & Manufacturer
                                                                   Selected Non-Acute Care Customers   Selected Home Health Customers
            Customers

                                                                          Physician Offices

                                                                         Outpatient Surgery
                                                                              Centers

30   ____________________
     Note: Logos are the trademarks of their respective parties.
2
     Strong and Diverse Customer Base and Manufacturing
     Relationships with Market-leading Brands
               Owens & Minor Customer Relationships                                    Owens & Minor Top Customers (2017 Net Revenue)
  Owens and Minor maintains a diverse range of customers including multi-                                             Top 10
   facility networks of healthcare providers (IDNs), smaller, independent hospitals,                                 Customers
   surgery centers, and physicians’ practices                                                                           23%
  The Company’s hospital relationships are multi-year relationships that have
   high switching costs due to the complexity of replacing a distributor and
   creation of disruption in key areas of hospital inventory
     – Separate relationships are maintained with most hospital customers that
       may or may not be based on a GPO agreement
     – Average length of relationship with top 10 customers is 15 years
                                                                                              Other
  Owens & Minor also maintains contracts to provide distribution services to a
                                                                                            Customers
   number of national GPOs, including Vizient, Premier, Inc., and HealthTrust
                                                                                               77%
   Purchasing Group (HPG)
     – Recently signed 3 – 5 year extensions with 3 largest GPO relationships
     – The Company maintains active renewal dialogue with all upcoming contract
       expirations

                      S&IP Customer Relationships                                            S&IP Top Customers (2017 Gross Sales)

  S&IP features a diverse customer base of hospitals, IDNs, and GPOs which are
   supported by a global sales force team
     – S&IP supports its product sales by maintaining positive GPO relationships
       to maintain consistent product pricing and by focusing sales efforts on            Other                             Top 10
       specific hospitals to drive volume-based purchasing decisions                    Customers                         Customers
                                                                                           47%                               53%
     – S&IP’s global sales force directly negotiates contracts, including volume-
       based incentives, to hospital and alternate site customers to drive sales
       and provide visibility into future revenues

31
3
      Global Scale and Expected Synergies Position Owens &
      Minor for Future Growth

                                        Commentary                                                                           Where We Operate
                                                                                                                Americas
  Opportunity for future growth through                                                                                                                       EMEA
      diversified revenue stream, broader
      geographic footprint and enhanced customer
      base

  Post-transaction, Owens & Minor is expected
      to operate in 25 countries with approximately
      17,000 teammates worldwide
                                                                                                                                         Asia-Pacific

  S&IP is expected to bring clinically focused,
      global sales team to expand geographic reach

  Augmented owned brand portfolio expected
      to increase from 5% to 14% of pro forma 2017
      net revenue (1)

  Increased scale and diversification with                                                         O&M Current Operations
                                                                                                    Incremental locations acquired via S&IP
      targeted vertical integration                                                              Note: Post-transaction countries also include South Africa.

32   ____________________
     (1) Owned product portfolio expected to consist of Proprietary Products segment and S&IP.
4    Experienced Management Team

         Name & Title                                                                      Background

                                          Joined Owens & Minor as its President & Chief Executive Officer effective July 1, 2015
           P. Cody Phipps                 Formerly served as President and CEO of Essendent and was a Partner at McKinsey & Company, where he
           President & CEO                 co-founded and led its Service Strategy and Operations Initiative
                                          Serves on the board of directors of R.R. Donnelley & Sons Company (since 2015)

                                          Joined Owens & Minor in March 2013
           Richard “Randy” Meier
                                          Formerly served as Executive Vice President and CFO of Teleflex and as President and Chief Operating
           EVP, CFO &
                                           Officer of Advanced Medical Optics
           President – International
                                          Serves as Lead Director and Chair of Audit Committee of BioMarin Pharmaceuticals

                                          Joined Owens & Minor in January 2018
           Chris Lowery                   Formerly Senior Vice President and Chief Operating Officer of Halyard Health, Inc. since its spin-off from
           President, Global Products      Kimberly-Clark in November 2014, Vice President of Sales and Marketing at Kimberly-Clark Health Care,
                                           and several senior marketing and sales roles at Covidien

                                          Joined Owens & Minor in March 2017
           Stuart Morris-Hipkins          Has over 20 years of global leadership experience, including former Executive Vice President of Owens &
           President, Global Solutions     Minor’s Global Manufacturer Services and Senior Vice President and General Manager at Smith and
                                           Nephew, PLC

33
Summary of Investment Highlights
1
    Transformation to a      Owens & Minor’s scale and efficiency, which is expected to be boosted by the addition of the S&IP owned-brand product
     Global Healthcare        portfolio, allows it to provide vital supply chain services to its hospital, IDN, GPO, and alternate site customers
     Solutions Business      S&IP owns a market-leading product portfolio, which holds leading U.S. market positions and has strong brand recognition
     with a Diversified       across developed markets, and complements Owens & Minor’s existing portfolio of brands
    Business Model and       Several S&IP products are expected to be used in our kitting business in lieu of third party products, which is expected to
      Focused Vertical        increase S&IP volume from more direct channel access, thereby providing additional service-based revenue and enhanced
                              operating margins
         Approach
2
                             While maintaining its position as a market leader in acute care, Owens & Minor has expanded its services to the non-acute
    Strong and Diverse        care setting including ambulatory surgery centers, physician offices and home health
    Customer Base and        Through the acquisition of Byram, a leading direct-to-patient services provider, Owens & Minor gained access to a network of
      Manufacturing           patients and home health agencies
    Relationships with       Longstanding relationships with customers gives Owens & Minor unparalleled insight into the purchasing data of those
      Market-leading          customers, differentiating the service that Owens & Minor is able to provide
          Brands             S&IP’s customer relationships reflect the quality and brand recognition of its products among acute care entities

3
      Global Scale and       Owens & Minor is expected to enhance its geographic footprint through S&IP’s global salesforce and manufacturing facilities
    Expected Synergies         –    Following the acquisition, Owens & Minor expects to have a presence in over 90 locations with roughly 17,000 teammates
     Position Owens &        That footprint is expected to create opportunities to partner with more manufacturers, and offer products to more end markets
     Minor for Future        The S&IP acquisition is in line with the existing acquisition strategy of vertically integrating the Owens & Minor business
          Growth
                             Owens & Minor will leverage its familiarity with S&IP’s product offering as S&IP’s largest customer prior to the acquisition

4
                             The management team brings together a wealth of experience from diverse sources, both internal and external
      Experienced            P. Cody Phipps, CEO of Owens & Minor since July 2015, led the Byram acquisition and expansion to direct-to-consumer
    Management Team            –    Recently served as CEO of United Stationers Inc. (rebranded as Essendant) where he oversaw the expansion into adjacent
                                    products and services, online channels, and developed enhanced logistics services for manufacturers

34
HISTORICAL FINANCIAL OVERVIEW
Owens & Minor Historical Financial Performance
                                     Net Revenue                                                                                                      Adjusted EBITDA (1)
$ in millions                                                                                                               $ in millions

                                                                                                                                    $265             $282          $305                  $257
                                              $9,773               $9,723                                                                                                      $291
      $9,072             $9,440                                                         $9,318

                                                                                                                                    2.9%             3.0%          3.1%        3.0%      2.8%

                                                                                                                                    2013             2014           2015        2016     2017
       2013                2014                 2015                 2016                 2017
                                                                                                                                                            Adjusted EBITDA   % Margin

                           Capital Expenditures                                                                                                        Free Cash Flow (2)
$ in millions                                                                                                                $ in millions

                            $71                                                             $51
        $60
                                                                                                                                                                    $269        $261
                                                 $37                                                                                $205             $211                                $206
                                                                       $30
       0.7%                0.8%
                                                                                           0.5%
                                                 0.4%                 0.3%
       2013                 2014                 2015                 2016                 2017                                      2013            2014           2015        2016     2017
                            Capital Expenditures                 % of Total Revenue
 36   ____________________
      (1) For a reconciliation of Net Income to Adjusted EBITDA, see slide 40.
      (2) Free cash flow defined as Adjusted EBITDA less capital expenditures. For a reconciliation of Net Income to free cash flow, see slide 40.
Owens & Minor Recent Performance
($ in millions)                                         Three Months Ended December 31,
                                                                                                Q4 2017 vs. Q4 2016
                                                            2016               2017
                                                                                                   Revenue:
 Domestic                                                       $2,237             $2,276           Addition of Byram Healthcare offset price
 International                                                       88               104              compression in the Domestic segment, driving
 Proprietary Products                                              131                111
                                                                                                       modest quarter over quarter total top-line growth
 Inter-segment                                                      (87)             (101)
Total Net Revenue                                               $2,368             $2,390           Proprietary Products were negatively impacted by
 % growth                                                        (4.8%)             0.9%               lower revenues from sourced products
Gross Margin                                                     $295               $315           Gross Margin & Operating Earnings:
 % margin                                                       12.5%              13.2%            Gross margin increased due to the impact of Byram
 Distribution, selling and administrative expenses                 $243               $282             Healthcare, partially offset by the impact of lower
 Acquisition-related and exit and realignment charges                 5                 40             revenues and lower income from manufacturer
 Other operating income, net                                         (2)                 3             product price changes
Operating Earnings                                                  $49                  ($9)       Increased SG&A expenses were driven by decreased
 % margin                                                          2.1%               (0.4%)           sales activity, partially offset by cost control and
($ in millions)                                          Fiscal Year Ended December 31,                productivity initiatives
                                                            2016               2017
                                                                                                FY 2017 vs. FY 2016
 Domestic                                                       $9,191             $8,794
                                                                                                    Revenue:
 International                                                     344                392
 Proprietary Products                                              540                504            Net revenue declined primarily as a result of the exit
 Inter-segment                                                    (351)              (372)              of a large domestic customer in 2016
Total Net Revenue                                               $9,723             $9,318            Lower growth with existing customers when
 % growth                                                        (0.5%)             (4.2%)
                                                                                                        compared to 2016
Gross Margin                                                    $1,187             $1,172           Gross Margin & Operating Earnings:
 % margin                                                       12.2%              12.6%
                                                                                                     Operating earnings were negatively affected by
 Distribution, selling and administrative expenses                 $970            $1,017               increased production costs in the Proprietary
 Acquisition-related and exit and realignment charges                25                61
                                                                                                        Products segment and margin pressure in the
 Other operating income, net                                         (7)                5
                                                                                                        Domestic distribution business, which was partially
Operating Earnings                                                 $200                $89
                                                                                                        offset by cost control initiatives
 % margin                                                          2.1%               1.0%

37
Halyard S&IP Historical Financial Performance
                                         Net Sales                                                                                                           Adjusted EBITDA(1)
$ in millions                                                                                                               $ in millions

                                                                                                                                          $112
                                                                                                                                                                            $97
                                                                                                                                                                                              $83
          $1,065                                $1,026                               $1,013
                                                                                                                                         10.5%                              9.5%
                                                                                                                                                                                              8.2%

                                                                                                                                          2015                              2016              2017
            2015                                 2016                                 2017
                                                                                                                                                          Adjusted EBITDA          % Margin

                           Capital Expenditures                                                                                                               Free Cash Flow (2)
$ in millions                                                                                                             $ in millions

            $27

                                                                                      $15                                                                                   $86
                                                                                                                                          $85
           2.5%                                  $11                                                                                                                                          $69
                                                                                     1.5%
                                                1.1%

           2015                                  2016                                 2017                                               2015                               2016              2017
                         Capital Expenditures                  % of Net Sales

 38   ____________________
      (1) For a reconciliation of Net Income to S&IP Adjusted EBITDA, see slide 42.
      (2) Free cash flow defined as S&IP Adjusted EBITDA less capital expenditures. For a reconciliation of Net Income to free cash flow, see slide 42.
APPENDIX
Owens & Minor Adjusted EBITDA Reconciliation
($ in millions)                                                           FYE December 31,                                         1•     LIFO charges and credits are non-cash and related to price
                                                        2013           2014     2015      2016                      2017                  appreciation or deflation and year-end inventory levels
                                                                                                                                   2•     Share-based compensation expense is a non-cash charge recognized
Net Income                                              $110.9           $66.5        $103.4         $108.8           $72.8
                                                                                                                                          over the vesting period of the restricted stock issuances
     Interest Expense                                       13.1           18.2           27.1           27.1           31.8       3•     Acquisition-related charges in 2017 were primarily transaction and
                                                                                                                                          transition costs associated with the acquisition of Byram and the
     Income Tax Provision (Benefit)                         74.1           60.0           69.8           63.8          (15.3)             upcoming Halyard S&IP transaction. Prior year amounts related
                                                                                                                                          primarily to costs incurred to settle certain obligations and address
     Depreciation and Amortization                          50.6           63.4           66.0           55.4           59.4
                                                                                                                                          other on-going matters associated with the acquisitions of ArcRoyal
 1 Increase (Decrease) in LIFO Reserve                      (2.3)           7.6            0.7           (0.8)           4.4              and Medical Action
                                                                                                                                   4•     Exit and realignment charges in 2017 were associated with severance
 2 Stock Based Compensation Expense                          6.4            8.2           11.3           12.0           11.9              from reduction in force and other employee costs associated with the
                                                                                                                                          establishment of our new client management centers, the write-
 3 Acquisition-Related Charges                               3.5           16.1            9.8            1.2           17.3              down of information system assets which are no longer used and
                                                                                                                                          other IT restructuring charges. Charges in 2016 included severance
 4 Exit & Realignment Charges                                8.9           26.7           18.6           23.5           43.4
                                                                                                                                          activities and other costs associated with our strategic organizational
 5 SaaS Implementation Costs                                    --             --             --             --         13.4              realignment which included certain professional fees and costs to
                                                                                                                                          streamline administrative functions and processes in the U.S. and
     Fair Value Adjustment Related to                           --         (3.7)              --             --             --            Europe
                                                                                                                                   5•     Software as a Service implementation (SaaS) costs associated with
       Purchase Accounting
                                                                                                                                          the upgrading of global IT platforms in connection with the redesign
     Loss on Early Retirement of Debt                           --         14.9               --             --             --            of our global information system strategy
                                                                                                                                   6•     Byram Adjusted EBITDA reconciliation:
     Other                                                      --          3.9           (1.5)              --             --
                                                                                                                                           ($ in millions)                                    Seven Months
 6 Byram EBITDA Pre-Acquisition                                 --             --             --             --         17.5                                                               Jan 2017 - July 2017
                                                                                                                                           Net income (GAAP)                                              ($1.4)
                     (1)                                $265.2         $281.8         $305.3         $290.9         $256.6                 Interest expense                                                 0.3
Adjusted EBITDA
                                                                                                                                           Income Tax Provision (Benefit)                                   3.1
                                                                                                                                           Depreciation and Amortization                                    3.6
Capital Expenditures                                       (60.1)         (70.8)         (36.6)         (30.1)         (50.7)
                                                                                                                                           Transaction Expenses                                            10.2
                                                                                                                                           IC Recharges from Parent Company                                 1.7
Free Cash Flow (1)                                      $205.1         $211.0         $268.7         $260.8         $205.9                 Adjusted EBITDA                                                $17.5

      ____________________
      (1) The Company believes that Adjusted EBITDA and free cash flow provide meaningful supplemental information about its operating performance because these metrics exclude
40         amounts that the Company does not consider part of its core operating results when assessing its performance. Management uses these non-GAAP financial measures internally to
           evaluate the Company’s performance, evaluate the balance sheet, engage in financial and operational planning and determine incentive compensation. Adjusted EBITDA is also
           used for certain covenants and restricted activities under the Company’s debt agreements.
Byram Adjusted EBITDA Reconciliation

                 ($ in millions)                                                         2017 Pre-                                2017 Post-                                     FY
                                                                                        Acquisition                              Acquisition                                   2017
                                                                                     1/1/17 - 8/1/17                        8/1/17 - 12/31/17                   12 months ended 12/31/17

                 Net income (GAAP)                                                                          ($1.4)                                    $8.4                              $7.0
                 Interest expense                                                                              0.3                                      4.7                              5.0
                 Income Tax Provision (Benefit)                                                                3.1                                     (5.9)                            (2.7)
                 Depreciation and Amortization                                                                 3.6                                      7.6                             11.2
                 Transaction Expenses                                                                        10.2                                       4.3                             14.6
                 IC Recharges from Parent Company                                                              1.7                                         --                            1.7

                 Adjusted EBITDA                                                                           $17.5                                    $19.2                              $36.7

                 Net Revenue                                                                             $258.0                                   $209.2                              $467.2

41   ____________________
     (1) The Company believes that Adjusted EBITDA provides meaningful supplemental information about Byram’s operating performance because these metrics exclude amounts that are
          not considered part of its core operating results when assessing its performance.
S&IP Adjusted EBITDA Reconciliation
($ in millions)                                                                     FYE December 31,                           1•   Under GAAP, Halyard corporate overhead expense is allocated
                                                                                2015      2016     2017                             based on revenue or headcount allocation percentages. S&IP
                                                                                                                                    management performed an analysis to estimate the costs for the
Net Income                                                                     ($457.0)           $8.0           $0.2
                                                                                                                                    S&IP business to operate on a stand-alone basis. This adjustment is
Income Tax (Benefit) Provision                                                       7.4            6.5           (6.2)             to exclude costs applied to the Halyard S&IP business under GAAP
Depreciation & Amortization                                                        24.0           23.4           24.1               that are not expected to burden the S&IP business on a stand-
                                                                                                                                    alone basis.
EBITDA                                                                         ($425.6)         $37.9          $18.1
                                                                                                                               2•   Includes adjustments relating to capitalized variances, EMEA
 1 Corporate P&L                                                                $546.9          $75.4          $76.4
                                                                                                                                    customs and duties, Kimberly Clark royalty revenue, pension
                                                                                                                                    adjustments, and depreciation and amortization (to bridge from
 2 Other Carve-out Adjustments                                                       0.3            4.4            2.0              segment reported amounts to the carve-out financials)

     Post-spin one-time, out of period items                                        (0.7)           0.8              --        3•   Includes adjustments for certain items related to the transaction
                                                                                                                                    perimeter including rolled goods, Kimberly Clark royalty revenue,
 3 Transaction perimeter adjustments                                                 2.1           (1.3)           0.7              and Enayah minority interest
 4 LIFO adjustment                                                                  (5.2)          (2.1)           1.1         4•   Management tracks inventory on a FIFO basis but reports
                                                                                                                                    financials on a LIFO basis
 5 Capitalized variances                                                             0.4           (0.6)           2.3
                                                                                                                               5•   S&IP records inventory on a FIFO basis and records variances in the
     Enayah royalty revenue normalization                                              --           0.5           (0.5)             P&L in the month incurred rather than capitalizing and recording
                                                                                                                                    upon sale; this adjustment reflects capitalizing variances
     Out-of-period chargeback adjustments                                              --          (0.4)           0.4
                                                                                                                                    historically
     Distribution expense accrual reversal                                             --           0.5           (0.5)        6•   Represents management’s estimates of incremental costs for S&IP
     Passed audit adjustment                                                        (0.4)             --             --             to operate as a standalone business, rather than as a separate unit
                                                                                                                                    within a larger corporate organization
     Depreciation and amortization variance                                          0.4           (2.2)             --

 6 Standalone adjustment & Hourly Benefits Overaccrual                              (5.6)        (15.4)         (16.9)

Adjusted EBITDA (1)                                                             $112.6          $97.5          $83.3

Capital Expenditures                                                              (26.9)         (11.1)         (14.7)

Free Cash Flow (1)                                                                $85.7         $86.4          $68.6

42    ____________________
      (1) The Company believes that EBITDA, Adjusted EBITDA, and free cash flow provide meaningful supplemental information about S&IP’s operating performance because these metrics
           exclude amounts that are not considered part of its core operating results when assessing its performance.
You can also read