Diffuse X-ray Scattering from Correlated Motions in a Protein Crystal - bioRxiv
←
→
Page content transcription
If your browser does not render page correctly, please read the page content below
bioRxiv preprint first posted online Oct. 17, 2019; doi: http://dx.doi.org/10.1101/805424. The copyright holder for this preprint
    (which was not peer-reviewed) is the author/funder, who has granted bioRxiv a license to display the preprint in perpetuity.
                                  It is made available under a CC-BY-NC-ND 4.0 International license.

         Diffuse X-ray Scattering from Correlated Motions in a
                            Protein Crystal
                           Steve P. Meisburger1,2 , David A. Case3 , Nozomi Ando1,2*

1
  Department of Chemistry, Princeton University, Princeton, New Jersey 08544, USA.
2
  Department of Chemistry and Chemical Biology, Cornell University, Ithaca, New York 14850, USA.
3
  Department of Chemistry and Chemical Biology, Rutgers University, Piscataway, New Jersey 08854,
USA.
*
  Correspondence to: nozomi.ando@cornell.edu

Abstract: Protein dynamics are integral to biological function, yet few techniques are sensitive to col-
lective atomic motions. A long-standing goal of X-ray crystallography has been to combine structural
information from Bragg diffraction with dynamic information contained in the diffuse scattering back-
ground. However, the origin of macromolecular diffuse scattering has been poorly understood, limiting
its applicability. We present a detailed diffuse scattering map from triclinic lysozyme that resolves both
inter- and intramolecular correlations. These correlations are studied theoretically using both all-atom
molecular dynamics and simple vibrational models. Although lattice dynamics reproduce most of the
diffuse pattern, protein internal dynamics, which include hinge-bending motions, are needed to explain
the short-ranged correlations revealed by Patterson analysis. These insights lay the groundwork for ani-
mating crystal structures with biochemically relevant motions.

Introduction
Conventional structure determination by X-ray crystallography relies on the intense spots recorded in
diffraction images, known as Bragg peaks, that represent the average electron density of the unit cell.
The average electron density is blurred when atoms are displaced from their average positions, leading
to a decay in the Bragg intensities and giving rise to a second signal: a continuous pattern known as
diffuse scattering (1, 2). Although disorder is routinely modeled in structure refinement of Bragg data
as atomic displacement parameters (ADPs) or B-factors (3), information about whether groups of atoms
move independently or collectively is contained only in the diffuse scattering (Fig. S1). However, the
diffuse signal is weak compared to Bragg data and challenging to accurately measure. Diffuse scattering
has therefore been largely ignored in macromolecular crystallography, and instead, atomic motions have
been inferred solely from Bragg data (4–6).
    The potential of diffuse scattering as a probe of protein dynamics was envisioned over 30 years ago
when Caspar, et al. (7) attributed the cloudy diffuse signal from an insulin crystal to liquid-like internal
motions. More recently, it has been proposed that diffuse scattering can also disambiguate common
structure refinement models that fit collective motions of atoms to ADPs (8). Motivated by these key
ideas, a number of models of protein motion have been proposed to explain macromolecular diffuse

                                                                          1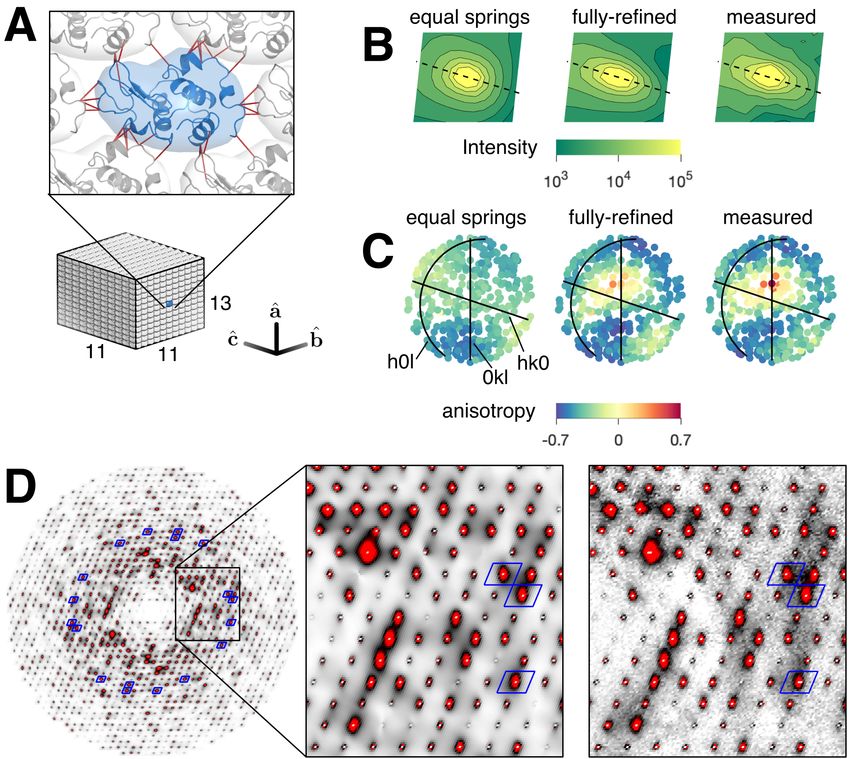
bioRxiv preprint first posted online Oct. 17, 2019; doi: http://dx.doi.org/10.1101/805424. The copyright holder for this preprint
 (which was not peer-reviewed) is the author/funder, who has granted bioRxiv a license to display the preprint in perpetuity.
                               It is made available under a CC-BY-NC-ND 4.0 International license.

scattering (2, 9–13). However, in all cases to-date, agreement between measurement and simulation has
been far from compelling (14–20), and thus, the promise of diffuse scattering has not yet been realized.
    The main bottleneck in the field has been the lack of accurate data. In particular, the diffuse pattern
is typically a small oscillation on top of a large background and is therefore easily corrupted by intense
Bragg peaks. Thus, it has been common practice to heavily process images either by filtering or masking
near-Bragg pixels (14,17). However, this treatment suppresses features that are derived from long-ranged
correlations extending beyond the unit cell and may also alter the information contained in the remaining
signal. The emerging view is that long-ranged correlations must be considered (2, 19, 21), but despite the
advent of pixel array detectors that are newly enabling (22, 23), diffuse scattering data capable of testing
such models have not been reported.
    To understand the fundamental origins of diffuse scattering from protein crystals, we analyzed the
total scattering from the triclinic form of hen lysozyme (Fig. 1A) collected at ambient temperature using
a photon-counting pixel array detector (Fig. S2A). The triclinic crystals (24) feature low mosaicity and
importantly, one protein molecule per unit cell, ensuring that features between the Bragg peaks are fully
resolved. By combining high quality experimental data with new processing methods, we were able to
construct a highly detailed map of diffuse scattering without filtering the images. This map reveals, for
the first time, a surprisingly large contribution of long-ranged correlated motions across multiple unit
cells, while also enabling detection of protein motions in a manner that is consistent with both Bragg
diffraction and diffuse scattering.

Results
Construction of a three-dimensional reciprocal space map. For accurate measurements of diffuse
scattering at room temperature, the main challenges are to avoid contamination by Bragg peaks and
background scattering and to achieve high signal-to-noise while avoiding radiation damage. Using well-
collimated and monochromatic synchrotron radiation, we measured the angular broadening (apparent
mosaicity) of our triclinic lysozyme crystals to be 0.02 to 0.03 degrees, which is as small as could be
resolved by the diffraction instrument (25). With such low mosaicity, the sharp, Gaussian-shaped Bragg
peaks are readily distinguished from the underlying diffuse scattering (Fig. S3A). To take advantage
of this low mosaicity, data were collected with fine phi-slicing (0.1 deg). Crystals were held in low-
background capillaries (Fig. S2A), and low-dose partial datasets were collected from multiple sample
volumes. In total, four crystals yielded 5500 images from 11 different sample volumes (Fig. S2B, Table
S1). Using standard crystallography methods, we determined a structure to 1.21 Å (Table S2) that agrees
well with a previously reported room-temperature structure (PDB ID 4lzt (24), 0.14 Å r.m.s.d.). Analysis
of the structure and Bragg intensities shows that radiation damage effects were minimal (Fig. S4).
    A three-dimensional diffuse map (Fig. 1B) was constructed from the same set of images (described in
detail in Supplementary Methods). Background scattering varied with spindle angle (Fig. S2A, S5) and
was therefore subtracted frame-by-frame (Fig. S2C). Scale factors for each image pixel were calculated
from first principles to account for X-ray beam polarization, detector absorption efficiency, solid angle,
and attenuation by air. Additionally, we utilized the high data redundancy to correct for other experi-
mental artifacts, including self-absorption of the crystal, changes in illuminated volume, differences in
efficiency among the detector chips, and excess scattering from the loop and liquid on the surface of the
crystal (Fig. S6). Each of these corrections improved data quality (Fig. S7). The data were accumu-
lated on a fine reciprocal space grid such that the Bragg peaks were entirely contained within the voxels
centered on the reciprocal lattice nodes (Fig. S3B). In this grid, the reciprocal lattice vectors a∗ , b∗ , and
c∗ are subdivided by 13, 11, and 11, respectively. The map had a maximum resolution of 1.25 Å, and

                                                                       2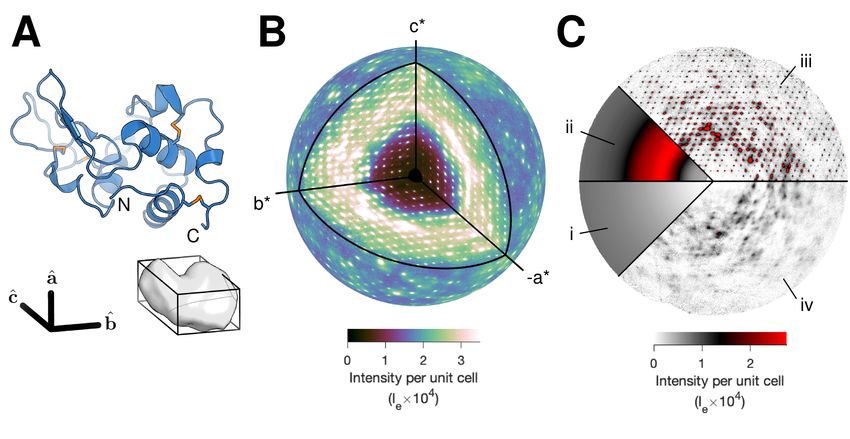
bioRxiv preprint first posted online Oct. 17, 2019; doi: http://dx.doi.org/10.1101/805424. The copyright holder for this preprint
 (which was not peer-reviewed) is the author/funder, who has granted bioRxiv a license to display the preprint in perpetuity.
                               It is made available under a CC-BY-NC-ND 4.0 International license.

Friedel pairs were averaged, for a total of ∼ 50 million unique voxels.
    To enable rigorous comparison between simulations and experiment, we adapted the integral method
of Krogh-Moe (26,27) to place the map on an absolute scale of electron units per unit cell (Supplementary
Methods, Fig. S8). By doing so, we are able to subtract the inelastic scattering contribution, which
depends only on the atomic inventory and is insensitive to molecular structure (Fig. 1C, i). The final
diffuse map thus represents coherent scattering features of interest (Fig. 1B), which depends on structure.

Phonon-like scattering. The diffuse scattering is dominated by a broad, isotropic scattering ring with
a peak at ∼ 3 Å (Fig. 1C, ii) that arises from short-ranged disorder generally attributed to water (28, 29).
To better visualize the non-isotropic fluctuations, we resampled the full map mid-way between the Bragg
peaks and defined the isotropic background as one sigma level below the mean scattering of this map
in each resolution bin (Supplementary Methods, Fig. S9). Subtracting this background from the full
map reveals clear non-isotropic features, hereafter referred to as “variational” (Fig. 1C, iii-iv). The most
striking variational features are the intense halos (Fig. 1C, iii) that appear to co-localize with Bragg peaks
at the reciprocal lattice nodes (Fig. 1B), which are significantly asymmetric in certain directions (Fig.
S10, left). Overlaid with the halos is a cloudy pattern that is found throughout the map (Fig. 1C, iv),
which we estimate accounts for roughly half of the integrated variational intensity in most resolution bins
(Fig. S11).
     The presence of such clear halo scattering was unexpected as it implies that there are correlations be-
tween atoms in different unit cells. In protein crystallography, an outstanding question has been whether
such correlations are dynamic in nature, and specifically, due to lattice vibrations (7, 9, 15, 21, 28, 30).
The scattering intensity of a phonon (vibrational mode) is proportional to the mean squared amplitude
of vibration and peaks at certain points in reciprocal space. In particular, a phonon with wavevector k
makes the greatest contribution when the scattering vector q (with magnitude |q| = 2π/d) is parallel to
the phonon polarization and displaced from the nearest Bragg peak at q0 such that q − q0 = ±k (31).
The scattering of the so-called acoustic phonons, which are thermally excited at room temperature, is
proportional to vs−2 |k|−2 , where vs is the speed of sound. Thus, at the Bragg peak locations, acoustic
phonon scattering is expected to produce halos with a characteristic |q − q0 |−2 decay in intensity in any
given direction.
     With our finely sampled diffuse map, the halo scattering can be inspected directly. We selected three
symmetric and intense halos and plotted their intensities along the three reciprocal axes on a double-
log scale, where a power law is a straight line (Fig. 2A, left). Both the power-law behavior and the
characteristic exponent are fully consistent with acoustic phonon scattering. Furthermore, the fact that
the plot remains linear as q approaches q0 implies that the lattice vibrations are coherent over at least
2π/|kmin | ∼ 300 Å or ∼ 10 unit cells. The characteristic exponent of approximately −2 is also found for
other intense halos throughout the map (Fig. 2A, right). These results are highly suggestive of vibrational
lattice dynamics.

All-atom molecular dynamics simulations. Although all-atom MD simulations have previously been
used to investigate the contribution of protein dynamics to diffuse scattering (12,16,29,32–34), the effect
of long-ranged correlations due to lattice disorder has not been examined. We thus performed all-atom
MD simulations of triclinic lysozyme crystals as a function of supercell size (Supplementary Methods).
Experimentally determined coordinates were used to define and initialize an array of proteins compris-
ing the supercell, and periodic boundary conditions were imposed to remove edge effects. Supercells
composed of 1, 27 (3x3x3), 125 (5x5x5), and 343 (7x7x7) unit cells were simulated for 5, 5, 2, and 1
µs, respectively. Guinier’s equation (35) was used to calculate the diffuse intensity per unit cell from

                                                                       3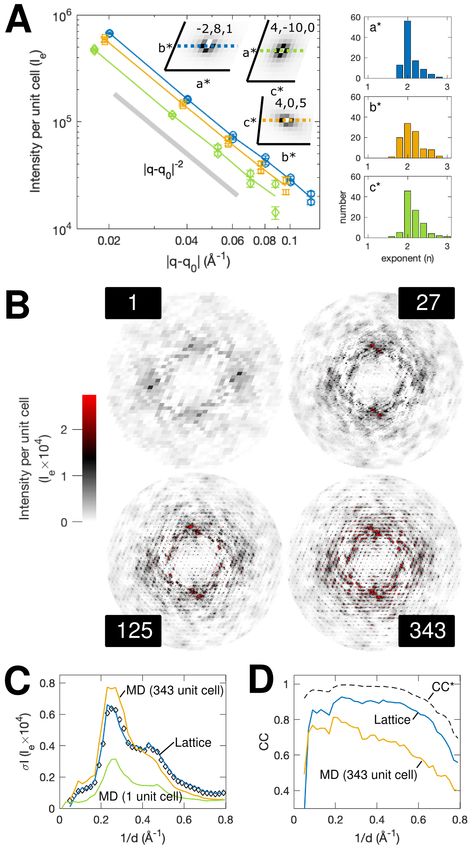
bioRxiv preprint first posted online Oct. 17, 2019; doi: http://dx.doi.org/10.1101/805424. The copyright holder for this preprint
 (which was not peer-reviewed) is the author/funder, who has granted bioRxiv a license to display the preprint in perpetuity.
                               It is made available under a CC-BY-NC-ND 4.0 International license.

the simulation trajectory (Supplementary Methods). Because the boundary conditions are periodic, the
diffuse scattering was sampled at integer subdivisions of the reciprocal lattice (i.e. the number of unit
cells in each direction).
    In the 1 unit-cell simulation (Fig. 2B), cloudy variational features are observed in rough qualitative
agreement with the experiment (Fig. 1C, iii-iv), suggesting that local protein and solvent dynamics con-
tribute to the observed diffuse scattering. Unlike simpler models that do not include liquid correlations
in the bulk solvent, MD provides a prediction for the isotropic component (Fig. S9C). The overall cor-
relation of the isotropic component is 0.9965 between 25 and 1.25 Å resolution, and the magnitude is
also similar (Fig. S8A,C). However, halos are absent, consistent with the lack of intermolecular disor-
der enforced by a 1 unit-cell simulation. As the size of the supercell is increased, the diffuse scattering
pattern evolves in a complex manner with the halos becoming increasingly apparent (Fig. 2B), confirm-
ing that they depend on intermolecular correlations and lattice degrees of freedom. In the 343 unit-cell
simulation, the r.m.s. displacement of each chain about its center of mass was 0.20 to 0.22 Å in each
direction. Although this may seem to be a small motion, the intense halo signal is derived from the
collective motions of many proteins.
    In the 343 unit-cell simulation (Fig. 2B), the simulated scattering contains both cloudy and halo
features similar to those observed experimentally. To make a quantitative comparison, we interpolated
the experimental map on the simulation grid (7x7x7) and computed the Pearson correlation coefficient
(CC) between the two in thin shells of constant resolution (Fig. 2D, orange). Although we obtain a
reasonable CC of ∼ 0.7 up to 2 Å resolution, the CC decreases at higher resolution. Moreover, there is
a significant gap between CC (Fig. 2D, orange) and CC* (Fig. 2D, black dashed), which estimates the
maximum CC a model can achieve, given the precision of the data (36). This discrepancy indicates that
model-data agreement is not limited by noise and instead points to shortcomings of the crystal model,
including the current MD force fields. In particular, the accuracy of MD for diffuse scattering appears to
be limited by errors in the average electron density (Fig. S12). To gain insight into the underlying physics
of the variational scattering features, we thus sought simpler dynamical models that can be refined to fit
both the Bragg and diffuse data.

Lattice dynamics refined against diffuse scattering. Given the evidence for acoustic phonon scatter-
ing, we investigated whether vibrational models can capture the observed halo shapes and intensities. We
developed a lattice dynamics model where each protein is able to move as a rigid body that is connected
to neighboring molecules via spring-like interactions (detailed in Supplementary Methods). The pro-
teins were arranged in a 13x11x11 supercell to match the sampling of the experimental map (Fig. 3A).
Residues of neighboring molecules that form lattice contacts were linked by a pair potential between
alpha carbons (Fig. 3A, magenta lines), reflecting a restoring force that depends on the relative displace-
ments of the two end-points. For generality, we allowed each pair potential to be a linear combination
of two types of springs: Gaussian and directional. Gaussian springs (37) have a restoring force that is
independent of the direction of the displacement relative to the spring, and directional springs (38) have
a restoring force only along the vector between the end points.
    The model was refined against a set of 400 intense halos between 2 and 2.5 Å resolution, consisting of
a total of ∼600,000 voxels. As there are halos associated with all 30,108 unique Bragg reflections, these
400 represent a small subset (1.3%). The spring constants were initially restrained to be all Gaussian and
equal, and restraints were relaxed during subsequent stages of refinement. For a given set of springs, the
equations of motion were solved by the Born/Von-Karman method (31, 39, 40), and the diffuse scatter-
ing was calculated using the one-phonon approximation (detailed in Supplementary Methods). At each
refinement stage, we monitored the overall χ2 value between the experimental and simulated scattering
(Fig. S13A), as well as the ability of the model to reproduce the halo shape (Fig. 3B). To monitor agree-

                                                                       4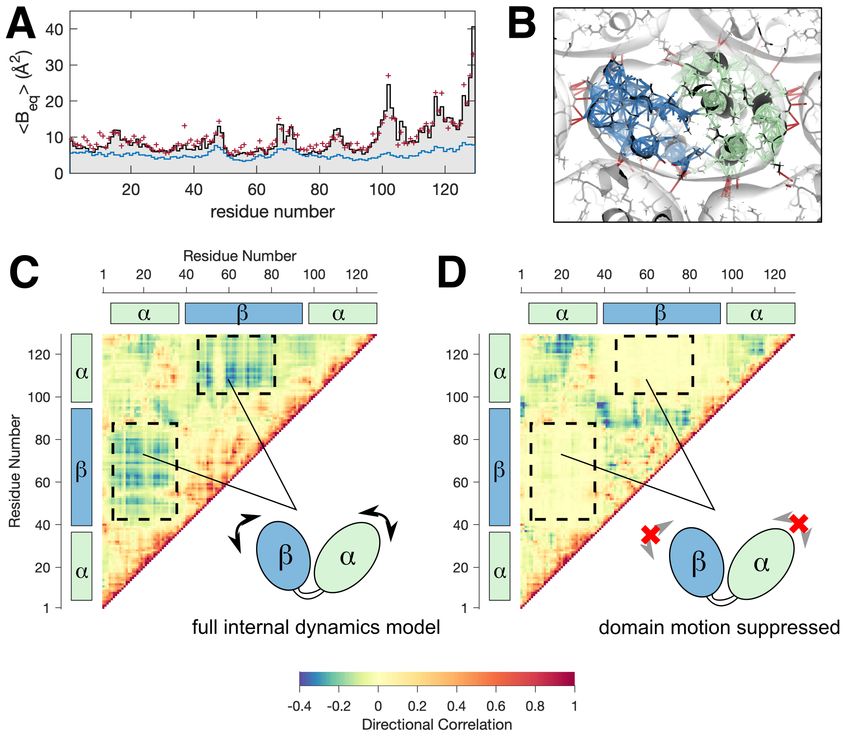
bioRxiv preprint first posted online Oct. 17, 2019; doi: http://dx.doi.org/10.1101/805424. The copyright holder for this preprint
 (which was not peer-reviewed) is the author/funder, who has granted bioRxiv a license to display the preprint in perpetuity.
                               It is made available under a CC-BY-NC-ND 4.0 International license.

ment with halo anisotropy, we fit each of the halos to a function of the form I = [(q − q0 )G(q − q0 )]−1 ,
where G is a 3x3 positive definite matrix, and defined an anisotropy parameter, a = G⊥ /Gk − 1, where
Gk is the component of G parallel to q0 , and G⊥ is the average of the perpendicular components. The
fully-parameterized model was necessary to reproduce the pattern of halo anisotropy (Fig. 3C, Fig.
S13B).
    After refining the lattice dynamics model using the working set of 400 halos (Fig. 3D, blue boxes),
we simulated the complete diffuse scattering map over the full resolution range. Remarkably, the sim-
ulation reproduces many of the variational scattering features observed in experiment (Fig. 3D, right).
Anisotropic halo shapes are reproduced even in regions of the map that were not used to refine the model
(Fig. 3D, regions outside of blue boxes). Streaks in the pattern are also reproduced and can be attributed
to a modulation of the halos by the molecular transform (Fig. S10). Moreover, we find that the halos do
not decay to zero mid-way between the Bragg peaks as previously expected (9), giving rise to a cloudy
pattern that resembles the cloudy variational scattering in the data (Fig. 3D, right). The standard devia-
tions of intensity have very similar profiles and absolute magnitudes (Fig. 2C, blue solid and diamonds),
suggesting that the lattice dynamics make the most significant contribution to the scattering variations.
This conclusion is supported by the much smaller variations seen in the 1 unit-cell MD simulation (Fig.
2C, purple), where lattice disorder is absent by construction.
    As before, the agreement between the experimental and simulated maps was assessed with CC and
CC*. For the lattice dynamics model, the CC is excellent in regions of high signal-to-noise (CC ∼ 0.9
between 2 and 5 Å resolution) (Fig. S14, solid) and only limited by the experimental precision at higher
resolution (Fig. S14, dashed). To improve the signal-to-noise, the maps were interpolated on a 7x7x7
grid (Fig. 2D, blue), enabling direct comparison with the 343 unit-cell MD simulation (Fig. 2D, orange).
Strikingly, the lattice dynamics model clearly outperforms all-atom MD (Fig. 2C-D).
    The lattice model can be further assessed against existing biophysical data. Our model predicts that
sound waves should propagate through the crystal. Based on the calculated dispersion relations of the
acoustic vibrational modes (Fig. S15), we obtain longitudinal sound velocities of 1.0-1.3 km/s and corre-
sponding transverse velocities that are slower by a factor of 1.3-2.1 depending on the propagation direc-
tion (Table S3). Although few measurements of sound propagation have been made in protein crystals,
longitudinal velocities have generally been reported to be ∼ 2 km/s (41–43), and transverse velocities
are estimated to be 2-3 times slower (41, 44). Thus, our interpretation that the halo scattering arises from
dynamic, rather than static, disorder appears physically reasonable.

Contribution of lattice dynamics to atomic motion. As described earlier, the amount of apparent
motion for each atom can be quantified from Bragg data by refining individual ADPs, the 6 components
needed to describe a 3-dimensional Gaussian probability distribution. Our data quality was sufficient to
refine full anisotropic ADPs for every non-H atom. To determine the extent to which lattice dynamics
contribute to atomic motion, corresponding ADPs were calculated directly from the refined lattice model
(Supplementary Methods, Table S4). In Fig. 4A, the full ADPs of the backbone atoms are reduced to
a single isotropic B-factor per residue to facilitate visual comparison. Overall, the backbone B-factors
                             2                                                    2
for the lattice model (5.2 Å on average) fall below those of experiment (9.4 Å on average). The B-
factors from the lattice model show small variations, which can be attributed to rigid-body rotational
motion with an r.m.s. amplitude of 0.8◦ (Table S4). However, the B-factor variations in the data are much
more pronounced (Fig. 4A), particularly for side-chains (Fig. S16A). These residual B-factors imply the
existence of internal dynamics, in other words, that atoms within the protein undergo collective motions.

                                                                       5
bioRxiv preprint first posted online Oct. 17, 2019; doi: http://dx.doi.org/10.1101/805424. The copyright holder for this preprint
(which was not peer-reviewed) is the author/funder, who has granted bioRxiv a license to display the preprint in perpetuity.
It is made available under a CC-BY-NC-ND 4.0 International license.
Protein dynamics refined against Bragg data. The collective motions of lysozyme have been a topic
of long-standing biophysical interest since hinge-bending motions between the two domains (Fig. 4B,
blue and green) were first proposed as a mechanism for substrate binding and release (45, 46). To in-
vestigate the presence of such collective motions, we developed an elastic network model, in which
each protein residue moves as a rigid body, and all non-H atoms within 4 Å are coupled with directional
springs (Supplementary Methods). As with the lattice model, the crystal environment was modeled with
intermolecular springs and periodic boundary conditions, and the dynamics were calculated using the
Born/Von-Karman method. In order to model only the internal protein dynamics, the Hessian matrix
describing the restoring forces was modified to suppress rigid-body motion of the entire protein. The
model was parametrized with one coupling constant per residue (i.e. 129 free parameters total) so that
springs joining a residue pair were assigned a spring constant equal to the geometric mean of the coupling
constants (Supplementary Methods). The parameters were then refined by minimizing the least-squares
difference between all components of the calculated (lattice + internal) and experimental ADPs derived
from Bragg data.
The refined model is able to reproduce the pattern of B-factors obtained experimentally (Figs. 4A and
S16A,B). To assess the importance of hinge-bending in the model, we examined the covariance matrices
Cij for all alpha carbon pairs and calculated a "directional correlation", which is the component of Cij
along the inter-atomic vector normalized by the r.m.s. displacements of the two atoms (Supplementary
Methods). By this measure (Fig. 4C), the two domains are significantly anti-correlated as expected for
hinge-bending motion.
Contribution of protein dynamics to diffuse scattering. Lattice dynamics account for the bulk of the
variational diffuse scattering, as evaluated by CC and standard deviation (Fig. 2C-D). However, these
statistics emphasize the most intense features in the signal, which in this case are the halos. To assess the
more subtle contributions of internal protein motions, correlations in the signal should be separated based
on length-scale. We thus calculated the diffuse Patterson (also known as 3D-∆PDF), which is the Fourier
transform of the diffuse scattering. The diffuse Patterson map represents the mean autocorrelation of the
difference electron density, ∆ρ = ρ − hρi, such that a vector from the origin of the map corresponds to
a vector between two points in the crystal. Thus, the central part of the diffuse Patterson is affected only
by those correlations that are short-ranged.
At large distances, the experimental diffuse Patterson displays peaks at the lattice nodes as expected
(Fig. 5A, left), whereas continuous features are most intense at short distances (Fig. 5A, right). To deter-
mine whether lattice dynamics alone can account for the short-ranged correlations, the diffuse Patterson
was calculated directly from the refined lattice model (Supplementary Methods). Although the simulated
and experimental maps share similar features (Fig. 5A-B), the amplitudes of the fluctuations are clearly
underestimated for distances shorter than ∼ 10 Å (Fig. 5F, blue curve vs. diamonds).
In contrast, the diffuse Patterson calculated from the refined internal motion model shows prominent
fluctuations for pair distances less than ∼ 10 Å but very little outside this range (Fig. 5C and Fig.
5F, green). Assuming that the protein internal motions are independent of lattice motions, the diffuse
Patterson maps can be added (Fig. 5D). The combined model displays remarkable agreement with the
experimental map and reproduces the characteristic decay of fluctuation amplitude almost exactly (Fig.
5F, dark red curve vs. diamonds). To assess the agreement more quantitatively, the CC profile was
calculated in reciprocal space (a Fourier transform of the 2 < r < 25 Å region). The combined model
(Fig. 5G-H, dark red) displays a significant gain in CC over the lattice model alone (Fig. 5G-H, blue).
The level of model-data agreement that we obtain is excellent (Fig. 5G, dark red), especially when
compared to the all-atom MD simulation (Fig. 5E and Fig. 5G, orange) as well as all previously reported
studies (14, 15, 17–20, 33). However, it is still less than the theoretical maximum of our diffuse Patterson
6bioRxiv preprint first posted online Oct. 17, 2019; doi: http://dx.doi.org/10.1101/805424. The copyright holder for this preprint
(which was not peer-reviewed) is the author/funder, who has granted bioRxiv a license to display the preprint in perpetuity.
It is made available under a CC-BY-NC-ND 4.0 International license.
map (Fig. 5G, dotted). CC* is ∼ 1 for most resolution bins as truncating the Patterson function is
equivalent to band-pass filtering the intensities, and it greatly increases signal-to-noise. Thus, there is
room for improvement if better models can be devised.
The question of model quality has consequence to protein crystallography, where it is common prac-
tice to fit models of collective motion to the B-factors, since this often increases the data-to-parameter
ratio. Diffuse scattering has been proposed as a means of critically evaluating these models (8). To
explore this idea, we repeated refinement of the internal elastic network model with domain motions
selectively suppressed. Although the internal dynamics are significantly different in this model (Fig.
4D), they also reproduce the experimentally derived B-factors (Fig. S16C). This result underscores the
challenges of distinguishing differing models of protein motion from Bragg data alone. However, fluctu-
ations in the diffuse Patterson decay more rapidly with domain motions suppressed (Fig. S17), leading
to a subtle but systematically worse CC, particularly at high resolution (Fig. 5H, dashed).
Conclusions
By studying the total X-ray scattering from triclinic lysozyme crystals both experimentally and theoreti-
cally, we were able to obtain fundamental insight into the collective motions that produce macromolecular
diffuse scattering. Simple vibrational models of the lattice and internal dynamics were developed that
explain the electron density correlations spanning two orders of magnitude in length-scale. Vibrations
of the entire protein in the lattice account for the shapes and magnitudes of the diffuse halo features and
about half of the backbone ADPs, while internal motions of the protein make up the remainder. The col-
lective nature of these internal motions was investigated by diffuse Patterson analysis, which separates
correlations based on the inter-atomic vector. Remarkably, we found that two models that fit the ADPs
equally well could be distinguished by their agreement to the experimental diffuse Patterson, experimen-
tally demonstrating a key application of diffuse scattering proposed a decade ago (8). Finally, although
the MD was limited in its ability to reproduce the variational diffuse scattering, our results demonstrate
that this signal provides an excellent experimental benchmark for improving simulations in the future.
For over 30 years, the ultimate goal of diffuse scattering studies has been to capture internal protein
motions from crystallographic data. The success of previous efforts has been limited primarily by data
quality as well as the assumption that the variational scattering is largely due to internal motion. In
fact, lattice disorder contributes significantly, further underscoring the need for detailed, high quality
data and realistic models. Despite the added challenges, we have also shown that by accounting for
lattice dynamics, the remaining diffuse signal indeed contains information about internal motion and can
be used to differentiate alternate models. With the initial goal of the diffuse scattering field realized, the
next grand challenge of refining structural models that are consistent with the total scattering now appears
within reach.
References
1. T. R. Welberry, T. Weber, One hundred years of diffuse scattering, Crystallogr. Rev. 22, 2 (2016).
2. S. P. Meisburger, W. C. Thomas, M. B. Watkins, N. Ando, X-ray Scattering Studies of Protein
Structural Dynamics, Chem. Rev. 117, 7615 (2017).
3. J. D. Dunitz, V. Schomaker, K. N. Trueblood, Interpretation of atomic displacement parameters from
diffraction studies of crystals, J. Phys. Chem. 92, 856 (1988).
7bioRxiv preprint first posted online Oct. 17, 2019; doi: http://dx.doi.org/10.1101/805424. The copyright holder for this preprint
(which was not peer-reviewed) is the author/funder, who has granted bioRxiv a license to display the preprint in perpetuity.
It is made available under a CC-BY-NC-ND 4.0 International license.
4. D. Ringe, G. A. Petsko, Mapping protein dynamics by X-ray diffraction, Prog. Biophys. Biophys.
Chem. 45, 197 (1985).
5. J. Painter, E. A. Merritt, Optimal description of a protein structure in terms of multiple groups un-
dergoing TLS motion, Acta Crystallogr., Sect. D: Biol. Crystallogr. 62, 439 (2006).
6. R. A. Woldeyes, D. A. Sivak, J. S. Fraser, E pluribus unum, no more: from one crystal, many
conformations, Curr. Opin. Struct. Biol. 28, 56 (2014).
7. D. L. D. Caspar, J. Clarage, D. M. Salunke, M. Clarage, Liquid-like movements in crystalline insulin,
Nature 332, 659 (1988).
8. P. B. Moore, On the Relationship between Diffraction Patterns and Motions in Macromolecular
Crystals, Structure 17, 1307 (2009).
9. J. B. Clarage, M. S. Clarage, W. C. Phillips, R. M. Sweet, D. L. D. Caspar, Correlations of atomic
movements in lysozyme crystals, Proteins 12, 145 (1992).
10. P. Faure, A. Micu, D. Pérahia, J. Doucet, J. C. Smith, J. P. Benoit, Correlated intramolecular motions
and diffuse x–ray scattering in lysozyme, Nat. Struct. Mol. Biol. 1, 124 (1994).
11. J. Pérez, P. Faure, J.-P. Benoit, Molecular Rigid-Body Displacements in a Tetragonal Lysozyme
Crystal Confirmed by X-ray Diffuse Scattering, Acta Crystallogr., Sect. D: Biol. Crystallogr. 52, 722
(1996).
12. S. Héry, D. Genest, J. C. Smith, X-ray diffuse scattering and rigid-body motion in crystalline
lysozyme probed by molecular dynamics simulation, J. Mol. Biol. 279, 303 (1998).
13. D. Riccardi, Q. Cui, G. N. Phillips Jr., Evaluating Elastic Network Models of Crystalline Biological
Molecules with Temperature Factors, Correlated Motions, and Diffuse X-Ray Scattering, Biophys.
J. 99, 2616 (2010).
14. M. E. Wall, S. E. Ealick, S. M. Gruner, Three-dimensional diffuse x-ray scattering from crystals of
Staphylococcal nuclease, Proc. Natl. Acad. Sci. U.S.A. 94, 6180 (1997).
15. M. E. Wall, J. B. Clarage, G. N. Phillips Jr, Motions of calmodulin characterized using both Bragg
and diffuse X-ray scattering, Structure 5, 1599 (1997).
16. M. E. Wall, A. H. V. Benschoten, N. K. Sauter, P. D. Adams, J. S. Fraser, T. C. Terwilliger, Confor-
mational dynamics of a crystalline protein from microsecond-scale molecular dynamics simulations
and diffuse X-ray scattering, Proc. Natl. Acad. Sci. U.S.A. 111, 17887 (2014).
17. A. H. V. Benschoten, L. Liu, A. Gonzalez, A. S. Brewster, N. K. Sauter, J. S. Fraser, M. E. Wall,
Measuring and modeling diffuse scattering in protein X-ray crystallography, Proc. Natl. Acad. Sci.
U. S. A. 113, 4069 (2016).
18. K. Ayyer, O. M. Yefanov, D. Oberthür, S. Roy-Chowdhury, L. Galli, V. Mariani, S. Basu, J. Coe,
C. E. Conrad, R. Fromme, A. Schaffer, K. Dörner, D. James, C. Kupitz, M. Metz, G. Nelson, P. L.
Xavier, K. R. Beyerlein, M. Schmidt, I. Sarrou, J. C. H. Spence, U. Weierstall, T. A. White, J.-H.
Yang, Y. Zhao, M. Liang, A. Aquila, M. S. Hunter, J. S. Robinson, J. E. Koglin, S. Boutet, P. Fromme,
A. Barty, H. N. Chapman, Macromolecular diffractive imaging using imperfect crystals, Nature 530,
202 (2016).
8bioRxiv preprint first posted online Oct. 17, 2019; doi: http://dx.doi.org/10.1101/805424. The copyright holder for this preprint
(which was not peer-reviewed) is the author/funder, who has granted bioRxiv a license to display the preprint in perpetuity.
It is made available under a CC-BY-NC-ND 4.0 International license.
19. A. Peck, F. Poitevin, T. J. Lane, Intermolecular correlations are necessary to explain diffuse scattering
from protein crystals, IUCrJ 5, 211 (2018).
20. T. de Klijn, A. M. M. Schreurs, L. M. J. Kroon-Batenburg, Rigid-body motion is the main source of
diffuse scattering in protein crystallography, IUCrJ 6, 277 (2019).
21. Y. S. Polikanov, P. B. Moore, Acoustic vibrations contribute to the diffuse scatter produced by ribo-
some crystals, Acta Crystallogr., Sect. D: Biol. Crystallogr. 71, 2021 (2015).
22. S. P. Meisburger, N. Ando, Correlated motions from crystallography beyond diffraction, Acc. Chem.
Res. 50, 580 (2017).
23. M. E. Wall, A. M. Wolff, J. S. Fraser, Bringing diffuse X-ray scattering into focus, Curr. Opin. Struct.
Biol. 50, 109 (2018).
24. M. A. Walsh, T. R. Schneider, L. C. Sieker, Z. Dauter, V. S. Lamzin, K. S. Wilson, Refinement of Tri-
clinic Hen Egg-White Lysozyme at Atomic Resolution, Acta Crystallogr., Sect. D: Biol. Crystallogr.
54, 522 (1998).
25. C. Nave, A Description of Imperfections in Protein Crystals, Acta Crystallogr., Sect. D: Biol. Crys-
tallogr. 54, 848 (1998).
26. J. Krogh-Moe, A method for converting experimental X-ray intensities to an absolute scale, Acta
Crystallogr. 9, 951 (1956).
27. N. Norman, The Fourier transform method for normalizing intensities, Acta Crystallogr. 10, 370
(1957).
28. I. D. Glover, G. W. Harris, J. R. Helliwell, D. S. Moss, The variety of X-ray diffuse scattering from
macromolecular crystals and its respective components, Acta Crystallogr., Sect. B: Struct. Sci. 47,
960 (1991).
29. L. Meinhold, J. C. Smith, Protein dynamics from X-ray crystallography: Anisotropic, global motion
in diffuse scattering patterns, Proteins: Struct., Funct., Bioinf. 66, 941 (2007).
30. L. Meinhold, F. Merzel, J. C. Smith, Lattice Dynamics of a Protein Crystal, Phys. Rev. Lett. 99,
138101 (2007).
31. B. T. M. Willis, International Tables for Crystallography Volume B: Reciprocal space, U. Shmueli,
ed. (Springer Netherlands, Dordrecht, 2001), pp. 400–406.
32. L. Meinhold, J. C. Smith, Correlated Dynamics Determining X-Ray Diffuse Scattering from a Crys-
talline Protein Revealed by Molecular Dynamics Simulation, Phys. Rev. Lett. 95, 218103 (2005).
33. M. E. Wall, Internal protein motions in molecular-dynamics simulations of Bragg and diffuse X-ray
scattering, IUCrJ 5, 172 (2018).
34. D. S. Cerutti, D. A. Case, Molecular dynamics simulations of macromolecular crystals, Wires Com-
put. Mol. Sci. 9, e1402 (2019).
35. A. Guinier, X-ray Diffraction in Crystals, Imperfect Crystals, and Amorphous Bodies (Courier Cor-
poration, 1994).
9bioRxiv preprint first posted online Oct. 17, 2019; doi: http://dx.doi.org/10.1101/805424. The copyright holder for this preprint
(which was not peer-reviewed) is the author/funder, who has granted bioRxiv a license to display the preprint in perpetuity.
It is made available under a CC-BY-NC-ND 4.0 International license.
36. P. A. Karplus, K. Diederichs, Linking Crystallographic Model and Data Quality, Science 336, 1030
(2012).
37. T. Haliloglu, I. Bahar, B. Erman, Gaussian Dynamics of Folded Proteins, Phys. Rev. Lett. 79, 3090
(1997).
38. M. M. Tirion, Large Amplitude Elastic Motions in Proteins from a Single-Parameter, Atomic Anal-
ysis, Phys. Rev. Lett. 77, 1905 (1996).
39. M. Born, K. Huang, Dynamical theory of crystal lattices (Clarendon Press, 1954).
40. G. Eckold, International Tables for Crystallography Volume D: Physical properties of crystals,
A. Authier, ed. (Springer Netherlands, Dordrecht, 2003), pp. 266–293.
41. C. Edwards, S. B. Palmer, P. Emsley, J. R. Helliwell, I. D. Glover, G. W. Harris, D. S. Moss, Thermal
motion in protein crystals estimated using laser-generated ultrasound and Young’s modulus measure-
ments, Acta Crystallogr., Sect. A: Found. Crystallogr. 46, 315 (1990).
42. M. Tachibana, K. Kojima, R. Ikuyama, Y. Kobayashi, M. Ataka, Sound velocity and dynamic elastic
constants of lysozyme single crystals, Chem. Phys. Lett. 332, 259 (2000).
43. S. Speziale, F. Jiang, C. L. Caylor, S. Kriminski, C. S. Zha, R. E. Thorne, T. S. Duffy, Sound Velocity
and Elasticity of Tetragonal Lysozyme Crystals by Brillouin Spectroscopy, Biophys. J. 85, 3202
(2003).
44. H. Koizumi, M. Tachibana, K. Kojima, Elastic constants in tetragonal hen egg-white lysozyme crys-
tals containing large amount of water, Phys. Rev. E 79, 061917 (2009).
45. J. A. Mccammon, B. R. Gelin, M. Karplus, P. G. Wolynes, The hinge-bending mode in lysozyme,
Nature 262, 325 (1976).
46. B. Brooks, M. Karplus, Normal modes for specific motions of macromolecules: application to the
hinge-bending mode of lysozyme, Proc. Natl. Acad. Sci. U. S. A. 82, 4995 (1985).
Acknowledgments
We thank staff at the Cornell High Energy Synchrotron Source (CHESS) and MacCHESS beamline F1
for supporting diffraction data collection, W.C. Thomas for assistance with data collection, and S.M.
Gruner, W.C. Thomas, M.B. Watkins, B.R. Crane, and A.S. Byer for critical reading of the manuscript.
Funding: CHESS is supported by NSF Grant DMR-1332208, and the MacCHESS facility is supported
by NIH/NIGMS Grant GM-103485. This work was supported by NIH Grants GM117757 (to S.P.M.),
GM100008 (to N.A.), GM124847 (to N.A.), and GM122086 (to D.A.C.) and by start-up funds from
Princeton University and Cornell University (to N.A.). Author contributions: S.P.M. performed crys-
tallization, data collection, and structure determination with assistance from N.A. D.A.C. performed and
analyzed the MD simulations. S.P.M. developed methods for processing and analyzing diffuse scattering
data and performed vibrational simulations. The manuscript was written by S.P.M. and N.A. and edited
by all authors. N.A. conceived of the experiments and coordinated the research. Competing interests:
The authors declare no competing interests. Data and materials availability: The atomic coordinates
and structure factors have been deposited in the Protein Data Bank under accession code 6o2h. Diffrac-
tion images have been deposited in the SBGrid Data Bank. All other data are available in the main text
or the supplementary materials.
10bioRxiv preprint first posted online Oct. 17, 2019; doi: http://dx.doi.org/10.1101/805424. The copyright holder for this preprint
(which was not peer-reviewed) is the author/funder, who has granted bioRxiv a license to display the preprint in perpetuity.
It is made available under a CC-BY-NC-ND 4.0 International license.
Supplementary Materials
Materials and Methods
Supplementary Text
Fig. S1 – S17
Table S1 – S4
Fig. 1: Diffuse scattering map of triclinic lysozyme with intensities on an absolute scale of electron
units (Ie ). (A) Ribbon diagram of lysozyme (top) and the triclinic unit cell containing one protein (bot-
tom). (B) A highly detailed three-dimensional map of diffuse scattering was obtained. The outer sphere
is drawn at 2 Å resolution. (C) The total scattering is made up of three components: (i) inelastic Compton
scattering, (ii) a broad isotropic ring that dominates the diffuse signal, and (iii, iv) variational features in
the diffuse scattering. Intense halos are visible in the layers containing Bragg peaks (l = 0 plane, iii).
Cloudy scattering is best visualized in the planes mid-way between the Bragg peaks (l = 1/2 plane, iv).
Fig. 2: Evidence for long-range correlations in experimental maps and molecular dynamics (MD) sim-
ulations. (A) Throughout the diffuse map, intense halo scattering is observed around Bragg reflections.
Halo profiles centered on three Bragg reflections (q0 ) show a power-law decay with an exponent close
to -2 (gray line) along the directions (q − q0 ): a∗ (blue), b∗ (orange), and c∗ (green). Histograms of the
best-fit exponent along a∗ , b∗ and c∗ (top to bottom) for the 100 most-intense halos between 2 and 10 Å
resolution also show that -2 is the most frequent value. (B) Halo features appear in simulated scatter-
ing from supercell MD as the simulation size is increased from 1 to 343 (7x7x7) unit cells. Each panel
shows the variational component in the l = 0 plane. (C) Although increasing the supercell size improves
agreement (green to orange), MD does not reproduce experiment on an absolute scale (black diamonds),
as judged by the standard deviation profile of the diffuse intensity. In contrast, much better agreement
is obtained with the lattice model described in Fig. 3 (blue). (D) MD displays a worse correlation (CC)
with experiment (orange) compared to the lattice model (blue). The dashed line represents theoretical
limit of the experimental data, CC*.
Fig. 3: Lattice dynamics model refined to diffuse scattering. (A) A lattice dynamics model was con-
structed with rigid protein units arranged in a 13x11x11 supercell with a linear combination of Gaussian
and directional springs connecting the Cα atoms of residues involved in lattice contacts (dark red lines).
Spring constants were refined to fit the variational scattering around 400 intense Bragg peaks between
2 and 2.5 Å resolution. (B) Comparison of predicted and measured halo intensity around the (1,2,13)
Bragg reflection in the h = 0 plane. The plane perpendicular to the scattering vector is indicated by a
dashed line. The model with equal Gaussian springs does not reproduce this shape as well as the fully-
refined model. (C) The shape anisotropy of each of the 400 halos used for model fitting was quantified
and mapped as an equal-area projection of the hemisphere centered on b∗ . Full refinement of the spring
constants was needed to reproduce the pattern of halo anisotropy seen in experiment. (D) The simulated
one-phonon scattering for the fully-refined lattice model (left) is compared with the measured variational
scattering (right) in the l = 0 plane. The intensity scale is the same as Fig. 1C. Blue boxes surround
halos that were included in the fit.
Fig. 4: Models of collective internal motions in lysozyme refined to Bragg data. (A) Apparent atomic
motions can be evaluated by comparing the anisotropic displacement parameters (ADPs) obtained ex-
perimentally from Bragg data with those calculated from models. To facilitate visual comparison, the
11bioRxiv preprint first posted online Oct. 17, 2019; doi: http://dx.doi.org/10.1101/805424. The copyright holder for this preprint
(which was not peer-reviewed) is the author/funder, who has granted bioRxiv a license to display the preprint in perpetuity.
It is made available under a CC-BY-NC-ND 4.0 International license.
ADPs over backbone atoms are averaged to produce a single isotropic B-factor per residue. The lattice
dynamics model in Fig. 3 (blue curve) underestimates the experimental B-factors (gray bars), but a good
fit is obtained by combining lattice dynamics with the internal dynamics described in panels B-C (dark
red symbols). (B) The model for internal dynamics was constructed using an elastic network with rigid
residues. Both intermolecular (dark red lines) and intramolecular contacts (blue and green lines, corre-
sponding to the α and β domains, respectively) were modeled as springs, and the spring constants were
refined to fit the residual ADPs, i.e. the experimental ADPs that are unaccounted for by lattice dynamics.
(C) In the full internal dynamics model, the Cα atoms in the α and β domains show negative directional
correlations (dashed boxes), indicating that their motions are anti-correlated and consistent with hinge-
bending. (D) The two domains have no correlations when their motions are suppressed in the model
refinement.
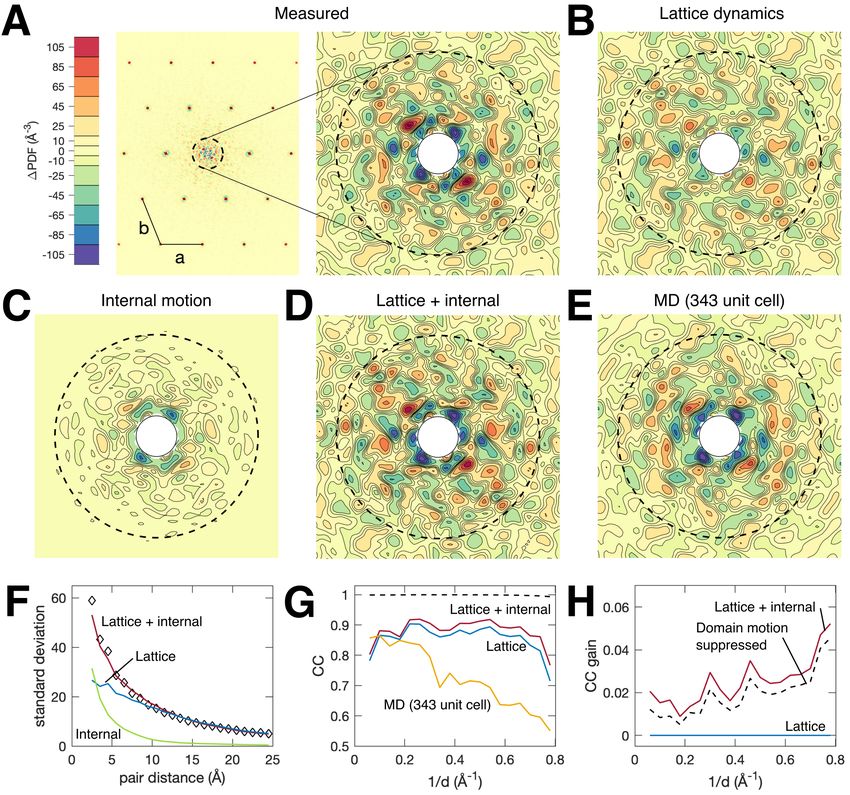
Fig. 5: Detection of internal motions by diffuse Patterson analysis. (A) The diffuse Patterson map
represents the autocorrelation of the difference electron density and is a function of the vector r between
points in the crystal (dashed circle corresponds to |r| = 10 Å). The experimental diffuse Patterson in the
a-b plane contains peaks at the lattice nodes (left) and continuous fluctuations that are most intense near
the origin (right). (B-E) Diffuse Patterson maps simulated from models. The lattice model underestimates
the fluctuations at short length scales, but addition of full internal dynamics reproduces the experimental
pattern. (F) The standard deviation of the diffuse Patterson maps in spherical shells of constant pair-
distance for the experimental map (black diamonds), lattice model (blue), internal model (green), and the
combined model (dark red). (G) The reciprocal space correlation coefficient (CC) between experiment
and simulation in shells of constant resolution within the central part of the Patterson map (2 < |r| <
25 Å) . The colors are the same as in panel F. The 343-unit cell MD simulation is in orange. The dashed
line shows CC*. (H) Gain in CC relative to the lattice dynamics model alone (blue) for the combined
model (dark red) and the model in which domain motion was suppressed (black dashed line).
12bioRxiv preprint first posted online Oct. 17, 2019; doi: http://dx.doi.org/10.1101/805424. The copyright holder for this preprint
(which was not peer-reviewed) is the author/funder, who has granted bioRxiv a license to display the preprint in perpetuity.
It is made available under a CC-BY-NC-ND 4.0 International license.
Fig. 1
13bioRxiv preprint first posted online Oct. 17, 2019; doi: http://dx.doi.org/10.1101/805424. The copyright holder for this preprint
(which was not peer-reviewed) is the author/funder, who has granted bioRxiv a license to display the preprint in perpetuity.
It is made available under a CC-BY-NC-ND 4.0 International license.
Fig. 2
14bioRxiv preprint first posted online Oct. 17, 2019; doi: http://dx.doi.org/10.1101/805424. The copyright holder for this preprint
(which was not peer-reviewed) is the author/funder, who has granted bioRxiv a license to display the preprint in perpetuity.
It is made available under a CC-BY-NC-ND 4.0 International license.
Fig. 3
15bioRxiv preprint first posted online Oct. 17, 2019; doi: http://dx.doi.org/10.1101/805424. The copyright holder for this preprint
(which was not peer-reviewed) is the author/funder, who has granted bioRxiv a license to display the preprint in perpetuity.
It is made available under a CC-BY-NC-ND 4.0 International license.
Fig. 4
16bioRxiv preprint first posted online Oct. 17, 2019; doi: http://dx.doi.org/10.1101/805424. The copyright holder for this preprint
(which was not peer-reviewed) is the author/funder, who has granted bioRxiv a license to display the preprint in perpetuity.
It is made available under a CC-BY-NC-ND 4.0 International license.
Fig. 5
17You can also read