Growth and Potential of Lomatia hirsuta Forests from Stump Shoots in the Valley of El Manso/Patagonia/Argentina - HAWK
←
→
Page content transcription
If your browser does not render page correctly, please read the page content below
Article
Growth and Potential of Lomatia hirsuta Forests from Stump
Shoots in the Valley of El Manso/Patagonia/Argentina
Hendrik Kühn 1,*, Gabriel A. Loguercio 2, Marina Caselli 3 and Martin Thren 1
1 Faculty of Natural Resource Management, University of Applied Sciences and Arts (HAWK),
37077 Göttingen, Germany; martin.thren@hawk.de
2 Centro de Investigación y Extensión Forestal Andino Patagónico (CIEFAP) and Ordenación Forestal,
Facultad de Ingeniería, National University of Patagonia San Juan Bosco, 9200 Esquel, Argentina;
gloguercio@ciefap.org.ar
3 CIEFAP and Consejo Nacional de Investigaciones Científicas y Técnicas (CONICET),
9200 Esquel, Argentina; mcaselli@ciefap.org.ar
* Correspondence: Hendrik.kuehn@t‐online.de
Abstract: Lomatia hirsuta (Lam.) Diels is a pioneer tree species that develops after wildfires, and in
advanced successional stages, it is often found as a secondary species in Patagonian forests. How‐
ever, in El Manso Valley, Province of Río Negro in Western Argentina, L. hirsuta forms mature pure
stands, originated from stump shoots. The wood is very attractive for its colourful appearance and
beautiful grain. Nevertheless, these forests are not managed for timber production, they are mostly
strong thinned for grazing, and the wood is mainly used as firewood. The objective of this study
was to evaluate the possibility to improve quality wood production in stands through silvicultural
interventions in a sustainable way. Samples have been carried out in stands of different develop‐
mental stages. We evaluated the state and quality of the trees, and their growth has been studied by
Citation: Kühn, H.; Loguercio, G.A.; means of trunk analysis. The results indicate that there is significant potential to improve the pro‐
Caselli, M.; Thren, M. Growth and duction of quality wood in dense stands by thinning to release crop trees. Thinning should start in
Potential of Lomatia hirsuta Forests young stands. It also became apparent that forest management is first necessary to stabilise these
from Stump Shoots in the Valley
nearly unattended forests.
of El Manso/Patagonia/Argentina.
Forests 2021, 12, 923.
Keywords: Lomatia hirsuta; Patagonia; pioneer tree species; stump shoots; quality wood;
https://doi.org/10.3390/f12070923
trunk analysis; stability of stands
Academic Editor: Angela Lo Monaco
Received: 28 May 2021
Accepted: 12 July 2021 1. Introduction
Published: 15 July 2021 Lomatia hirsuta is an evergreen pioneer tree species and belongs to the family Pro‐
teaceae [1]. It has a disjunct distribution area, occurring in the north‐western Andes in
Publisher’s Note: MDPI stays Ecuador and Peru [2] and also in the eastern side of the Andes in Patagonia (Argentina).
neutral with regard to jurisdictional
There, L. hirsuta is normally associated with species from Gavileo‐Austrocedretum [3].
claims in published maps and
For example, it often appears in forests dominated by Austrocedrus chilensis (D. Don) Pic.
institutional affiliations.
Serm. & Bizzarri or Nothofagus dombeyi (Mirb.) Oerst [4,5]. Lomatia hirsuta has a wide eco‐
logical range and is able to cope with warm and cold climate conditions [2]. In the above‐
mentioned forests with high precipitation, L. hirsuta grows in the form of a tree. However,
it is also able to exist in dry areas, and in the forest‐steppe ecotone, it appears as a shrub
Copyright: © 2021 by the authors.
Licensee MDPI, Basel, Switzerland.
of 5–6 m in height [4].
This article is an open access article
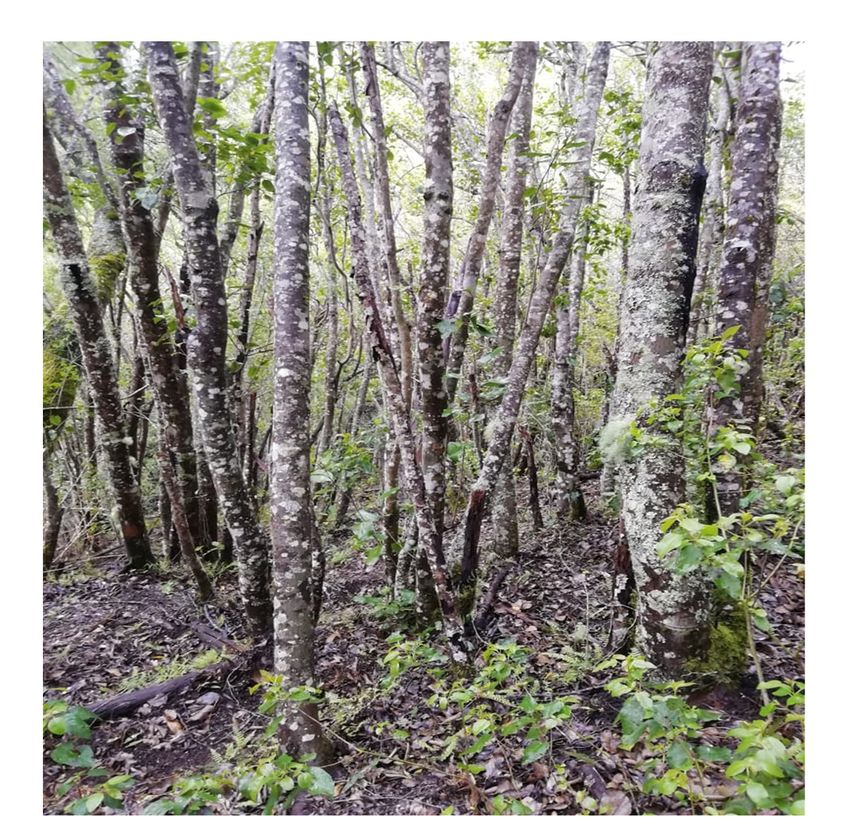
Lomatia hirsuta regenerates from stump shoots after severe forest fires (Figure 1, left).
distributed under the terms and It can also colonise areas after disturbances like road cuttings or abandoned fields, grow‐
conditions of the Creative Commons ing from stump shoots or seeds [6], and rarely grows in pure stands. Lomatia hirsuta is a
Attribution (CC BY) license light‐demanding species but can also germinate under mid‐shady conditions [7].
(http://creativecommons.org/ Little is known about L. hirsuta’s natural dynamic and growth. Dasometric descrip‐
licenses/by/4.0/). tions of mixed shrublands, where L. hirsuta is present, have been made [8], volume and
Forests 2021, 12, 923. https://doi.org/10.3390/f12070923 www.mdpi.com/journal/forests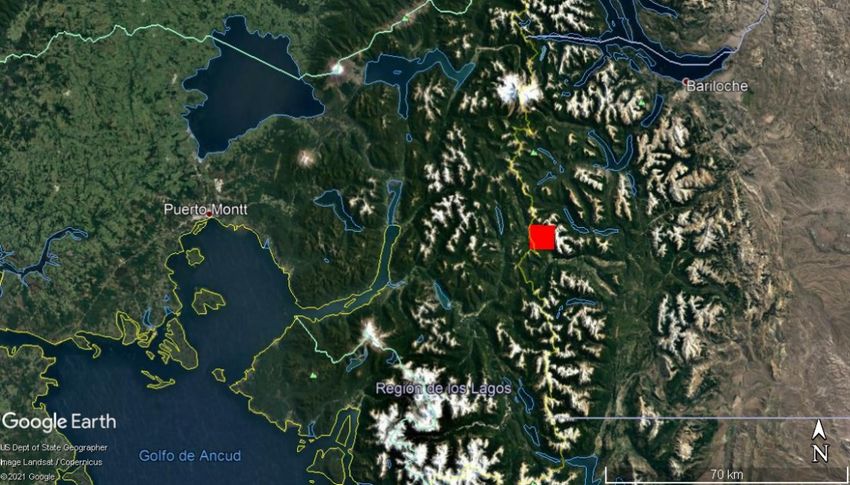
Forests 2021, 12, 923                                                                                         2 of 14

                        biomass equations have been developed [9], the diameter increment has been measured
                        [10], and first recommendations for the management of these mixed shrubs have been
                        made [11]. In general, in those places with less precipitation, the species grows to lower
                        heights than the area of the present study [8,9]. Furthermore, there is no silvicultural
                        knowledge of pure forests of L. hirsuta and no large‐scale use of its wood.
                              Nevertheless, the wood of L. hirsuta has very attractive characteristics because of its
                        colourful look, chestnut‐pink to dark brown with violet tints (Figure 1, right). Further‐
                        more, it is light to moderately heavy (0.53–0.57 g/cm3) and flexible [1]. The contraction of
                        L. hirsuta has medium values, so it is somewhat unstable, but not extremely. It has clearly
                        visible rays, which are especially apparent in radial sectioning [1]. The wood also has good
                        workability because of its straight grain. For these reasons, it is often used for works of
                        art, handicraft, and sometimes also for fine furniture. In short, it is a wood that could be
                        considered of very high quality. However, the traditional uses of this species do not take
                        full advantage of these characteristics. Normally the stands are thinned intensely, and the
                        brushwood is eliminated to convert the forest into wood pasture: the traditional “par‐
                        quizado”, and the main current destination of L. hirsuta is fuelwood.

                         Figure 1. Lomatia hirsuta pure forest (left) and its wood (right).

                             The objective of this study was to determine the possibility to improve quality wood
                        production through silvicultural management, evaluating the actual vigour and quality
                        of the trees and studying their individual growth.

                        2. Materials and Methods
                        2.1. Study Area
                             The study area is located in El Manso Valley in the southwest of the Province of Río
                        Negro at the international border of Chile (Figure 2). The studied tree stands are particu‐
                        larly in the south of the river and mostly have a northern or north‐western exposition. The
                        El Manso river is the southern limit of the Nahuel Huapi National Park.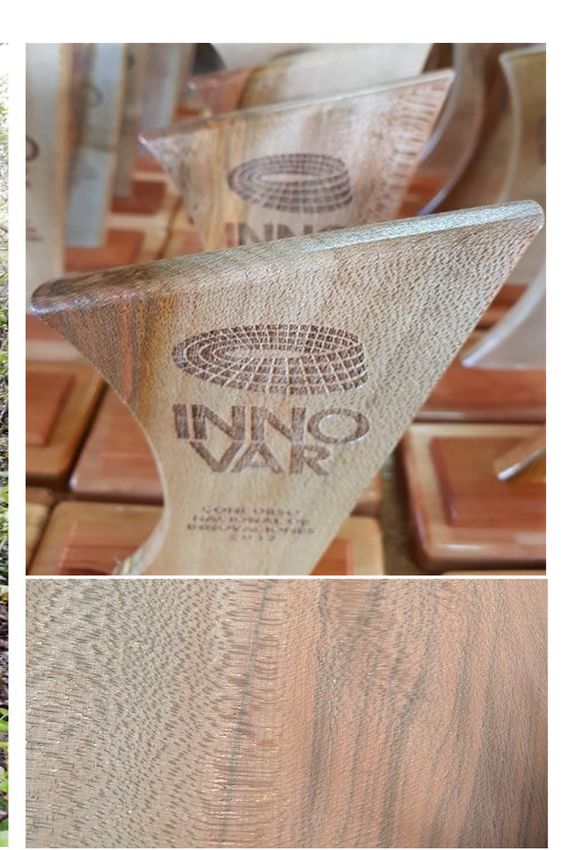
Forests 2021, 12, 923                                                                                              3 of 14

                        Figure 2. Location of the study area (red) (41°31′ S and 71°49′ W) in El Manso Valley, Province of
                        Río Negro. South America`s map source: [12].

                              The climate in this region is cold temperate under a maritime buffer effect because of
                        the proximity to the Pacific Ocean. The annual temperature of the region averages 9.3 °C.
                        There is precipitation all year, and around 1600 mm/year are reached [13].
                              The soils in the study area are young Andosols (FAO legend) [14] of volcanic origin
                        [15]. The soils have a high cation exchange capacity and a great water storage capacity;
                        both properties are increased by allophane contents in the soil. Furthermore, the soils were
                        profound, free from stones and had a moderate content of nitrogen and a high content of
                        bases (K, Ca and Mg). All these characteristics were confirmed for the study area by four
                        soil profiles.
                              In summary, the trees in the studied stands have very good climate and soil condi‐
                        tions for their growth.

                        2.2. Data Acquisition
                        2.2.1. Structures of the L. hirsuta Stands
                             The pure stands of L. hirsuta in El Manso Valley represent a secondary forest after
                        past wildfires. The stands were differentiated into three stages by the dimensions of the
                        trees: young, intermediate, and old. In every stage, three sample plots were carried out.
                        In addition, three plots were installed in a less dense stand under the traditional use as
                        pastures (“parquizado”). The plots were rectangular and had a size of 1000 m2, except in
                        the young stands, which had 300 m2, because of the very high stocking density. Inside the
                        plots, every tree and every trunk was accounted for, and the diameter at breast height
                        (DBH) of all trunks from 7 cm and upwards was collected. In the young stands, all trunks
                        from 4 cm upwards were measured. Furthermore, all trunks were described concerning
                        their social position, their health condition and their form (Table 1). Furthermore, some
                        tree heights per plot were measured along with the range of DBHs.

                        Table 1. Quality criteria for the trunks inside the plots.

                                Criterion                                            Categories
                              Social position               Dominant                 Codominant          Suppressed
                             Health condition                   Fit                    Injured             Dying
                             Form of the trunk               Straight                  Curved             Crooked
Forests 2021, 12, 923 4 of 14
We also registered the volume of quality logs; for this, the mid‐diameters of good
logs were measured with a Finn calliper, and their lengths were estimated in fixed sec‐
tions. Logs had to have a length of 1.2 m, or its multiples, and a top diameter of at least 15
cm. In the young stands, the potential to produce quality wood in the future was estimated
by only taking into account the length of good straight logs, although the top diameter
did not reach 15 cm yet. The quality wood of some fallen trees, which were found in the
intermediate and old stands, were also measured.
2.2.2. Thinning Simulation
After collecting the data of the individual trunks, a crop tree orientated thinning was
simulated in every plot. The criteria to choose the crop trees were vigour, quality, and
distribution (in order of importance). Concerning the quality, a good log (sound and fit)
of at least 2.4 m long was required; distribution had secondary importance. It was only en‐
sured that two crop trees had no contact with their crowns. For each crop tree, the main com‐
petitor, or in some cases two competitors, were identified and scheduled for the cutting.
In addition to the crop tree orientated thinning, a catch‐up low thinning was also
simulated. It had the objective to obtain the wood of dying and damaged trees (salvage
and improvement cutting).
2.2.3. Growth of the Crop Trees
In every plot of the young, intermediate, and old structures, two crop trees were se‐
lected and cut for the trunk analysis. Altogether 18 trees were considered (6 trees per
structure). Before cutting the selected tree, its DBH, height, and crown radii were meas‐
ured. The number of measured radii depended on the crown’s form. Furthermore, the
competitors were identified (the ones that pressured the crop tree’s crown), and their
DBHs and heights were measured, too. Furthermore, the distances from the crop tree’s
trunk to the crown border and to the trunk of the competitors were collected.
After cutting the selected tree, the length was measured, and trunk discs were ex‐
tracted at the height of 0.3 m and every two meters after (2.3 m, 4.3 m, etc.) until the be‐
ginning of the crown. The beginning of the crown was considered to be the point in which
the trunk forked, and both branches were alive. Additionally, the disc in the height of the
DBH (1.3 m) was extracted. In the laboratory, all discs were ground and then analysed by
identifying, counting, and measuring the annual rings. Moreover, the height increment of
the last year was collected by measuring the length between shoot stigmas from the top
of the tree downwards. Between two and seven shoot lengths per tree could be identified
and measured. Furthermore, the whole crown material was weighed together, and then
the thick branches were weighed separately. Moreover, samples of thick branches, thin
branches, and leaves were weighed in fresh conditions and then taken to the laboratory.
There, the samples were dried in an oven until a constant weight was reached, so conver‐
sion factors from fresh to dry biomass could be determined.
2.3. Processing and Data Analysis
2.3.1. Structures of the L. hirsuta Stands and Thinning Simulation
For every age class and for the parquizado, a hypsometric height function through
linear regression analysis, using the coefficient of determination (r2) and the distribution
of residuals as a fit indicator, was generated. Since the available volume equations of L.
hirsuta [9] correspond to sites of lower quality (= less height), to quantify the plots’ volume,
functions for the total volume and the trunk volume of individual trees was adjusted. For
this, the destructive sampling trees for the study of growth through stem analysis were
used. The trunk volume was determined by means of Smalian’s formula [16]. This formula
allows us to calculate the volume by using the given diameters and the extraction heights
of the discs for the trunk analysis. To get the tree’s total volume, the trunk volume and theForests 2021, 12, 923 5 of 14
crown volume (branches of 2 cm upwards) were summed. The crown volume was deter‐
mined by conversion of the fresh weight of biomass to dry weight and by dividing this
with the dry density of L. hirsuta, which is 0.55 g/cm3 [1].
Furthermore, the volumes of the logs of good quality were calculated by means of
the mid‐diameter and the lengths by using the formula of Huber [17]. For the young
stands, the potential of future quality wood was estimated. Therefore, the measured
lengths of the straight trunks and the average mid‐diameter of the quality logs of the in‐
termediate and old stands, which averaged around 20 cm, were used.
In this way, it was also possible to quantify the volume of the different products
which would be extracted in the thinning simulation. The volume of badly formed stems
was determined by subtracting the volume of quality wood from the volume of stems
with a DBH ≥ 20 cm. The rest of the total volume, which would be extracted, was declared
as firewood from the crowns and thin stems (Forests 2021, 12, 923 6 of 14
ment promotes trees to have h/d values lower than 80 for most of their life to ensure sta‐
bility, which is achieved by releasing the diameter growth. For this reason, to analyse the
evolution of the growth of the crop trees studied, they were grouped into three classes:
1. Dominant type: Trees whose h/d ratios, in general, were below 80, already in early
years, and remained below the limit value throughout their lives (5 trees).
2. Variable type: Trees whose h/d ratios varied throughout their lives, generally reduc‐
ing the h/d value with age, reaching less than 80; but the opposite could also have
happened (5 trees).
3. Suppressed type: Trees whose h/d ratios, in general, were always over 80 (8 trees).
For every type of growth, the characteristic development of height, diameter, and
volume was examined.
3. Results
3.1. Structures of the L. hirsuta Stands
The determined functions for total volume and trunk volume, which were used to
calculate the stands volumes, are shown in Table 2. The DBH was the only independent
variable used since the height coefficient was not statistically significant.
Table 2. Functions of total volume and individual trunk volume.
Volume Function n REE r2adj
total [m3cc] 0.0007737 (DBH (cm))2 18 0.07747 0.963
trunk [m3cc] 0.0004338 (DBH (cm))2 18 0.0421 0.965
REE: residual standard error; r2adj: adjusted determination coefficient.
Lomatia hirsuta occupies the whole site in a high density. Most of the dasometric pa‐
rameters differed significantly between the young and old stands, while in the intermedi‐
ate structure, they had values between them. Only the basal area and the total volume did not
have significant differences between the structures without intervention (Table 3). If the den‐
sity of the old stand is assumed as 100%, in the parquizado, the number of stems/ha was re‐
duced at 28% and the basal area at 32%. The total volume reaches its maximum in the inter‐
mediate structure, with 560 m3/ha and the mature stem volume participation in the total vol‐
ume increases from 4 to 46% between the young and the old structure (Table 3).
Table 3. Parameters of the different structures.
Variables Young Intermediate Old Parquizado
Number of trees/ha 2244 a 1167 ab 600 b 223 c
Number of stems/ha 6278 a 2180 b 1157 b 300 c
Number of stems/tree 2.8 a 1.9 b 1.9 b 1.3 b
Quadratic mean diameter (QMD) [cm] 10.7 c 18.2 bc 24.5 ab 26.8 a
Dominant QMD [cm] 24.3 b 34.9 ab 43.7 a 36 ab
Height of the tree of QMD [m] 9.5 b 12.1 ab 13.9 a 14.5 a
Mean dominant height [m] 13.9 b 16.4 ab 18.2 a 16.7 ab
Basal area [m2/ha] 56.1 a 56.9 a 54.4 a 16.9 b
Total volume [m3 o.b./ha] 553 a 560 a 536 a 167 b
Volume of mature stems [m3 o.b./ha] * 24 c 173 ab 249 a 82 bc
* DBH ≥ 20 cm. Letters indicate differences between groups based on a significance level (p ≤ 0.05).
The diameter distributions of all stands are similar to a bell‐shaped curve and only
show little skewness to the small diameters (Figure 3). The fact that the diameter distribu‐
tion of the parquizado is very similar to the others shows that by cutting, trees of all di‐
ameters were removed.Forests 2021, 12, 923 7 of 14
Figure 3. Diameter distributions of the different structures; the ordinates are differently scaled
because otherwise, the charts with low number of stems/ha (old stands and parquizado) would
not be readable.
Looking at the development of the heights over diameter, it can be seen that the gra‐
dient is bigger in the smaller diameter classes, reaching its maximum at a DBH between
20 and 30 cm. After that, the curve continues approximately like an asymptote (Figure 4).
Furthermore, the trees in the parquizado have minor heights at the same diameters.
The frequency of trees of each health condition, social position, and form of the trunk
was significantly related with the forest structure Pearson’s Chi‐square statistics (p <
0.0001 for the three quality parameters). This means that social position, health condition,
and form of the trunk are significantly related to the forest structure. The structure with
relatively more fit and straight trees was parquizado, and that with relatively more dying
trees was the young (Table 4). Intermediate trees were more frequently in the intermediate
structure, and suppressed trees were more frequently in the young and old structures.
Table 4. Quality parameters of the different structures: Absolute and relative values are shown.
Young Intermediate Old Parquizado
Variables
Nha % Nha % Nha % Nha %
Fit 1622 25.8 663 30.4 150 11.5 157 52.2
Health condition Injured 1844 29.4 883 40.5 627 50.0 133 44.5
Dying 2811 44.8 633 29.1 380 38.5 10 3.3
Dominant 367 5.8 183 8.4 147 9.1 ‐
Social position Codominant 2022 32.2 1080 49.5 440 36.5 ‐
Suppressed 3889 62.0 917 42.1 570 54.4 ‐
Straight 1089 17.3 317 14.5 207 15.9 120 40.0
Form of the trunk Curved 1544 24.6 527 24.2 353 28.7 93 31.1
Crooked 3644 58.1 1337 61.3 597 55.4 87 28.9
crowns and thin stems * 529 a 386 b 288 b 85 c
Volume
badly formed stems 18 c 139 ab 194 a 78 bc
[m3 o.b./ha]
quality wood 6 ab (169 **) 35 ab 55 a 4b
Nha: Number of trees per hectare; * DBH < 20 cm; ** estimated volume of quality wood (future) when the mean dimen‐
sions, which were observed in the intermediate and old stands, will be reached. Letters indicate differences between
groups based on a significance level (p ≤ 0.05).Forests 2021, 12, 923 8 of 14
Figure 4. Height curve of the different structures.
3.2. Thinning Simulation
The trees, which were marked for cutting in the simulation were dominated by small
trees (Figure 5). While it was possible to select an average of 300 crop trees/ha to release
in the young stands, in the intermediate and old ones, only 60 and 47 trees/ha were found.
The proportion between the number of crop trees/ha and the total tree number/ha in the
young (1:6.4) and in the old stands (1:5.4) was very similar.
Figure 5. Number of stems to extract and to remain in the thinning simulation per diameter class. Left: young, centre:
intermediate, and right: old stands; the ordinates are differently scaled because otherwise, the charts with low number of
stems/ha (intermediate and old stands) would not be readable.
The number of trees to extract would be significantly higher in the young structure
compared to the intermediate and old structures, while the basal area and the total volume
to extract are only significantly different between the young and intermediate structures
(Table 5). The volume of mature stems to extract increases significantly between the youngForests 2021, 12, 923 9 of 14
and old structures. On the other hand, the QMD and mean height increased significantly
between extract and remained in all structures (Table 5).
Table 5. Parameters of the trees to be extracted and to be alive in the simulation in every structure. The density variables
(1–4) were compared between structures, while the size variables (5–6) within each structure (extract vs. remain).
Young Intermediate Old
Variables
Extract Remain Extract Remain Extract Remain
1 Number of stems/ha 3078 a 3200 a 697 b 1483 ab 450 b 707 b
2 Basal area [m2/ha] 18.3 a 37.8 a 11.0 b 45.9 a 13.6 ab 40.8 a
3 Total volumen [m3 o.b./ha] 180 a 373 a 109 b 452 a 134 ab 402 a
4 Volume of mature stems [m3 o.b./ha] (*) 5c 18 b 20 ab 154 a 48 a 201 a
5 QMD [cm] 8.7 b 12.3 a 14.2 b 19.8 a 19.6 b 27.1 a
6 Height of QMD‐trees [m] 8.5 b 9.7 a 10.3 b 13.1 a 11.6 b 16.7 a
* DBH ≥ 20 cm. Letters indicate differences between groups based on a significance level (p ≤ 0.05).
Most of the extracted wood in the thinning simulation would be firewood (Table 6).
Only little quality wood could be harvested. In the old stands, an appreciable share of
quality wood is from fallen trees.
Table 6. Product classes and volumes of the extractable wood of the thinning simulation (m3
u.b./ha).
Range of Products Young Intermediate Old
Firewood from the crowns and thin stems * 140 a 71 b 69 b
Badly formed stems 4b 13 ab 32 a
Quality wood ‐ 3b 11 (5 **) a
* DAP < 20 cm; ** correspond to quality logs of fallen trees. Letters indicate differences between
groups based on a significance level (p ≤ 0.05).
3.3. Growth of the Crop Trees
The average A‐value of the analysed trees reached 8.9 in the young and old stands
and 7.2 in the intermediate. These are quite high values compared to the recommended
ones (cf. Section 2.3.2), showing a high level of individual competition in all structures.
Considering the types of growth described in Section 2.3.2, the crop trees were
grouped, and every ten years, the mean value of the variables were determined (Figure
6). Comparing the evolutions of the variables in each growth type, there was practically
no difference in the mean height development, while the diameter increment and the stem
volume development shows clear differences (Figure 6). The trees of the dominant type
had a greater diameter growth since their early years, which caused their h/d value to
remain below 80 for most of their life (Figure 6, top left).
The increment of the dominant trees with dominant type growth is a good approxi‐
mation of the growth that could be reached in managed stands. The periodic annual di‐
ameter increment increased in the juvenile stage and then decreased quickly when the
stand was closing and equalled the mean annual increment at 25 years of age (Figure 7).Forests 2021, 12, 923 10 of 14
Figure 6. Development of each variable (mean value and standard error every ten years) from stud‐
ied crop trees of each growth type: dominant type, variable type, and suppressed type. Top left: h/d
ratio (80 indicates the limit value of stability), top right: height development; bottom left: diameter
development and bottom right: volume development. The stem volume at 75 years of trees of dom‐
inant type has a lower number of trees than in previous ages (in the age of 75 years there was data
from fewer trees to be considered in the mean value).
Figure 7. Development of the current annual increment (CAI) and the mean annual increment (MAI)
of tree diameter of the dominant type of growth.Forests 2021, 12, 923 11 of 14
4. Discussion
4.1. Credibility of Collected Data and What We Do and Don´t Know
The selection and classification of the different age stages of stands were made in
consideration of the trees’ dimensions but without knowing the real age. Because of that,
the distinction between the intermediate and the old stands is not always clear. Another
uncertainty is caused by the fact that it was often very difficult to identify all the annual
rings at the discs. Therefore, slight differences in the real age in the analysed trunks cannot
be ruled out.
The reduction in the number of trees in the unmanaged stands between the young
and old structure (Table 3) is explained by the mortality due to competition, and this is
also expressed in the high percentage of injured and dying trees in each structure (Table
4). The damages in the stems and crowns were probably caused by snow and wind in
trees with high h/d ratios due to the high stand density, expressed in high A‐values, and
the lack of light that controls the diameter increment, especially for the short trees. This is
also the reason why the number of selected crop trees is only optimal in the juvenile phase,
but without applying silviculture, it is reduced considerably in older stages.
Another aspect that may have an effect on vulnerability to damage, known from
other species in temperate climates, is that the vigour, sprouting capacity, and growth of
stump shoots decrease after three or more generations [21–23]. Lomatia hirsuta is a pioneer
species, which forms post‐fire mixed shrublands together with others such as Schinus pat‐
agonicus (Phil.) I. M. Johnst. ex Cabrera, Maitenus boaria (Mol.), and Nothofagus antarctica
(Forst.) Oerst. [5,11,24]. In the process of succession, they are gradually invaded and re‐
placed by species from the high forest, such as Austrocedrus chilensis and/or Nothofagus
dombeyi [5,24]. It was not possible to know the type of forest that existed before the last
wildfire. At present, the almost absolute dominance of L. hirsuta of stump regrowth, prac‐
tically without other tree species or its regeneration, suggests that the previous forest was
also dominated by the same species. And if so, it would then be possible that the studied
L. hirsuta forests also started after two or more previous fire events. This might be also the
reason for the loss of vitality and stability of the L. hirsuta with old rootstocks in the inter‐
mediate and old stands in El Manso Valley.
4.2. Possibility of Growth for High‐Quality Trees
In relation to the simulation of cutting applying the concept of crop trees, the fact that
the QMD increases due to the thinning, especially in the intermediate and old stands (Ta‐
ble 5), shows that the intervention resembled a low thinning more than the liberation of
the crop trees. This can be traced back to the low number of crop trees found. Although
the optimal phase to start the application of silviculture for quality improvement is al‐
ready over, the implementation of a crop tree‐orientated management in the young
stands, with three hundred registered aspirants to crop trees per hectare, should be still
possible and successful.
The trunk analysis of the dominant type of growth in dominant trees (Figure 7) shows
that it is possible to reach an MAI in DBH of 0.35 cm/year at the age of 70. Furthermore,
trunks with a DBH of 45 cm were registered, which had to have nearly the same age. This
means that an MAI of 0.6 cm/year seems to be achievable, too. This could be taken as an
indicator for the magnitude of the target diameter. Nevertheless, during the first pre‐com‐
mercial thinning in the young stands, almost no wood of sawn timber quality will be har‐
vested. On the other hand, the high volume of badly formed stems (139–194 m3/ha) in
intermediate and old stands (Table 4) is an indicator of the potential volume to improve
their quality through the application of forest management from an early age.Forests 2021, 12, 923 12 of 14
4.3. Parquizado Management and Fire Risk Reduction
The named problems of falling trees do not appear that intensely in the parquizado,
probably because in the intense thinning, the trees with less vitality were eliminated. The
fact that the diameter distribution of the parquizado is very similar to the others (Figure
3) shows that by cutting, trees of all diameters were removed. The trees in the parquizado
presented minor heights at the same diameters (Figure 4). This could be a sign that the
remaining trees could have reacted to the intervention by bigger diameter increments. On
the other hand, in the parquizado, the total volume and the continuity of biomass fuel is
much lower than in the other structures (visually appreciated). This leads to lower flam‐
mability and lower fire intensity in case of a fire event and results in a lower risk of wild‐
fires [25]. Moreover, for the parquizado, a forest regeneration concept must be developed
to ensure sustainability.
4.4. Recommendations for the Intermediate and Old Stands
Most of the wood harvested during the conversion to managed forests in the inter‐
mediate stands will be firewood and timber for handicraft or glued‐wood products. For
the conversion, the following steps are recommended:
1. Salvage and improvement cutting: This includes the extraction of fallen and unstable
trees or great damages to be obtained for their wood in favour of the better trees.
2. Remove patchy clearances to create space for natural regeneration or plantings.
3. Planting L. hirsuta in irregular holes in order to renew the stand and with the expec‐
tation of improving the vigour and quality of trees in the old phase. The question of
whether the vitality and productive quality of the stand can be improved through
the planting of seed trees is subject to research. L. hirsuta and seedlings of other native
species that are later successional stage of this forests, like A. chilensis or N. dombeyi,
could also be integrated. To succeed, it would be necessary to stop the grazing in the
stands with plantings; further, the stumps of the cut trunks have to be killed to pre‐
vent new shoot growth. In this context, knowledge about the biological‐technical
maximum rotation period of L. hirsuta should be researched in further studies.
4.5. Recommendations for Young Stands
Two hundred crop trees should be selected and favoured by extracting 1–3 competi‐
tors per tree. The objective is to have around 150 crop trees/ha at the age of harvesting. It
should be possible to reach a target diameter of 40 cm in 70 years by favouring the growth
of crop trees. Additionally, at least in the first interventions, the worst trees concerning
health conditions and quality should be extracted to reduce the general competition.
4.6. Additional Considerations
The proposed management is aimed to maintain the dominance of L. hirsuta in the
stand to promote the production of its quality wood. However, the entry of natural regen‐
eration of other shrub species also with the potential to produce quality wood, such as M.
boaria, or others of a later stage of the succession, such as A. chilensis or N. dombeyi, as they
occur, could be incorporated into this forest management. In this case, it should be taken
into account that A. chilensis and especially N. dombeyi, due to their greater growth and
development in height, will tend to dominate in the stand [5,24]. In this sense, new silvi‐
cultural research will be required for those conversion and management processes.
It is also suggested to apply the proposed thinning method in experimental units on
an operational scale. There, the responses to the crop trees could be monitored and the
results validated. Furthermore, in the experimental units, the predictions and their rela‐
tionships with other variables could be adjusted, for example, the effect of wet and dry
years. In that sense, the applicability in other site conditions, especially those with less
precipitation, should be evaluated.Forests 2021, 12, 923 13 of 14
5. Conclusions
It can be concluded that the pure L. hirsuta stands, as in El Manso Valley, have worth‐
while potential and that it would be possible to improve their quality and vigour. Giving
consideration to the actual situation, especially in the intermediate and old stands, it is clear
that it will be a slow and long process. The main problems are the very high density that con‐
tributes to individual growth reduction and high h/d ratio, which cause vitality loss and in‐
stability. Because of these aspects, it is necessary to implement forest management to improve
first their stability and then their quality. For the production of quality wood through thinning
oriented to crop trees, it is essential to start at the early age of the stand when there is a suffi‐
cient number of selectable trees. On the other hand, the use as parquizado should mainly take
place in areas with high fire risk, for example, along roadsides.
Author Contributions: Conceptualisation, G.A.L. and M.T.; methodology, G.A.L., H.K., and M.T.;
software, H.K. and G.A.L.; validation, M.C. and G.A.L.; formal analysis, G.A.L., M.C. and H.K.; in‐
vestigation, G.A.L.; resources, G.A.L.; data curation, H.K.; writing—original draft preparation, H.K.;
writing—review and editing, G.A.L., M.C., and M.T.; visualisation, H.K. and G.A.L.; supervision,
M.T.; project administration, G.A.L.; funding acquisition, H.K. and G.A.L. and M.T. All authors have
read and agreed to the published version of the manuscript.
Funding: This research was funded by the PROMOS Scholarship program of the German Academic
Exchange Service (DAAD) for travel costs and by UVT‐CIEFAP for the fieldwork And by HAWK
for the publication.
Data Availability Statement: The data presented in this study are available on request from the
corresponding author.
Acknowledgments: This study was realised as part of a cooperation agreement between CIEFAP in
Argentina and the University of Applied Sciences and Arts (HAWK) of Göttingen in Germany. We
would like to express our thanks to the owners of forests for the permission to realise the fieldwork
in their properties and also to the Servicio Forestal Andino de Río Negro for granting the permits
for the tree cutting. Further, our thanks go to the forest engineer Pedro Pantaenius for his help cut‐
ting the trees, to the student’s Candela Rodríguez and Diego Apablaza for their active support dur‐
ing the fieldwork.
Conflicts of Interest: The authors declare no conflict of interest. The funders had no role in the
design of the study, in the collection, analyses, or interpretation of data, in the writing of the manu‐
script, or in the decision to publish the results.
References
1. Tortorelli, L. Maderas y Bosques Argentinos, 2nd ed.; Orientación Gráfica Editora: Buenos Aires, Argentina, 2009; pp. 329–332.
2. Weinberger, P. Verbreitung und Wasserhaushalt araukano‐patagonischer Proteaceen in Beziehung zu mikroklimatischen
Faktoren. Flora 1974, 163, 251–264, doi:10.1016/S0367‐2530(17)31742‐5.
3. Eskuche, U. Estudios fitosociológicos en el norte de la Patagonia. I. Investigación de algunos factores de ambiente en comuni‐
dades de bosque y de chaparral. Phytocoenologia 1973, 1, 64–113.
4. Seibert, P. Die Vegetationskarte des Gebietes von El Bolsón, Prov. Río Negro, und ihre Anwendung in der
Landnutzungsplanung. In Bonner Geographische Abhandlungen; Hahn, H., Kuls, W., Lauer, W., Höllermann, P., Boesler, K.A.,
Ruckert, H.‐J., Eds.; Ferd. Dümmlers Verlag: Bonn, Germany, 1979; Volume 62, pp. 14–16.
5. Kitzberger, T. Ecotones Between Forest and Grassland; Springer: New York, NY, USA, 2012; p. 63, doi:10.1007/978‐1‐4614‐3797‐0.
6. Lusk, C.H.; Corcuera, L.J. Effects of light availability and growth rate on leaf lifespan of four temperate rainforest Proteaceae.
Rev. Chil. Hist. Nat. 2011, 84, 269–277.
7. Figueroa, J.A.; Lusk, C.H. Germination requirements and seedling shade tolerance are not correlated in a Chilean temperate
rain forest. New Phytol. 2001, 152, 483–489, doi:10.1046/j.0028‐646X.2001.00282.
8. Reque, J.; Sarasola, M.; Gyenge, J.; Fernández, M.E. Caracterización silvícola de los ñirantales de la cuenca central del Río Foyel
(Río Negro, Patagonia Argentina). Bosque 2006, 28, 33–45.
9. Gyenge, J; Fernández, M.E.; Sarasola, M.; de Urquiza, M.; Schlichter, T. Ecuaciones para la estimación de biomasa aérea y volu‐
men de fuste de algunas especies leñosas nativas en el valle del río Foyel, NO de la Patagonia argentina. Bosque 2009, 30, 95–
101, doi:10.4067/S0717‐92002009000200005.
10. Gyenge, J.; Fernández, M.E.; Sarasola, M.; Schlichter T. Testing a hypothesis of the relationship between productivity and wa‐
ter use efficiency in Patagonian forests with native and exotic species. For. Ecol. Manag. 2008, 255, 3281–3287,
doi:10.1016/j.foreco.2008.01.078.Forests 2021, 12, 923 14 of 14
11. Goldenberg, M.G.; Oddi, F.J.; Gowda J. H.; Garibaldi, L.A. Shrubland Management in Northwestern Patagonia: An Evaluation
of Its Short‐Term Effects on Multiple Ecosystem Services. In Ecosystem Services in Patagonia: A Multi‐Criteria Approach for an
Integrated Assessment; Peri. P.L., Martínez‐Pastur, G., Nahuelhual, L., Eds.; Springer Nature: Cham, Switzerland, 2021; Chapter
5, ISBN 978‐3‐030‐69165‐3.
12. Porto Tapiquén, C.E. “South America” Layer (Shape File). Orogenesis Geographic Solutions. Porlamar, Venezuela 2015. Based
on layers from Enviromental Systems Research Institute (ESRI). Free Distribution. Available online: http://tapiquen‐
sig.jimdo.com (accessed on 8 July 2021).
13. Rogel, M. (Animal Breeder, El Manso, Río Negro, Argentina). Personal communication, 2020.
14. IUSS Working Group WRB. World Reference Base for Soil Resources. International Soil Classification System for Naming Soils and
Creating Legends for Soil Maps—Update 2015; World Soil Resources Reports No. 106; FAO: Rome, Italy, 2014; updated 2015; ISBN
978‐92‐5‐108369‐7.
15. Buduba, C.; La Manna, L.; Irisarri, J. El suelo y el bosque en la Región Andino Patagónica. In Suelos y Vulcanismo: Argentina, 1st
ed; Imbellone, P., Barbosa, O., Eds.; Asociación Argentina de la Ciencia del Suelo: Buenos Aires, Argentina, 2020; pp. 361–390,
doi:10.24215/25456377e139.
16. Smalian, H.L. Beitrag zur Holzmeßkunst; C. Löffler Verlag: Stralsund, Germany, 1837.
17. Huber, F.X. Hilfstafeln für Bedienstete des Forst‐ und Baufaches: Zunächst zur Leichten und Schnellen Berechnung des Massengehaltes
Roher Holzstämme und der Theile Derselben, und Auch zu Anderm Gebrauche für Jedes Landesübliche Maaß Anwendbar; Fleischmann
E.A.: München, Germany, 1828.
18. Pretzsch, H. Grundlagen der Waldwachstumsforschung, 2nd ed.; Springer‐Verlag: Berlin, Germany, 2019, doi:10.1007/978‐3‐662‐
58155‐1.
19. Pretzsch, H. Forest Dynamics, Growth and Yield. From Measurement to Model; Springer: Berlin, Germany, 2009, doi:10.1007/978‐3‐
540‐88307‐4.
20. Šēnhofa, S.; Katrevičs, J.; Adamovičs, A.; Bičkovskis, K.; Bāders, E.; Donis, J.; Jansons, A. Tree Damage by Ice Accumulation in
Norway Spruce (Picea abies (L.) Karst.) Stands Regarding Stand Characteristics. Forests 2020, 11, 679, doi:10.3390/f11060679.
21. Nicolescu, V.‐N.; Carvalho, J.; Hochbichler, E.; Bruckman, V.; Piqué‐Nicolau, M.; Hernea, C.; Viana, H.; Štochlová, P.; Ertekin,
M.; Tijardovic, M.; et al. Silvicultural Guidelines for European Coppice Forests; Albert‐Ludwigs‐Universität Freiburg: Freiburg, Ger‐
many, 2017; pp. 4–5.
22. Burschel, P.; Huss, J. Grundriss des Waldbaus. Ein Leitfaden für Studium und Praxis; Parey Buchverlag: Berlin, Germany, 1997; p.
487.
23. Nyland R. D. Silviculture. Concepts and Applications, 2nd ed.; Waveland Press, Inc.: Long Grove, USA, 2002; p. 682, ISBN 978-1‐
57766‐527‐4.
24. Veblen, T.T.; Kitzberger, T.; Lara, A. Disturbance and forest dynamics along a transect from Andean rain forest to Patagonian
shrublands. J. Veg. Sci. 1992, 3, 507–520, doi:10.2307/3235807.
25. Corona, P.; Ascoli, D.; Barbati, A.; Bovio, G.; Colangelo, G.; Elia, M.; Garfi, V.; Iovino, F.; Lafortezza, R.; Leone, V.; et al. Inte‐
grated forest management to prevent wildfires under Mediterranean environments. Ann. Silvic. Res. 2015, 39, 1–22,
doi:10.12899/ASR‐946.You can also read