Localized Surface Plasmon Enhanced Laser Reduction of Graphene Oxide for Wearable Strain Sensor
←
→
Page content transcription
If your browser does not render page correctly, please read the page content below
Research Article
www.advmattechnol.de
Localized Surface Plasmon Enhanced Laser Reduction
of Graphene Oxide for Wearable Strain Sensor
Zhengfen Wan, Shujun Wang, Ben Haylock, Zhiqing Wu, Tuan-Khoa Nguyen,
Hoang-Phuong Phan, Robert Sang, Nam-Trung Nguyen, David Thiel, Sergio Koulakov,
Adrian Trinchi, Yongsheng Gao, Mirko Lobino, and Qin Li*
such as, surface plasmon resonance sen-
Laser reduced graphene has been increasingly attracting broad attention sors[2] and surface enhanced Raman
owing to its unique properties and potential applications in energy conver- scattering (SERS).[3] Within a lifetime of
sion and storage, flexible electronics, optoelectronics, and nanocomposites. 10 fs,[4] the surface plasmon decays by
photon emission or by exciting energetic
In this study, graphene sheets decorated with Au nanoparticles are fabricated
charge carriers, which rapidly thermalize
in situ using milliwatt femtosecond laser reduction. The findings reveal an with the metal lattice at a time scale
enhancement in both the reduction of graphene oxide sheets and the nuclea- of a few picoseconds.[5] In the thermal
tion and growth of the Au nanoparticles during the in situ laser treatment. decay, the metal nanoparticles can serve
Three stages of reactions are considered, namely, (i) the spontaneous redox as photo thermal sources and perform
as local nanoantennae to enhance the
reaction between HAuCl4 and graphene oxide, (ii) the laser-induced decom-
optical energy absorption at a selected
position of HAuCl4 and reduction of graphene oxide, and (iii) the localized plasmon frequency.[6] Ratchford reported
surface plasmon resonance enhanced photoreduction in the presence of Au that before the thermalization of these hot
particles. Moreover, the Au nanoparticles form densely and evenly distributed carriers, the loss of surface plasmons can
square-lattice-like microcrack networks that ensure a linear resistance change induce charge transfer from the metal to
over the tested strain range. This microcrack network architecture enables the the adjacent semiconductors, generating
a current or driving a chemical reaction.[7]
development of flexible graphene/Au strain sensors with gauge factors up to
This plasmon-induced charge transfer
52.5, and linear behaviour up to 25.4% strain. This strain sensor is demon- process can be employed to improve
strated to effectively monitor human motions. The findings leverage the resis- photocatalysis, fabricate photodetectors, or
tive properties of graphene/metal nanoparticle composites with fundamental stimulate selective photochemistry.
mechanisms, laying a critical step toward highly functional, low-cost, flexible, Graphene has drawn tremendous
attention due to its extraordinary prop-
and wearable graphene-based electronics.
erties including high electrical and
thermal conductivities, optical transpar-
ency, and high mechanical strength.[8–10]
1. Introduction Among diverse fabrication methods of graphene,[11,12] laser
reduced graphene oxide (LRGO) has recently attracted signifi-
Surface plasmon (SP), a collective electron oscillation along the cant interest,[13–16] owing to its suitability for industrial produc-
surface of a metal, typically observed in gold (Au) or silver (Ag), tion, and localized treatment and patterning without the use of
has been studied extensively for various advanced applications[1] chemicals.[17–19] Based on the LRGO, various applications have
Dr. Z. Wan, Dr. S. Wang, Z. Wu, Dr. T.-K. Nguyen, Dr. H.-P. Phan, Dr. B. Haylock, Prof. R. Sang, Prof. M. Lobino
Prof. N.-T. Nguyen, Prof. M. Lobino, Prof. Q. Li Centre for Quantum Dynamics
Queensland Micro- and Nanotechnology Centre School of Environment and Science
Griffith University Griffith University
Nathan, Brisbane, QLD 4111, Australia Nathan, Brisbane, QLD 4111, Australia
E-mail: qin.li@griffith.edu.au S. Koulakov
Dr. Z. Wan, Dr. S. Wang, Z. Wu, Prof. D. Thiel, Prof. Y. Gao, Prof. Q. Li Aquarius Technologies Pty Ltd.
School of Engineering and Built Environment 19 Overlord Place, Acacia Ridge, Brisbane, QLD 4110, Australia
Griffith University Dr. A. Trinchi
Nathan, Brisbane, QLD 4111, Australia CSIRO Manufacturing
Clayton, Melbourne, VIC 3168, Australia
The ORCID identification number(s) for the author(s) of this article
can be found under https://doi.org/10.1002/admt.202001191. Prof. Y. Gao
Institute for Integrated Intelligent Systems
Griffith University
DOI: 10.1002/admt.202001191 Nathan, Brisbane, QLD 4111, Australia
Adv. Mater. Technol. 2021, 6, 2001191 2001191 (1 of 11) © 2021 Wiley-VCH GmbH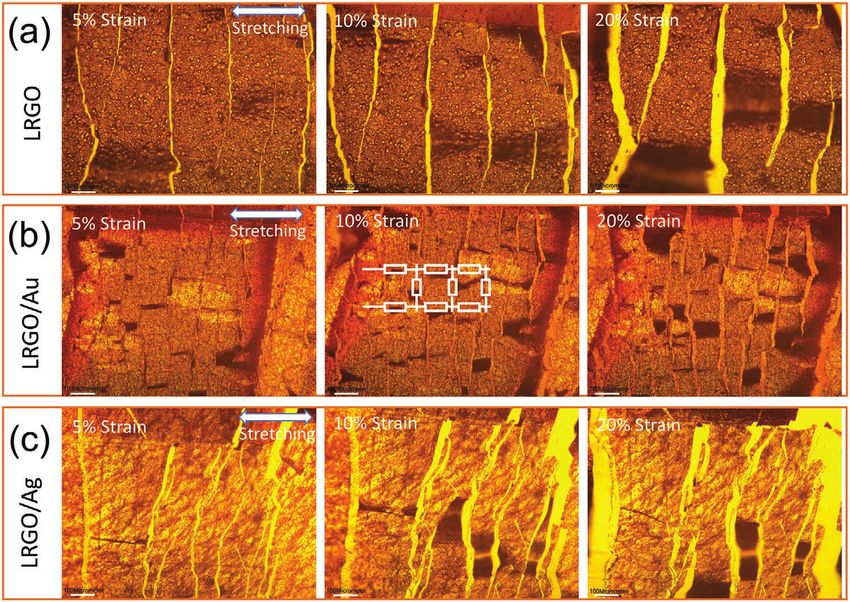
www.advancedsciencenews.com                                                                                                    www.advmattechnol.de

been demonstrated such as supercapacitors, sensors, field effect             resistance change.[25] We hypothesize that the key factor for a
transistors, solar cells, and optical devices.[20,21] Due to the facile      graphene-based strain sensor to offer good linearity over a large
fabrication and accessible measurement of electrical signal, resis-          strain range relies on the control of the cracks in the graphene
tive sensors have become one of the most studied sensors.[22]                film, where the cracks function as the displacement-determined
However, the quality of LRGO varies greatly, depending on the                resistors. Dense and evenly distributed cracks in high quality
laser wavelength, pulse frequency, and power. Femtosecond                    graphene films will significantly improve the performance of
laser induced LRGO has the advantage of refined spatial reso-                strain sensors.
lution and low laser power demand, albeit the resultant LRGO                    Herewith, we introduce a new class of LRGO/Au strain sen-
graphenenity and conductivity are typically low.[19]                         sors by simultaneously reducing GO film mixed with HAuCl4
   Flexible strain sensors utilizing graphene are receiving                  solution with a femtosecond (fs) laser. Our strain sensor shows
increased attention for their tremendous potential in health                 high sensitivity (GF 52.5), excellent stretchability (strain up
monitoring, artificial skins, robotic sensors, and human-                    to 25.4%), full-range linear behaviour, and excellent stability
machine interfaces.[23,24] Tian et al. reported a graphene strain            (500 testing cycles and consistent operation over 1 year). Fur-
sensor with a gauge factor (GF) of 9.49 (strain up to 10%) by                thermore, we investigated the underlying mechanisms of
directly reducing GO film with a light-scribe DVD burner.[25]                the improved strain sensing performance of the LRGO/Au
Carvalho et al. demonstrated a low-cost laser-induced graphene               composites formed by laser treatment. The localized surface
strain sensor with a GF of 40 and strain only up to 1.5% by                  plasmon resonance (LSPR) of the Au nanoparticles enhanced
ultraviolet irradiation of commercial polyimide.[26] Besides the             the reduction of GO. Moreover, the emergence of Au nanopar-
pure graphene, Ren and coworkers reduced GO films doped                      ticles between graphene sheets enhances the generation and
with Ag nanoparticles with a 450 nm laser, which resulted in                 propagation of film microcracks by serving as the strain con-
a LRGO/Ag strain sensor exhibiting nonlinear relationship                    centration spots. Both the enhanced reduction of GO and the
between strain and the relative resistance change (GF of 183                 increased microcracks contribute to the excellent performance
within strain 0%–8%, GF of 475 within strain 8%–14.5%).[26]                  of the LRGO/Au strain sensor.
This nonlinearity, which makes the calibration process complex
and difficult, is considered as one of the major drawbacks of
resistive type strain sensors.[27] Thus, further investigation into          2. Results and Discussion
the laser reduction method is imperative to develop the flex-
ible strain sensor with wide detection range, high sensitivity,              Figure 1a schematically illustrates the mixing of GO solution
and a more linear behaviour. The crack in the graphene strain                with HAuCl4 or Ag nanoparticles (NPs). The fabrication process
sensor was considered to be the main mechanism to induce the                 of the sensor is shown in Figure 1b and the detailed description

Figure 1. a) The schematic of the mixing of GO with HAuCl4 or Ag nanoparticles, b) the fabrication process of the sensor, c) the test of strain sensor,
and d) the application of monitoring human motion. The inset of image (d) shows the photograph of the strain sensor. e) The TEM image of GO/Au;
the inset is the enlarged image. The scale bar is 500 nm and its inset is 20 nm. f) The SEM images of GO/Au partly treated by laser with the bird’s
eye view. The scale bar is 1 µm. Its inset is the overall SEM image of laser treated area with scale bar of 1 µm. g) The TEM image of LRGO/Au and its
zoom-in image, the scale bar is 5 nm. h) The comparion of Au4f XPS spectra of GO/Au and LRGO/Au (power 5 mW, scan speed 5 µm s−1).

Adv. Mater. Technol. 2021, 6, 2001191                            2001191 (2 of 11)                                             © 2021 Wiley-VCH GmbH
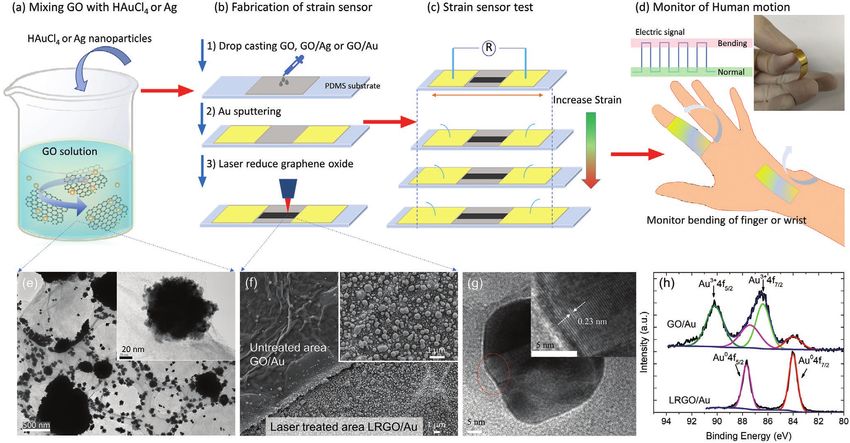
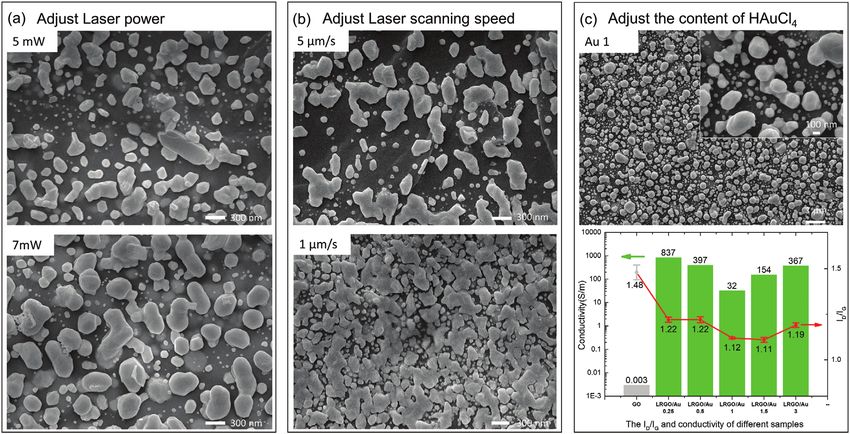
www.advancedsciencenews.com                                                                                             www.advmattechnol.de

presented in the Experimental Section. To test the sensor, the              High-resolution transmission electron microscopy (HRTEM)
resistance is measured subject to variations in strain, as in            image of Au NP on LRGO/Au film, Figure 1g, shows that the
Figure 1c. We demonstrated practical applications of the as-fab-         rough surface edges of NPs in the GO/Au mixture, Figure 1e,
ricated strain sensors in monitoring human motions and ges-              have become smooth after the laser treatment, indicating
tures by attaching the sensor onto the finger or wrist, Figure 1d.       the undergoing of thermal annealing. The measured lattice
   Figure 1e shows the transmission electron microscopy (TEM)            spacing is 0.23 nm, close to the lattice spacing (0.236 nm) cor-
image of GO/HAuCl4 mixture when drop cast onto the polydi-               responding to the spacing of the (111) crystal plane of face-cen-
methylsiloxane (PDMS) substrate. The size of the NPs on the              tered cubic gold.[30] Figure 1h illustrates the peak fitted Au 4f
GO sheets range from tens of nanometers up to around 1 µm.               X-ray photoelectron spectroscopy (XPS) spectra of GO/Au and
The inset shows the magnified image of a small NP of about               LRGO/Au (5 mW). The Au04f5/2 (87.4 eV) and Au04f7/2 (84 eV)
50 nm. An energy dispersive X-ray spectroscopy (EDX) analysis            peaks represent the binding energies of reduced Au particles,
(Figure S1a, Supporting Information) of these NPs reveals the            while Au3+4f5/2 (90.2 eV) and Au3+4f7/2 (86.4 eV) peaks corre-
amount of elemental Au is much greater than chlorine (atomic             spond to the binding energies of Au ions.[31,32] For the mixture
concentration 98% Au, 2% Cl), indicating that a part of AuCl4− was       of GO/HAuCl4, both the peaks of Au0 and Au3+ are observable,
reduced to Au and these NPs are a mixture of HAuCl4 precipitates         confirming the existence of both reduced Au particles and Au
and Au. The aromatic conjugated domains are hypothesized to act          ions. For LRGO/Au, only the peak of Au° can be observed.
as electron-donating sources to reduce Au3+ to Au nanoparticles          It can be concluded that all the Au ions on the surface were
after the mixture of HAuCl4 and GO.[28] Therefore, redox reactions       reduced to Au0 particles with laser treatment, and the initial
between GO and HAuCl4 can spontaneously take place without               spontaneous reduction of Au3+ only converted a fraction of the
external stimuli, which is consistent with our observation.              Au3+ in the mixture.
   Scanning electron microscopy (SEM) images of the untreated
and laser-treated GO/HAuCl4 composite film, Figure 1f,
show an obvious step between the laser treated area and the              3. Laser Reduction of GO/HAuCl4
untreated area. This step is likely caused by laser burning, ther-
mally removing a part of the GO sheets from the top surface.[29]         The surface morphology of LRGO/Au can be modulated by
Figure 1f clearly shows that before laser treatment, the Au NPs          adjusting the laser power and scanning speed of the femtosecond
were sparsely distributed on the GO top layer, whilst after the          laser. Figure S2a,b, Supporting Information, shows the SEM
laser treatment, the density of the Au NPs has been tremen-              image of LRGO/Au as a function of the laser power and scanning
dously increased accompanied with a morphology change. The               speed. Increasing the laser power from 5 to 7 mW, the sparsely
inset image reveals that the size of the nano Au particles on the        distributed Au nanoparticles on the top surface of LRGO/Au
top surface after the laser treatment varied from tens to about          turn to be denser and larger in size, as shown in Figure 2a. From
400 nm, suggesting some NPs have merged into larger sizes.               Figure 2b, it is clear that decreasing the laser scanning speed

Figure 2. The SEM images, ID/IG in Raman and conductivity of LRGO/Au with different Au contents. a) The SEM images of the LRGO/Au with average
laser power of 5 and 7 mW at a scan speed of 20 µm s−1. The scale bar is 300 nm. b) The SEM images of the LRGO/Au with average laser power of
3 mW at a scan speed of 5 µm s−1 and 1 µm s−1. The scale bar is 300 nm. c) The SEM images of the LRGO/Au 1 and the ID/IG in Raman spectra and
conductivity of LRGO/Au with different Au content of 0.25, 0.5, 1, 1.5, and 3. The scale bar of SEM image is 1 µm and its inset is 100 nm.

Adv. Mater. Technol. 2021, 6, 2001191                         2001191 (3 of 11)                                        © 2021 Wiley-VCH GmbH
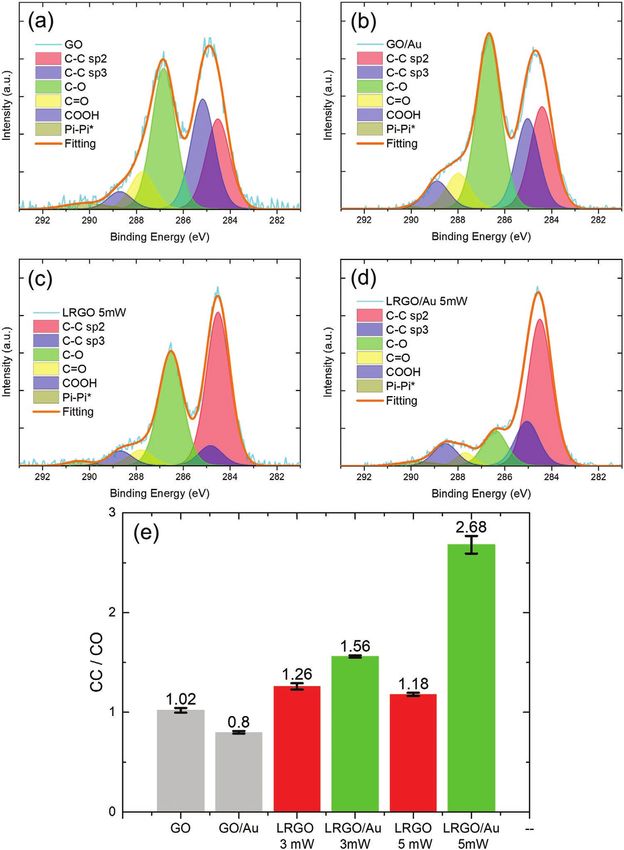
www.advancedsciencenews.com www.advmattechnol.de Figure 3. Peak fitted C1s XPS spectra of a) GO, b) GO/Au, c) LRGO treated with 5 mW laser, d) LRGO/Au treated with 5 mW laser. e) The ratio of the percentage of CC bond to that of CO bond with different samples. from 5 down to 1 µm s−1 also enhances the density of Au nano (ID/IG) which indicates the degree of disorder in the graphene- particles. Figure 2c and Figure S2c, Supporting Information, structure decreases greatly compared to that of GO. The conduc- demonstrate the SEM image of LRGO/Au under various quantity tivity of LRGO/Au is enhanced to 837 S m−1 (for LRGO/Au 0.25), ratios (0.25, 0.5, 1, 1.5, 3) as well as their ID/IG of Raman spectra 5 orders of magnitude larger than that of GO. For the Au concen- and conductivity. The LRGO/Au 0.25 and LRGO/Au 0.5 show the trations studied, the conductivity of LRGO/Au varies from 32 to partial removal of the surface, exposing some Au nanoparticles. 837 S m−1. This improved conductivity well agrees with fewer For LRGO/Au 1 and LRGO/Au 1.5, the GO on the top surface observed structural defects in the Raman spectra. was completely burned away and numerous Au nanoparticles Figure 3 shows the peak fitted C1s XPS spectra of GO, GO/ emerged. The significant structural modifications can be reflected Au, LRGO, and LRGO/Au. The spectra of GO and GO/Au in in their Raman spectra of GO and LRGO/Au (0.25, 0.5, 1, 1.5, 3). Figure 3a,b show an increase in CO bond after mixing GO For LRGO/Au (0.25, 0.5, 1, 1.5, 3), the band intensity ratio with HAuCl4, suggesting the redox reaction between GO and Adv. Mater. Technol. 2021, 6, 2001191 2001191 (4 of 11) © 2021 Wiley-VCH GmbH
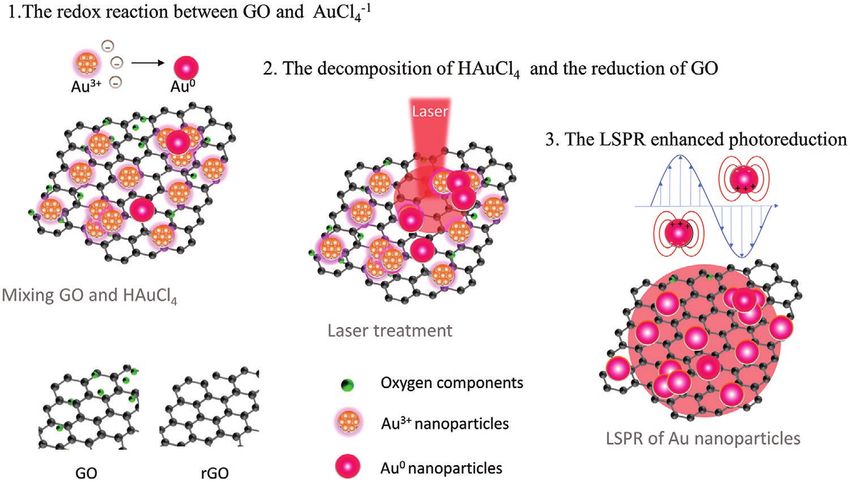
www.advancedsciencenews.com www.advmattechnol.de Figure 4. The schematic illustration of reactions of GO/Au in the whole process. HAuCl4, where GO is oxidized. The XPS results of LRGO Moreover, the intense thermal effect induced by the LSPR could treated at the laser power of 3 and 5 mW (scan speed 5 µm s−1) also sinter Au nanoparticles together into larger particles. in Figure S3a, Supporting Information, and Figure 3c reveal Figure 4 summarizes the reactions in the LRGO/Au forma- that only a small amount of oxygen content (about 5%) was tion process. When GO was mixed with HAuCl4 in solution, a removed. In contrast, the same laser treatment (3 or 5 mW redox reaction occurred where HAuCl4 was partially reduced to with scan speed 5 µm s−1) on GO/Au resulted in significantly Au nanoparticles and GO was oxidized, as shown by the XPS improved oxygen removal as shown by the C1s high resolution data in Figure 1h and 3b. The reduction potential of AuCl4−1 scan in Figure S3b, Supporting Information, and Figure 3d. (0.76V vs SCE, saturated calomel electrode) is higher than that Table S1, Supporting Information, lists the atomic concentra- of GO (0.48 V vs SCE).[38,39] During laser reduction on the film tion percentage of all chemical states of GO, GO/Au, LRGO, of GO intercalated with the mixture of HAuCl4 precipitates and LRGO/Au in the XPS spectra. The CC refers to the sum of and Au NPs, the decomposition of HAuCl4 to Au and the par- CC sp2 and CC sp3 and the CO is the combination of CO, tial reduction of GO occurs simultaneously by the photoreduc- CO, and COOH. Figure 3e shows that the percentage ratio of tion of the laser. Zhao et al. proposed that the HAuCl4 was the CC bond to the CO bond (CC/CO) rises from 0.80 (GO/Au) reduced to Au nanoparticles due to the multiphoton process to 2.85 (LRGO/Au 5 mW), which is more than twofold increase of the 800 nm femtosecond laser.[40] Thermal decomposition of than the system containing only GO, 1.19 (LRGO 5 mW). This HAuCl4 to Au occurs at a temperature above 160 °C.[41] Mean- data illustrates the superior of the LRGO/Au binary system in while, the reduction of GO results from both the photochemical removing oxygen under mW femtosecond laser treatment. and photothermal effects of laser.[20,42] Therefore, the decompo- It can be concluded that in the presence of Au nanopar- sition of HAuCl4 and the reduction of GO are attributed to both ticles, the reduction of GO is significantly improved, which laser induced photothermal and photochemical effects. Unique may result from the increased thermal effect due to LSPR of to the binary composite film of GO/ HAuCl4, as the popula- Au nanoparticles as well as photo-induced charge transfer. tion of Au NPs increased under the laser treatment, the laser The LSPR of Au or Ag nanoparticles derives from the photo- reduction effect on GO magnified owing to the LSPR effect. induced collective oscillation of conduction band electrons,[33] The LSPR has been reported to enhance the photothermal effi- which can participate in the reaction or produce heat by self- ciency[43,44] as well as induce charge transfer for the photochem- collision.[34] It was reported that, as highly active photocatalysts, ical reaction;[45] both mechanisms could be at play, contributing the hot electrons excited by the LSPR of noble nanoparticles to the significantly enhanced photothermal and photochemical could be injected into the conduction band of GO, resulting effects in the laser reduction process for reducing HAuCl4 to in GO reduction.[35] Also, most of the hot electrons transfer Au NPs and GO to LRGO. These photo-reduced Au nanoparti- their energy to heat by electron–electron or electron–phonon cles will continually boost the entire reduction process, which collisions.[33] The resulting photothermal effect contributes to eventually results in the highly reduced GO and dense Au the enhanced reduction of GO. The surface plasmon absorp- nanoparticles on the surface. Figure S3c, Supporting Informa- tion of Au nanoparticles can be tuned over a broad range, from tion, illustrates the XPS of GO/Au and LRGO/Au treated with 517 to 575 nm by adjusting size,[36] and from 600 to 873 nm 5 mW laser at different scan speeds. The LRGO/Au demon- by changing the particle geometry.[37] Since the wavelength of strates a high degree of oxygen removal at scan speeds of 5, 10, our laser is 780 nm and the Au nanoparticles are irregularly and 20 µm s−1. After mixing with Au nanoparticles, the high shaped, as shown in Figure 2c, the enhanced oxygen removal reduction efficiency of GO can be achieved with an increasing can be ascribed to the LSPR of the reduced Au nanoparticles. laser scan speed. Adv. Mater. Technol. 2021, 6, 2001191 2001191 (5 of 11) © 2021 Wiley-VCH GmbH
www.advancedsciencenews.com www.advmattechnol.de Figure 5. a,b) The XPS spectra of GO/Ag and LRGO/Ag (5 mW). c) The ID/IG of GO, LRGO, LRGO/Au, and LRGO/Ag treated with 5 mW laser. d) The carrier mobility of GO, LRGO, LRGO/Au, and LRGO/Ag treated with 5 mW laser. To verify the role of LSPR in laser induced GO reduction, From the Raman spectra of a) GO, b) LRGO (5 mW), Ag NPs of 30-nm diameter were also mixed with GO for laser c) LRGO/Au (5 mW), d) LRGO/Ag (5 mW) shown in Figure S5, treatment, as shown by the TEM image in Figure S4a, Sup- Supporting Information, the band intensity ratio (ID/IG) is porting Information. Figure S4b–d, Supporting Information, extracted as the indictor for the degree of graphitization, dis- shows the SEM image of the Ag-doped GO sample. Figure S4b, played in Figure 5c. After being treated with laser (5 mW), the Supporting Information, shows the SEM image of partially ID/IG of LRGO (1.35) only slightly decreased compared to that reduced GO/Ag at a low magnification. A notable contrast in of the parent material, GO (1.37). The introduction of metal morphology between the laser treated area and untreated area NPs has induced a considerable decrease of ID/IG, namely is observed. Figure S4c, Supporting Information, shows a mag- 1.17 for LRGO/Au and 1.22 for LRGO/Ag, suggesting a larger nified SEM image of GO/Ag, where aggregation of Ag nanopar- average size of the sp2 domains of LRGO/Au and LRGO/Ag ticles into several hundreds of nanometers among the GO is than that of LRGO.[47] seen. The magnified SEM image of LRGO/Ag Figure S4d, Sup- Figure 5d shows the carrier mobility of GO, LRGO, LRGO/ porting Information, illustrates the partly sunken surface of the Au, and LRGO/Ag (all subjected to 5 mW power and at 5 µm s−1 film, which may result from the exposure of air trapped inside scanning speed) obtained from the Hall effect measurement. the GO/Ag during film fabrication after a part of the GO mate- The carrier mobility of LRGO reaches 94 cm2 V−1 s−1, much rial on the surface was burned away by the laser. Figure S4e, larger than that of GO (11 cm2 V−1 s−1), due to fewer defects/ Supporting Information, shows the EDX of particles of LRGO/ impurities and larger graphitic sp2 domains after laser reduc- Ag, verifying the content of silver in the film. tion.[48] It’s worth noting that the carrier mobility of LRGO/ The XPS comparison of GO/Ag and post-treatment LRGO/ Au was further improved to 946 cm2 V−1 s−1, attributed to the Ag (power 5 mW, scanning speed 5 µm s−1), Figure 5a,b, also enhanced reduction of GO and the effective bridging of Au showed significantly enhanced removal of CO bonds, sim- nanoparticles between reduced GO sheets. On the other hand, ilar to that of LRGO/Au. The localized plasmon resonance the LRGO/Ag exhibits a lower carrier mobility of 10 cm2 V−1 s−1, frequency of Ag nanoparticles can also be tuned to cover a which may result from Ag nanoparticles induced gaps between broad range by varying their sizes and shapes, for instance, LRGO sheets and the incongruent contacts between Ag nano- from 400 to 700 nm in one study.[46] The pre-formed Ag NPs particles and LRGO sheets. The different result of LRGO/Ag appeared to concentrate more photothermal energy, since our and LRGO/Au might be caused by the better matching between SEM investigation observed uniformly distributed “holes” a few the LSPR frequency of Au nanoparticles with the laser, than micrometers apart on the LRGO/Ag film, which is an indica- that of Ag nanoparticles. Evidently, metal nanoparticles can tion of locally intensified thermal ablation. The XPS analysis be applied for the improvement of laser reduction of GO and suggests that the LSPR effect of Ag NPs has enhanced the the LSPR is a reasonable mechanism behind the enhanced removal of CO bond, similar to LRGO/Au. reduction. Adv. Mater. Technol. 2021, 6, 2001191 2001191 (6 of 11) © 2021 Wiley-VCH GmbH
www.advancedsciencenews.com www.advmattechnol.de
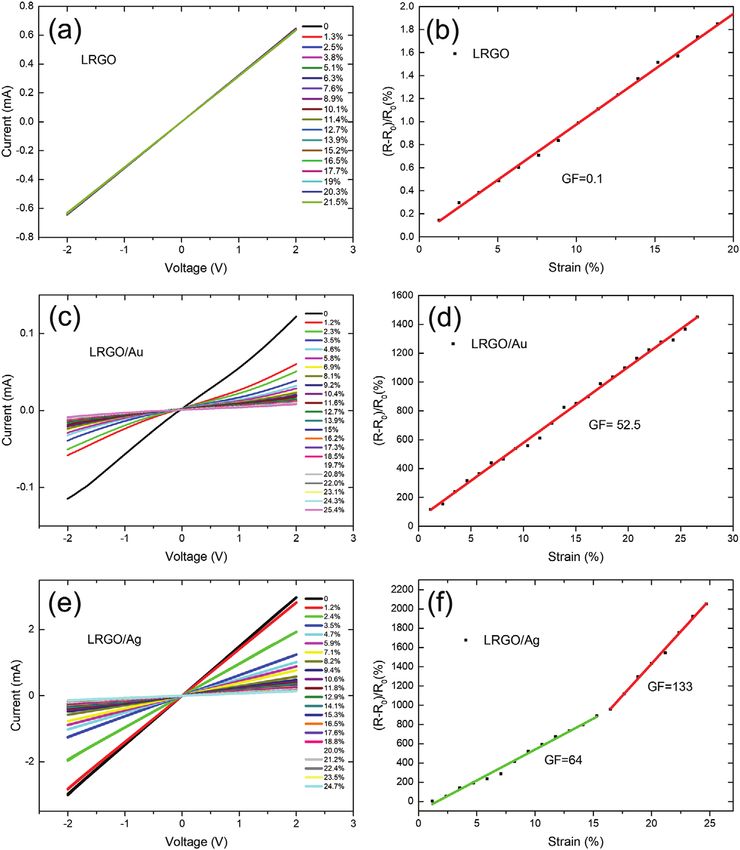
Figure 6. a,c,e) The I–V curves under different strains of a) LRGO, c) LRGO/Au, and e) LRGO/Ag. The relative resistance change under different
strains: b) LRGO, The GF was 0.1 under 21% strain. d) LRGO/Au, the GF was 52.5 under 25.4% strain. f) LRGO/Ag, the GF was 64 under 15.3% strain,
133 under 24.7% strain.
4. Strain Sensor Application the contact resistances, while the sliding of graphene sheets is
the dominant mechanism resulting in resistance change under
The electrical resistance of LRGO, LRGO/Ag, and LRGO/Au on strain.[25] Figure 6c shows the response of the LRGO/Au sensor
the flexible substrate (i.e., PDMS) was measured under applied under varied strains. The current of LRGO/Au decreased mark-
strains and the GF were calculated. edly with the increase in strain, which directly resulted from the
increase in the resistance of LRGO/Au. Figure 6d plots the rela-
GF = ( ∆R /R0 ) /ε (1) tive resistance change of LRGO/Au under strains ranging from
0% to 25.4%, corresponding to a large GF of 52.5 throughout
where, the ΔR is the resistance change; R0 the initial resistance; the strain range of 0%−25.4%, which is extraordinary for a flex-
ε the strain. ible strain sensor. The strain sensing performance of LRGO/
Figure 6a,b presents the I–V curves and the relative resist- Ag shows higher sensitivity, however, with two linear regimes,
ance change (ΔR/R0) of the LRGO under different strains namely GF = 64 in strain range of 0%−15.3%, and GF = 133 in
measured with the two-probe configuration, respectively. It the range of 15.3%−24.7%, Figure 6e,f.
is clear that LRGO is almost insensitive to strain, with an Figure 7a–c shows the microscopic images of LRGO, LRGO/
extremely small GF of about 0.1 over a wide strain range up to Au, and LRGO/Ag under strains of 5%, 10%, and 20%. It can
21%. For the LRGO sensor, the resistance between neighboring be noted that as the strain increased from 5% to 20%, all the
graphene sheets is determined by their overlapping areas and three samples demonstrate expanded cracks, which extended
Adv. Mater. Technol. 2021, 6, 2001191 2001191 (7 of 11) © 2021 Wiley-VCH GmbH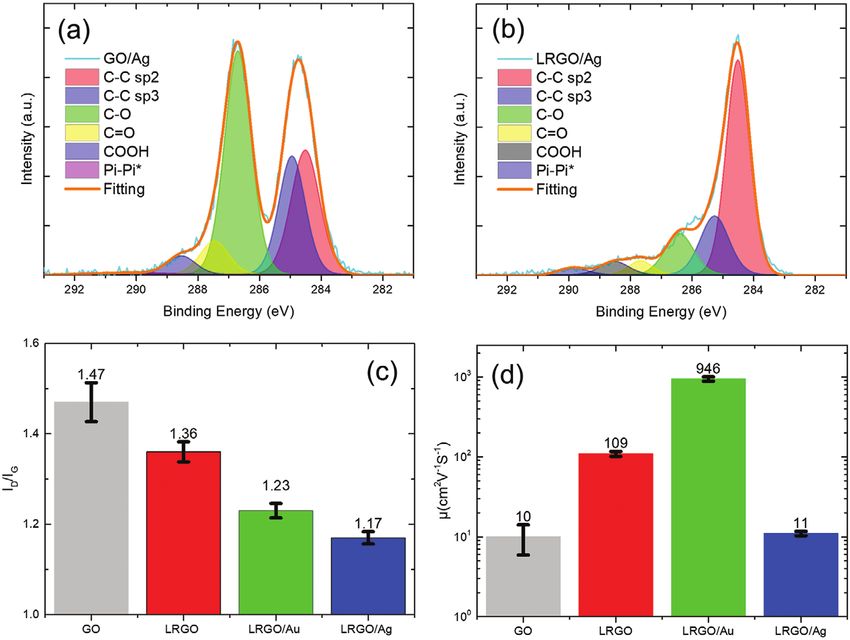
www.advancedsciencenews.com                                                                                                www.advmattechnol.de

Figure 7. The microscopic images of a) LRGO, b) LRGO/Au, and c) LRGO/Ag under different applied strains: 5% (left), 10% (middle), and 20% (right).
The scale bar is 100 µm. The schematic conductive path of LRGO/Au under the strain of 10% is shown in (b) (middle).

the conducting paths and increased the electrical resistance               regular lattice format. When the film is stretched in uniaxial
under mechanical elongation. When the applied strain is                    direction, the cracks perpendicular to the stretching direction
above 25.4%, part of the graphene material will detach from                expanded, while those in the parallel direction mostly closed off
the PDMS substrate, resulting in the failure of device. The                gradually. The denser the cracks are, the smaller the displace-
bonding improvement between the graphene material and                      ment is under the same stress. If this widening of the cracks
the PDMS, for example, by plasma treatment on PDMS, will                   occurs in a more evenly distributed manner, then the chance
likely further improve the strain sensor. Figure 7a illustrates            of break-off of the weakest link is reduced, and this is the pri-
the cracks of LRGO, which are mostly formed in the transverse              mary reason for the emergence of multiple GF ranges. The
direction with respect to the stretching force. Figure 7b,c illus-         closing-off of some of the cracks in the direction parallel to the
trates that the density of the cracks on LRGO/Au and LRGO/Ag               stretching may reduce the resistance change, but likely has a
is much higher in comparison to LRGO. In addition, the cracks              positive effect on maintaining a reasonable conductivity under
of LRGO/Au developed in both transverse and longitudinal                   large strain. Compared to the expansion of cracks of LRGO
directions, forming a lattice of cracks. An examination of the             and LRGO/Au, the cracks of the LRGO/Ag do not only expand
LRGO/Ag film shows the fractures were developed in some-                   with the increased strain but also break into isolated islands,
what random fashion. The modified cracks in the LRGO/metal                 which could completely alter the conductive path and result in
NPs systems is likely due to the localized intense thermal effect          its nonlinear behavior as strain sensor. When the strain is lower
that was induced by LSPR of metal NPs. The metal NPs ther-                 than 15.3%, the GF reaches 64, whereas the GF reaches 133 in
mally etch the adjacent GO sheets and create numerous pores,               the range of 15.3%−24.7%. This sensing performance is attrib-
which could function as the initiating points for the forma-               uted to the structure change of the conductive network within
tion of cracks.[33] The magnified microscopic images of LRGO,              the LRGO/Ag strain sensor. Under the strain below 15.3%,
LRGO/Au, and LRGO/Ag in Figure S6, Supporting Informa-                     microcracks were developed between stacked LRGO flakes,
tion, illustrates the development of cracks under strain.                  contributing to the GF = 64. Since the Ag nanoparticles were
   Figure 7b shows the schematic conductive path of LRGO/                  simply mixed with the GO flakes, which is different from the
Au with cracks under an applied strain of 10%. The emerged                 in situ fabricated Au nanoparticles, the connections between
microcracks on the film reshape the conductive path and affect             Ag nanoparticles and LRGO flakes are unconsolidated. When a
the resistance.[49] The different cracking behaviors between               large external strain of more than 15.3% was applied, a fraction
LRGO/Au and LRGO/Ag may be due to the fact that the Au                     of the contacts between Ag nanoparticles and the LRGO flakes
NPs were formed and merge into the LRGO sheets in the                      were separated, restricting the charge transport. These discon-
laser reduction process, while the Ag nanoparticles were syn-              nections result in a large increase in resistance, resulting in a
thesized a priori. The distribution of Au nanoparticles in the             high GF of 133. Though the GF appears higher, it is difficult
composite film is much more uniform than that of Ag NPs in                 to achieve evenly distributed Ag nanoparticles, which com-
LRGO sheets. Therefore, the cracks in LRGO/Au film are in a                promises the stability of LRGO/Ag strain sensor. The random

Adv. Mater. Technol. 2021, 6, 2001191                          2001191 (8 of 11)                                           © 2021 Wiley-VCH GmbH
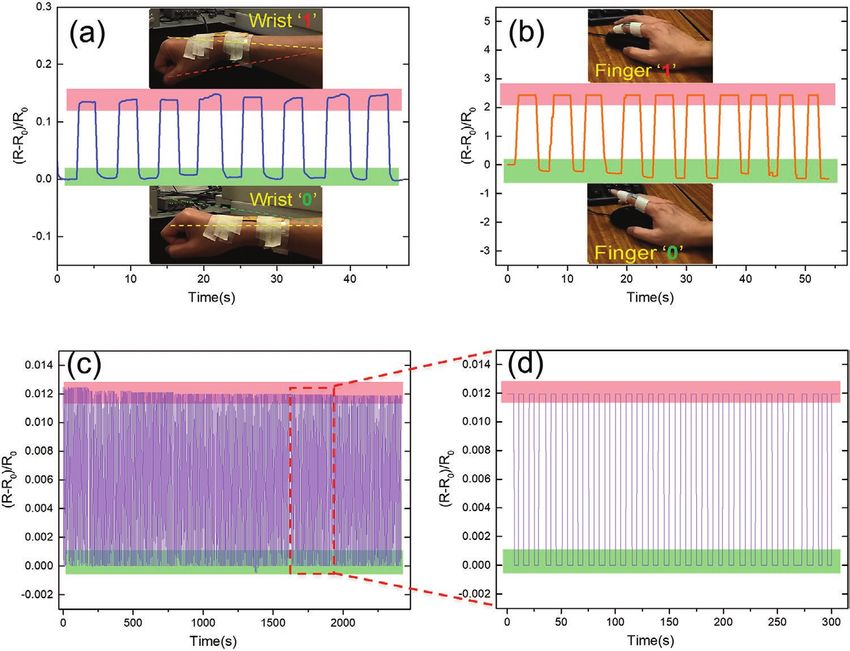
www.advancedsciencenews.com www.advmattechnol.de Figure 8. Detection of human motions. The sensor assembled on the a) wrist and b) finger. c,d) Relative resistance change at cycling test, demon- strating excellent stability. microcracks and loose contacts between the LRGO and Ag a good linearity with GF 52.5 within the strain range of 25.4%. nanoparticles may also undermine the reproducibility of It demonstrates great potential for integrated wearable devices devices. in motion monitor and health management. Due to its excellent flexibility and sensitivity, the LRGO/ Au possesses significant potential for application in wearable sensors for monitoring human activities, as demonstrated by 5. Conclusions the videos in Supporting Information. Here, we assembled a LRGO/Au sensor to monitor the wrist and finger movements We presented a facile, one-step laser treatment on the compos- with the relative resistance change, where R0 is the initial ites of HAuCl4 and GO to fabricate wearable LRGO/Au strain resistance and R is the real-time resistance. Figure 8a shows sensor, which shows a high GF of 52.5 and excellent linearity a real-time response of the sensor with the movement of in a large strain range up to 25.4%, as well as good stability the wrist. Figure 8b shows the response of the sensor while moving the finger to press a computer mouse button. Clear Table 1. Performance comparison of wearable strain sensor. relative resistance change can be observed when the wrist or finger performs different gestures. After more than 500 cycles, Material Method Performance Reference the LRGO/Au strain sensor still demonstrated excellent sta- Au nanowire Chemical synthesis GF 6.9 in the strain range of [50] bility and repeatability, Figure 8c,d. Our cyclic tests were per- 0%–5%; formed manually, therefore only 500 repetitions were made to GF 9.9 for the strain
www.advancedsciencenews.com                                                                                                        www.advmattechnol.de

within 500 tested cycles. Importantly, we found that under                      of the Raman data were carried out using the WiRE3.3 software.
low power near-infrared (NIR) laser treatment (780 nm fem-                      The XPS measurement was performed with Kratos Axis ULTRA X-ray
tosecond), the LSPR of the reduced Au nanoparticles further                     Photoelectron Spectrometer (with a monochromated Al Ka radiation).
                                                                                The peak fitting of the XPS data was carried out using the CasaXPS
enhances the reduction of GO, producing higher graphenity,                      software.
likely due to a combination of photothermal and surface                            The PDMS substrate with the LRGO device was mounted on a
plasmon-induced charge transfer. Our results demonstrated                       micrometre caliper, which induced strain by controlling the length of the
that the LSPR of both Au or Ag can unequivocally enhance                        PDMS substrate. Electrical properties were measured with a Model 6430
the reduction degree of GO with a standard laser system. The                    source meter (Keithley Instruments Inc.) and a B1505A Power Device
enhancement in the reduction of GO and in situ formation                        Analyzer (Agilent Technologies Inc.).
and insertion of these noble metal nanoparticles markedly
increased the carrier mobility by an order of magnitude
(946 cm2 V−1 s−1) in comparison to the LRGO alone                               Supporting Information
(94 cm2 V−1 s−1). Moreover, the introduction of Au or Ag nano-
                                                                                Supporting Information is available from the Wiley Online Library or
particles between graphene sheets increases the generation and                  from the author.
propagation of film microcracks. Both the augmented electrical
properties and the increased mechanical microcracks under
strain contribute to the improved performance of LRGO/Au
strain sensor. The LRGO/Au strain sensors were demonstrated                     Acknowledgements
to detect various human motions such as folding and unfolding                   Z.W. is thankful for the support of the Griffith University International
of wrist and finger, highlighting their significant potential for               Postgraduate Scholarship and a Commonwealth Scientific and
use in artificial skin and wearable electronics.                                Industrial Research Organisation Top-up Scholarship. The authors
                                                                                acknowledge the funding support of Australian Research Council (ARC)
                                                                                Industry Transformational Research Hub (IH 180100002) and ARC
                                                                                Discovery Project (DP200101105). This work was performed in part at
6. Experimental Section                                                         the Queensland node of the Australian National Fabrication Facility,
   Method: GO was prepared using the modified Hummers                           a company established under the National Collaborative Research
method.[53,54] The GO was dispersed in water with a concentration               Infrastructure Strategy to provide nano- and micro-fabrication facilities
of 2.4 g L−1. For the mixture of HAuCl4 and GO; 420 mg HAuCl4                   for Australia’s researchers. M.L. was supported by the ARC Future
was added into 10 mL of GO solution (2.4 g L−1). The solution was               Fellowship (FT180100055). The authors are also thankful for the technical
mixed with magnetic stirring for 30 min and the solution container              support from the Queensland Micro- and Nanotechnology Centre at
was covered with alumina foil, avoiding light. The mixture of HAuCl4            Griffith University, and the Centre for Microscopy and Microanalysis at
and GO is termed as GO/Au. The laser treated mixture of HAuCl4                  the University of Queensland.
and GO is termed as LRGO/Au. The GO mixed with various weights
of HAuCl4 was treated with laser and denoted as LRGO/Au X (X =
0.25, 0.5, 1, 1.5 or 3), where X signifies the times of the weight of the
HAuCl4 precursor in the GO solution to that in the aforementioned               Conflict of Interest
GO/Au solution. Silver nanoparticles were synthesized with AgNO3                The authors declare no conflict of interest.
and polyvinylpyrrolidone.[55] The size of the Ag particles was about
30 nm. The Ag colloidal dispersion with a silver concentration of
1 g L−1 was mixed with the aforementioned GO solution with
ultrasound (ratio 1:1). The mixture of Ag nanoparticles and GO is               Data Availability Statement
termed as GO/Ag. PDMS SYLGARD 184 silicone elastomer was
purchased from Dow Corning GmbH for the fabrication of substrate.               Research data are not shared.
The PDMS substrate was cleaned by isopropanol and pure water
with ultrasound. After cleaning, the PDMS was dried at 60 °C for 1 h
and then treated with air plasma for 1 min before usage.
   The GO, GO/Ag, or GO/Au dispersion was drop-casted on the                    Keywords
PDMS substrate. After being dried at 60 °C for 1 h, the GO, GO/Ag,              flexible devices, laser reduced graphene oxide, localized surface plasmon
or GO/Au films were fabricated. For the fabrication of strain sensors,          resonance, strain sensors, surface plasmon enhanced reduction
after the fabrication of GO, GO/Ag, or GO/Au film, gold electrodes with
a thickness of about 150 nm were deposited on the films with a sputter.                                                    Received: November 29, 2020
The gap between the electrodes was around 1000 µm. Then, a laser
                                                                                                                                 Revised: January 8, 2021
treatment was conducted in between the gaps under ambient conditions.
                                                                                                                         Published online: March 31, 2021
A 780 nm fs pulse laser (70 fs pulse width, 50 MHz repetition rate, and
spot size of 2 µm diameter), was employed for reduction under ambient
conditions. A silver paste (resin #186-3616 from RS Components) was used
to connect the electrodes of samples with electric wires for electrical test.
   Characterization: The SEM images were obtained using JEOL                     [1] M. Sun, in New and Future Developments in Catalysis (Ed: S. L. Suib),
JSM-7001F, equipped with the EDX system. The TEM images were                         Elsevier, Amsterdam 2013, pp. 473–487.
acquired with TECNAI F20 equipped with EDX system. The optical                   [2] H. Liao, C. L. Nehl, J. H. Hafner, Nanomedicine 2006, 1, 201.
micrographs were obtained with a microscope from ProSciTech,                     [3] J. Langer, D. Jimenez De Aberasturi, J. Aizpurua, R. A. Alvarez-
camera UCMOS05100KPA. Raman spectra were acquired with Raman                         Puebla, B. Auguié, J. J. Baumberg, G. C. Bazan, S. E. J. Bell,
Spectrometer Renishaw Invia (using 514 nm excitation wavelength                      A. Boisen, A. G. Brolo, J. Choo, D. Cialla-May, V. Deckert, L. Fabris,
and a 50× objective, acquisition parameters: 0.05 mW power, 10 s                     K. Faulds, F. J. García De Abajo, R. Goodacre, D. Graham,
exposure time, 3 accumulations, and 2400 l m−1 gridding). Peak fittings              A. J. Haes, C. L. Haynes, C. Huck, T. Itoh, M. Käll, J. Kneipp,

Adv. Mater. Technol. 2021, 6, 2001191                               2001191 (10 of 11)                                            © 2021 Wiley-VCH GmbH
www.advancedsciencenews.com www.advmattechnol.de
N. A. Kotov, H. Kuang, E. C. Le Ru, H. K. Lee, J.-F. Li, X. Y. Ling, [30] Y. Q. Wang, W. S. Liang, C. Y. Geng, Nanoscale Res. Lett. 2009, 4,
et al., ACS Nano 2020, 14, 28. 684.
[4] S. Link, M. A. El-Sayed, Int. Rev. Phys. Chem. 2000, 19, 409. [31] M. Sankar, Q. He, M. Morad, J. Pritchard, S. J. Freakley,
[5] G. V. Hartland, Chem. Rev. 2011, 111, 3858. J. K. Edwards, S. H. Taylor, D. J. Morgan, A. F. Carley, D. W. Knight,
[6] R. Huschka, J. Zuloaga, M. W. Knight, L. V. Brown, P. Nordlander, C. J. Kiely, G. J. Hutchings, ACS Nano 2012, 6, 6600.
N. J. Halas, J. Am. Chem. Soc. 2011, 133, 12247. [32] N. Zhang, H. Qiu, Y. Liu, W. Wang, Y. Li, X. Wang, J. Gao, J. Mater.
[7] D. C. Ratchford, ACS Nano 2019, 13, 13610. Chem. 2011, 21, 11080.
[8] Y. Huang, J. Liang, Y. Chen, Small 2012, 8, 1805. [33] X. Wang, M. Zhu, W. Fu, C. Huang, Q. Gu, T. H. Zeng, Y. Dai,
[9] Y. Liu, X. Dong, P. Chen, Chem. Soc. Rev. 2012, 41, 2283. Y. Sun, RSC Adv. 2016, 6, 46218.
[10] A. K. Geim, K. S. Novoselov, Nat. Mater. 2007, 6, 183. [34] X. Wang, M. Zhu, Y. Sun, W. Fu, Q. Gu, C. Zhang, Y. Zhang, Y. Dai,
[11] R. Ye, D. K. James, J. M. Tour, Adv. Mater. 2019, 31, 1803621. Y. Sun, Part. Part. Syst. Charact. 2016, 33, 140.
[12] R. Ye, J. M. Tour, ACS Nano 2019, 13, 10872. [35] T. Wu, S. Liu, Y. Luo, W. Lu, L. Wang, X. Sun, Nanoscale 2011, 3,
[13] L. Huang, Y. Liu, L.-C. Ji, Y.-Q. Xie, T. Wang, W.-Z. Shi, Carbon 2011, 2142.
49, 2431. [36] S. Link, M. A. El-Sayed, J. Phys. Chem. B 1999, 103, 8410.
[14] K. H. Ibrahim, M. Irannejad, M. Hajialamdari, A. Ramadhan, [37] Yu, S.-S. Chang, C.-L. Lee, C. R. C. Wang, J. Phys. Chem. B 1997, 101,
K. P. Musselman, J. Sanderson, M. Yavuz, Adv. Mater. Interfaces 6661.
2016, 3, 1500864. [38] H. Zhang, J.-J. Xu, H.-Y. Chen, J. Phys. Chem. C 2008, 112, 13886.
[15] Y. Zhao, Q. Han, Z. Cheng, L. Jiang, L. Qu, Nano Today 2017, 12, 14. [39] X. Chen, G. Wu, J. Chen, X. Chen, Z. Xie, X. Wang, J. Am. Chem.
[16] R. Arul, R. N. Oosterbeek, J. Robertson, G. Xu, J. Jin, M. C. Simpson, Soc. 2011, 133, 3693.
Carbon 2016, 99, 423. [40] C. Zhao, S. Qu, J. Qiu, C. Zhu, J. Mater. Res. 2011, 18, 1710.
[17] N.-Q. Deng, H. Tian, Z.-Y. Ju, H.-M. Zhao, C. Li, M. A. Mohammad, [41] S.-M. Yoon, U. J. Kim, A. Benayad, I. H. Lee, H. Son, H.-J. Shin,
L.-Q. Tao, Y. Pang, X.-F. Wang, T.-Y. Zhang, Y. Yang, T.-L. Ren, Carbon W. M. Choi, Y. H. Lee, Y. W. Jin, E.-H. Lee, S. Y. Lee, J.-Y. Choi,
2016, 109, 173. J. M. Kim, ACS Nano 2011, 5, 1353.
[18] Y. C. Guan, Y. W. Fang, G. C. Lim, H. Y. Zheng, M. H. Hong, Sci. [42] L. Guo, R.-Q. Shao, Y.-L. Zhang, H.-B. Jiang, X.-B. Li, S.-Y. Xie,
Rep. 2016, 6, 28913. B.-B. Xu, Q.-D. Chen, J.-F. Song, H.-B. Sun, J. Phys. Chem. C 2012,
[19] Z. Wan, S. Wang, B. Haylock, J. Kaur, P. Tanner, D. Thiel, R. Sang, 116, 3594.
I. S. Cole, X. Li, M. Lobino, Q. Li, Carbon 2019, 141, 83. [43] A. F. Zedan, S. Moussa, J. Terner, G. Atkinson, M. S. El-Shall, ACS
[20] Z. Wan, E. W. Streed, M. Lobino, S. Wang, R. T. Sang, I. S. Cole, Nano 2013, 7, 627.
D. V. Thiel, Q. Li, Adv. Mater. Technol. 2018, 3, 1700315. [44] D.-K. Lim, A. Barhoumi, R. G. Wylie, G. Reznor, R. S. Langer,
[21] N. Kurra, Q. Jiang, P. Nayak, H. N. Alshareef, Nano Today 2019, 24, D. S. Kohane, Nano Lett. 2013, 13, 4075.
81. [45] S. Linic, U. Aslam, C. Boerigter, M. Morabito, Nat. Mater. 2015, 14,
[22] N. N. Jason, M. D. Ho, W. Cheng, J. Mater. Chem. C 2017, 5, 5845. 567.
[23] H.-P. Phan, Y. Zhong, T.-K. Nguyen, Y. Park, T. Dinh, E. Song, [46] J. J. Mock, M. Barbic, D. R. Smith, D. A. Schultz, S. Schultz,
R. K. Vadivelu, M. K. Masud, J. Li, M. J. A. Shiddiky, D. Dao, J. Chem. Phys. 2002, 116, 6755.
Y. Yamauchi, J. A. Rogers, N.-T. Nguyen, ACS Nano 2019, 13, 11572. [47] F. Tuinstra, J. L. Koenig, J. Chem. Phys. 1970, 53, 1126.
[24] T. Nguyen, T. Dinh, A. R. M. Foisal, H.-P. Phan, T.-K. Nguyen, [48] Y. Wang, Y. Chen, S. D. Lacey, L. Xu, H. Xie, T. Li, V. A. Danner,
N.-T. Nguyen, D. V. Dao, Nat. Commun. 2019, 10, 4139. L. Hu, Mater. Today 2018, 21, 186.
[25] H. Tian, Y. Shu, Y.-L. Cui, W.-T. Mi, Y. Yang, D. Xie, T.-L. Ren, [49] X. Liao, Z. Zhang, Z. Kang, F. Gao, Q. Liao, Y. Zhang, Mater. Horiz.
Nanoscale 2014, 6, 699. 2017, 4, 502.
[26] Z. Yang, D.-Y. Wang, Y. Pang, Y.-X. Li, Q. Wang, T.-Y. Zhang, [50] S. Gong, D. T. H. Lai, B. Su, K. J. Si, Z. Ma, L. W. Yap, P. Guo,
J.-B. Wang, X. Liu, Y.-Y. Yang, J.-M. Jian, M.-Q. Jian, Y.-Y. Zhang, W. Cheng, Adv. Electron. Mater. 2015, 1, 1400063.
Y. Yang, T.-L. Ren, ACS Appl. Mater. Interfaces 2018, 10, 3948. [51] S. Gong, L. W. Yap, B. Zhu, Q. Zhai, Y. Liu, Q. Lyu, K. Wang,
[27] M. Amjadi, K.-U. Kyung, I. Park, M. Sitti, Adv. Funct. Mater. 2016, 26, M. Yang, Y. Ling, D. T. H. Lai, F. Marzbanrad, W. Cheng, Adv. Mater.
1678. 2019, 31, 1903789.
[28] R.-Z. Li, R. Peng, K. D. Kihm, S. Bai, D. Bridges, U. Tumuluri, Z. Wu, [52] S. Kabiri Ameri, R. Ho, H. Jang, L. Tao, Y. Wang, L. Wang,
T. Zhang, G. Compagnini, Z. Feng, A. Hu, Energy Environ. Sci. 2016, D. M. Schnyer, D. Akinwande, N. Lu, ACS Nano 2017, 11, 7634.
9, 1458. [53] W. S. Hummers, R. E. Offeman, J. Am. Chem. Soc. 1958, 80, 1339.
[29] C. Mattevi, G. Eda, S. Agnoli, S. Miller, K. A. Mkhoyan, O. Celik, [54] W. Wang, E. Eftekhari, G. Zhu, X. Zhang, Z. Yan, Q. Li, Chem.
D. Mastrogiovanni, G. Granozzi, E. Garfunkel, M. Chhowalla, Adv. Commun. 2014, 50, 13089.
Funct. Mater. 2009, 19, 2577. [55] K. TekaiaáElhsissen, J. Mater. Chem. 1996, 6, 573.
Adv. Mater. Technol. 2021, 6, 2001191 2001191 (11 of 11) © 2021 Wiley-VCH GmbHYou can also read