Candle flame soot sizing by planar time resolved laser induced incandescence - Nature
←
→
Page content transcription
If your browser does not render page correctly, please read the page content below
www.nature.com/scientificreports
OPEN Candle flame soot sizing by planar
time‑resolved laser‑induced
incandescence
Ignacio Verdugo1, Juan José Cruz1, Emilio Álvarez1, Pedro Reszka2,
Luís Fernando Figueira da Silva3 & Andrés Fuentes1*
Soot emissions from flaming combustion are relevant as a significant source of atmospheric pollution
and as a source of nanomaterials. Candles are interesting targets for soot characterization studies
since they burn complex fuels with a large number of carbon atoms, and yield stable and repeatable
flames. We characterized the soot particle size distributions in a candle flame using the planar
two-color time-resolved laser induced incandescence (2D-2C TiRe-LII) technique, which has been
successfully applied to different combustion applications, but never before on a candle flame. Soot
particles are heated with a planar laser sheet to temperatures above the normal flame temperatures.
The incandescent soot particles emit thermal radiation, which decays over time when the particles
cool down to the flame temperature. By analyzing the temporal decay of the incandescence signal,
soot particle size distributions within the flame are obtained. Our results are consistent with previous
works, and show that the outer edges of the flame are characterized by larger particles (≈ 60 nm),
whereas smaller particles (≈ 25 nm) are found in the central regions. We also show that our effective
temperature estimates have a maximum error of 100 K at early times, which decreases as the particles
cool.
Candles are one of the oldest combustion technologies still in use. They represented a significant technological
advancement over oil lamps, including the lack of dripping and the ability to produce a stable flame due to its
self-trimming wick. Ever since Michael Faraday’s famous l ectures1, and albeit their deceptive simplicity, candle
flames remain perhaps the most archetypal non-premixed combustion system, and have received continuous
attention from the combustion c ommunity2–7. As practical combustion systems, candles include several complex
processes in the solid, liquid and gaseous phases in a compact and safe setting. The paraffin wax is held in the
system as a solid and is only liquefied before it is fed to the flame zone, which represents an important attribute
in terms of safety, storage and transportation. Liquid fuel is fed to the flame through the wick by way of capillary
movement. As the fuel reaches the top of the wick, it evaporates and the gaseous fuel diffuses towards the
reaction zone, a thin surface located at the exterior of the flame where the combustion reactions take place,
while it undergoes thermal decomposition. In terrestrial gravity conditions, the buoyant, hot gases generated
by the energy released in the combustion reactions move upward, entraining fresh air into the reaction zone,
ensuring the sustained combustion in the system. Gravity thus gives the flame its characteristic shape, and
candles have been the subject of significant research in microgravity conditions by N ASA3,8. Perhaps the main
feature of candle flames is their luminosity, and nowadays they are still an important light source, particularly
for the approximately 800 million people still living without access to e lectricity9. Candle flame luminosity is
due to the emission of thermal radiation by incandescent carbon-based nanoparticles, commonly known as
soot. These particles are produced within the reaction zone by a complicated set of chemical r eactions10,11 and
represent an important source of particulate matter pollution. Considering a global candle market worth several
billion US dollars, it can be concluded that candles are a ubiquitous source of domestic pollution. Health effects
are now understood to be dependent on the maturity of the emitted soot particles12,13, i.e., the stage in the soot
formation process during which the particle leaves the reaction zone. The morphology and chemical structure
of the particles depend on their maturity and have an important effect on the way these particles interact with
1
Departamento de Industrias, Universidad Técnica Federico Santa María, Av. España 1680, Casilla 110‑V,
Valparaiso, Chile. 2Faculty of Engineering and Sciences, Universidad Adolfo Ibáñez, Santiago, Chile. 3Department
of Mechanical Engineering, Pontifícia Universidade Católica do Rio de Janeiro, Rua Marquês de São Vicente, 225,
Rio de Janeiro, RJ 22.451‑900, Brazil. *email: andres.fuentes@usm.cl
Scientific Reports | (2020) 10:11364 | https://doi.org/10.1038/s41598-020-68256-z 1
Vol.:(0123456789)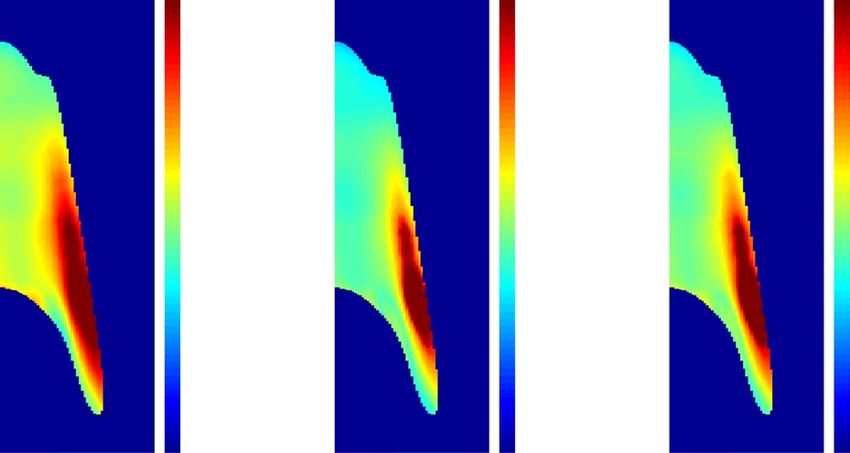
www.nature.com/scientificreports/
Fig. 1. Theoretical temperature decay of different soot primary particle diameters, ds.
the tissues in the respiratory tract. There is solid scientific evidence indicating that exposure to particulate matter
has harmful cardiopulmonary e ffects13. Detailed soot characterization becomes an important element when
assessing the health effects of combustion systems, ranging from domestic devices like candles, heaters and
cookers, to industrial equipment such as biomass boilers. Soot characterization also contributes to address the
environmental concerns of particulate matter emitted by practical combustion s ystems14, which should comply
with an ever stringent set of environmental requirements, including reduced particulate emissions. In order to
achieve this, fuel chemistry and soot formation numerical models must be validated with experimental data,
with a focus on sooting propensity and soot morphology15–17. Candle flames are laminar and generally stable,
offering the possibility of carrying out non-intrusive, laser-based diagnostics to study sooting propensity and
morphology on an axisymmetric geometry. Therefore, these flames become an interesting target for performing
soot characterization measurements, since they yield stable and repeatable flames6. A previous study shows that
the chemical composition of soot at flame tip consists of 89 atom % C and 11 atom % O (mainly ultrafine particles
of elemental carbon and ash), whereas the inner flame consists of 91 atom % C and 9 atom % O (large particles
and aggregates)18. The goal of this article is thus to present insight on soot production processes within candle
flames while introducing a state-of-the-art soot characterization technique to a multi-disciplinary audience with
an interest in the broader implications of particulate matter emissions.
Previous work has shown the capabilities of laser-based diagnostic techniques to shed new light on the
soot production processes within candle flames. Specifically, soot concentrations and temperatures have been
measured in candle flames, showing that the wick diameter controls the soot volume f raction6. Although soot
morphology from candle flames has been studied using intrusive18,19 and local non-intrusive t echniques20, no
studies have yet reported field measurements of soot morphology. This paper is thus devoted to the experimental
characterization of soot particle diameter and temperature in controlled burning candle flames. The particle
diameter measurement is effected by using time-resolved laser induced incandescence (TiRe-LII), which is a
well-established and accepted non-intrusive technique available for this p urpose21.
Laser induced incandescence (LII) is an in-situ non-intrusive diagnostic which allows studying soot
formation22, as well as soot concentration measurements23. In this technique, the incandescence of the soot
particles is attained by heating the particles up to ≈ 4, 000 K with laser irradiation. If the incandescence signal is
temporally analyzed, soot particle size distributions can be obtained. This technique, known as Time Resolved LII
(TiRe-LII), has been successfully applied in several experimental configurations24–27. Since different sized particles
will have different thermal inertia, the incandescence signal (SLII) from smaller particles decays more rapidly
than the signal from larger particles. Particle size distribution is inferred by employing laser fluences that are
lower than those used for for applying the classic LII technique, actually decreasing the soot sublimation effects,
and allowing an energy balance equation applicable to this problem to be presented and solutions to be obtained
iteratively to account for the different particle sizes. In this case, an effective soot particle aggregate temperature
is measured using time-resolved two-color optical pyrometry, which is then compared with a numerical LII
model to infer a mean soot particle size28,29. Note that the effective temperature represents the instantaneous
peak temperature attained by a soot particle ensemble after the laser heating. The effective temperature decays
with time after the laser pulse. Typically, TiRe-LII measurements have been carried out with photo-multiplier
tubes (PMTs)20,30, which provide good temporal resolution over hundreds of nanoseconds, but limits the analysis
to point measurements. To overcome this shortcoming, planar TiRe-LII measurements use intensified cameras
(ICCD) to capture the incandescence signals at different delay times after the laser pulse24,31–33.
Results
Primary soot particle temperature. As a first analysis step, the energy balance equation of a single soot
particle (Eq. 1) in the Methods section below) is solved for spherical particle diameters in the range of values
between 1 and 105 nm. The assumed initial particle temperature (2,000 K) employed in the iterative processes, is
a typical diffusion flame temperature, and the applied fluence during 8 ns is 0.148 J/cm2. The resulting theoretical
temperature histories may be observed in Fig. 1, where the very short initial heating period that occurs during the
laser pulse heats the soot particles to temperatures greater than 3,000 K. This figure shows that the temperature
decay time of the smallest soot particles is on the order of a few nanoseconds, whereas the largest particles show
Scientific Reports | (2020) 10:11364 | https://doi.org/10.1038/s41598-020-68256-z 2
Vol:.(1234567890)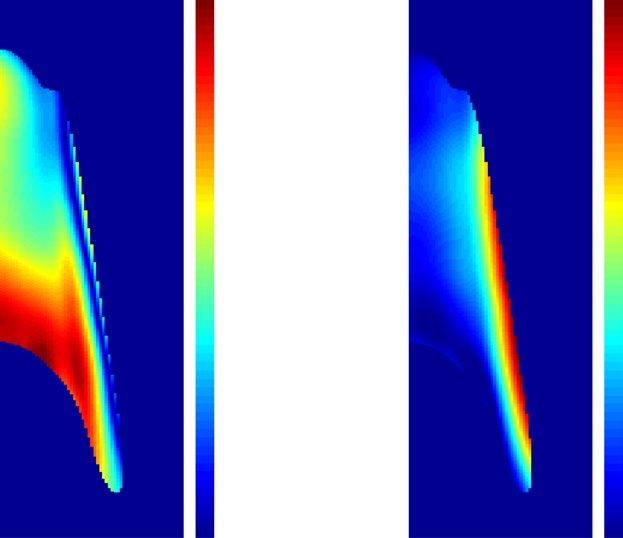
www.nature.com/scientificreports/
Fig. 2. Temporal decay of incandescence signals, measured at 20, 40, 300 and 670 ns after the laser pulse, for
the two used detection wavelengths. (a) Fields of SLII (a.u.) at 450 nm and (b) Fields of SLII (a.u.) at 650 nm.
temperatures exceeding 2,500 K even after 2 µs. It is then clear that the temporal temperature decay rate may be
used for the purposes of discriminating between primary soot particles with diameters spanning several orders
of magnitude, as previously underscored by several works27,28,32,34. Note that, in the framework of the TiRe-LII
technique, the calculated temperature is used to determine the theoretical effective temperature, Te (dpg , σg ),
through Eq. (10), where dpg and σg are the geometric mean particle diameter and the geometric standard
deviation of an assumed lognormal particle size distribution35.
Temporal signal decay. The temporal decay behavior of the raw LII signals is the fundamental quantity
used in the TiRe-LII technique. Figure 2 presents this decay along the flame for the studied candle. Note that
since axial symmetry is assumed, only one half of the candle flame directly exposed to the laser signal is presented
here, and that the origin of the vertical coordinate, HAB (Height Above the Base), lies at the candle wax pool
surface.
Each of the LII intensity fields given in this figure is the outcome of averaging 200 instantaneous images, each
of which corresponds to the the ICCD camera gated at 20 ns. During the experiments the camera opening delay
with respect to the laser pulse was varied from 20 ns to 1,000 ns. In Fig. 2 representative images of the decay
process are depicted, taken at the delays of 20, 40, 300 and 670 ns. These delay values have been chosen so as to
represent the prompt, short time, intermediate time and long term LII signal behaviour. Figure 2a, b also give
the temporal decay at the two detection wavelengths used in this study, i.e., = 450 and 650 nm, respectively.
These detection wavelengths have been chosen to avoid fluorescence from gas-phase flame species (PAH and
others)36,37, to account for the camera spectral sensitivity – thus yielding comparable LII signal intensities—and to
provide an adequate spectral separation. Indeed, the emission intensity of the particles is higher for 2 = 650 nm
than for 1 = 450 nm38, compensating for the signal ratio loss due to the spectral quantum efficiency variation
of the ICCD camera.
The LII signal is larger for the longer wavelength, with local signal maxima at each HAB, possibly highlighting
the position of the higher soot volume fraction (fv ). The LII intensities are highest at 20 ns, with a peak region
located around HAB ≈ 20 mm. Therefore, this particular high intensity region is used here for analysis purposes,
since it may be assumed that a fixed proportionality factor between the SLII intensity and fv17,21 exists. Figure 3
presents the decay history of the LII signal for the two measurement wavelengths, i.e., SLII,450 and SLII,650 , at
two different locations along the flame, as well as the corresponding effective soot temperature. These regions
correspond to the position along the flame centerline where the maximum LII signal is observed and to the
location of maximum soot volume fraction (fv,max ). In both regions, SLII,450 < SLII,650 (cf. Fig. 3a). Furthermore,
at each wavelength, as expected, the signal at the maximum soot volume fraction region is larger than that at the
chosen centerline position. Figure 3b also depicts an exponential fit of the experimental effective temperature
Te,exp , which is needed for comparison purposes with that numerically calculated Te (dpg , σg ), and to obtain
the lognormal diameter distribution parameters. The experimental effective temperature [cf. Eq. (11) below] is
found to decay monotonically from 3,200 to 2,600 K, as may be verified in Fig. 3b. These temperature values,
lower than the carbon sublimation point, are consistent with the desired application of the TiRe-LII technique.
Soot temperature and diameter. In order to further characterize the LII signal at early times, Fig. 4 gives
the fields of the signal ratio at the two detection wavelengths (SLII, 1 /SLII, 2), the maximum effective temperature
computed at 20 ns and the fitted temperature decay rate between 20 and 100 ns. The signal ratio varies between
0.3 and 0.5, with the smaller values obtained at lower portion of the flame, closer to the wick, and the larger being
characteristic of the outer, oxidizing, region. The effective temperature at this early time is as high as 3,200 K
at the outermost regions of the flame, and descends to ≈3,000 K towards the flame axis. This rather uniform
effective temperature distribution indicates that, regardless of their diameter or concentration, the soot particles
are being heated to similar temperatures by the laser pulse. The corresponding temperature decay rate exhibits
a higher absolute value at the innermost, central flame regions, and smaller at the outer regions. Furthermore,
Scientific Reports | (2020) 10:11364 | https://doi.org/10.1038/s41598-020-68256-z 3
Vol.:(0123456789)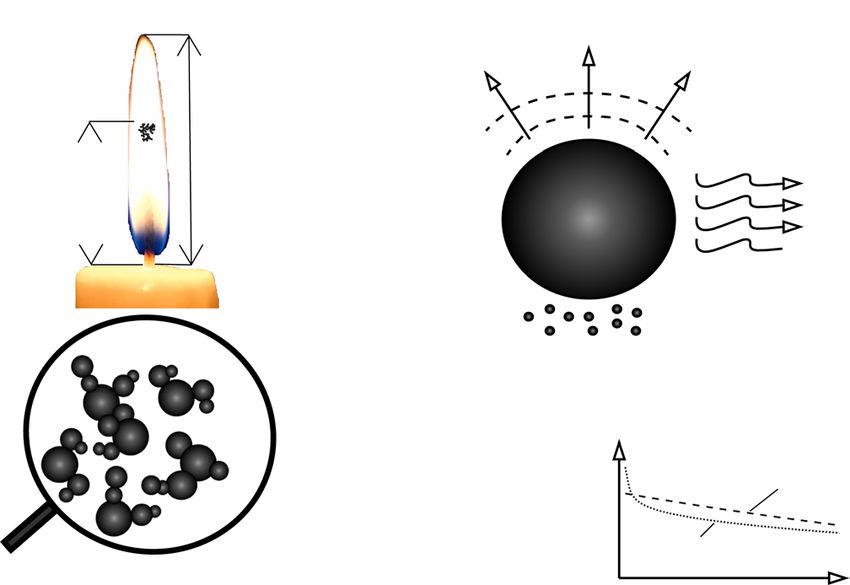
www.nature.com/scientificreports/
Fig. 3. Decay of the LII signals and of the effective temperature at two different regions of the candle flame: (1)
Centerline—r = 0 mm and HAB = 28 mm and (2) fv,max − r = 2 mm and HAB = 22.5 mm: (a) SLII at 450 nm
and 650 nm and (b) Experimental effective soot temperature (Te,exp).
Fig. 4. Fields of (a) Incandescence signal ratio (SLII,450 /SLII,650) at 20 ns, (b) maximum effective temperature
(Te,max ) and (c) fitted temperature decay rate dTe /dt, Eq. (12) between 20 and 100 ns.
the effective temperature peak (Te,max ) and the corresponding distribution, obtained by the two-color technique,
are quite similar to previously reported values obtained for comparable laser fluences (3,180 K at a fluence of
0.17 J/cm2)33.
The effective temperature decay rate distribution indicates that the larger soot particles should be located
in the vicinity of the oxidizing region, and that a rather uniform diameter distribution should arise along the
flame centerline. This may indeed be verified in Fig. 5a, b, where the obtained soot particle diameters are given.
The Sauter mean diameter (d32), is a classical particle size average, defined as the ratio of the third to second
moments of the particle diameters d istribution39, and represents the diameter of a particle whose surface-to-
volume ratio is equal to the entire soot particles ensemble at the region of i nterest40. Accordingly, the geometric
and Sauter mean diameter values reach 50 and 60 nm at the outermost regions of the sooting region, respectively,
whereas smaller corresponding values—35 and 25 nm—arise near r = 0. In order to gain further insight on the
soot particle diameter distribution within the candle flame, Fig. 5c shows the computed values of the primary
particle diameter, ds, obtained by Eq. (8). Attention is drawn first to Fig. 5d, where the probability distributions of
primary particle diameter are plotted at two positions within the flame. The first of these positions is characteristic
of the flame centerline behavior, and the second of the maximum soot volume fraction location. This figure
indicates that a narrower primary particle diameter distribution is observed at the centerline position, i.e.,
20 < ds < 35 nm, whereas a wider one (20 < ds < 90 nm) characterizes the maximum soot volume fraction
region. The corresponding field of primary particle diameter ds may be seen in Fig. 5c. These diameters are found
to range from 20 nm, near r = 0, to 50 nm, at the vicinity of the soot oxidation region, where the soot volume
fraction is maximum. As expected, the overall diameter spatial distribution is similar, regardless of which – d32, ds
or dpg—is considered (cf. Fig. 5). The primary particles diameter, ds , obtained here are comparable with previous
results obtained by TEM images (20–50 nm)18 and point TiRe-LII measures (≈ 55 nm)20.
Scientific Reports | (2020) 10:11364 | https://doi.org/10.1038/s41598-020-68256-z 4
Vol:.(1234567890)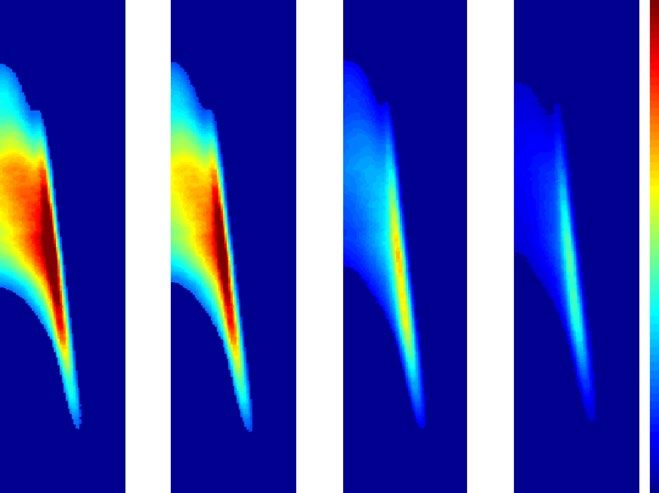
www.nature.com/scientificreports/
Fig. 5. Fields of: (a) Sauter mean diameter (d32), (b) Geometric mean diameter (dpg ), (c) mean primary soot
particle diameter (ds) and (d) primary particle diameter distribution, c.f. Eq. (8). The Lognormal particle size
distributions show different (dpg , σg ) at two points of the flame: (1) centerline—r = 0 mm and HAB = 28 mm
and (2) maximum soot volume fraction, fv,max − r = 2 mm and HAB = 22.5 mm.
Fig. 6. Vertical evolution of the geometric mean diameter (dpg ) along the maximum soot volume fraction (the
incandescence field at 20 ns), and the normalized integrated soot volume fraction (β), compared with previously
obtained results6.
Discussion
In this work, the planar two-color time-resolved laser induced incandescence (2D-2C TiRe-LII) technique was
used to characterize a candle flame operating below the smoke point. To the best of the authors’ knowledge,
at present there are no works that report soot particle sizes for a candle flame using this technique for two
dimensions. Nevertheless, TiRe-LII has been applied to Candle point m easurements20, n-heptane34, ethylene31–33,41
and ethane24 flames, yielding similar results both for the SLII and particle diameter distributions. The effective soot
temperatures decay from 3,200 to 2,600 K, which is consistent with TiRE-LII applications at the laser fluences
used in this study. The larger soot particles, with d32 ≈ 60 nm, tend to be located at the outer edges of the sooting
region, whereas the flame centerline is characterized by the presence of smaller particles (d32 ≈ 25 nm).
Figure 6 depicts the vertical evolution of a set of properties characterizing the sooting flame. Following the
line of maximum soot volume fraction, this figure presents the geometric mean diameter, which exhibits a non
monotonic behavior. Soot particles are first detected with dpg ≈ 32 nm , at HAB ≈ 9 mm , and the diameter is
found to increase up to 64 nm at HAB ≈ 17 mm . A diameter decrease is then observed until HAB ≈ 35 mm ,
where the detection limit is again reached. Following previous works6, this figure also shows the radially integrated
∞
soot volume fraction evolution with HAB, normalized with respect to the peak value β = 2π 0 fv (r) rdr. . Note
that from the relationship between fv and SLII, the normalized β values are related to the incandescence signal,
which is taken at the prompt detection time, where the signal reaches its maximum value. For this purpose,
either 1 or 2 may be used, since fv is a physical property of the flame. The results of the evolution with height
of the integrated soot volume fraction are compared in Fig. 6 with previously measured values using Modulated
Absorption Emission (MAE) for the same candle flame6. The previous measurements detected soot in significant
amounts ( β = 0.3) at HAB ≈ 7 mm , whereas in this work these amounts are observed further downstream
(HAB ≈ 11 mm). This discrepancy is related to the different methods used to determine β , since in the present
work SLII nearly vanishes below HAB ≈ 11 mm , whereas the MAE signal is strong in the lower parts of the
flame6. The maximum value of β is found to occur nearly at the same position (HAB ≈ 20 mm ) for the two
measurements, and the progressive integral soot volume fraction decrease rate with HAB is nearly identical. A
Scientific Reports | (2020) 10:11364 | https://doi.org/10.1038/s41598-020-68256-z 5
Vol.:(0123456789)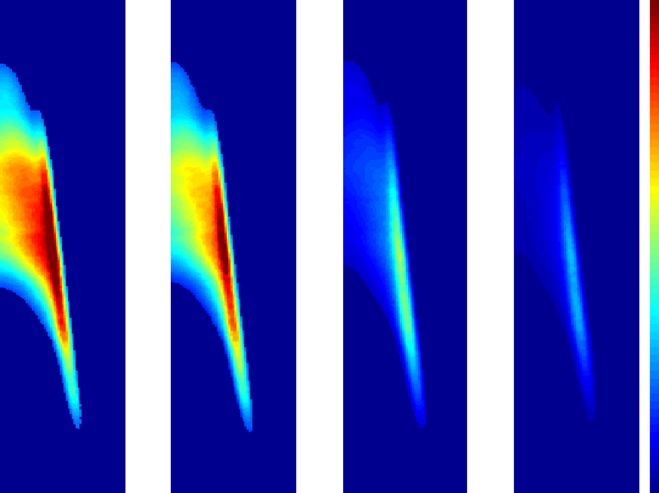
www.nature.com/scientificreports/
Fig. 7. Error analysis results: (a) Effective temperature difference ǫ (Eq. 14) at 20 ns, (b) Effective temperature
differences ǫ (Eq. 14) at 600 ns and (c) Likelihood estimator (χ 2, Eq. (15)) at position r = 2 mm and HAB
22.5 mm.
final characterization of the TiRE-LII application to the studied candle flame is the temperature and diameter
error analysis. To that end, Fig. 7 presents both the effective temperature difference (ǫ), given by Eq. (14), and
the normalized likelihood estimator (χ 2), as defined by Eq. (15). The first figure-of-merit, ǫ, is examined at two
different times, 20 ns and 600 ns in Fig. 7a, b, respectively. These figures show that both the magnitude and the
distribution of this error change with time. Indeed, at earlier times the maximum error, which is on the order of
100 K, is found to occur at the innermost parts of the measurement region, whereas at later times the maximum is
displaced towards the outer edges of this region. Furthermore, at 600 ns, ǫ is smaller than 50 K at the central part
of the flame but, at 20 ns it remains larger than 60 K at the upper parts of the flame centerline. These differences
between the experimental and theoretical effective temperatures are mainly associated to the SLII measurements.
By comparing the signal ratio SLII, 1 /SLII, 2, given in Fig. 4a, and ǫ at 20 ns (see Fig. 7a), it is possible to verify
that the largest temperature difference occurs at the area of the smallest signal ratio value, and vice-versa. This
underscores the close relationship that exists between the signals ratio and the effective temperature difference.
Furthermore, considering the values of ǫ at 600 ns (see Fig. 7b), it can be deduced from Fig. 3a that the SLII ratio
decreases with time, so that the difference between the effective temperature is smaller at the selected points. As a
consequence, at later times the temperature difference ǫ is larger at the outer flame zones, where the temperature
decays faster, than at the inner regions. The χ 2 likelihood estimator field depicted in Fig. 7c is evaluated at a
radial location of 2 mm from the flame axis and a height of 22.5 mm as a function of the diameter distribution
parameters, dpg and σg . This position has been chosen because it corresponds to the maximum soot volume
fraction region. This figure shows the minimum value of χ 2 that characterizes the distribution shown in Fig. 5d.
The χ 2 determination has been performed for each pair of parameters, for time intervals ranging from 20 ns to
1 µm. The estimate range for dpg spans from 0 to 50 nm with a 0.05 nm step, and the corresponding one for σg is
from 1 to 2 with a 0.01 step. Figure 7c indicates that a χ 2 mathematical minimum exists for the chosen parameter
variation of the lognormal distribution. In particular, the region of dpg from 30 to 50 nm and σg from 1.1 to 1.3 is
where an absolute minimum seems to lie, i.e., where the difference between the values of effective temperatures
is the smallest. The parameters of the lognormal distribution at this region (seeFig. 5d) are those that minimize
the χ 2-value. However, since a minimum value may not be sharply distinguished, the values obtained above (dpg
and σg given in Fig. 5d) are assumed to be representative of those that minimize χ 2-value.
Methods
Theoretical background: the TiRe‑LII model. The laser-induced incandescence technique (LII) is
widely used to study the formation of soot particles within fl ames42. This technique is implemented by applying
a nanosecond laser pulse that increases the soot particles temperature to levels where detectable incandescence
signals arise (SLII)43,44. After the laser irradiation, the SLII decays as the soot particle temperature returns to the
surrounding flame condition. Since smaller soot particles cool down faster than larger o nes22,45, due to the larger
surface area to volume ratio and smaller thermal inertia, the soot particle size distribution may be determined
from the temporal decay study of SLII. This may be performed by comparing the measured soot temperature
decay with the computed temperature results obtained by assuming a soot primary particle size probability
distribution21,44. Please refer to Fig. 8 for a visual summary of the technique. The temperature time-history,
T(t), of a single soot primary particle, with diameter ds, density ρs (1,900 kg/m3 ) and specific heat cs with a
temperature dependence according to Liu’s model29, may be modeled by the energy balance equation28,29:
1 3 dT
πd ρs cs = Ca F0 q(t) − q̇r − q̇c − q̇s , (1)
6 s dt
Scientific Reports | (2020) 10:11364 | https://doi.org/10.1038/s41598-020-68256-z 6
Vol:.(1234567890)www.nature.com/scientificreports/
Fig. 8. Schematics of the TiRe-LII methodology: (a) Heating process and relevant properties: HAB is the height
above the base, i.e., measured from the wax pool surface; soot particle and aggregates characteristic dimensions;
laser energy temporal evolution; experimental and theoretical effective temperature decays; and (b) Flowchart
for geometric mean soot particle diameter; Step 1: theoretical temperature decay; Step 2: experimental effective
temperature decay and Sauter mean diameter; Step 3: error minimization, lognormal distribution properties.
which states that the internal energy rate of change is equal to the sum of laser energy absorption, Ca F0 q(t), and
the energy loss by thermal radiation, q̇r , conduction, q̇c , and sublimation, q̇s . In the laser irradiation term, Ca
is the absorption cross section, F0 is the laser fluence and q(t) is the power density history of the laser pulse46.
Note that other physical and chemical processes, such as photodesorption, annealing, and soot oxidation, may
arise during particle cooling, but can be considered negligible when low or moderate laser fluences are u sed21,47,
which is the case of the present work. The different processes influencing the soot particles temperature decay
rates given by Eq. (1) should be adequately modeled in order to allow particle diameters to be determined from
the measured temperature history. In the Rayleigh limit, the absorption cross section is given by:
π 2 d3s E(m)
Ca = , (2)
where E(m) is the soot absorption function48,49, and represents the laser irradiation wavelength. The energy
lost by thermal radiation is given by47:
k5 t4
∞
q̇r = 8π 3 d3s E(m) 4 T5 Np t
dt, (3)
h c 3 e −1
0
where h, k and c are the Planck and the Boltzmann constants and the speed of light, respectively. Np is the
aggregate size46,50 and the integration yields a constant value of 24.88651. Under ambient pressure conditions,
the energy lost by thermal radiation can be considered negligible22,51. Using the hypothesis of free-molecular
regime for the soot particle cooling by c onduction50 and the Fuchs a pproach52, the conduction cooling rate of
soot particles may estimated as:
2
ds pg 8kTg γ ∗ + 1
T
q̇c = απ −1 , (4)
2 2 πmg γ ∗ − 1 Tg
where α, pg and Tg are, respectively, the soot thermal accommodation coefficient assumed as 0.3746, the ambient
gas pressure and the t emperature6. The mass of the surrounding gas molecule is mg and γ ∗ represents the average
value of the surrounding gas specific heats r atio50. The energy lost due to particle sublimation may be modeled
as22,29:
Hv dM
q̇s = − , (5)
Mv dt
where Mv is the soot molecular weight and Hv represents the enthalpy of formation of carbon clusters. The
particle mass loss rate by sublimation, dM/dt , may be written as22,29:
πds Wv αM pv Rm T 1/2
dM
=− , (6)
dt Rp T 2πWv
Scientific Reports | (2020) 10:11364 | https://doi.org/10.1038/s41598-020-68256-z 7
Vol.:(0123456789)www.nature.com/scientificreports/
where αM is the mass accommodation coefficient, pv is the average partial pressure, Rp and Rm are the universal
gas constant expressed in different units and Wv is the average mass of the sublimed c lusters29. Following53,54, the
soot primary particles diameter probability distribution within the probe volume can be assumed as exhibiting
a lognormal size distribution. i.e.,
� �2
1 ln (ds /dpg )
p(ds ) = √ exp− √ , (7)
ds 2πln σg 2ln σg
where dpg and σg , represent the geometric mean particle diameter and the geometric standard deviation,
respectively. The primary particle diameter, ds , has been obtained from the first moment of the lognormal
distribution for given dpg and σg values, following
[ln(σg )]2
1
E[ds ] = exp ln(dpg ) + . (8)
2
If the laser probe volume is small enough to allow for the assumption of an optically thin path, and the soot
particles are uniformly distributed, the modeled total thermal emission intensity of this particle distribution at
wavelength i may be expressed as28:
−1 2 3
2πc2 h
∞
hc π ds E(mi )
TEIi ∝ p(ds ) 5 exp −1 d(ds ), (9)
0 i i kT(d s ) i
where T(ds ) is the solution of Eq. (1). Then, the theoretical effective temperature time-history may be obtained
from the ratio of total thermal emission at two different wavelengths ( 1 > 2), by using the two-color pyrometry
equation38:
∞
p(ds )d3s exp[−C2 / 2 T(ds )]d(ds )
hc 1 1
Te (dpg , σg ) = C2 − ln
0∞ 3
, (10)
k 2 1 0 p(ds )ds exp[−C2 / 1 T(ds )]d(ds )
where C2 = hc/k is the second Planck constant and the Wien approximation, exp(hc/k T)≫ 1, has been
employed. On the other hand, after the laser pulse, the effective temperature time history of the soot particle
distribution can be determined from the measured TiRe-LII signal as:
−1
SLII, 1 E(m2 ) 61
hc 1 1
Te,exp = − ln , (11)
k 2 1 SLII, 2 E(m1 ) 62
where the two-color pyrometry relation has also been used. Furthermore, the Sauter mean diameter (d32) may
be related to the initial temperature decay rate as f ollows28:
dTe �(Tmax − T0 )
=− , (12)
dt t = τmax d32
which is evaluated at time ( t = τmax ) where the effective temperature peak (Tmax ) is observed, which typically
occurs 20 ns after the laser pulse28,32,33. Also, T0 represents the initial soot temperature, which may be determined
by using a two color pyrometry technique, in the absence of laser irradiation. The parameter represents a
cluster of all the surrounding gas and soot particles thermal p roperties28. Under the assumption of a lognormal
soot particle diameter probability distribution, the Sauter mean diameter (d32) is related to the two distribution
parameters (dpg , σg ) by:
d32 = dpg exp 2.5(ln σg )2 . (13)
These soot particle distribution parameters (dpg , σg ) are estimated by minimizing the difference between the
computed and measured values of the soot effective temperature, Te , according to the iterative process shown
in the Fig. 8b. Indeed, the Sauter mean diameter (d32) obtained from the experimental effective temperature
(step 2), Eq. (12), is used as an input parameter to compute a modeled effective soot temperature, Eq. (10), and
its corresponding lognormal distribution parameters (step 3), dpg and σg , which are related via Eq. (13). For
this purpose, Eq. (1) is numerically solved within a range of spherical soot primary particle diameters (1 to
105 nm)28 (step 1). The difference between the numerical and experimental effective temperature decay is then
iteratively reduced until reaching a minimum error. The quality of the parameters estimation results is evaluated
by considering the absolute error (ǫ), which compares the predicted and measured effective temperature values
at each the flame location:
ǫ = Te,exp − Te (dpg , σg ) . (14)
In addition, the Chi-Squared test (χ 2) also is used as a suitable test for the purpose of evaluating the effective
temperatures agreement53:
Scientific Reports | (2020) 10:11364 | https://doi.org/10.1038/s41598-020-68256-z 8
Vol:.(1234567890)www.nature.com/scientificreports/
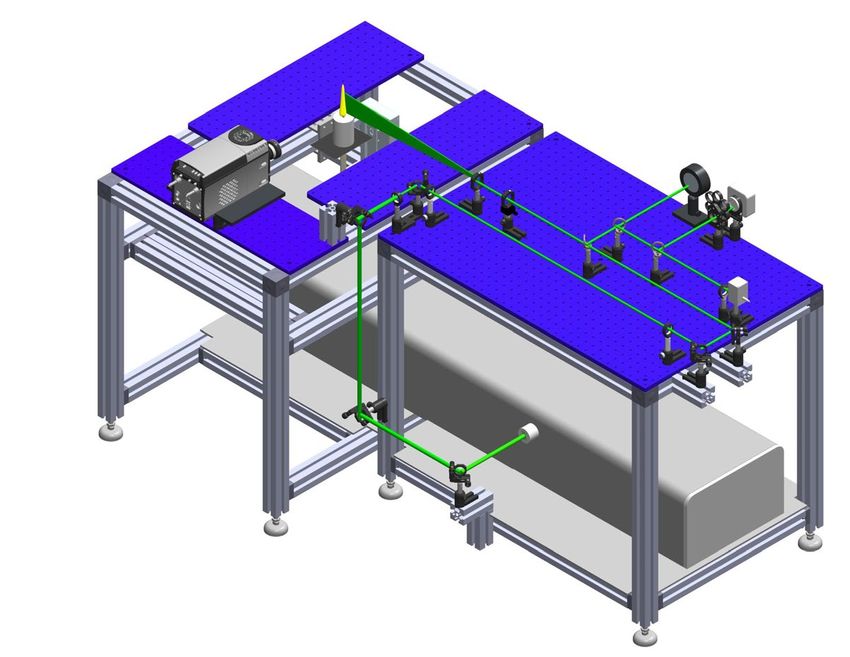
Fig. 9. (a) Schematic of the experimental set-up for the TiRe-LII diagnostic and the main devices: (1) Candle;
(2) ICCD camera; (3) Nd:YAG laser; (4) Fast photodiode; (5) Beam profiler, (6) Laser energy sensor and (7)
Linear stage. Beam characterization: (b) Laser power temporal profile at a fluence of 0.148 J/cm2. (c) Laser sheet
thickness and (d) mean normalized signal for different fluences at HAB ≈ 22 m. The visible height of the flame
is Lf = 38 mm.
N
2
Te,exp,i − Te,i (dpg , σg )
χ2 = . (15)
σg2
i=1
where N represents the number of experimental TiRe-LII measurements used to determine the effective
temperature history.
Experimental apparatus. The experimental setup used for the TiRe-LII measurements is shown in
Fig. 9a. In the adopted configuration, the second harmonic (532 nm) of a Nd:YAG Litron Aurora II laser (3),
with a 9 mm beam diameter and 10 Hz repetition rate, has been used to excite the incandescence (SLII) of the
soot particles formed in the candle flame (1). The candles are composed of Sasolwax 6203 paraffin, and have
been manufactured in house according to procedures detailed elesewhere6. These candles are characterized by
wick diameter and length values of Dwick = 3 mm and Lwick = 7 mm, respectively. These wick dimensions have
been chosen since they correspond to the stablest experiments previously performed6, and lead to flames that
operate below the smoke point. The height of the candle flame measured from the wax pool (Lf ) is consistent
with previous measurements4,6, which have been performed for Dwick = 3 mm and Lwick = 7 mm.
As evidenced by Eq. (1), the accurate characterization of the laser pulse is paramount for the TiRe-LII
technique. Accordingly, Fig. 9b shows the temporal profile of a typical laser pulse (8 ns span), which has been
measured with a fast photodiode ET-2030 (4) coupled to a 1 GHz oscilloscope (LeCroy Wavesurfer 3104Z). An
iris is employed to select a 6 mm diameter central portion of the laser beam that is expanded, with the help of a
spherical convex lens ( f = 750 mm) and a concave cylindrical lens ( f = −50 mm) to form a thin laser sheet,
which crosses the flame centerline. As observed in Fig. 9c, the sheet thickness is 120 µm, whereas its height is
65 mm. Note that the sheet thickness is roughly 1/10th of the maximum flame diameter, 2 mm. To correct both
for the laser intensity non-homogeneity and for the shot-to-shot laser fluctuations, the corresponding spatial and
temporal energy distributions are respectively mapped with a beam profiler (Coherent LaserCam-HR II) (5) and
by an energy sensor (Coherent J-50MB-YAG) (6), which is coupled to a Coherent Labmax TOP energy meter.
The laser incandescence signal emitted by the soot particles is captured with an intensified CCD camera
(Andor Istar DH334T) with a 1024 × 1024 px 2 matrix (2), that is coupled with a Nikon AF Nikkor 50 mm lens
(f/1.4). The LII signal first passes through narrow band filters (40 nm FWHM) centered either at 450 nm or at
650 nm, which have been selected in order to improve the signal to noise ratio. All the measurement devices are
synchronized with an external (Quantum sapphire 9200) pulse generator (not show here). A motorized linear
stage (7) has been used to progressively raise the candle as the wax is consumed, thus ensuring that the flame lies
at the same measurement region during all tests. Since the TiRe-LII technique requires for the laser illuminated
soot particles to be heated below the carbon sublimation temperature, care must be taken when selecting the
Scientific Reports | (2020) 10:11364 | https://doi.org/10.1038/s41598-020-68256-z 9
Vol.:(0123456789)www.nature.com/scientificreports/
laser fluence. Accordingly, the normalized fluence curve of the candle flame, shown in Fig. 9d, indicates that
the plateau region should be achieved beyond 0.16 J/cm2. Then, in order to reduce the soot sublimation effect,
a laser sheet fluence of 0.148 J/cm2 has been used in this work to obtain the SLII. In order to improve the signal-
to-noise-ratio, 2 × 2 pixel binning has been used, thus resulting in an image resolution of 12.6 px/mm. For
each measurement delay after the laser pulse, 200 images have been captured at each wavelength. The effective
soot temperature uncertainty may be estimated following previous works55, and is attributed to the wavelength
separation38, the standard deviation of incandescence images due to inherent noise of the ICCD cameras, and
the value of absorption function, which is currently matter for debate21,49. It should also be stressed that, to the
best of the authors knowledge, the value of E(m) in candle flames has not been previously reported. Therefore,
a classical correlation48 is assumed to hold in this study.
Received: 13 February 2020; Accepted: 18 June 2020
References
1. Faraday, M. The chemical history of a candle: A course of lectures (Book Jungle, 2010).
2. Carleton, F. B. & Weinberg, F. J. Electric field-induced flame convection in the absence of gravity. Nature 330, 635–638. https://
doi.org/10.1038/330635a0 (1987).
3. Ross, H. D., Sotos, R. G. & T’ien, J. S. Observations of candle flames under various atmospheres in microgravity. Combust. Sci.
Technol. 75, 155–160. https://doi.org/10.1080/00102209108924084 (1991).
4. Sunderland, P., Quintiere, J., Tabaka, G., Lian, D. & Chiu, C.-W. Analysis and measurement of candle flame shapes. Proc. Combust.
Inst. 33, 2489–2496. https://doi.org/10.1016/j.proci.2010.06.095 (2011).
5. Okamoto, K., Kijima, A., Umeno, Y. & Shima, H. Synchronization in flickering of three-coupled candle flames. Sci. Rep. 6, 36145.
https://doi.org/10.1038/srep36145 (2016).
6. Thomsen, M. et al. Soot measurements in candle flames. Exp. Therm. Fluid Sci. 82, 116–123. https://doi.org/10.1016/j.expthermfl
usci.2016.10.033 (2017).
7. Chen, T., Guo, X., Jia, J. & Xiao, J. Frequency and phase characteristics of candle flame oscillation. Sci. Rep. 9, 342. https://doi.
org/10.1038/s41598-018-36754-w (2019).
8. Dietrich, D. L., Ross, H. D., Shu, Y., Chang, P. & T’ien, J. S. Candle flames in non-buoyant atmospheres. Combust. Sci. Technol.
156, 1–24, https://doi.org/10.1080/00102200008947294 (2000).
9. IEA. SDG7: Data and Projections. Technical Report, International Energy Agency, Paris, France (2019).
10. Thomson, M. & Mitra, T. A radical approach to soot formation. Science 361, 978–979. https://doi.org/10.1126/science.aau5941
(2018).
11. Wang, Y. & Chung, S. H. Soot formation in laminar counterflow flames. Progress Energy Combust. Sci. 74, 152–238. https://doi.
org/10.1016/j.pecs.2019.05.003 (2019).
12. Pagels, J. et al. Chemical composition and mass emission factors of candle smoke particles. J. Aerosol Sci. 40, 193–208. https://doi.
org/10.1016/j.jaerosci.2008.10.005 (2009).
13. Pope, C. A. III & Dockery, D. W. Health effects of fine particulate air pollution: Lines that connect. J. Air Waste Manag. Assoc. 56,
709–742, https://doi.org/10.1080/10473289.2006.10464485 (2006).
14. Al-Hasan, M. Effect of ethanol-unleaded gasoline blends on engine performance and exhaust emission. Energy Convers. Manag.
44, 1547–1561. https://doi.org/10.1016/S0196-8904(02)00166-8 (2003).
15. Pitz, W. J. et al. Development of an experimental database and chemical kinetic models for surrogate gasoline fuels. In SAE Technical
Paper, 24. https://doi.org/10.4271/2007-01-0175 (SAE International, 2007).
16. Pepiot-Desjardins, P., Pitsch, H., Malhotra, R., Kirby, S. & Boehman, A. Structural group analysis for soot reduction tendency of
oxygenated fuels. Combust. Flame 154, 191–205. https://doi.org/10.1016/j.combustflame.2008.03.017 (2008).
17. Kashif, M., Guibert, P., Bonnety, J. & Legros, G. Sooting tendencies of primary reference fuels in atmospheric laminar diffusion
flames burning into vitiated air. Combust. Flame 161, 1575–1586. https://doi.org/10.1016/j.combustflame.2013.12.009 (2014).
18. Liang, C.-J. et al. Relationship between wettabilities and chemical compositions of candle soots. Fuel 128, 422–427. https://doi.
org/10.1016/j.fuel.2014.03.039 (2014).
19. Zhang, Z., Hao, J., Yang, W., Lu, B. & Tang, J. Modifying candle soot with fep nanoparticles into high-performance and cost-effective
catalysts for the electrocatalytic hydrogen evolution reaction. Nanoscale 7, 4400–4405. https: //doi.org/10.1039/C4NR07 436J (2015).
20. Arabanian, A. S., Manteghi, A., Fereidouni, F. & Massudi, R. Size distribution measurement of candle’s soot nanoparticles by using
time resolved laser induced incandescence. Int. J. Opt. Photon. 2 (2008).
21. Michelsen, H., Schulz, C., Smallwood, G. & Will, S. Laser-induced incandescence: Particulate diagnostics for combustion,
atmospheric, and industrial applications. Prog. Energy Combust. Sci. 51, 2–48. https://doi.org/10.1016/j.pecs.2015.07.001 (2015).
22. Melton, L. A. Soot diagnostics based on laser heating. Appl. Opt. 23, 2201–2208. https://doi.org/10.1364/AO.23.002201 (1984).
23. Shaddix, C. R. & Smyth, K. C. Laser-induced incandescence measurements of soot production in steady and flickering methane,
propane, and ethylene diffusion flames. Combust. Flame 107, 418–452. https://doi.org/10.1016/S0010-2180(96)00107-1 (1996).
24. Will, S., Schraml, S. & Leipertz, A. Two-dimensional soot-particle sizing by time-resolved laser-induced incandescence. Opt. Lett.
20, 2342–2344. https://doi.org/10.1364/OL.20.002342 (1995).
25. Bladh, H., Johnsson, J. & Bengtsson, P.-E. On the dependence of the laser-induced incandescence (LII) signal on soot volume
fraction for variations in particle size. Appl. Phys. B 90, 109–125. https://doi.org/10.1007/s00340-007-2826-0 (2008).
26. Kock, B. F., Tribalet, B., Schulz, C. & Roth, P. Two-color time-resolved LII applied to soot particle sizing in the cylinder of a diesel
engine. Combust. Flame 147, 79–92. https://doi.org/10.1016/j.combustflame.2006.07.009 (2006).
27. Liu, F., Daun, K., Beyer, V., Smallwood, G. & Greenhalgh, D. Some theoretical considerations in modeling laser-induced
incandescence at low-pressures. Appl. Phys. B 87, 179–191. https://doi.org/10.1007/s00340-006-2514-5 (2007).
28. Liu, F., Stagg, B. J., Snelling, D. R. & Smallwood, G. J. Effects of primary soot particle size distribution on the temperature of soot
particles heated by a nanosecond pulsed laser in an atmospheric laminar diffusion flame. Int. J. Heat Mass Transf. 49, 777–788.
https://doi.org/10.1016/j.ijheatmasstransfer.2005.07.041 (2006).
29. Michelsen, H. A. et al. Modeling laser-induced incandescence of soot: A summary and comparison of LII models. Appl. Phys. B
87, 503–521, https://doi.org/10.1007/s00340-007-2619-5 (2007).
30. Wal, R. L. V., Ticich, T. M. & Stephens, A. B. Can soot primary particle size be determined using laser-induced incandescence?.
Combust. Flame 116, 291–296. https://doi.org/10.1016/S0010-2180(98)00040-6 (1999).
31. Will, S., Schraml, S. & Leipert, A. Comprehensive two-dimensional soot diagnostics based on laser-induced incandescence (LII).
Sympos. (Int.) Combust. 26, 2277–2284. https://doi.org/10.1016/S0082-0784(96)80055-5 (1996).
32. Hadef, R., Geigle, K. P., Meier, W. & Aigner, M. Soot characterization with laser-induced incandescence applied to a laminar
premixed ethylene-air flame. Int. J. Therm. Sci. 49, 1457–1467. https://doi.org/10.1016/j.ijthermalsci.2010.02.014 (2010).
Scientific Reports | (2020) 10:11364 | https://doi.org/10.1038/s41598-020-68256-z 10
Vol:.(1234567890)www.nature.com/scientificreports/
33. Tian, B., Zhang, C., Gao, Y. & Hochgreb, S. Planar 2-color time-resolved laser-induced incandescence measurements of soot in a
diffusion flame. Aerosol Sci. Technol. 51, 1345–1353. https://doi.org/10.1080/02786826.2017.1366644 (2017).
34. Patiño, F. et al. Soot primary particle sizing in a n-heptane doped methane/air laminar coflow diffusion flame by planar two-color
tire-lii and tem image analysis. Fuel 266, 117030. https://doi.org/10.1016/j.fuel.2020.117030 (2020).
35. Zai, S., Zhen, H. & Jia-song, W. Studies on the size distribution, number and mass emission factors of candle particles characterized
by modes of burning. Journal of Aerosol Science 37, 1484–1496. https://doi.org/10.1016/j.jaerosci.2006.05.001 (2006).
36. Desgroux, P., Mercier, X. & Thomson, K. A. Study of the formation of soot and its precursors in flames using optical diagnostics.
Proc. Combust. Inst. 34, 1713–1738. https://doi.org/10.1016/j.proci.2012.09.004 (2013).
37. Goulay, F., Schrader, P., Nemes, L., Dansson, M. & Michelsen, H. Photochemical interferences for laser-induced incandescence of
flame-generated soot. Proc. Combust. Inst. 32 I, 963–970. https://doi.org/10.1016/j.proci.2008.05.030 (2009).
38. Liu, F., Snelling, D. R., Thomson, K. & Smallwood, G. J. Sensitivity and relative error analyses of soot temperature and volume
fraction determined by two-color LII. Appl. Phys. B-Lasers Opt. 96, 623–636. https://doi.org/10.1007/s00340-009-3560-6 (2009).
39. Mugele, R. A. & Evans, H. D. Droplet size distribution in sprays. Ind. Eng. Chem. 43, 1317–1324. https://doi.org/10.1021/ie504
98a023 (1951).
40. Lefebvre, A. Atomization and sprays (Taylor & Francis, CRC Press, Boca Raton, 2017).
41. Chen, L. et al. Determination of soot particle size using time-gated laser-induced incandescence images. Appl. Phys. B 123, 96.
https://doi.org/10.1007/s00340-017-6669-z (2017).
42. Humphries, G. S. et al. A simple photoacoustic method for the in situ study of soot distribution in flames. Appl. Phys. B 119,
709–715. https://doi.org/10.1007/s00340-015-6132-y (2015).
43. Michelsen, H. Laser-induced incandescence of flame-generated soot on a picosecond time scale. Appl. Phys. B 83, 443. https://doi.
org/10.1007/s00340-006-2226-x (2006).
44. Schulz, C. et al. Laser-induced incandescence: recent trends and current questions. Appl. Phys. B 83, 333. https://doi.org/10.1007/
s00340-006-2260-8 (2006).
45. Tait, N. P. & Greenhalgh, D. A. PLIF imaging of fuel fraction in practical devices and LII imaging of soot. Ber. Bunsenges. Phys.
Chem. 97, 1619–1624. https://doi.org/10.1002/bbpc.19930971218 (1993).
46. Snelling, D. R., Liu, F., Smallwood, G. J. & Gülder, ÖL. Determination of the soot absorption function and thermal accommodation
coefficient using low-fluence LII in a laminar coflow ethylene diffusion flame. Combust. Flame 136, 180–190. https://doi.
org/10.1016/j.combustflame.2003.09.013 (2004).
47. Michelsen, H. A. Understanding and predicting the temporal response of laser-induced incandescence from carbonaceous particles.
J. Chem. Phys. 118, 7012–7045. https://doi.org/10.1063/1.1559483 (2003).
48. Krishnan, S. S., Lin, K.-C. & Faeth, G. M. Optical properties in the visible of overfire soot in large buoyant turbulent diffusion
flamesOptical properties in the visible of overfire soot in large buoyant turbulent diffusion flames. J. Heat Transf. 122, 517–524.
https://doi.org/10.1115/1.1288025 (2000).
49. Liu, F. et al. Review of recent literature on the light absorption properties of black carbon: Refractive index, mass absorption cross
section, and absorption function. Aerosol Sci. Technol. 54, 33–51. https://doi.org/10.1080/02786826.2019.1676878 (2020).
50. Filippov, A. & Rosner, D. Energy transfer between an aerosol particle and gas at high temperature ratios in the knudsen transition
regime. Int. J. Heat Mass Transf. 43, 127–138. https://doi.org/10.1016/S0017-9310(99)00113-1 (2000).
51. Liu, F., Smallwood, G. J. & Snelling, D. R. Effects of primary particle diameter and aggregate size distribution on the temperature of
soot particles heated by pulsed lasers. J. Quant. Spectrosc. Radiat. Transf. 93, 301–312. https://doi.org/10.1016/j.jqsrt.2004.08.027
(2005).
52. Fuchs, N. A. On the stationary charge distribution on aerosol particles in a bipolar ionic atmosphere. Geofis. Pura Appl. 56, 185–193.
https://doi.org/10.1007/BF01993343 (1963).
53. Lehre, T., Jungfleisch, B., Suntz, R. & Bockhorn, H. Size distributions of nanoscaled particles and gas temperatures from time-
resolved laser-induced-incandescence measurements. Appl. Opt. 42, 2021–2030. https://doi.org/10.1364/AO.42.002021 (2003).
54. Dankers, S. & Leipertz, A. Determination of primary particle size distributions from time-resolved laser-induced incandescence
measurements. Appl. Opt. 43, 3726–3731. https://doi.org/10.1364/AO.43.003726 (2004).
55. Escudero, F., Fuentes, A., Consalvi, J., Liu, F. & Demarco, R. Unified behavior of soot production and radiative heat transfer in
ethylene, propane and butane axisymmetric laminar diffusion flames at different oxygen indices. Fuel 183, 668–679. https://doi.
org/10.1016/j.fuel.2016.06.126 (2016).
Acknowledgements
This work was performed while Ignacio Verdugo received a research grant provided by DGIIP UTFSM through
the PIIC initiative and L.F. Figueira da Silva was on leave from the Institut Pprime (CNRS, France). The authors
also gratefully acknowledge the support provided by Brazil’s Conselho Nacional de Desenvolvimento Científico
e Tecnológico, CNPq, under the Research Grants No. 306069/2015-6 and 403904/2016-1 and by CAPES/PrInt
88881.310634/2018-01, and by Chile’s National Agency for Research and Development (ANID) through research
program PIA/ACT172095 (Hi-Map Project), Fondecyt/Regular 1191758 and Fondecyt/Postdoctoral 3190860.
Author contributions
Conceived and designed the experiments: I.V., J.C. and A.F. Conducted the experiments: I.V., J.C., E.A. and A.F.
Analyzed the data: I.V., J.C, P.R. and L.F. All the authors discussed the results, wrote the paper, drew conclusions
and edited the manuscript.
Competing interests
The authors declare no competing interests.
Additional information
Correspondence and requests for materials should be addressed to A.F.
Reprints and permissions information is available at www.nature.com/reprints.
Publisher’s note Springer Nature remains neutral with regard to jurisdictional claims in published maps and
institutional affiliations.
Scientific Reports | (2020) 10:11364 | https://doi.org/10.1038/s41598-020-68256-z 11
Vol.:(0123456789)www.nature.com/scientificreports/
Open Access This article is licensed under a Creative Commons Attribution 4.0 International
License, which permits use, sharing, adaptation, distribution and reproduction in any medium or
format, as long as you give appropriate credit to the original author(s) and the source, provide a link to the
Creative Commons license, and indicate if changes were made. The images or other third party material in this
article are included in the article’s Creative Commons license, unless indicated otherwise in a credit line to the
material. If material is not included in the article’s Creative Commons license and your intended use is not
permitted by statutory regulation or exceeds the permitted use, you will need to obtain permission directly from
the copyright holder. To view a copy of this license, visit http://creativecommons.org/licenses/by/4.0/.
© The Author(s) 2020
Scientific Reports | (2020) 10:11364 | https://doi.org/10.1038/s41598-020-68256-z 12
Vol:.(1234567890)You can also read


