Influences on Infrared Thermography of the Canine Eye in Relation to the Stress and Arousal of Racing Greyhounds - MDPI
←
→
Page content transcription
If your browser does not render page correctly, please read the page content below
animals
Article
Influences on Infrared Thermography of the Canine Eye in
Relation to the Stress and Arousal of Racing Greyhounds
Belle Elias * , Melissa Starling, Bethany Wilson and Paul McGreevy

                                           Faculty of Science, Sydney School of Veterinary Science, University of Sydney, Sydney, NSW 2006, Australia;
                                           melissa.starling@sydney.edu.au (M.S.); bethany.wilson@sydney.edu.au (B.W.);
                                           paul.mcgreevy@sydney.edu.au (P.M.)
                                           * Correspondence: beli0513@uni.sydney.edu.au

                                           Simple Summary: To improve the welfare of racing greyhounds, the identification of stressful in-
                                           dustry practices is required. One potential method for monitoring stress in greyhounds is infrared
                                           thermography, which measures surface temperature. This article reports on the use of eye tempera-
                                           ture, which may increase after a stressful event. The location on the eye that temperature is taken
                                           from is likely to be critical to the measurements. This study monitored 465 greyhounds racing at
                                           three racetracks in New South Wales. It found that the right eye and lacrimal caruncle (the inner
                                           corner of the eye) revealed temperature changes most effectively. Eye temperatures increased after
                                           racing, which may be due to physical exertion, stress and arousal. Additionally, eye temperature was
                                           higher in dogs that waited longer to race. Dogs at Richmond racetrack had lower eye temperatures
                                           before racing, but higher eye temperatures after racing compared to those at the Wentworth Park
                                           and Gosford racetrack. Other factors that increased eye temperature included humidity and a dog’s
                                           coat colour, age and final placing. Greyhounds that have light-coloured coats, are younger or placed
                                           poorly may be more stressed after racing. These factors need to be considered so that stress can be
                                           accurately detected.


                                           Abstract: Infrared thermography (IRT) can be used to identify stressors associated with greyhound
Citation: Elias, B.; Starling, M.;
                                           racing procedures. However, factors unrelated to stress may influence measurements. Validation of
Wilson, B.; McGreevy, P. Influences on
Infrared Thermography of the Canine
                                           an eye side (right or left) and a reference point on the eye is required if IRT is to be standardised for
Eye in Relation to the Stress and          industry use. Infrared images of greyhound heads (n = 465) were taken pre-racing and post-racing
Arousal of Racing Greyhounds.              at three racetracks. Average temperature was recorded at seven different locations on each eye.
Animals 2021, 11, 103. https://            A multivariate analysis model determined how several factors influenced eye temperature (ET)
doi.org/10.3390/ani11010103                pre-racing and post-racing. As expected, ET increased after racing, which may be attributed to
                                           physical exertion, stress and arousal. The right eye and lacrimal caruncle had the highest sensitivity
Received: 15 December 2020                 to temperature changes and could be considered reference points for future studies. Additionally,
Accepted: 3 January 2021                   dogs that raced later had higher ET, and Richmond racetrack had the lowest pre-race ET, but the
Published: 6 January 2021
                                           highest post-race ET. This may suggest that arousal increases as the race meet progresses and certain
                                           track attributes could increase stress. Furthermore, ET increased as humidity increased, and higher
Publisher’s Note: MDPI stays neu-
                                           post-race ET was associated with light-coloured, young and low-performing dogs. Environmental
tral with regard to jurisdictional clai-
                                           and biological factors need to be considered if IRT is to become accurate in the detection of canine
ms in published maps and institutio-
nal affiliations.
                                           stress and monitoring of greyhound welfare.

                                           Keywords: arousal; dog; eye temperature; greyhound; infrared thermography; lacrimal caruncle; stress

Copyright: © 2021 by the authors. Li-
censee MDPI, Basel, Switzerland.
This article is an open access article     1. Introduction
distributed under the terms and con-
                                                There has been an increase in public concern regarding the welfare of racing grey-
ditions of the Creative Commons At-
                                           hounds in Australia. This has threatened the ongoing public acceptance of the industry’s
tribution (CC BY) license (https://
creativecommons.org/licenses/by/
                                           standard practices and its social license to operate. The science of greyhound welfare
4.0/).
                                           is an area of growing interest, with a focus on stress associated with the race and race

Animals 2021, 11, 103. https://doi.org/10.3390/ani11010103                                                    https://www.mdpi.com/journal/animals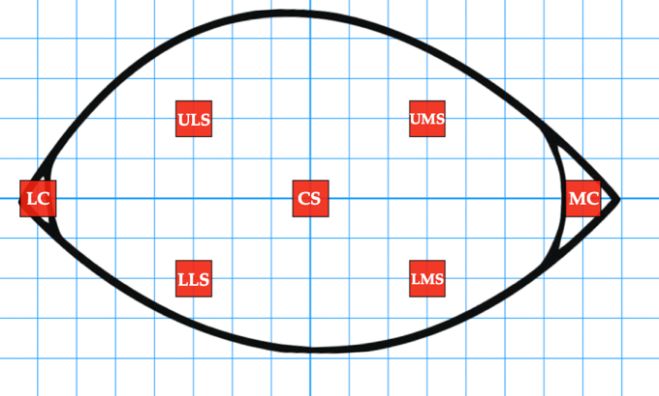
Animals 2021, 11, 103                                                                                           2 of 16

                        meet protocols [1–4]. Stress can compromise an animal’s optimal state of homeostasis
                        and wellbeing [5]. Shifts in the animal’s ability to cope may manifest as a behavioural,
                        physiological or psychological response to an external or internal stimulus [5]. The stress
                        response can become detrimental to health if it becomes chronic, which can occur via
                        repetition and persistence of an aversive stimulus [6]. The effects of stressors on affective
                        state vary in their valence (from pleasant to unpleasant) and with the animal’s current level
                        of arousal (from deactivated to activated). There is evidence that greyhounds exhibit signs
                        of physiological stress and arousal during a race meet [1–3], with arousal ranging from
                        calm to alert, or excited [7,8]. Best practice in housing and managing greyhounds during
                        a race meet should include optimising arousal and affective state at the time of maximal
                        exertion, as well as the early detection and mitigation of stress.
                              Infrared thermography (IRT) has emerged as a non-invasive and reliable method to
                        infer states of physiological stress in working [9,10], companion [11,12] and production
                        animals [13,14]. It detects infrared radiation that is emitted from an object as a measure
                        of its surface temperature (ST) and presents this as a heat map [11]. Recent studies have
                        used IRT to measure the temperature of the eye, which may reflect how body temperature
                        changes in response to events and stimuli [10,11,15–18]. Many IRT studies have shown that
                        eye temperature (ET) has the highest correlation with core body temperature (CBT) when
                        compared to the ST of other anatomical regions [10,11,16–19]. This correlation is attributed
                        to the proximity of the orbit to the brain, as well as the rich blood supply it receives.
                              A decrease in ET may reflect a stress response that is dominated by the sympathetic
                        nervous system (SNS) [20]. Studies of horses [9] and cattle [20] suggest that ET will decrease
                        when the animals are startled or in pain, respectively. This decrease may represent an
                        acute stress response whereby activation of the SNS mediates vasoconstriction and alters
                        capillary flow [20]. Canine studies have highlighted that ET will decrease after dogs are
                        separated from their owners, but will increase once they are reunited [12]. ET will also
                        increase when undergoing a veterinary examination [11] or in anticipation of receiving
                        a reward [19]. An increase of ET may reflect a stress response that is dominated by the
                        parasympathetic nervous system (PNS) [21,22]. This may represent a less acute stress re-
                        sponse whereby the hypothalamic–pituitary–adrenal (HPA) axis is activated and mediates
                        peripheral vasodilation. An increase in ET may be consistent with the general stress of a
                        race meet, including transportation, kennelling, race anticipation and the race itself.
                              Information about ET changes has been gained through the routine use of a particular
                        reference point on the eye: the lacrimal caruncle [9,11,15,20,23,24]. However, the use of the
                        lacrimal caruncle largely reflects convention. IRT studies justify its use as an unmistakable
                        landmark that has the highest temperature on the eye [20]. However, the fact that this
                        landmark has the highest temperature on the eye does not ensure that it will be the most
                        effective location to either detect temperature changes or reflect CBT. There is also a need
                        to establish whether one eye (right or left) is more sensitive to temperature changes after
                        a stimulus. Establishing this would determine whether the temperature of one or both
                        eyes must be recorded in future studies. An IRT study of stress responses of endurance
                        horses found a positive correlation between the temperature of the right eye and the left
                        eye after training [25]. However, this relationship has not been explored in dogs, so it will
                        be assessed in the current study with the use of greyhound ET during a race meet.
                              Research indicates that dogs display both behavioural and physiological signs of
                        stress during ground and air travel [26,27]. One study showed that plasma and salivary
                        cortisol concentrations in dogs increased after ground transport [27]. Transport is one of
                        many potential stressors that a greyhound may encounter during a race meet. In Australia,
                        competing greyhounds generally travel in air-conditioned trailers. Additionally, they are
                        kennelled in air-conditioned buildings at the race meet. Kennelled dogs may display
                        signs of behavioural stress, including increased vocalisation, that correlate with signs of
                        physiological stress, including elevated cortisol concentrations [28]. This may be due to the
                        unpredictable nature of the kennelling environment and the potential social interactions
                        that may occur [29].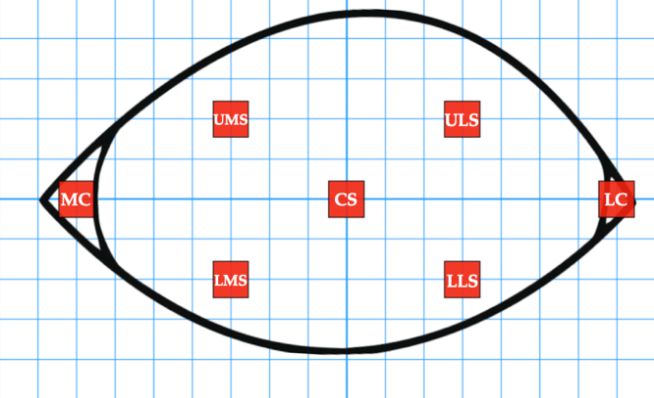
Animals 2021, 11, 103                                                                                          3 of 16

                              Studies confirm that anticipation of a stimulus, such as a reward or race, may increase
                        arousal levels in dogs [19,28,30]. One such stimulus for greyhounds is the so-called stir-up,
                        which is a feature of Australian greyhound racing. The stir-up occurs approximately five
                        minutes before each race and revolves around the greyhounds being allowed to watch
                        others compete. One study reported that greyhounds had elevated arousal levels by merely
                        watching others race, as well as when they raced themselves [1]. The use of a lure and
                        catching pen in races may further contribute to the greyhounds’ arousal and, to some extent,
                        their frustration. During a race, the greyhounds will chase the lure as it proceeds along the
                        track. Catching pens are then used to divert the greyhounds away from the lure and into
                        a holding area at the end of the race [11]. Catching pens are only used within Australia
                        and are intended to decrease the risk of injury [31]. However, the thwarted motivation
                        to prehend the putative prey item (the lure) can result in stress-related frustration, as the
                        greyhounds are unable to capture or interact with it [31]. So-called teasers, with which
                        dogs are allowed to interact, are now being trialled at some tracks in Australia in a bid
                        to avoid stress-related frustration. A teaser is a toy attached to a bungee line, which will
                        spring back into the catching pen as the dogs approach the end of the race.
                              Along with stressors associated with the race meet, there are other environmental
                        and biological factors that could influence the IRT measurements and must be considered
                        when assessing stress and arousal [32,33]. Ambient temperature and humidity could be
                        sources of stress during a race, as these factors can compromise an animal’s ability to
                        thermoregulate [2,34,35]. A previous greyhound study found that rectal temperature (RT)
                        increased during high ambient temperatures [2]. It suggested that the risk of heat stress
                        was higher among greyhounds with dark-coloured coats [2]. Coat colour is important for
                        heat resistance, given that research on cattle [36] and sheep [37] suggests light-coloured
                        animals can maintain lower body temperatures than dark-coloured animals during heat
                        stress. Dark-coloured coats may absorb more thermal radiation than light-coloured coats,
                        and thus may increase ST and CBT [2,37,38].
                              In IRT studies, age has been reported to influence ST in cattle, with younger animals
                        retaining lower ST than older animals [39]. Human studies suggest that ET decreases
                        with age [40]. However, relationships between ET and age have not been reported in
                        dogs. In cattle, sex can alter body temperature, especially when a cow is in oestrus [41].
                        In New South Wales (NSW), a greyhound bitch in season is not allowed on the premises
                        during a race meet. This provision may reduce the effects of sex on body temperature
                        during a race. However, one study found that male greyhounds had a higher RT after
                        racing, when compared to females [2]. It also reported a positive interaction between
                        body weight and increased RT after racing. Heat is generated as a by-product of ATP
                        production and utilisation during muscular activity [2], so the male effect may reflect
                        their larger bodies. The larger muscle mass typical of males is expected to produce more
                        metabolic heat [2]. Furthermore, an animal’s fitness and racing performance may influence
                        IRT measurements, given that an equine study showed that high-placing racehorses had
                        higher ST than low-placing racehorses [42].
                              The current study presents further analysis of data first reported in the preliminary
                        paper by Starling et al. (2020) [43]. It was designed to identify which eye side (right or
                        left) and reference point on the eye had the highest sensitivity to temperature changes
                        after exposure to a stimulus. It also investigates race meet factors that may be associated
                        with a physiological stress response, as shown through an increase of ET. Furthermore,
                        the environmental and biological factors that influence IRT measurements of the eye are
                        assessed, because these factors may confound the detection of stress associated with the
                        race and race meet protocols.

                        2. Materials and Methods
                            Data for this study were collected under the approval of the University of Sydney
                        Animal Ethics Committee (approval number: 2016/1015).
Animals 2021, 11, 103 4 of 16
2.1. Location
The data were collected in 2017 from 3 racetracks in NSW. In June, data were collected
at the Richmond track during 3 race meets, with 11 races occurring per meet. In July, data
were collected at the Wentworth Park track during 2 race meets, with 10 races occurring
per meet. In October and November, data were collected at the Gosford track during 3 race
meets, with 8, 10 and 11 races being recorded, respectively. The ambient temperature and
relative humidity at these locations were recorded to the nearest hour of each race, using
the records from Time and Date AS [44]. This website obtains relevant meteorological
information from Custom Weather [45].
During all of the recorded races at Richmond, a bungee teaser was being trialled. The
Wentworth Park track and Gosford track did not use teasers during the races. The teaser
at Richmond was comprised of two toys attached to separate bungee lines. Each toy was
covered in synthetic fur. The teaser was released as the competing dogs approached the
catching pen at the end of the race. It moved along the track and the dogs could follow it
into the sand trap within the catching pen, where they could interact with it.
2.2. Subjects
A total of 465 greyhounds were studied: 185 at Richmond, 127 at Wentworth Park
and 153 dogs at Gosford. Data were not collected on dogs that had already been studied
during a previous race or race meet. The dogs were given a 30 s physical examination by
a veterinarian once they arrived at the race meet. All dogs deemed fit to race were then
kennelled in an air-conditioned building awaiting the pre-stir-up. Each dog was given
enough space in its kennel to stand up and lie down. During the race meet, greyhound
handlers were asked a series of questions about their dog and their dog’s racing history.
These questions included:
1. How old is your greyhound (rounding to the nearest half year)?
2. How many times has your greyhound raced?
3. How many days has it been since your greyhound last raced?
4. How many minutes did it take to travel to the racetrack with your greyhound?
All of the information gathered during the race meets was cross-checked against, and
collated with, data from “The Dogs” website, which is the official website for greyhound
racing in Australia [46]. Data pertaining to the race (date, time, distance and number) were
recorded, as well as data about each greyhound (starting box number, sex, age, weight,
coat colour and final placing). Coat colours were divided into a “light” or “dark” category
using the methodology from a previous greyhound study [2]: light-coloured dogs had
coats that were fawn or white (including white mixes that were predominantly white);
dark-coloured dogs had coats that were predominantly black, blue or brindle.
2.3. Data Collection
As per the ethics approval, all greyhound handlers consented to the collection of
infrared images of the competing dogs. When permitted by the handlers, the dogs had
two infrared images taken; one 10 min before the race during the pre-stir-up and another
15 min after the race had finished. Before the race, the dogs were removed from their
kennels for the pre-stir-up and were given the opportunity to eliminate next to the track.
The first image was taken during this time, as it was the closest period to the race when all
dogs were accessible. After the race, the dogs were hosed down and offered water before
being kennelled again. They were required to stay in the kennels for at least 15 min, after
which they could be removed to vehicles and taken home. The second infrared image
was taken at the end of this 15-min post-race kennelling period. This reduced the effects
of physical exertion on ET, while still ensuring post-race images could be collected for as
many dogs as possible.
A FLIR T640 Professional Thermal Imaging Camera (T640, FLIR Systems Inc., Dan-
deryd, Sweden) was used to capture the images. This device was calibrated before the
study period began. The thermal images were taken out of direct sunlight and wind. TheyAnimals 2021, 11, 103 5 of 16
were taken 1 metre away from each greyhound at an 80–1000 angle from the midline of
the dog’s head. Opportunistically, the images focused on either the right or left eye, or
both if possible (Table 1). There were 111 dogs with images of the right eye captured pre-
and post-racing, 123 dogs with images of the left eye captured pre- and post-racing, and
21 dogs with images of both the right and left eye captured pre- and post-racing.
Table 1. The distribution of infrared images that captured the right eye, left eye or both eyes, before
and after the race.
Period Eye Side Captured in Infrared Image Number of Infrared Images
Right eye only 148
Before the race Left eye only 165
Both right and left eye 124
Right eye only 99
After the race Left eye only 120
Both right and left eye 81
The infrared images were analysed using the FLIR ResearchIR Max software (FLIR
Systems Inc., Danderyd, Sweden). The 1234 palette was used for each image as it provided
good contrast, allowing the eye to be viewed clearly. The Measurement Cursor Region
of Interest (ROI) was used to read the average temperature of a 3 × 3 box of pixels. This
ROI was chosen to provide a more accurate indication of temperature as it reads the
average of 9 pixels, rather than the Spot Cursor ROI which reads the value of a single
pixel. Measurements were undertaken for seven different locations on each eye, including
the medial canthus (specifically the lacrimal caruncle) (MC), lateral canthus (LC), upper
surface of the eye closest to the MC (UMS), upper surface of the eye closest to the LC
(ULS), lower surface of the eye closest to the MC (LMS), lower surface of the eye closest
to the LC (LLS) and the centre surface of the eye (CS) (Figures 1 and 2). Where possible,
all seven ROI averages were recorded. However, some ROI averages were missing due to
obstructions, such as kennel bars, or the angle of the dog’s head within the image (Table 2).
If multiple ROI averages were not apparent on a given image, the image could be discarded.
Animals 2021, 11, 103 6 of 17
Furthermore, blurry images were not used as accurate temperature measurements would
not be obtained.
(a) (b)
Figure
Figure 1.
1. (a)
(a) The
Theseven
sevenlocations
locationswhere
wherethe
theRegion
RegionofofInterest
Interestaverages
averages were recorded
were onon
recorded thethe
right eye.
right (b) (b)
eye. TheThe
seven lo-
seven
cations where the Region of Interest averages were recorded on the left
locations where the Region of Interest averages were recorded on the left eye.eye.Animals 2021, 11, 103
(a) (b) 6 of 16
Figure 1. (a) The seven locations where the Region of Interest averages were recorded on the right eye. (b) The seven lo-
cations where the Region of Interest averages were recorded on the left eye.
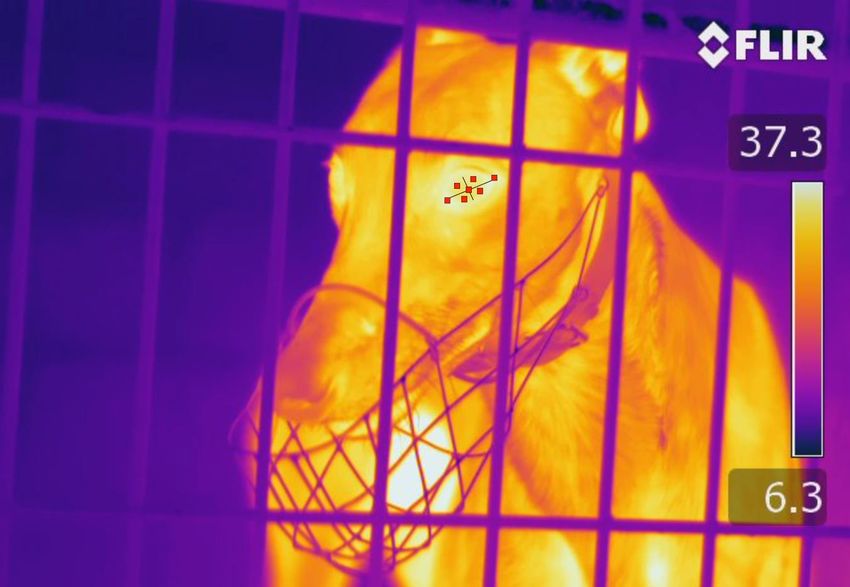
Figure 2.
Figure 2. Infrared
Infraredimage
imageofofa agreyhound
greyhoundviewed
viewed using
using thethe ResearchIR
ResearchIR MaxMax software.
software. TheThe
red red boxes
boxes onleft
on the theeye
leftrepresent
eye rep-
resent the seven locations in which the Region of Interest averages were recorded. The centre of the eye was located at the
the seven locations in which the Region of Interest averages were recorded. The centre of the eye was located at the intercept
intercept of the black lines.
of the black lines.
Table 2. The number of Region of Interest averages recorded for each location on the eye, both before
and after the race.
Number of Recorded Region of
Period Location on the Eye
Interest Averages
MC 508
LC 473
UMS 516
Before the race ULS 522
LMS 506
LLS 515
CS 544
MC 304
LC 269
UMS 320
After the race ULS 313
LMS 316
LLS 301
CS 337
2.4. Statistical Analysis
The mean distance travelled during races, mean ambient temperature and mean
relative humidity across the dataset were calculated using Microsoft Excel for Mac (Version
16.40, Microsoft, Redmond, WA, USA). The range, mean and standard deviation of ambient
temperature and relative humidity at each racetrack were also calculated.Animals 2021, 11, 103 7 of 16
The statistical analysis was performed in RStudio Cloud (version 1.2.5033.1, Mac OS,
RStudio Inc., Boston, MA, USA). A univariate analysis was performed for each variable.
Variables with a p-value higher than 0.2 were excluded from the multivariate analysis.
Excluded variables included the distance travelled to the race meet (Road_Travel), the
time of day that the race occurred (Race_Time) and the box number that the dog started
the race from (Starting_Box). Age and sex had p-values higher than 0.2, but were forced
into the multivariate analysis based on the current literature [2,39,40] and to facilitate the
interpretation of results.
A mixed model approach was chosen to permit inclusion of a dog effect and to model
the repeatability of the data. The final additive multivariate analysis model was built
using the stepwise deletion method and a significance level of 0.05. Linear mixed models
were fit by maximum likelihood, and t-tests were calculated using the Satterthwaite’s
method. Potential interactions were explored based on the final additive model and the
Akaike Information Criterion (AIC) was used to determine the model of best fit. The
factors excluded from the final model by the stepwise deletion method included how many
times the dog had previously raced (Racing_Starts), the number of days since the dog last
raced (Days_Last_Raced), distance travelled during the race (Race_Distance) and ambient
temperature (Ambient_Temp). Ambient temperature was not forced into the model due to
the effects of multicollinearity when including data from the two environmental factors:
ambient temperature and relative humidity (Humidity). This would produce an overly
complicated model that must be avoided. Relative humidity was included in the final
additive model, as this environmental factor produced a more effective model based on the
results of the stepwise deletion method.
3. Results
3.1. Descriptive Statistics
A total of 277 dogs had images taken both before and after the race, whereas 161 dogs
had images taken only before the race and 27 dogs had images taken only after the
race. Throughout the study period, all recorded races occurred between 3:12 p.m. and
10:42 p.m. The study population included male and female greyhounds between the ages of
1 to 6 years. The weight of these dogs ranged between 21.9 kg and 39.1 kg. In this study, 17%
of dogs (n = 77) had light-coloured coats and 83% of dogs (n = 388) had dark-coloured coats.
The racing experience varied among individuals, with the number of racing starts ranging
from 0 to 177 and the days since last raced ranging from 1 to 200. The dogs travelled
between 1 to 430 min by road to the racetrack. The distance travelled during races at
Gosford track ranged from 400 metres to 600 metres, averaging at 473.77 metres. Richmond
track had races that ranged from 330 metres to 618 metres, averaging at 444.5 metres.
Wentworth Park track had races that ranged from 520 metres to 720 metres, averaging at
537.65 metres. Furthermore, ambient temperature ranged from 10 ◦ C to 18 ◦ C, averaging
at 13.9 ◦ C, while relative humidity ranged from 42% to 87%, averaging at 66.4%. The
environmental conditions were not confounded between racetrack and season, as shown
in Table 3.
Table 3. The minimum value, maximum value, mean and standard deviation of ambient temperature and relative humidity
at each racetrack.
Environmental Factor Racetrack Month Minimum Value Maximum Value Mean Standard Deviation
Gosford October/November 15 18 16.46 1.05
Ambient temperature (◦ C) Richmond June 10 14 12.29 1.19
Wentworth Park July 11 15 13.17 1.41
Gosford October/November 72 87 80.46 5.76
Relative humidity (%) Richmond June 47 85 66.58 15.86
Wentworth Park July 42 59 49.09 5.85Animals 2021, 11, 103 8 of 16
3.2. Model Factors
A total of 5696 ET observations from 457 dogs were included in the final model. The
additive factors in the final model (AIC: 16743.8, Bayesian Information Criterion (BIC):
16876.8) included whether the image was taken before or after the race (Image_Timing),
whether the temperature was taken from the right or left eye (Eye_Side), the location on the
eye in which the temperature was taken from (Eye_Location), the order of the race during
each race meet (Race), the track the race was held at (Track) and the relative humidity. The
final model also included the dog’s coat colour (Coat_Colour), age (Age), sex (Sex), weight
(Weight) and final placing (Performance). It was hypothesised that these additive factors
would have a significant effect on ET. Furthermore, the final model had seven interactions:
Image_Timing and Eye_Side, Image_Timing and Eye_Location, Image_Timing and Track,
Image_Timing and Humidity, Image_Timing and Coat_Colour, Image_Timing and Age,
and Image_Timing and Performance. These interactions were added to explain more
variance and decrease the AIC (AIC: 16468.4, BIC: 16687.8).
3.3. Imaging and Measurement Factors
There was a significant difference between ET before and after the race (F-value: 14.001,
p-value:Animals 2021, 11, 103 9 of 16
p-value: 0.013). The MC had the highest temperature increase after racing whereas, for
several other locations on the eye, this effect was significantly smaller (Figure 4). However,
the temperature effects of the race at the LC and ULS were not significantly different from
those at the MC (Table 5).
Table 4. The distribution of estimates of reference effect, standard error, t-value and p-value of the
different anatomical locations across the eye compared to the medial canthus.
Eye Location Reference Effect Standard Error t-Value p-Value
LC −0.992 0.059 −16.850Animals 2021, 11, 103 10 of 16
3.4. Race Meet Factors
Race number had a significant effect on ET. As the race number increased, ET increased
(reference effect: 0.063, SE: 0.018, t-value: 3.436, p-value:Animals 2021, 11, 103 11 of 16
dogs exercise and exert energy [47,48]. This is due to the generation of heat from muscular
activity. Exercise will also increase cardiac output and blood flow to the extremities [49].
There may also be an emotional response to racing that could be detected in ET, but this
study was unable to distinguish between these potential influences. Future studies should
consider post-race ET alongside CBT and behavioural indicators of stress.
There was no significant difference between the temperature of the right eye and the
left eye before racing. However, the temperature of both eyes increased after racing, and
there was a higher increase of post-race ET on the right eye than the left eye. This may
suggest that the right eye was more sensitive to the effects of acute physical exertion or
physiological arousal. This may reflect a lateral response to the single direction of racing,
as the greyhounds were raced anticlockwise at each racetrack. Even so, the use of the right
eye in future ET studies on canine stress may be preferred for revealing more change in
temperature, especially if the changes to be detected are only marginal.
Furthermore, the location from which temperature measurements were taken on the
eye had a significant influence on ET, both before and after racing. Each location was
significantly different from the lacrimal caruncle before racing. The lacrimal caruncle had
the highest temperature across the eye and the LC had the second highest temperature;
a finding that supports the current literature [11]. This may be due to the rich capillary
beds that surround the posterior border of the eyelid and the lacrimal caruncle [11,20].
Research has shown that the lacrimal caruncle responds to changes in blood flow and has
been sensitive to CBT changes in response to SNS activation and HPA activation [11,20–22].
To these authors’ knowledge, no canine research has compared temperature sensitivity at
different locations on the eye, including the lacrimal caruncle, across a sampling population.
This study is the first to establish that the lacrimal caruncle is the ocular location
with the highest sensitivity to temperature changes after racing. This provides evidence
to support the use of the lacrimal caruncle in IRT studies, as this location may be able
to detect slight temperature changes more effectively than other ocular locations. Other
locations that were measured on the eye included the LC, UMS, ULS, LMS, LLS and CS.
The temperatures recorded at the LC and the ULS were not significantly different from
those at the lacrimal caruncle. Therefore, these locations may be useful as proxy locations
for ET measurements if the lacrimal caruncle is not apparent in a given opportunistic
infrared image. That said, the lacrimal caruncle should be the preferred location at which
ET measurements are taken in elective imaging studies. This is based on the finding that
the other ocular locations had lower temperatures than the lacrimal caruncle after racing,
and because the literature has shown that temperatures at this reference point are reflective
of responses to both pain and other stressors [11,20–22].
4.2. Race Meet Factors
The race number had a positive association with pre-race ET; the longer the dogs had
to wait to race, the higher their ET became. This may be due to the greyhounds becoming
more aroused as the race meet progressed [43]. Heightened arousal may be attributed
to ongoing disturbance during kennelling and anticipation of the race [19,28,30,43]. For
further discussion, readers are directed to Starling et al. (2020) [43].
Pre-race ET was lower at the Richmond track, than at the Gosford track and Went-
worth Park track. The preliminary paper suggests that the Gosford and Wentworth Park
tracks may be inherently more stressful pre-racing than the Richmond track [43]. The
environmental conditions were not confounded between racetrack and season. Therefore,
the difference in pre-race ET could be due to kennel design or the handling techniques used
to remove the dogs from the kennels for the pre-stir-up [43]. Again, readers are directed to
Starling et al. (2020) [43] for further discussion.
In the current study, the effect of track was more important after the race. The
differences in post-race ET between tracks are not easily explained. Results suggest envi-
ronmental conditions were not the primary influence on post-race ET, as post-race ET at
Gosford (October/November) and Wentworth Park (July) was not significantly different.Animals 2021, 11, 103 12 of 16
Richmond (June) had the highest post-race ET, but the lowest mean ambient temperature
(byAnimals 2021, 11, 103 13 of 16
ET was less pronounced in older dogs than in younger dogs. This may suggest that older
dogs are less affected by racing than younger dogs. Young and inexperienced racehorses
can quickly develop hyperthermia when they become overly aroused [50]. Furthermore,
studies suggest that excitability and arousal levels may be higher in smaller and younger
dogs [51–54]. Therefore, in the current study, the higher post-race ET in younger dogs may
be associated with less heat resistance and/or higher arousal levels than in older, more
seasoned dogs.
There was also an association between post-race ET and performance. The increase
in post-race ET was less pronounced in dogs that placed higher in their races. This may
suggest that high-placing dogs were less affected by racing than low-placing dogs. This
prospect has not been reported in the literature. However, a racehorse study found that
high-placing animals had higher ST than low-placing animals [42]. In the current study,
high-placing dogs may be fitter and less susceptible to metabolic heat stress. However,
when reporting on much fewer greyhounds (n = 229), McNicholl et al. (2016) [2] found no
association between fitness level and post-race RT. The results of the current study may also
suggest that older dogs and high performing dogs may cool more quickly, thus reducing
the increase of post-race ET.
4.5. Study Limitations and Future Research
The first infrared image was taken before the race when the dogs were removed from
kennelling for the pre-stir-up. Future studies should aim to take an additional infrared
image prior to first kennelling, so that an approximate baseline temperature for each
greyhound can be established. Although, this may not reflect a true baseline either, as
greyhounds travel to the race meet and are quickly moved to a queue for vetting once they
are unloaded from vehicles. However, an additional image may reveal more information
about the effects of kennelling and the pre-stir-up. Additionally, the links between stress
and race meet practices and protocols in the current study are largely speculative. They
are presented here chiefly to generate avenues for further enquiry. Future studies should
focus sampling on fewer dogs to allow for CBT measurements to be collected, as well as
data from the same dogs at multiple tracks. Furthermore, IRT fails to discriminate between
emotional valence and arousal [7,11,19]. Emotional valence describes the affective state,
which ranges from negative to positive [7,8]. Greyhounds may exhibit behavioural signs of
emotional stress during a race meet. Therefore, future studies should also use behavioural
indicators, such as data scored against ethograms [11,19]. This would allow emotional
stress to be distinguished from physiological arousal.
The use of CBT alongside ET would be beneficial in future studies to clearly identify
non-exertional effects on temperature differences and identify the latency for ET to return
to baseline temperatures after the race. A previous greyhound study reported that heart
rate returned to pre-race values 10 min after a 100-metre sprint. However, that study
also suggested that a longer recovery period may be required for RT to return to the pre-
race temperature [3]. Another study found that after dogs have exercised for a 30-min
period, CBT can take up to 30 min to return to baseline [47]. In the current study, the
second infrared image was taken after a 15-min cool-down period. Therefore, physical
exertion and exercise hyperthermia are likely to have played a significant role in post-race
ET measurements and it would be difficult to isolate the effects of physiological stress.
However, it was not possible to take the image more than 15 min after the race because,
at that juncture, the greyhounds were being removed from the venues. There is a strict
schedule that must be adhered to and handlers were concerned about the stress levels of
their dogs. Future studies could sample dogs at training and trial events. However, this
would not account for the effects of the race day environment.
In terms of eye side sensitivity, the current opportunistic study should be considered
as a pilot study. The greyhounds were raced only in an anticlockwise direction at the three
racetracks, which may mean there was a lateral influence. Therefore, future studies should
investigate the sensitivity of the right and left eye of greyhounds racing in both directions.Animals 2021, 11, 103 14 of 16
Furthermore, the association between coat colour and post-race ET during high ambient
temperatures warrants further study, as the current study was conducted on relatively cool
days, averaging at 13.9 ◦ C. Future studies could also aim to obtain a more balanced ratio of
light-coloured dogs and dark-coloured dogs, as 17% of dogs in this study were considered
“light” and 83% of dogs were “dark”. A balanced population may permit a more detailed
analysis of any differences between the two phenotypes.
5. Conclusions
IRT is a useful method to infer states of stress and arousal in canine welfare science. IRT
can be used to measure the temperature of the eye to reflect how CBT changes in response
to stressors. The use of the right eye and lacrimal caruncle should be implemented in future
IRT studies, as they are particularly sensitive to temperature changes. Stressors related
to racing may include the length of periods dogs spend waiting to race, as well as track
attributes that warrant further study with CBT comparisons. Environmental and biological
factors that may be unrelated to stress can influence IRT measurements of the eye due to
the effects of physical exertion. These factors include humidity and a dog’s coat colour, age
and final placing in the race. These factors need to be addressed and built into emerging
welfare assessment protocols, so that stress can be accurately measured in future studies.
Industry procedures and greyhound welfare could then be improved through the early
detection and mitigation of stress. This may help to address the concerns of the public, as
well as maintain racing integrity through the routine use of IRT to screen greyhounds for
their fitness to race.
Author Contributions: Conceptualisation, B.E., M.S. and P.M.; methodology, B.E. and M.S.; formal
analysis, B.E. and B.W.; investigation, B.E. and M.S.; data curation, B.E., M.S. and B.W.; writing—
original draft preparation, B.E.; writing—review and editing, M.S. and P.M.; visualisation, B.E.;
supervision, M.S., P.M. and B.W.; project administration, M.S. and P.M.; funding acquisition, M.S.
and P.M. All authors have read and agreed to the published version of the manuscript.
Funding: This research received no external funding. However, the data were originally collected
under a project funded by Greyhound Racing NSW.
Institutional Review Board Statement: The study was approved by the University of Sydney
Animal Ethics Committee (approval number: 2016/1015).
Informed Consent Statement: Not applicable.
Data Availability Statement: The data presented in this study are available on request from the
corresponding author.
Acknowledgments: The authors would like to acknowledge Greyhound Racing NSW for their
assistance in data collection.
Conflicts of Interest: The authors declare no conflict of interest.
References
1. Gillette, R.L.; Angle, T.C.; Sanders, J.S.; Degraves, F.J. An evaluation of the physiological affects of anticipation, activity arousal
and recovery in sprinting greyhounds. Appl. Anim. Behav. Sci. 2011, 130, 101–106. [CrossRef]
2. McNicholl, J.; Howarth, G.S.; Hazel, S.J. Influence of the environment on body temperature of racing greyhounds. Front. Vet. Sci.
2016, 3, 53. [CrossRef] [PubMed]
3. Pellegrino, F.J.; Risso, A.; Vaquero, P.G.; Corrada, Y.A. Physiological parameter values in greyhounds before and after high-
intensity exercise. Open. Vet. J. 2018, 8, 64–67. [CrossRef] [PubMed]
4. Vainionpää, M.; Esa-Pekka, T.; Raekallio, M.; Junnila, J.; Snellman, M.; Vainio, O. Thermographic imaging of the superficial
temperature in racing greyhounds before and after the race. Sci. World J. 2012, 2012, 182749. [CrossRef] [PubMed]
5. Mills, D.; Dube, M.B.; Zulch, H. Stress and Pheromonatherapy in Small Animal Clinical Behaviour, 2nd ed.; Wiley-Blackwell: Chichester,
UK, 2012; pp. 4–270. [CrossRef]
6. Thompson, R.S.; Strong, P.V.; Fleshner, M. Physiological consequences of repeated exposures to conditioned fear. Behav. Sci. 2012,
2, 57–78. [CrossRef]
7. Starling, M.J.; Branson, N.; Cody, D.; McGreevy, P.D. Conceptualising the impact of arousal and affective state on training
outcomes of operant conditioning. Animals 2013, 3, 300–317. [CrossRef]Animals 2021, 11, 103 15 of 16
8. Tan, J.W.; Andrade, A.O.; Li, H.; Walter, S.; Hrabal, D.; Rukavina, S.; Limbrecht-Ecklundt, K.; Hoffman, H.; Traue, H.C. Recognition
of intensive valence and arousal affective states via facial electromyographic activity in young and senior adults.(Report). PLoS
ONE 2016, 11, e0146691. [CrossRef]
9. Dai, F.; Cogi, N.H.; Heinzl, E.U.L.; Dalla Costa, E.; Canali, E.; Minero, M. Validation of a fear test in sport horses using infrared
thermography. J. Vet. Behav. 2015, 10, 128–136. [CrossRef]
10. Bartolomé, E.; Sánchez, M.J.; Molina, A.; Schaefer, A.L.; Cervantes, I.; Valera, M. Using eye temperature and heart rate for stress
assessment in young horses competing in jumping competitions and its possible influence on sport performance. Animal 2013, 7,
2044–2053. [CrossRef]
11. Travain, T.; Colombo, E.S.; Heinzl, E.; Bellucci, D.; Prato Previde, E.; Valsecchi, P. Hot dogs: Thermography in the assessment of
stress in dogs (Canis familiaris)—A pilot study. J. Vet. Behav. 2015, 10, 17–23. [CrossRef]
12. Riemer, S.; Assis, L.; Pike, T.W.; Mills, D.S. Dynamic changes in ear temperature in relation to separation distress in dogs. Physiol.
Behav. 2016, 167, 86–91. [CrossRef] [PubMed]
13. Edgar, J.L.; Nicol, C.J.; Pugh, C.A.; Paul, E.S. Surface temperature changes in response to handling in domestic chickens. Physiol.
Behav. 2013, 119, 195–200. [CrossRef]
14. McManus, C.; Tanure, C.B.; Peripolli, V.; Seixas, L.; Fischer, V.; Gabbi, A.M.; Menegassi, S.R.O.; Stumpf, M.T.; Kolling, G.J.;
Dias, E.; et al. Infrared thermography in animal production: An overview. Comput. Electron. Agric. 2016, 123, 10–16. [CrossRef]
15. Cannas, S.; Palestrini, C.; Canali, E.; Cozzi, B.; Ferri, N.; Heinzl, E.; Minero, M.; Chincarini, M.; Vignola, G.; Dalla Costa, E.
Thermography as a non-invasive measure of stress and fear of humans in sheep. Animals 2018, 8, 146. [CrossRef] [PubMed]
16. Church, J.S.; Hegadoren, P.R.; Paetkau, M.J.; Miller, C.C.; Regev-Shoshani, G.; Schaefer, A.L.; Schwartzkopf-Genswein, K.S.
Influence of environmental factors on infrared eye temperature measurements in cattle. Res. Vet. Sci. 2014, 96, 220–226. [CrossRef]
17. Herborn, K.A.; Graves, J.L.; Jerem, P.; Evans, N.P.; Nager, R.; McCafferty, D.J.; McKeegan, D.E.F. Skin temperature reveals the
intensity of acute stress. Physiol. Behav. 2015, 152, 225–230. [CrossRef] [PubMed]
18. McAfferty, D.J. Applications of thermal imaging in avian science. IBIS 2013, 155, 4–15. [CrossRef]
19. Travain, T.; Colombo, E.S.; Grandi, L.C.; Heinzl, E.; Pelosi, A.; Prato Previde, E.; Valsecchi, P. How good is this food? A
study on dogs’ emotional responses to a potentially pleasant event using infrared thermography. Physiol. Behav. 2016,
159, 80–87. [CrossRef]
20. Stewart, M.; Stafford, K.J.; Dowling, S.K.; Schaefer, A.L.; Webster, J.R. Eye temperature and heart rate variability of calves
disbudded with or without local anaesthetic. Physiol. Behav. 2008, 93, 789–797. [CrossRef]
21. Cook, N.; Schaefer, A.; Warren, L.; Burwash, L.; Anderson, M.; Baron, V. Adrenocortical and metabolic responses to ACTH
injection in horses: An assessment by salivary cortisol and infrared thermography of the eye. Can. J. Anim. Sci. 2001, 81, 621.
22. Valera, M.; Bartolomé, E.; Sánchez, M.J.; Molina, A.; Cook, N.; Schaefer, A. Changes in eye temperature and stress assessment in
horses during show jumping competitions. J. Equine Vet. Sci. 2012, 32, 827–830. [CrossRef]
23. Stewart, M.; Verkerk, G.A.; Stafford, K.J.; Schaefer, A.L.; Webster, J.R. Noninvasive assessment of autonomic activity for evaluation
of pain in calves, using surgical castration as a model. J. Dairy Sci. 2010, 93, 3602–3609. [CrossRef] [PubMed]
24. Stewart, M.; Webster, J.R.; Verkerk, G.A.; Schaefer, A.L.; Colyn, J.J.; Stafford, K.J. Non-invasive measurement of stress in dairy
cows using infrared thermography. Physiol. Behav. 2007, 92, 520–525. [CrossRef] [PubMed]
25. Redaelli, V.; Luzi, F.; Mazzola, S.; Bariffi, G.D.; Zappaterra, M.; Nanni Costa, L.; Padalino, B. The use of infrared thermography
(IRT) as stress indicator in horses trained for endurance: A pilot study. Animals 2019, 9, 84. [CrossRef] [PubMed]
26. Leadon, D.P.; Mullins, E. Relationship between kennel size and stress in greyhounds transported short distances by air. Vet. Rec.
1991, 129, 70. [CrossRef]
27. Bergeron, R.; Scott, S.L.; Emond, J.-P.; Mercier, F.; Cook, N.J.; Schaefer, A.L. Physiology and behavior of dogs during air transport.
Can. J. Vet. Res. 2002, 66, 211–216.
28. Part, C.E.; Kiddie, J.L.; Hayes, W.A.; Mills, D.S.; Neville, R.F.; Morton, D.B.; Collins, L.M. Physiological, physical and behavioural
changes in dogs (Canis familiaris) when kennelled: Testing the validity of stress parameters. Physiol. Behav. 2014, 133,
260–271. [CrossRef]
29. Radisavljević, K.; Vučinić, M.; Becskei, Z.; Stanojković, A.; Ostović, M. Comparison of stress level indicators in blood of
free-roaming dogs after transportation and housing in the new environment. J. Appl. Anim. Res. 2017, 45, 52–55. [CrossRef]
30. Armario, A. Chapter 7-Studying chronic stress in animals: Purposes, models and consequences. In Neuroendocrinology of Stress;
Russel, J., Shipston, M., Eds.; Wiley Blackwell: Chichester, UK, 2015; pp. 143–168. [CrossRef]
31. Cobb, M.L.; Branson, N.; McGreevy, P.D.; Bennett, P.C.; Rooney, N.J.; Magdalinski, T.; Howell, T.J.; Dawson, K. Review and
Assessment of Best Practice Rearing, Socialisation, Education and Training Methods for Greyhounds in a Racing Context; Working Dog
Alliance Australia: Sydney, NSW, Australia, 2015; pp. 1–163. [CrossRef]
32. Fernández-Cuevas, I.; Bouzas Marins, J.C.; Arnáiz Lastras, J.; Gómez Carmona, P.M.; Piñonosa Cano, S.; García-Concepción,
M.Á.; Sillero-Quintana, M. Classification of factors influencing the use of infrared thermography in humans: A review. Infrared
Phys. Technol. 2015, 71, 28–55. [CrossRef]
33. Vendt, R.; Juurma, M.; Jaanson, P.; Vabson, V.; Kübarsepp, T.; Noorma, M. Effects of environmental conditions on the performance
of thermal imagers. Int. J. Thermophys. 2011, 32, 248–257. [CrossRef]
34. Otto, C.M.; Hare, E.; Nord, J.L.; Palermo, S.M.; Kelsey, K.M.; Darling, T.A.; Schmidt, K.; Coleman, D. Evaluation of three hydration
strategies in detection dogs working in a hot environment. Front. Vet. Sci. 2017, 4, 174. [CrossRef] [PubMed]Animals 2021, 11, 103 16 of 16
35. O’Brien, C.; Berglund, L.G. Predicting recovery from exertional heat strain in military working dogs. J. Therm. Biol. 2018, 76,
45–51. [CrossRef] [PubMed]
36. Brown-Brandl, T.M.; Eigenberg, R.A.; Nienaber, J.A. Heat stress risk factors of feedlot heifers. Livest. Sci. 2006, 105, 57–68. [CrossRef]
37. McManus, C.; Paludo, G.R.; Louvandini, H.; Gugel, R.; Sasaki, L.C.B.; Paiva, S.R. Heat tolerance in Brazilian sheep: Physiological
and blood parameters. Trop. Anim. Health Prod. 2009, 41, 95–101. [CrossRef]
38. Maloney, S.K.; Fuller, A.; Mitchell, D. Climate change: Is the dark Soay sheep endangered? Biol. Lett. 2009, 5, 826–829. [CrossRef]
39. Kotrba, R.; Knížková, I.; Kunc, P.; Bartoš, L. Comparison between the coat temperature of the eland and dairy cattle by infrared
thermography. J. Therm. Biol. 2007, 32, 355–359. [CrossRef]
40. Aliò, J.; Padron, M. Influence of age on the temperature of the anterior segment of the eye. Ophthalmic Res. 1982, 14,
153–159. [CrossRef]
41. Cooper-Prado, M.J.; Long, N.M.; Wright, E.C.; Goad, C.L.; Wettemann, R.P. Relationship of ruminal temperature with parturition
and estrus of beef cows. J. Anim. Sci. 2011, 89, 1020–1027. [CrossRef]
42. Soroko, M.; Dudek, K.; Howell, K.; Jodkowska, E.; Henklewski, R. Thermographic evaluation of racehorse performance. J. Equine
Vet. Sci. 2014, 34, 1076–1083. [CrossRef]
43. Starling, M.; Spurrett, A.; McGreevy, P. A pilot study of methods for evaluating the effects of arousal and emotional valence on
performance of racing greyhounds. Animals 2020, 10, 1037. [CrossRef]
44. Time and Date AS Past Weather in Richmond, New South Wales, Australia—June 2017. Available online: https://www.
timeanddate.com/weather/@2151650/historic?month=6&year=2017 (accessed on 20 February 2020).
45. Custom Weather Historical Weather: Data & Analytics. Available online: https://customweather.com/products/historical-data-
analytics/ (accessed on 20 February 2020).
46. The Dogs Racing Results. Available online: http://m.thedogs.com.au/Racing/Results (accessed on 20 February 2020).
47. Zanghi, B.M. Eye and ear temperature using infrared thermography are related to rectal temperature in dogs at rest or with
exercise. Front. Vet. Sci. 2016, 3, 1–9. [CrossRef] [PubMed]
48. Rizzo, M.; Arfuso, F.; Alberghina, D.; Giudice, E.; Gianesella, M.; Piccione, G. Monitoring changes in body surface temperature
associated with treadmill exercise in dogs by use of infrared methodology. J. Therm. Biol. 2017, 69, 64–68. [CrossRef] [PubMed]
49. Robbins, P.J.; Ramos, M.T.; Zanghi, B.M.; Otto, C.M. Environmental and physiological factors associated with stamina in dogs
exercising in high ambient temperatures. Front. Vet. Sci. 2017, 4, 144. [CrossRef] [PubMed]
50. Hodgson, D.R. Chapter 8-Thermoregulation. In The Athletic Horse, 2nd ed.; Hodgson, D.R., McKeever, K.H., McGowan, C.M.,
Eds.; W.B. Saunders: St. Louis, MO, USA, 2014; pp. 108–124. [CrossRef]
51. Bray, E.; MacLean, E.; Hare, B. Increasing arousal enhances inhibitory control in calm but not excitable dogs. Anim. Cogn. 2015,
18, 1317–1329. [CrossRef]
52. McGreevy, P.D.; Georgevsky, D.; Carrasco, J.; Valenzuela, M.; Duffy, D.L.; Serpell, J.A. Dog behavior co-varies with height,
bodyweight and skull shape.(Research article). PLoS ONE 2013, 8, e80529. [CrossRef]
53. Serpell, J.A.; Duffy, D.L. Chapter 2-Dog breeds and their behavior. In Domestic Dog Cognition and Behavior: The Scientific Study of
Canis Familiaris; Horowitz, A., Ed.; Springer Publishing: New York, NY, USA, 2014; pp. 31–57. [CrossRef]
54. Lisa, J.W.; Dóra, S.; Enikő, K. Cross-sectional age differences in canine personality traits; influence of breed, sex, previous trauma,
and dog obedience tasks. Front. Vet. Sci. 2020, 6, 493. [CrossRef]You can also read