Influence of Cryoconcentration on Quality Attributes of Apple Juice (Malus Domestica cv. Red Fuji) - MDPI
←
→
Page content transcription
If your browser does not render page correctly, please read the page content below
applied
           sciences
Article
Influence of Cryoconcentration on Quality Attributes
of Apple Juice (Malus Domestica cv. Red Fuji)
Patricio Orellana-Palma 1, * , Virgilio Lazo-Mercado 2 , María Pía Gianelli 2 ,
Eduard Hernández 3 , Rommy N. Zúñiga 1,4 and Guillermo Petzold 2, *
 1    Department of Biotechnology, Universidad Tecnológica Metropolitana, Las Palmeras 3360, P.O. Box,
      7800003 Ñuñoa, Santiago, Chile; rommy.zuniga@utem.cl
 2    Department of Food Engineering, Universidad del Bío-Bío, Av. Andrés Bello 720, Casilla 447,
      3780000 Chillán, Chile; vilo.lazo@gmail.com (V.L.-M.); mgianel@ubiobio.cl (M.P.G.)
 3    Agri-Food Engineering and Biotechnology Department, Universitat Politècnica de Catalunya (UPC
      BarcelonaTech), Esteve Terradas, 8, 08860 Castelldefels, Barcelona, Spain; eduard.hernandez@upc.edu
 4    Programa Institucional de Fomento a la I+D+i, Universidad Tecnológica Metropolitana,
      Ignacio Valdivieso 2409, San Joaquín, 8940577 Santiago, Chile
 *    Correspondence: p.orellanap@utem.cl (P.O.-P.); gpetzold@ubiobio.cl (G.P.)

 Received: 30 December 2019; Accepted: 24 January 2020; Published: 2 February 2020

 Abstract: Apple juice was subjected to centrifugal block cryoconcentration (CBCC) for three cycles
 and their effect on the physicochemical properties, bioactive compounds, antioxidant activity, volatile
 profile, and sensory analysis was investigated. In the final cycle, the solutes were approximately
 four-fold of the initial condition (≈14 ◦ Brix) and the color (∆E* ≈ 25.0) was darker than the fresh
 juice, with bioactive compound concentration values close to 819 mg GAE/100 g d.m., 248 and
 345 mg CEQ/100 g d.m. for total polyphenol, flavonoid, and flavanol content, respectively, equivalent
 to a retention of over 60%. DPPH and FRAP assays presented high antioxidant activities, with
 values of approximately 1803 µmol TE/100 g d.m. and 2936 µmol TE/100 g d.m, respectively.
 The cryoconcentrate showed a similar aromatic profile to the fresh juice, with 29 and 28 volatile
 compounds identified, respectively. The centrifugal force allowed to obtain excellent process
 parameters, with 73%, 0.87 (kg/kg), and 85% for efficiency, solute yield, and percentage of concentrate,
 respectively. Sensory evaluation shows that the odor, aroma, and flavor of fresh sample were remained
 in the reconstituted cryoconcentrate sample, with good qualifications (four points in a five-score
 hedonic scale) by trained panelists. Therefore, CBCC can preserve important quality attributes from
 apple juice.

 Keywords: cryoconcentration; apple juice; physicochemical properties; bioactive compounds;
 aromatic profile; process parameters; sensory analysis

1. Introduction
      Apples have been widely recognized as a highly consumed fruit worldwide. Specifically, this
fruit presented in 2019/2020 a world production of approximately 76 million tons [1]. Thus, the food
industry has applied traditional technologies to keep this fruit available throughout the year through
the development of numerous products from fresh apples, such as juice, jellies, jams, purees, wines,
and sauces, among others [2]. However, concentration by evaporation, the most used technology in
the food industry, exhibited disadvantages due to the high temperatures used, which accelerate the
degradation of physicochemical properties and bioactive compounds, and affect the health benefits
associated to fruit consumption [3]. Therefore, in the last decade, potential and alternative non-thermal
technologies, such as pulsed UV-light (PL), ultrasound (US), irradiation (IR), pulsed electric field (PEF),

Appl. Sci. 2020, 10, 959; doi:10.3390/app10030959                                 www.mdpi.com/journal/applsci
Appl. Sci. 2020, 10, 959 2 of 17
high-pressure processing (HPP), cold plasma (CP), and cryoconcentration (CC) have been studied in
order to protect and preserve various heat-labile components, and so, retain important nutritional and
sensory characteristics in the final product [4].
CC has been known as a novel, non-thermal and emerging technology, in which the temperature
of an aqueous solution or dispersion is cooled below its freezing point until the complete solidification
of the liquid sample, then the unfrozen liquid fraction (cryoconcentrate) is separated from the ice
phase by natural thawing or by addiction of an external force (also called assisted technique) to the CC
process [5]. Hence, CC can be used as a concentration technology to preserve heat-labile components,
with a minimal loss of important components [6].
Actually, three CC procedures are available at industrial, semi-industrial and laboratory level:
(i) suspension (SCC) [7], (ii) progressive (PCC) [8,9], and (iii) block cryoconcentration (BCC) [10]. In BCC,
a liquid solution is completely freezing; then the block is thawed and, finally, the cryoconcentrate
is separated from the ice fraction. Therefore, BCC utilizes three steps: complete freezing, thawing,
and separating [11]. Precisely, the final stage in BCC has been carried out by passive thawing [12] or
with the help of assisted techniques coupled to the BCC system to improve some process parameters
such as efficiency, solute yield and/or percentage of concentrate [5].
Specifically, centrifugation has been applied as an assisted technique to BCC, with remarkable
results, since it enhanced the solute extraction from the veins formed in the ice fraction and, thus,
it increased the process parameters and final amount of cryoconcentrate solute after the separation step.
Studies have reported that the efficiency process was improved with values between 60% and 75%
at three centrifugal cycles [13]. Hence, centrifugal block cryoconcentration (CBCC) has been applied
in different frozen liquid samples [14–20]. Although CBCC has been applied in fruit juices, there is
very little scientific data reported in the literature on the retention of heat-labile components in various
juices, e.g., fresh apple juice.
Therefore, the overall objective of the present study is to evaluate the effect of CBCC to protect
valuable quality attributes, such as physicochemical parameters, bioactive compounds, antioxidant
activity, volatile profile and sensory properties of apple juice (Malus domestica cv. Red Fuji).
2. Materials and Methods
2.1. Reagents and Standards
A general experimental procedure is schematized in Figure 1. The apple juice was axially frozen
in Folin–Ciocalteu reagent, Na2 CO3 , Gallic acid, NaNO2 , AlCl3 , NaOH, Catequin, vanillin reagent,
HCl, DPPH methanolic solution, FRAP reagent and the aroma standards were all purchased from rom
Sigma-Aldrich (St. Louis, MO, USA).
2.2. General Experimental Procedure
A general experimental procedure is schematized in Figure 1. The apple juice was axially frozen
in centrifugal tubes (45 mL of sample) at −20 ◦ C for 12 h, and then the frozen samples were transferred
to a centrifuge equipment operated at 20 ◦ C for 15 min at 4000 rpm (1600 RCF) to force the separation
of solutes from the ice fraction during thawing at three centrifugal cycles [16]. After each CBCC cycle,
a portion of concentrated was collected, and thus, the quality attributes were determined.Appl. Sci. 2020, 10, 959 3 of 17
Appl. Sci. 2020, 10, x 4 of 17
Figure 1. General centrifugal-assisted BCC experimental procedure.
Figure 1. General centrifugal-assisted BCC experimental procedure.
2.3. Preparation of Apple Juice
2.3. Preparation of Apple Juice
Whole fresh apples (Malus domestica cv. Red Fuji) were acquired from a local market in Chillán
(Región Whole fresh apples
del Ñuble, south(Malus
regiondomestica
of Chile).cv.Specifically,
Red Fuji) were the acquired
apples were frommanually
a local market in Chillán
collected, with
(Región del Ñ uble, south region of Chile). Specifically, the apples
commercial maturity (85%–100% mature stage), during the main harvest season (Summer 2018) from were manually collected, with
commercial maturity (85%–100% mature stage), during the main
orchards in Villa Alegre (Región del Maule, south-central region of Chile). Región del Maule isharvest season (Summer 2018)
from orchards
characterized byinaVilla Alegre (Región
mid-latitude temperatedel climate
Maule, withsouth-central region
four seasons. Inof Chile). Región
summer, del Mauleinis
the temperature
Maule ranges from 22 to 30 ◦ C, and daylight hours from 60% to 70% of the day [16]. The fruits werein
characterized by a mid-latitude temperate climate with four seasons. In summer, the temperature
Mauleunder
stored rangesrefrigeration
from 22 to 30at°C, 4 ◦C and daylight
until hours from
processing. 60% towere
The apples 70% of the daypeeled,
washed, [16]. Thecutfruits were
into half,
stored under refrigeration at 4 °C until processing. The apples were washed,
and the seeds were removed with a knife. Later, the flesh was cut into small pieces and squeezed with peeled, cut into half,
and the seeds were removed with a knife. Later, the flesh was cut into
a household juicer. The fruit juice was pressed with a fine-mesh nylon cloth (0.8 mm mesh) to avoid small pieces and squeezed
with
the a household
presence of solidsjuicer.
and The
seedsfruit
thatjuice
mightwas pressedwith
interfere withthe
a fine-mesh
CBCC process. nylonThe cloth (0.8 mmjuice
prepared mesh) wasto
avoid the presence
◦
then kept at 4 C until used. of solids and seeds that might interfere with the CBCC process. The prepared
juice was then kept at 4 °C until used.
2.4. CBCC Protocol
2.4. CBCC Protocol
The cryoconcentrate juice was obtained using a method previously described by Orellana-Palma
The where
et al. [17], cryoconcentrate juice(45was
fresh apple juice mL) obtained
was placedusing a method
in centrifugal plastic previously
tubes (internaldescribed
diameter, by
Orellana-Palma et al. [17], where fresh apple juice (45 mL) was placed
Di = 22 mm). Later, the samples were isolated with foamed polystyrene (8 mm thickness, thermal in centrifugal plastic tubes
(internal diameter,
conductivity K = 0.035 Di =W/mK)
22 mm). Later, to
in order theinduce
samples were freezing
an axial isolated front
with foamed
propagationpolystyrene
(from the (8 top
mm
tothickness,
bottom), thermal
and thus,conductivity
the tubes were K =frozen
0.035 atW/mK)
−20 ◦ Cin(overnight)
order to induce an axial
in a vertical staticfreezing
freezer (280,front
propagation (from the top to bottom), and thus, the tubes were frozen
M and S Consul, Sao Paulo, Brazil). Then, the frozen samples were transported to a centrifuge at −20 °C (overnight) in a
vertical
with a 50static
mL-tube freezer
rotor(280, M and S5430R,
(Eppendorf Consul, Sao Paulo,
Hamburg, Brazil).atThen,
Germany) 20 Cthe
◦ forfrozen
15 minsamples
at 4000 rpm were
transported to a centrifuge with a 50 mL-tube rotor (Eppendorf 5430R, Hamburg,
(1600 RCF). Hence, the centrifugation was used as assisted technique in the BCC separation process. Germany) at 20 °C
for 15 min at 4000 rpm (1600 RCF). Hence, the centrifugation was used as
The cryoconcentrated solution after the first cycle was used as the new solution for the second cycle andassisted technique in the
soBCC
on, separation
until obtaining process.
threeThe
CBCC cryoconcentrated
cycles as indicated solution after2.the
in Figure Forfirst
CBCC cycle was used
protocol threeas the new
replicates
solution for the second
and the mean values were reported.cycle and so on, until obtaining three CBCC cycles as indicated in Figure 2.
For CBCC protocol three replicates and the mean values were reported.Appl. Sci. 2020, 10, 959 4 of 17
Appl. Sci. 2020, 10, x 5 of 17
Figure 2. General
General centrifugal-assisted
centrifugal-assisted BCC
BCC protocol
protocol using three consecutive cycles.
2.5. Physicochemical
2.5. Physicochemical Analysis
Analysis
The total
total soluble
soluble solid
solid content
content (TSSC, ◦ Brix) was analyzed with a digital refractometer (PAL-1,
(TSSC, °Brix)
The was analyzed with a digital refractometer (PAL-1,
Atago Inc., Tokyo, Japan). The pH was determined
Atago Inc., Tokyo, Japan). The pH was determined using using aa digital
digital pHpH meter
meter (Hanna
(Hanna model
model HI HI 2221,
2221,
Woonsocket, RI, USA). The total titratable acidity (TTA) was estimated
Woonsocket, RI, USA). The total titratable acidity (TTA) was estimated by titration with sodium by titration with sodium
hydroxide (0.1
hydroxide (0.1N) N)and
andexpressed
expressediningramsgrams of of malic
malic acidacid
perper
literliter (g malic
(g malic acid/L).
acid/L). The The density
density (ρ) was (%)
was obtained by using the method previously proposed by Tansakul
obtained by using the method previously proposed by Tansakul et al. [21]. The color values were et al. [21]. The color values
were measured
measured with with a spectrophotometer
a spectrophotometer (Konica(Konica Minolta
Minolta CM-5,CM-5,
Osaka,Osaka, Japan)
Japan) (D65 (D65 illuminant
illuminant andand2°
◦
2 observer),
observer), in in CIELab
CIELab space
space terms,
terms, i.e.,
i.e., thethe L*L*(lightness),
(lightness),a*a*(ranging
(rangingfromfromgreengreentotored),
red), and
and b* b*
(ranging from blue to yellow) parameters were determined. From CIELab
(ranging from blue to yellow) parameters were determined. From CIELab values, Hue angle (h*ab values, Hue angle (h* ),
ab),
chroma (C*
chroma (C*ab
ab),), and
and total
total color
color difference
difference (ΔE*, (∆E*, difference
difference between
between the the fresh
fresh juice
juice and
and concentrated
concentrated
samples) were obtained using Equations (1), (2), and (3), respectively. Physicochemical
samples) were obtained using Equations (1), (2), and (3), respectively. Physicochemical analysis were analysis were
performed for the initial solution (C ) and each concentrated (C ) fraction obtained
performed for the initial solution (C00) and each concentrated (Css) fraction obtained along the cycles. along the cycles.
All ◦ C).
All determinations
determinations were were completed
completed in in triplicate
triplicate at at ambient
ambient temperature
temperature (≈22 (≈22 °C).
a
∗ a
hh∗abab =
= arctg
arctg(b) (1)
(1)
b
∗ q 2 + b 2 ) (2)
Cab = √(a
∗
Cab = a2 + b2 (2)
∆E ∗ = √(∆L)2 + (∆a)2 + (∆b)2 (3)
q
∆E∗ = (∆L)2 + (∆a)2 + (∆b)2 (3)
2.6. Bioactive Compounds (BC) Determination
2.6. Bioactive Compounds (BC) Determination
The total polyphenol content (TPC), total flavonoid content (TFC) and total flavanols content
(TFLC)Theoftotal
fresh juice and content
polyphenol samples(TPC),
were total
measured in order
flavonoid to (TFC)
content determine the changes
and total flavanolson these
content
through
(TFLC) ofthe CBCC
fresh juicecycles.
and samples were measured in order to determine the changes on these through
TPC cycles.
the CBCC was evaluated colorimetrically by the Folin–Ciocalteau assay according to the
methodology
TPC was proposed
evaluated by Singleton et al.
colorimetrically by[22], with modifications.
the Folin–Ciocalteau A total
assay of 100toμL
according theofmethodology
sample was
mixed
proposedwithby100 μL of 10-fold
Singleton diluted
et al. [22], Folin–Ciocalteu
with modifications.reagent
A totaland 300µL
of 100 μLofofsample
5% (w/v) Namixed
was 2CO3. After
with
90 min in the dark at room temperature (incubation), the absorbance was measured at 760 nm. Gallic
acid was used as standard and the results were expressed as mg gallic acid equivalents (GAE) per
100 g of dry matter (mg GAE/100 g d.m.).Appl. Sci. 2020, 10, 959 5 of 17
100 µL of 10-fold diluted Folin–Ciocalteu reagent and 300 µL of 5% (w/v) Na2 CO3 . After 90 min in the
dark at room temperature (incubation), the absorbance was measured at 760 nm. Gallic acid was used
as standard and the results were expressed as mg gallic acid equivalents (GAE) per 100 g of dry matter
(mg GAE/100 g d.m.).
TFC was measured by the aluminum chloride colorimetric method described by Paz et al. [23],
with modifications. 250 µL of sample, 1000 µL of distilled water and 75 µL of 5% (w/v) NaNO2 were
mixed. After 6 min (incubation), 75 µL of 10% (w/v) AlCl3 , 500 µL of NaOH (1 M), and 600 µL of
distilled water were added and the absorbance was measured at 510 nm. Catequin was used as
standard and TFC results were expressed as mg catechin equivalents (CEQ) per 100 g of dry matter
(mg GAE/100 g d.m.).
TFLC was estimated according to the vanillin–HCl method proposed by Broadhurst and Jones [24],
with some modifications. A total of 0.2 mL of sample was added to 1.5 mL of vanillin reagent and 0.8 mL
of 1% (w/v) HCl, and the mixture was vortexed for 10 min. After 15 min (incubation), the absorbance
was measured at 500 nm. Catequin was used as standard and TFLC results were expressed as mg
catechin equivalents (CEQ) per 100 g of dry matter (mg GAE/100 g d.m.).
All bioactive compounds measurements were determined using a T70 UV–VIS spectrophotometer
(Oasis Scientific Inc., USA) in triplicate at 25 ◦ C.
2.7. Total Bioactive Compound (TBC) Retention
The TBC retention indicates the total bioactive compound percentage in the concentrated fraction
respect to the initial sample (fresh apple juice). The retention was determined at each cycle using
Equation (4) [17]: !
C0 BCs
TBC retention (%) = x x100% (4)
Cs BC0
where C0 is the initial TSSC (◦ Brix), Cs is the concentration of TSSC (◦ Brix) at each cycle, BCs is the
TBC at each cycle, and BC0 is the initial TBC.
2.8. Antioxidant Activity Determination
2.8.1. DPPH
A DPPH (2,2-diphenyl-1-picrylhydrazyl) free radical scavenging assay was performed as described
by Thaipong et al. [25], with some modifications. 150 µL of sample was mixed with 2850 µL of 10 mg/L
DPPH methanolic solution. After 35 min in the dark at room temperature (incubation), the absorbance
was measured at 515 nm on a spectrophotometer (T70 UV–VIS spectrophotometer, Oasis Scientific Inc.,
Greenville, SC, USA). Trolox was used as standard, and the results were calculated and expressed as
micromoles of Trolox equivalents (TE) per 100 g of dry matter (mg TE/100 g d.m.). All analyses were
performed in triplicate at 25 ◦ C.
2.8.2. FRAP
A FRAP (ferric reducing antioxidant power) assay was determined following the method reported
by Benzie and Strain [26], with modifications. A total of 300 µL of sample was mixed with 2250 µL of
FRAP reagent. Then, the mixture was kept in the dark at room temperature for 35 min (incubation).
The absorbance was measured at 593 nm on a spectrophotometer (T70 UV–VIS spectrophotometer,
Oasis Scientific Inc., USA). Trolox was used as standard, and the results were calculated and expressed
as micromoles of Trolox equivalents (TE) per 100 g of dry matter (mg TE/100 g d.m.). All analyses were
performed in triplicate at 25 ◦ C.Appl. Sci. 2020, 10, 959 6 of 17
2.9. Identification and Quantification of Volatile Compounds
Volatile profiles of each sample (fruit juice and cycles) were acquired using headspace vials.
This determination was developed through the technique of solid phase microextraction (SPME), with
a gas chromatograph-flame ionization detector (GC-FID).
A total of 8 mL of sample were inserted into headspace vials and sealed with a PTFE-faced
silicone septum (Supelco, Bellefonte, PA, USA). Afterwards, the samples were warmed up for 30 min at
60 ◦ C in a thermoblock (2050-ICE, Paris, France). These conditions allow to equilibrate the headspace
and SPME fiber. A fiber carboxen/polydimethylsiloxane (85 µm, Car/PDMS, Supelco, Bellefonte, PA,
USA) adsorbed the volatile compounds, which were injected in the GC (Perkin-Elmer, Clarus 680,
Shelton, CT, USA). A DB-624 capillary column (Length: 60 m, id: 0.25 mm, film thickness: 1.8 µm,
J&W Scientific, Folsom, CA, USA) was used to separate the compounds. The carrier gas employed was
nitrogen at a 1.2 mL/min speed rate.
The samples in the SPME fiber were inserted in the port, with the purge valve off (splitless
mode). Thus, in the first 5 min, the temperature was maintained at 50 ◦ C. Later, the temperature was
increased by 4 ◦ C/min until reaching 98 ◦ C. Next, three gradients at 4 ◦ C/min were applied, until
reaching 130 ◦ C, 150 ◦ C, and 230 ◦ C, respectively. The time of the temperature process was equivalent
to 50 min. The retention time, authentic standards and the Kováts Index (KI) allowed to identify each
volatile compounds.
Three replicates of each sample were reported, with the mean and standard deviation values,
and the percentage of area.
2.10. Process Parameters
2.10.1. Efficiency Process (Eff)
Eff is defined as the increase in the concentration of the solution relative to the quantity of solids
remaining in the frozen fraction and it was calculated according to Equation (5) [27]:
Cs − Ci
Eff(%) = x100% (5)
Cs
where Cs and Ci are the concentration (TSSC, ◦ Brix) in the cryoconcentrate and ice fractions, respectively.
2.10.2. Percentage of Concentrate (PC)
PC represents the evolution of the solution removal from the frozen phase and it was calculated
according to Equation (6) [13]:
W0 − Wi
PC = x100% (6)
W0
where W0 and Wi are the initial and final weight of the frozen fraction, respectively.
2.10.3. Solute Yield (Y)
Y represents the relationship between the mass of solute in the concentrated fraction and in the
initial sample. Y was determined with Equation (7) [17]:
ms
Y = (7)
m0
where ms and m0 are the solute mass in the concentrated solution and the initial solute mass, respectively.
2.11. Sensory Analysis
A sensory evaluation was performed by 21-member trained panelists to measure the degree of
acceptance or rejection of samples. Specifically, the odor, aroma, flavor, and global assessment wereAppl. Sci. 2020, 10, 959 7 of 17
evaluated according to a five-score hedonic scale: 5 = Like very much; 4 = Like moderately; 3 = Indifferent;
2 = Dislike moderately; 1 = Dislike very much. Thus, this sensory evaluation was used to verify if the
reconstituted cryoconcentrate sample (3rd cycle) has significant differences with the fresh juice, in hedonic
scale terms. After each CBCC cycle, the cryoconcentrate samples were reconstituted with the addition of
distilled water until to obtain a similar TSSC value than the fresh apple juice (≈14 ◦ Brix). The samples were
evaluated at room temperature and numbered with three digits at random.
2.12. Stadistical Analysis
Data were analyzed using analysis of variance (ANOVA) with Statgraphics Centurion software
(Version XVI, StatPoint Technologies Inc., Warrenton, VA, USA). Differences between the mean values
were established by Student’s t-test and the least significant difference (LSD) at 5%.
3. Results and Discussion
3.1. Physicochemical Analysis
The results from the physicochemical analysis are summarized in Table 1. Firstly, the TSSC
increased gradually compared with the fresh sample (≈14 ◦ Brix), with 31, 45, and 55 ◦ Brix along the
cycles. The TSSC at each cycle were superior to those obtained in previous studies under comparable
conditions in our laboratory with fruit juices such as orange juice [14], pineapple juice [20], and blueberry
juice [28], in which the final concentration values were approximately 40, 36, and 33 ◦ Brix at the
third cycle, respectively. Similarly, the TSSC results were higher than those reported by Sánchez et
al. [29], Moreno et al. [30], Zielinski et al. [31] and Ding et al. [32], in which orange juice, coffee extract,
and apple juice were cryoconcentrated by falling-film (FFCC), BCC, and SCC, respectively. Despite the
values in our study, SCC, FFCC, and PCC have more advanced technological development than BCC.
So, future studies could focus on block cryoconcentration at semi-industrial scale or pilot-plant scale.
Table 1. Physicochemical properties of apple fresh juice and cryoconcentrated samples at each cycle1 .
CBCC CBCC CBCC
Fresh Juice
Cycle 1 Cycle 2 Cycle 3
TSSC (◦ Brix) 13.9 ± 1.0d 31.4 ± 1.9c 44.7 ± 1.7b 54.9 ± 0.7a
pH 3.5 ± 0.0a 3.4 ± 0.0b 3.3 ± 0.0c 3.1 ± 0.0d
TTA (g malic acid/L) 2.3 ± 0.0d 2.5 ± 0.0c 2.8 ± 0.0b 3.0 ± 0.1a
ρ (g/mL) 1.1 ± 0.0d 1.2 ± 0.0c 1.4 ± 0.0b 1.5 ± 0.0a
Color
L* 78.1 ± 1.3a 76.9 ± 3.0a 68.1 ± 1.9b 68.4 ± 0.4b
a* 3.9 ± 0.2c 6.1 ± 1.6b 10.9 ± 0.9a 11.0 ± 0.6a
b* 27.7 ± 0.4c 38.9 ± 4.7b 41.1 ± 2.2a 43.5 ± 3.7a
∆E* - 11.6 ± 0.2c 17.2 ± 0.1b 25.0 ± 0.0a
1 Within each row, a, b, c, d when there are no significant differences (p ≤ 0.05), are identified by the same superscript
letter, according to a LSD test.
In addition, the results reflected an increase over 2.3, 3.2, and 4.0 times, in concentration index (CI,
ratio Cs /C0 ) terms, from the first to the third cycle, respectively. Therefore, the difference in the TSSC
results could be assigned to the sized tubes that contained the liquid samples. Concretely, in our studies,
we used a 50 mL-tube (45 mL sample). Besides, the temperature used, i.e., −20 ◦ C allows a moderate
freezing propagation on the samples. Thus, these three conditions promote a better movement of the
solids in the freezing step and favors the separation of solutes from the ice fraction during thawing [17].
The solutes occluded in the ice phase (Ci ) presented values close to 6, 10, and 15 ◦ Brix as the CBCC cycles
progressed (data not shown). Thus, in CI terms, the Cs presented an increase of 0.4, 0.7, and 1.1 times
with regard to the first, second, and third cycle, respectively. This behavior could be comparable
with CBCC studies applied to orange juice [19] and blueberry juice [28]. However, the Ci results
were better (purest ice samples) than those reported by Petzold et al. [28] in the cryoconcentration ofAppl.
Appl. Sci.
Sci. 2020,
2020, 10,
10, x959 98 of
of 17
17
which allow for a clear difference with the natural color of the fresh juice (Figure 3). The total color
commercial(ΔE*)
difference juice between
due to that natural
fresh juiceapple
with juice
each has no added additional
cryoconcentrated samples components (preservatives,
can be estimated as not
stabilizers, and dyes) and/or any previous treatment carried out, such as
noticeable (ΔE* ≤ 3) and well visible (ΔE* ≥ 3) according to the human visual discrimination in the commercial juice
produced.[35].
threshold An important point is that the ice fraction can be frozen again, and then centrifugation or
otherForexternal force
the first applied
cycle, to separate
the ΔE* values the
wereCs over
fromeleven
the Ci , CIELab
as recently reported
units, and inbythe Orellana-Palma
final cycle, ΔE*et
al. [19] to recover as much cryoconcentrate as possible.
reached a value of twenty-five CIELab units. Therefore, all cryoconcentrate samples showed visual
The pHwith
differences andfresh
TTA were
juice.changed significantly
These values confirm(pthat≤ 0.05)
CBCC along CBCC
process cycles compared
intensifies to the
the natural fresh
color of
sample. Specifically, an opposite
fresh juice, in CIELab values terms. effect was observed for pH and TTA. This inverse behavior could
be attributed to the high content of organic acids in the samples, mainly malic acid. A comparable
phenomenon was describedproperties
Table 1. Physicochemical by Khajehei et al.fresh
of apple [33] juice
in pomegranate juice. samples at each cycle1.
and cryoconcentrated
The density (ρ) increased as the solutes increased at each cycle. Thus, an increment close to 36.4%
CBCC CBCC CBCC
in relation to fresh apple juice was reached Fresh Juice
in the last cycle. These experimental behaviors were in
Cycle 1 Cycle 2 Cycle 3
concordance with previous data for orange juice d[19] and pineapple juice [20] under cryoconcentration.
TSSC (°Brix) 13.9 ± 1.0 31.4 ± 1.9c 44.7 ± 1.7b 54.9 ± 0.7a
The CIELab colorimetric space was used ato characterize the change in color during the CBCC
pH 3.5 ± 0.0 3.4 ± 0.0b 3.3 ± 0.0c 3.1 ± 0.0d
cycles between the fresh juice and cryoconcentrates. The samples showed significant changes in the L*,
TTA (g malic acid/L) 2.3 ± 0.0d 2.5 ± 0.0c 2.8 ± 0.0b 3.0 ± 0.1a
a*, and b* values after the applied CBCC technique. In particular, the initial L* value decreased at each
ρ (g/mL) 1.1 ± 0.0d 1.2 ± 0.0c 1.4 ± 0.0b 1.5 ± 0.0a
cycle, which indicated that concentrate samples were darker than the initial juice. The darkening is due
Color
to the increase in TSSC cycle by cycle, which also generates the increase of bioactive compounds [15].
L* 78.1 ± 1.3a 76.9 ± 3.0a 68.1 ± 1.9b 68.4 ± 0.4b
Furthermore, these results are in agreement with different cryoconcentrated liquid samples [19,28,34].
a* 3.9 ± 0.2c 6.1 ± 1.6b 10.9 ± 0.9a 11.0 ± 0.6a
For a* and b*, the values increased as the number of cycles increased. This trend indicates a slight
b* 27.7 ± 0.4c 38.9 ± 4.7b 41.1 ± 2.2a 43.5 ± 3.7a
deviation towards the red color (a*) and a large increase in the cyellow colorb(b*), which allow for a clear
ΔE* - 11.6 ± 0.2 17.2 ± 0.1 25.0 ± 0.0a
difference with the natural color of the fresh juice (Figure 3). The total color difference (∆E*) between
1 Within each row, a, b, c, d when there are no significant differences (p ≤ 0.05), are identified by the
fresh juice with each cryoconcentrated samples can be estimated as not noticeable (∆E* ≤ 3) and well
same superscript letter, according to a LSD test.
visible (∆E* ≥ 3) according to the human visual discrimination threshold [35].
(a) (b)
Figure
Figure 3.
3. Samples
Samples of
of apple
apple juice:
juice: (a)
(a) fresh
fresh juice;
juice; (b)
(b) cryoconcentrated
cryoconcentrated sample
sample (3rd
(3rd cycle).
cycle).
3.2. Bioactive
For the Compound the ∆E*and
first cycle,Content Antioxidant
values were overActivity CIELab units, and in the final cycle, ∆E*
Determinations
eleven
reached a value of twenty-five CIELab units. Therefore, all cryoconcentrate samples showed visual
The fresh apple juice had TPC, TFC and TFLC values (Table 2) of approximately 244 mg
differences with fresh juice. These values confirm that CBCC process intensifies the natural color of
GAE/100 g d.m., 82 mg CEQ/100 g d.m., and 124 mg CEQ/100 g d.m., respectively, which were
fresh juice, in CIELab values terms.
significantly higher than those previously informed by Sun et al. [36]. The difference in results could
be
3.2.explained by factors,Content
Bioactive Compound such asand
type of harvesting,
Antioxidant ripening
Activity stage, climatic conditions in the fresh
Determinations
fruits, and/or specific methods used during juice preparation [37].
Theeach
At freshCBCC
applecycle,
juice had TPC, TFC
the results and TFLC
increased values (Table
significantly (p ≤2)0.05)
of approximately 244 mgcompounds
when the bioactive GAE/100 g
d.m., 82 mg CEQ/100 g d.m., and 124 mg CEQ/100 g d.m., respectively, which were
content were compared to the fresh apple juice, and in the final cycle, the concentrates samples significantly higher
than thosevalues
exhibited previously informed
close to 819 mg by Sun et gal.d.m.,
GAE/100 [36].248
Themgdifference
CEQ/100ing results could
d.m., and 345bemgexplained
CEQ/100by g
factors, such as type of harvesting, ripening stage, climatic conditions in the
d.m. for TPC, TFC, and TFLC, respectively. Hence, the cryoconcentrated samples presented fresh fruits, and/or specific
an
methodsup
increase used during
to 3.4 juice
(TPC), 3.0preparation [37].
(TFC), and 2.8 (TFLC) times compared to the initial value. This tendency
has been observed with liquid samples such as orange juice [14], strawberry juice [15], blueberryAppl. Sci. 2020, 10, 959 9 of 17
Table 2. Bioactive compounds content and TBC retention (%) of fresh juice and cryoconcentrate samples
at each cycle1 .
Cryoconcentration
Fresh Apple Juice
Cycle 1 Cycle 2 Cycle 3
Bioactive compound content
TPC (mg GAE/100 g d.m.) 244.3 ± 17.0d 364.8 ± 29.0c 606.3 ± 41.9b 818.9 ± 33.0a
TPC retention, % - 66.1 77.2 84.9
TFC (mg CEQ/100 g d.m.) 81.5 ± 12.2d 115.6 ± 4.5c 185.5 ± 13.1b 247.8 ± 17.2a
TFC retention, % - 62.8 70.8 77.0
TFLC (mg CEQ/100 g d.m.) 123.8 ± 6.1d 169.8 ± 10.0c 255.1 ± 16.3b 344.9 ± 20.0a
TFLC retention, % - 60.7 64.1 70.5
Antioxidant activity
DPPH (µmol TE/100 g d.m.) 522.5 ± 44.9d 1039.6 ± 43.4c 1315.7 ± 14.5b 1803.2 ± 25.5a
FRAP (µmol TE/100 g d.m.) 467.1 ± 27.2d 1277.4 ± 121.5c 1635.8 ± 78.4b 2935.5 ± 198.3a
1 Within each row, a, b, c, dwhen there are no significant differences (p ≤ 0.05), are identified by the same superscript
letter, according to a LSD test”.
At each CBCC cycle, the results increased significantly (p ≤ 0.05) when the bioactive compounds
content were compared to the fresh apple juice, and in the final cycle, the concentrates samples exhibited
values close to 819 mg GAE/100 g d.m., 248 mg CEQ/100 g d.m., and 345 mg CEQ/100 g d.m. for TPC,
TFC, and TFLC, respectively. Hence, the cryoconcentrated samples presented an increase up to 3.4
(TPC), 3.0 (TFC), and 2.8 (TFLC) times compared to the initial value. This tendency has been observed
with liquid samples such as orange juice [14], strawberry juice [15], blueberry juice [17], pineapple
juice [19], yerba mate [38], and coffee extract [39] obtained by the various CC techniques.
Similarly, from the TBC results, the retention was calculated at each cycle. From the first cycle,
the TBC retention was more than 60%, which allows highlighting the potential advantage, in TBC
retention terms, of cryoconcentration as non-thermal concentration technology. Specifically, the TBC
retention was approximately 66%, 77%, and 85% for TPC, 63%, 71%, and 77% for TFC, and 61%,
64%, and 71% for TFLC along the cycles. Orellana-Palma et al. [17,19] and Correa et al. [39]
presented comparable values for fruit juices with CBCC and aqueous coffee extract with FFCC.
Specifically, the studies informed TBC retention values from 70% to 95% and 90%, respectively.
Thus, TBC retention shows the beneficial CBCC effects to obtain a liquid fraction with high TSSC values
and attractive color and, in addition, this emerging technology allows the preservation of important
thermolabile bioactive compounds in the final cryoconcentrate.
In antioxidant activity terms, the DPPH and FRAP assays showed a value close to 523 µmol
TE/100 g d.m. and 467 µmol TE/100 g d.m for the fresh apple juice, respectively, which was higher
than previously reported by Silva et al. [40]. The variation could be related to the growth conditions
of apple fruits and the methodology used to obtain the fresh juice, which, in turn, influences the
anthocyanins content (main contributors in antioxidant capacity) [41]. Thus, the values exhibited an
increasing with significant differences (p ≤ 0.05) as the cycles progressed. CBCC presented values of
approximately 1040 µmol TE/100 g d.m., and 1277 µmol TE/100 g d.m. (1st cycle) to 1803 µmol TE/100 g
d.m. and 2936 µmol TE/100 g d.m. (3rd cycle) for DPPH and FRAP, respectively. As mentioned above,
this behavior could be associated with the use of low temperatures in CBCC to concentrate bioactive
compounds, since the damage to the sensitive components is minimal and, therefore, this process
allows a higher anthocyanin concentration than other concentration technologies. A similar trend was
observed by Correa et al. [39] and Silva et al. [40] during the freeze concentration of coffee extract and
apple juice, respectively.
3.3. Profile of Volatile Compounds
A total of twenty-eight volatile molecules were identified in fresh apple juice (Table 3).
These compounds recognized were similar to those found in other studies for different apple juiceAppl. Sci. 2020, 10, 959 10 of 17
varieties [42–44], which indicates that several factors affect the production and amount of volatile
compounds in a fruit juice, such as harvest, juice extraction, and/or industrial steps, among others.
The fresh juice presented fourteen esters, eight alcohols, four aldehydes and two ketones.
Specifically, four esters (propanoate, 3-methylbutyl acetate, 2-methyl butyl acetate, ethyl pentanoate)
exhibited higher
Appl. Sci. 2020, 10, x concentration than other compounds (Figure 4). These results corroborate 11 that
of 17
esters are the main volatile compounds in apple that contribute to its characteristic fruity aroma [45].
In addition,
fruity aromain[45].
both In
fresh juice and
addition, in cryoconcentrated samples,
both fresh juice and sixteen volatilesamples,
cryoconcentrated molecules are unknown
sixteen volatile
since no reliable
molecules matching
are unknown wasno
since performed with previous
reliable matching studies. with previous studies.
was performed
Figure 4. Volatile
Volatile compounds profile of fresh apple juice.
A lower
loweramount
amountofofvolatile
volatilecompounds
compounds in the all cycles
in the all cyclesthan than
freshfresh
juice wasjuicedetected after CBCC,
was detected after
which
CBCC,can whichbe attributed to the volatilization
can be attributed of components
to the volatilization through through
of components repeatedrepeated
freezing and thawing
freezing and
operations (Figure S1,
thawing operations see Supplemental
(Figure Materials).
S1, see Supplemental However,However,
Materials). as cycles as progressed, the aromatic
cycles progressed, the
profile
aromaticwas increased,
profile with 18, 22,with
was increased, and18,29 compounds in the first, in
22, and 29 compounds second, andsecond,
the first, third cycle,
and respectively.
third cycle,
The increase inThe
respectively. volatile components
increase could
in volatile be due to the
components highbe
could concentration
due to the of eachconcentration
high component (reflected
of each
in TSSC) cycle-by-cycle,
component (reflected in which
TSSC) can be detected which
cycle-by-cycle, by the chromatograph.
can be detected by This theeffect is consistent with
chromatograph. This
observed by Picconewith
effect is consistent et al. observed
[46] in coffee
by beverages,
Piccone etindicating
al. [46] inthat the concentration
coffee beverages, indicatingof sugars that
(suchtheas
sucrose, glucose, and fructose) positively affects the release of volatiles
concentration of sugars (such as sucrose, glucose, and fructose) positively affects the release of in the headspace. The volatile
compounds
volatiles in concentrated
the headspace. by BCCTheare showedcompounds
volatile in the chromatograms.
concentrated Theseby results
BCC were consistent
are showed inwith
the
those found by Moreno
chromatograms. These etresults
al. [27], were
Bonilla-Zavaleta
consistent etwith al. [47], Gunathilake
those found by et al. [48], and
Moreno etMiyawaki
al. [27],
et al. [49] for coffee
Bonilla-Zavaleta extract,
et al. [47], pineapple
Gunathilake juice,
et al.pear juice,
[48], andand apple juice
Miyawaki et al.obtained
[49] forbycoffee
different CC
extract,
techniques,
pineapple juice,respectively.
pear juice, and apple juice obtained by different CC techniques, respectively.
In general,
general,the theCBCCCBCC effect on volatile
effect compounds
on volatile compounds was varied,was since
varied,some components
since increasing
some components
and others decreasing
increasing and othersindecreasing
each cycle. Maoin eachet al.cycle.
[43] mentioned
Mao et al. that[43]
the volatile
mentioned compounds
that thevariation
volatile
in a concentrate
compounds juice in
variation regard to the fresh
a concentrate juicejuice
regard is due
to the to fresh
a synergistic
juice is dueeffect to between the esters
a synergistic effect
(high concentration) with other compounds, resulting in an increases
between the esters (high concentration) with other compounds, resulting in an increases on other on other volatile compounds
concentration,
volatile compounds and thus, these can be
concentration, andidentifiable
thus, theseby canthebechromatograph.
identifiable by the Thischromatograph.
coincided withThis our
results,
coincided since
with among for all the
our results, samples
since among there
for was a decrease
all the samplesorthere increase
wasinacomponents,
decrease or such increaseas the
in
appearance
components,components,
such as thethat are not identified
appearance components, in otherthatcycles
are notor fresh juice. in
identified Therefore, CBCCorallows
other cycles fresh
recovering certain
juice. Therefore, components
CBCC that are incertain
allows recovering low concentration
components in theare
that fresh juice.concentration
in low Furthermore, in this
the
technique demonstrated that some volatile compounds were remained
fresh juice. Furthermore, this technique demonstrated that some volatile compounds were remained in the cryoconcentrated sample.
According to the results,sample.
in the cryoconcentrated future studies
According could tobethefocused
results,onfuturethe particular
studies could identification
be focused of certain
on the
volatile
particularcomponents
identificationin different
of certaincryoconcentrated
volatile components food in liquids.
different cryoconcentrated food liquids.Appl. Sci. 2020, 10, 959 11 of 17
Table 3. Volatile profile of fresh juice and cryoconcentrated samples at each cycle1 .
RT4
Compound3 KI5 Fresh Juice CBCC Cycle 1 CBCC Cycle 2 CBCC Cycle 3
No2 (min)
Area ± DS6 Area7 Area ± DS6 Area7 Area ± DS6 Area7 Area ± DS6 Area7
(µV·s) (%) (µV·s) (%) (µV·s) (%) (µV·s) (%)
1 NI 6.724 - 282830.0 ± 102706.3 0.01 318078.0 ± 127061.1 0.02 343100.0 ± 202337.3 0.03
2 NI 7.401 79843.7 ± 14999.8 0.01 - - -
3 2-Propanol 7.970 541 297065.3 ± 72216.7 0.04 26522226.0 ± 243313.7 0.88 44308240.0 ± 2419159.8 1.11 2795932.0 ± 778665.7 0.27
4 NI 9.285 568 86606.7 ± 4348.5 0.01 - - -
5 Butanal 10.721 603 899295.3 ± 467383.0 0.10 4323310.0 ± 580702.2 0.14 12829114.0 ± 673907.7 0.33 2938169.0 ± 690048.5 0.28
6 Ethyl acetate 11.876 637 217697.0 ± 107843.9 0.03 - 3638095.0 ± 356798.3 0.09 -
7 2 Methyl-1- propanol 12.853 664 51488.3 ± 5197.4 0.01 665740.0 ± 126926.5 0.02 1830674.0 ± 183780.9 0.05 524879.3 ± 47988.2 0.05
8 1-Butanol 14.588 709 20481655.7 ± 361528.7 2.43 96660253.0 ± 1745979.4 3.40 195310887.0 ± 1996063.3 4.98 46142108.0 ± 4665844.3 4.39
9 Propyl acetate 15.673 734 1399590.0 ± 764702.1 0.17 - - 2622423.7 ± 1295829.1 0.25
10 2-Pentanone 15.816 746 671524.0 ± 14587.0 0.01 - - 354600.3 ± 304093.3 0.19
11 NI 16.361 758 57146.0 ± 11278.2 0.01 - - -
12 Ethyl 2-methyl propanoate 17.925 784 25673504.7 ± 919970.3 3.17 135434152.0 ± 7823690.3 4.68 275036482.0 ± 2859035.3 7.01 61557574.3 ± 4399046.7 5.87
13 2-Methyl butanol 18.611 799 293726.3 ± 226346.6 0.04 - 109469714.0 ± 30464924.4 2.79 3655384.7 ± 1424984.6 0.35
14 1-Pentanol 19.312 812 946200.3 ± 393295.3 0.12 5607103.0 ± 959253.5 0.19 15885328.0 ± 315675.8 0.50 3155739.3 ± 785815.3 0.30
15 2-Penten-1-ol 19.841 822 1307300.6 ± 152564.3 0.16 - - 769415.8 ± 58147.2 0.07
16 NI 19.915 826 - - - 61358.5 ± 8789.1 0.01
17 Methyl isopentanoate 20.003 829 - - - 84779.2 ± 13559.9 0.01
18 Ethyl butanoate 20.306 831 - 188154.0 ± 33997.0 0.01 - -
19 Propyl propanoate 20.701 838 265527334.3 ± 2211731.2 32.78 744949465.0 ± 11043397.5 24.56 927660144.0 ± 36874740.6 23.73 271190131.0 ± 10810605.6 25.74
20 Ethyl 3-methyl butanoate 22.509 872 - - 858797.0 ± 318410.1 0.02 387819.0 ± 141958.1 0.03
21 Ethyl 2-methyl butanoate 22.832 879 115971.0 ± 47112.6 0.01 - - 74396.0 ± 3335.7 0.01
22 Propyl isobutyrate 23.885 897 363829.0 ± 461296.3 0.03 6516629.0 ± 1550179.1 0.22 8901868.0 ± 1242428.9 0.23 1072184.0 ± 588990.5 0.10
23 3-Methylbutyl acetate 24.390 906 161453176.3 ± 7205273.7 19.93 299040619.0 ± 7574801.7 9.90 419808246.0 ± 28706962.8 10.70 150049001.3 ± 31966969.9 14.30
24 2-Methyl butyl acetate 24.594 909 113265346.3 ± 4841724.61 13.98 761197445.0 ± 19537256.3 25.20 754701538.0 ± 51802781.9 19.23 177007026.3 ± 56927390.8 16.77
25 Ethyl pentanoate 24.915 919 165161225.33 ± 3722692.8 20.53 809534184.0 ± 25344664.5 26.79 1046607079.0 ± 54059121.1 26.66 278107449.7 ± 33341609.1 26.44
26 1-Hexanol 25.325 921 10568683.0 ± 2696706.6 1.30 1015759.0 ± 159355.2 0.03 30848006.0 ± 4908217.2 0.79 14051512.3 ± 7343551.9 1.34
27 2-Heptanone 26.401 939 201229.0 ± 98152.8 0.28 5335595.0 ± 219869.2 0.18 5669031.0 ± 1660335.6 0.14 3932498.0 ± 2801013.5 0.38
28 2,4-Hexadienal 28.333 970 2981978.0 ± 934205.0 0.37 3575161.0 ± 250404.8 0.14 1074023.0 ± 353934.4 0.03 1974035.7 ± 1925044.1 0.19
29 1-Heptanol 28.649 975 - - - 89140.0 ± 17472.9 0.05
30 NI 30.152 1.001 - - - -
31 Ethyl hexanoate 31.498 1.024 281486.0 ± 57977.3 0.04 - - -
32 NI 32.117 1.030 - - - -
33 Octanal 32.791 1.049 31600971.7 ± 3572723.2 3.70 80883130.0 ± 709157.4 2.67 32316356.0 ± 4685213.8 0.91 18271366.7 ± 10206857.7 1.75
34 2-Ethyl-1-hexanol 34.606 1.083 580902.7 ± 277644.3 0.07 - - -
35 Pentyl butanoate 35.360 1.097 598638.7 ± 461256.6 0.07 - 3189589.0 ± 758448.3 0.08 431032.3 ± 361305.8 0.06
36 Nonanal 39.545 1.150 60112.6 ± 9852.2 0.01 - - 81955.3 ± 9122.6 0.01
37 Heptanoic acid 41.207 1.170 - 195623.1 ± 175114.1 0.01 - -
38 Benzyl acetate 44.348 1.213 80022.0 ± 11152.2 0.01 - - 85308.7 ± 16928.7 0.01
39 Methyl nonanoate 48.928 1.256 - - - 70145.7 ± 8071.2 0.01
40 Octanoic acid 50.263 1.263 - - 264806.0 ± 18648.2 0.01 -Appl. Sci. 2020, 10, 959 12 of 17
Table 3. Cont.
RT4
Compound3 KI5 Fresh Juice CBCC Cycle 1 CBCC Cycle 2 CBCC Cycle 3
No2 (min)
Area ± DS6 Area7 Area ± DS6 Area7 Area ± DS6 Area7 Area ± DS6 Area7
(µV·s) (%) (µV·s) (%) (µV·s) (%) (µV·s) (%)
41 NI 51.915 1.284 - - - 89854.3 ± 40343.6 0.01
42 NI 54.328 1.300 - - - 59558.8 ± 7154.4 0.01
43 2,4-Decadienal 56.586 1.392 - - 152347.5 ± 33258.4 0.01 -
44 NI 57.536 1.412 - - - 110933.3 ± 32305.7 0.01
45 NI 58.701 1.419 - - - -
46 NI 59.187 1.425 - - - -
47 NI 59.543 1.437 - - - -
48 Ethyl decanoate 60.595 1.442 3909910.0 ± 2829238.5 0.49 25309997.0 ± 1427639.1 0.78 17520119.0 ± 1762721.8 0.50 6322302.5 ± 427412.8 0.60
49 NI 62.819 1.501 - - - 98941.0 ± 23746.7 0.01
50 Tetradecanoic acid 64.699 1.539 - - - 215383.0 ± 232813.3 0.02
51 NI 65.074 1.543 - - - -
52 NI 65.690 1.559 87066.3 ± 11890.7 0.01 - - 94033.0 ± 20933.8 0.01
53 Geranyl butyrate 67.627 1.598 294987.0 ± 33403.3 0.02 - - -
Total 809595513.2 100.0 3007237375.1 100.0 3908198561.5 100.0 1048871472.1 100.0
1Within each row, different letters are significantly different (p ≤ 0.05). 2 Number of peaks. 3 Already reported in Kheshti et al. [42], Mao et al. [43], Medina et al. [44], Perestrelo et al. [50],
López-Fructuoso and Echeverría-Cortada [51], and Zhu et al. [52]. 4 Retention time. 5 Kováts index calculated for DB-624 capillary column. 6 Mean of three replicates of the total ion
current (TIC) area of the gas chromatography-flame ionization detector (GC-FID) ± standard deviation. 7 Percentage of the TIC area. NI: unidentified.The PC increased significantly (p ≤ 0.05) at each cycle, with values of 74% (1st cycle), 80% (2nd
cycle) and 85% (3rd cycle). The results were significantly higher than the PC values obtained in our
laboratory with different liquid samples such as blueberry juice [17], orange juice [19], and
pineapple juice [28]. The different values are due to the apple has fewer components such as wastes,
Appl. Sci.and/or
shells 2020, 10,seeds
959 in the juice than other juices, which facilitates the separation of fractions. 13 of 17
The solute recovery was calculated as solute yield (Y), and in the first cycle, it reached a value
close to 0.79 kg solute per 1 kg initial (kg/kg). Later, Y showed a linear and significant increase, with
3.4. Process Parameters
values of ≈0.83 kg/kg and ≈0.86 kg/kg for the second and third CBCC cycle, respectively. The results
hadAs mentioned
a similar trendabove, the centrifugal
in previous force isinan
investigations excellent
liquid option
samples as an assisted
[13,14,40]. technique
This behavior in the
could be
BCC technology, since it improves the separation process. Figure 5 shows the efficiency
associated with the solute mass (ms) at each centrifugation step, since the solid-liquid interface (Eff), solute
yield (Y), and more
accumulates percentage of concentrate
mass due (PC) in
to the increase at the
each CBCC
solute cycle. [54].
content
(a) (b) (c)
Figure5.5.Process
Figure Processparameters:
parameters:(a)
(a)efficiency;
efficiency;(b)
(b)percentage
percentageofofconcentrate;
concentrate;(c)
(c)solute
soluteyield.
yield.
3.5. Initially,
Sensorialthe Analysis
Eff presented an 82%, 77%, and 73% from the first to the third CBCC cycle, respectively.
The results were
Figure 6 shows better,thein sensory
each cycle, than previous
evaluation studies
of fresh appleinjuice
our laboratory (with same
and reconstituted conditions),
cryoconcentrate
with values close to 58%, 70%, 72%, and 79% in the first cycle to pineapple
sample (3rd cycle). Results showed that cryoconcentration did not affect significantly (p ≥ 0.05) juice [28], sucrosethe
solution [13], blueberry juice [17], and orange juice [19], respectively. The decrease
odor, aroma, flavor, and global assessment of the reconstituted sample, in comparison to the fresh in Eff is due to the
increase in solutes
apple juice, (Cs ), that
although thereincrease the viscosity
is an apparent andscore
lower prevents a better
for the extraction of solutes
cryoconcentrated samples.from the
These
ice phase [53].
results were similar to studies on cryoconcentration applied to black currant juice [55], since the
The PC increased
cryoconcentrated juicesignificantly
was equivalent(p ≤ 0.05)
to theatfresh
each cycle,
sample with
for values
the sameof 74% (1st cycle),
qualities 80% in
analyzed (2nd
the
cycle)
present study. This advantage in the original characteristics preservation from the fresh sampleour
and 85% (3rd cycle). The results were significantly higher than the PC values obtained in has
laboratory with different
also been ratified liquidevaluation
by sensory samples such as blueberry
on color, juice [17],
aroma, taste, and orange juice [19],
total quality and pineapple
of cryoconcentrated
juice [28]. The different values
Andes berry pulp obtained by PCC [56]. are due to the apple has fewer components such as wastes, shells and/or
seeds In in the
the same
juice than other juices, which facilitates the separation of fractions.
way, the use of this concentration technology is advantageous from the sensory and
organoleptic viewpoint,was
The solute recovery notcalculated as solute
only in juices yieldpulps,
and fruit (Y), and inalso
but the first cycle, it reached
in infusions a value
as popular close
as coffee,
tosince
0.79 Moreno
kg soluteetper 1 kg initial (kg/kg). Later, Y showed a linear and significant increase,
al. [30] demonstrated a high retention in sensory qualities of coffee extract samples with values
of ≈0.83 kg/kg and ≈0.86 kg/kg for the second and third CBCC cycle, respectively. The results had a
similar trend in previous investigations in liquid samples [13,14,40]. This behavior could be associated
with
Appl.the
Sci. solute
2020, 10,mass
x; doi:(m s ) PEER
FOR at each centrifugation step, since the solid-liquid interface
REVIEW accumulates more
www.mdpi.com/journal/applsci
mass due to the increase in the solute content [54].
3.5. Sensorial Analysis
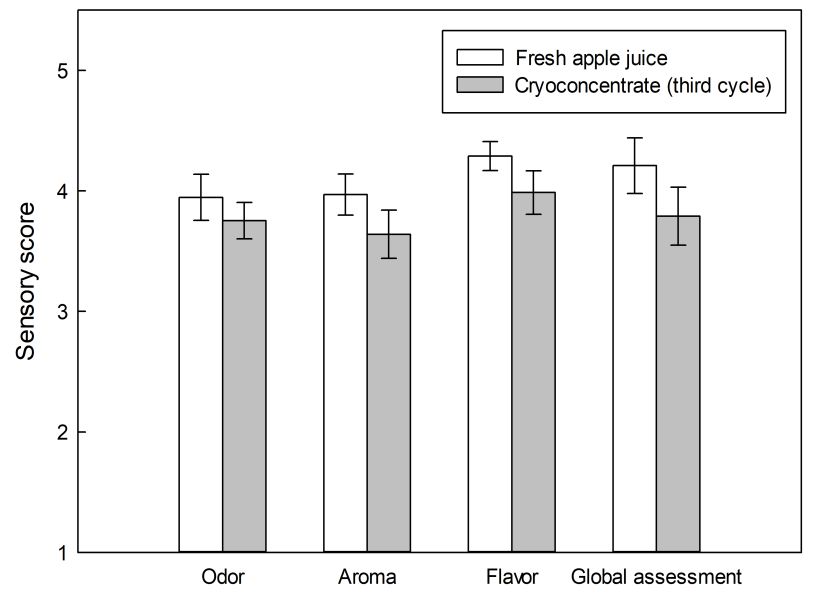
Figure 6 shows the sensory evaluation of fresh apple juice and reconstituted cryoconcentrate
sample (3rd cycle). Results showed that cryoconcentration did not affect significantly (p ≥ 0.05) the odor,
aroma, flavor, and global assessment of the reconstituted sample, in comparison to the fresh apple juice,
although there is an apparent lower score for the cryoconcentrated samples. These results were similar
to studies on cryoconcentration applied to black currant juice [55], since the cryoconcentrated juice was
equivalent to the fresh sample for the same qualities analyzed in the present study. This advantage
in the original characteristics preservation from the fresh sample has also been ratified by sensory
evaluation on color, aroma, taste, and total quality of cryoconcentrated Andes berry pulp obtained by
PCC [56].fruit juices, in particular for the retention of the fresh sensory characteristics [6].
Generally, the sensory evaluation results showed that samples treated with CBCC were less
appreciated than fresh apple juice, but there was no significant difference (p ≥ 0.05) between the
characteristics evaluated. Furthermore, the CBCC treatment had no negative effect on the odor,
aroma,
Appl. Sci. flavor,
2020, 10, and
959 global assessment. Therefore, the reconstituted cryoconcentrate is an excellent
14 of 17
option for studies on commercialization.
Figure 6.
Figure Sensoryevaluation
6. Sensory evaluationof
offresh
fresh juice
juice and
and cryoconcentrated
cryoconcentrated sample
sample (3rd
(3rd cycle).
cycle).
In the same way, the use of this concentration technology is advantageous from the sensory and
4. Conclusions
organoleptic viewpoint, not only in juices and fruit pulps, but also in infusions as popular as coffee,
sinceCBCC
Moreno is an
et effective combination to
al. [30] demonstrated concentrate
a high retention and
inextract
sensorysolids fromofancoffee
qualities ice matrix.
extractPrecisely,
samples
in the third cycle, the cryoconcentrate samples showed a high final solute concentration
subjected to PCC and FFCC. These results confirm the advantage of CBCC technique to concentrate (≈55 °Brix)
and lower luminosity (L* ≈ 68) than fresh juice, and total color difference
fruit juices, in particular for the retention of the fresh sensory characteristics [6]. (ΔE*) showed CIELab
values close to 25
Generally, theunits. Similarly,
sensory a highresults
evaluation bioactive compound
showed retention
that samples was achieved
treated with CBCC withwere
85% less
for
TPC, 77% for TFC and 71% for TFLC. In addition, the DPPH and FRAP assays showed
appreciated than fresh apple juice, but there was no significant difference (p ≥ 0.05) between the high levels of
antioxidant activity (523 μmol TE/100 g d.m. to 1803 μmol TE/100 g d.m., and 467
characteristics evaluated. Furthermore, the CBCC treatment had no negative effect on the odor, aroma,μmol TE/100 g d.m
to 2936and
flavor, μmol TE/100
global g d.m.). The
assessment. cryoconcentrated
Therefore, samplecryoconcentrate
the reconstituted (3rd cycle) showedis anaexcellent
similar number
option forof
volatile compounds related
studies on commercialization. to the fresh juice, with 29 and 28 volatile compounds, respectively. In
process parameter terms, the centrifugal force allowed excellent process parameters, with 73%, 0.87
(kg/kg), and 85% for efficiency, solute yield and percentage of concentrate, respectively, and the
4. Conclusions
sensory evaluation shows that the odor, aroma and flavor of fresh sample were remained in the
CBCC is an effective combination to concentrate and extract solids from an ice matrix.
cryoconcentrated samples, with good qualifications by the panelists. Therefore, CBCC is an
Precisely, in the third cycle, the cryoconcentrate samples showed a high final solute concentration
emerging and effective technology to preserve and enhanced important quality attributes, such as
(≈55 ◦ Brix) and lower luminosity (L* ≈ 68) than fresh juice, and total color difference (∆E*) showed
physicochemical properties, bioactive compounds, aromatic profile, antioxidant activity, and
CIELab values close to 25 units. Similarly, a high bioactive compound retention was achieved with
sensory properties from fresh apple juice.
85% for TPC, 77% for TFC and 71% for TFLC. In addition, the DPPH and FRAP assays showed high
levels of antioxidant
Supplementary activity
Materials: (523 µmol
The following areTE/100
availableg online
d.m. to 1803 µmol TE/100 g d.m.,
at www.mdpi.com/xxx/s1, Figureand
S1.467 µmol
Aromatic
TE/100 g d.m to 2936 µmol TE/100 g d.m.). The
profile at each CBCC cycle. (a) Cycle 1; (b) cycle 2; (c) cycle 3. cryoconcentrated sample (3rd cycle) showed a
similar number of volatile compounds related to the fresh juice, with 29 and 28 volatile compounds,
Author Contributions: Conceptualization: P.O.-P., E.H., and G.P.; methodology: P.O.-P., V.L.-M., and M.P.G.;
respectively. In process parameter terms, the centrifugal force allowed excellent process parameters,
software: M.P.G., E.H., R.N.Z., and G.P.; validation: P.O.-P., V.L.-M., and M.P.G.; formal analysis: P.O.-P.,
with 73%, 0.87 (kg/kg), and 85% for efficiency, solute yield and percentage of concentrate, respectively,
V.L.-M., and M.P.G.; investigation: P.O.-P., R.N.Z., E.H., and G.P.; resources: M.P.G., E.H., R.N.Z., and G.P.;
and curation:
data the sensory evaluation
P.O.-P., V.L.-M., shows
M.P.G., that
and the
G.P.;odor, aroma and flavor
writing—original of fresh sample
draft preparation: P.O.-P.,were
E.H.,remained
and G.P.;
in the cryoconcentrated
writing—review and editing: samples, withand
E.H., R.N.Z., good qualifications
G.P.; visualization: by the panelists.
P.O.-P., Therefore,
E.H., and G.P.; CBCC
supervision: is an
M.P.G.,
emerging and effective technology to preserve and enhanced important quality attributes,
E.H., R.N.Z., and G.P.; project administration: P.O.-P. and G.P.; funding acquisition: P.O.-P. and G.P. All such as
authors have read and
physicochemical agreed tobioactive
properties, the published version ofaromatic
compounds, the manuscript.
profile, antioxidant activity, and sensory
properties from fresh apple juice.
Funding: Patricio Orellana-Palma acknowledge the financial support of CONICYT-Chile (Comisión Nacional
de Investigación Científica y Tecnológica) through the FONDECYT Postdoctoral Grant 2019 (Folio 3190420).
Supplementary Materials: The following are available online at http://www.mdpi.com/2076-3417/10/3/959/s1,
Figure S1. Aromatic profile at each CBCC cycle. (a) Cycle 1; (b) cycle 2; (c) cycle 3.
Author Contributions: Conceptualization: P.O.-P., E.H., and G.P.; methodology: P.O.-P., V.L.-M., and M.P.G.;
software: M.P.G., E.H., R.N.Z., and G.P.; validation: P.O.-P., V.L.-M., and M.P.G.; formal analysis: P.O.-P., V.L.-M.,
and M.P.G.; investigation: P.O.-P., R.N.Z., E.H., and G.P.; resources: M.P.G., E.H., R.N.Z., and G.P.; data curation:
P.O.-P., V.L.-M., M.P.G., and G.P.; writing—original draft preparation: P.O.-P., E.H., and G.P.; writing—review and
editing: E.H., R.N.Z., and G.P.; visualization: P.O.-P., E.H., and G.P.; supervision: M.P.G., E.H., R.N.Z., and G.P.;You can also read