Study on browning mechanism of fresh cut eggplant (Solanum melongena L.) based on metabolomics, enzymatic assays and gene expression - Nature
←
→
Page content transcription
If your browser does not render page correctly, please read the page content below
www.nature.com/scientificreports
OPEN Study on browning mechanism
of fresh‑cut eggplant
(Solanum melongena L.) based
on metabolomics, enzymatic
assays and gene expression
Xiaohui Liu1,2,3,5, Aidong Zhang1,2,5, Jing Shang1,2,3, Zongwen Zhu2,3, Ye Li4, Xuexia Wu2,3* &
Dingshi Zha2,3*
Enzymatic browning is one of the crucial problems compromising the flavor and texture of fresh-
cut fruit and vegetables. In this study, an untargeted metabolomics approach based on liquid
chromatography-mass spectrometry (LC–MS) was used to explore the browning mechanism in
fresh-cut eggplant. Metabolomics studies showed that with the increase of fresh-cut time, the
contents of 946 metabolites changed dynamically. The metabolites having the same trend share
common metabolic pathways. As an important browning substrate, the content of chlorogenic acid
increased significantly, suggesting that may be more important to fresh-cut eggplant browning; all
119 common differential metabolites in 5 min/CK and 3 min/CK contrastive groups were mapped onto
31 KEGG pathways including phenylpropanol metabolism, glutathione metabolism pathway, et al. In
physiological experiments, results showed that the Phenylpropanoid-Metabolism-Related enzymes
(PAL, C4H, 4CL) were changed after fresh-cut treatment, the activities of three enzymes increased
first and then decreased, and reached the maximum value at 5 min, indicating the accumulation of
phenolic substances. At the same time, ROS were accumulated when plant tissue damaged by cutting,
the activities of related antioxidant enzymes (SOD, APX and CAT) changed dynamically after oxidative
damage. SOD and APX content increased significantly and reached the maximum value at 10 min after
cutting, and then showed a downward trend. However, CAT activity increased sharply and reached
the maximum value within 3 min after cutting, then maintained the same activity, and showed a
downward trend after 30 min. These data fully demonstrated that the activities of browning related
enzymes and gene expression increased with the prolonging of fresh cutting time. We explained
the browning mechanism of fresh-cut eggplant by combining metabolomics and physiology, which
may lay the foundation for better understanding the mechanism of browning during the fruits and
vegetables during processing.
Solanum melongena L. is commonly known as eggplant, and belongs to genus Solanum, which is one of the
largest genera within family Solanaceae with over 1550 s pecies1. It is a common vegetable, rich in polyphenols,
dietary fiber, vitamins and other nutrients; it provides a variety of health benefits such as lowering blood lipids,
protecting the liver, and as an antioxidant, and thus, it is favored by consumers2. However, browning of eggplant
occurs easily after peeling, which affects its sensory quality and nutritional value, leading to a decline in edibility
and reduced value as a commodity. Browning is the result of a series of physiological and biochemical processes
in fruits under aging or adverse conditions. Browning reactions can be divided into two categories, namely
enzymatic browning and non-enzymatic b rowning3.
Enzymatic browning is a common phenomenon in the processing of fruits and vegetables. Factors involved
in browning reactions of fruits and vegetables, such as a pple4, pear5, luffa6 and potato7, have been extensively.
1
Horticultural Research Institute, Shanghai Academy of Agricultural Sciences, Shanghai 201403, China. 2Shanghai
Key Laboratory of Protected Horticultural Technology, Shanghai 201403, China. 3Shanghai Ocean University,
Shanghai 201306, China. 4Harbin Academy of Agricultural Sciences, Harbin 150070, China. 5These authors
contributed equally: Xiaohui Liu and Aidong Zhang. *email: wuxuexia@sina.com; dingshizha@aliyun.com
Scientific Reports | (2021) 11:6937 | https://doi.org/10.1038/s41598-021-86311-1 1
Vol.:(0123456789)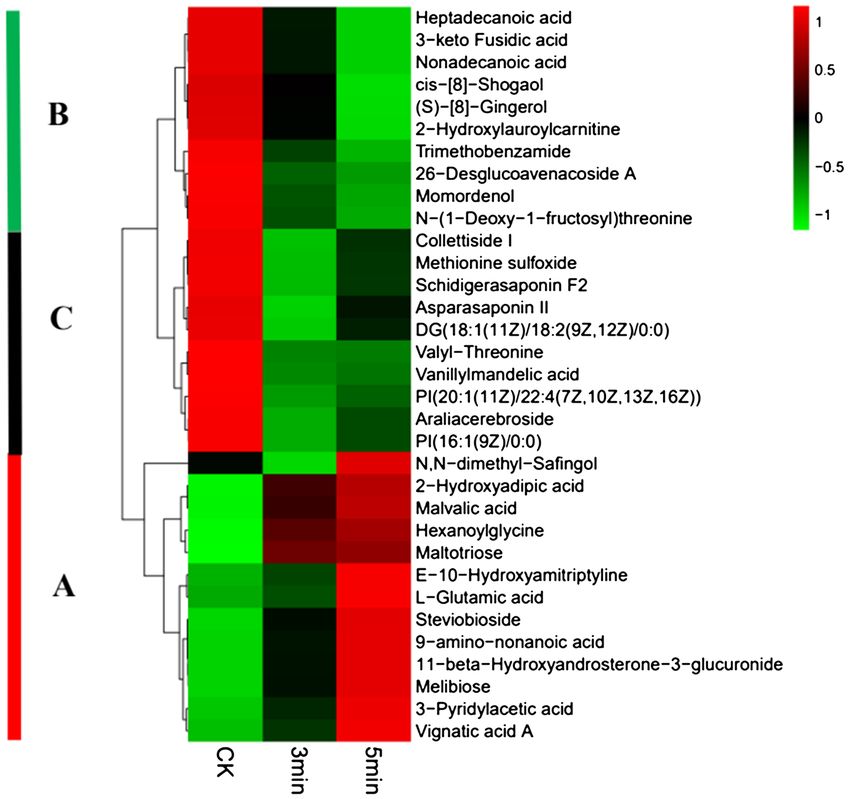
www.nature.com/scientificreports/
Researchers have found that the primary reason for browning may be the disruption of the membrane system8.
When fruits and vegetables are damaged mechanically or in an adverse environment, polyphenols inside them
will oxidize under the catalytic action of polyphenol oxidase (PPO) and turn b rown9, and this requires the par-
ticipation of oxygen, enzymes and substrates. Peroxidase (POD) and lipoxygenase (LOX) are also key enzymes
that cause the browning of fruits and vegetables. Phenolic enzymes and phenolic substances in healthy fruits are
regionally distributed in cells; they cannot come into contact when the cells are intact, and no browning reaction
occurrs10. When the cells suffer adversity, the activities of reactive oxygen scavenging enzymes such as superoxide
dismutase (SOD), catalase (CAT) and ascorbate peroxidase (APX) are reduced, which decreases the fruit’s ability
to scavenge free radicals, and thereby allows the accumulation of reactive oxygen species (ROS)11. At the same
time, the process of membrane lipid peroxidation is accelerated and membrane permeability is increased, and
contact between enzymes and substrate will induce enzymatic browning12. In addition, studies have shown that
transcription factors also have an impact on fruits and vegetables browning, for example, WRKY gene family
may also be involved in the regulation of Luffa6 and husk of walnut13 browning.
Metabolomics is a burgeoning omics technology, and complements the technologies of genomics and pro-
teomics; Fiehn proposed in 2002 that metabolomics is a qualitative and quantitative analysis method for total
metabolites in the body of an organism14. With the broadening base of plant metabolomics research, we have
gained a better understanding of plant growth regulation, development, metabolic processes and molecular
mechanisms of stress responses. In addition, plant metabolomics has become a powerful tool for probing physi-
ology and biology all aspects of plants15. In order to explore the mechanism of climate and development regulat-
ing the antioxidant system and metabolism of date palm leaves, Du et al. used the non-targeted metabolomics
method based on LC–MS to find that young leaves may be more responsive to the environmental c hange16. Using
targeted metabolomics, Tang et al. found that levels of hyperoside, POD, SOD, H2O2, ascorbic acid (AsA), and
expression of nine genes (MdPAL, MdCHS, MdCHI, MdANS, MdFLS, MdANR, MdUGT71K1s, MdTTG1 and
MdMYB1) were lower levels in browning-sensitive a pples4.
This study focuses on mechanisms behind the browning responsive of ‘Huqie 5′ fresh-cut eggplant fruits by
combining plant physiological and metabolomics approaches. The primary purpose of this study was to clarify
the biochemical and molecular mechanism of the browning process in fresh-cut eggplant fruits, offer a feasible
theoretical foundation for the processing and production of fresh-cut fruit and vegetable, and provide a reference
for further investigation into means for reducing the browning of other fresh-cut products.
Results
Multivariate analysis. In the data matrix, the data were subject to multivariate analysis tools (Principal
Components Analysis (PCA), Partial Least Squares Discrimination Analysis (PLS-DA) and Orthogonal projec-
tions to latent structures Discrimination Analysis (OPLS-DA)). PCA, PLS-DA and OPLS-DA scoring plots and
validation plots of the OPLS-DA models were built for the three contrastive groups: 3 min/CK, 5 min/CK and
3 min/5 min (Fig. 1). Table 1 displays all the parameters of these models. In our results, all values for Hotelling’s
T2 were 95%, Q2 were < 0 (Q2 = − 0.849 to − 0.741), R2X were > 0.4, and R2 were > 0.5, indicating that the model
is reliable.
Differential metabolites. Criteria for screening differential metabolites were variable influence of pro-
jection (VIP) > 1 for the first principal component in the OPLS-DA, and p-value < 0 (Table S4). Among these
differential metabolites, chlorogenic acid is a differential metabolite in 5 min/CK (Fold Change, FC = 1.64) and
5 min/3 min (FC = 1.63) (Table S4). 256 differential metabolites were detected in the 3 min/CK comparative
group, 357 in the 5 min/CK comparative group and 333 in the 3 min/5 min comparative group. Among these
metabolites, 49 were common to all three groups and 119 were common between 3 min/CK and 5 min/CK.
However, 253 differential metabolites were the non-repeated between any two groups; 114, 58 and 81 metabo-
lites were exclusive to the 3 min/CK, 5 min/CK and 3 min/5 min comparative groups, respectively (Fig. 2).
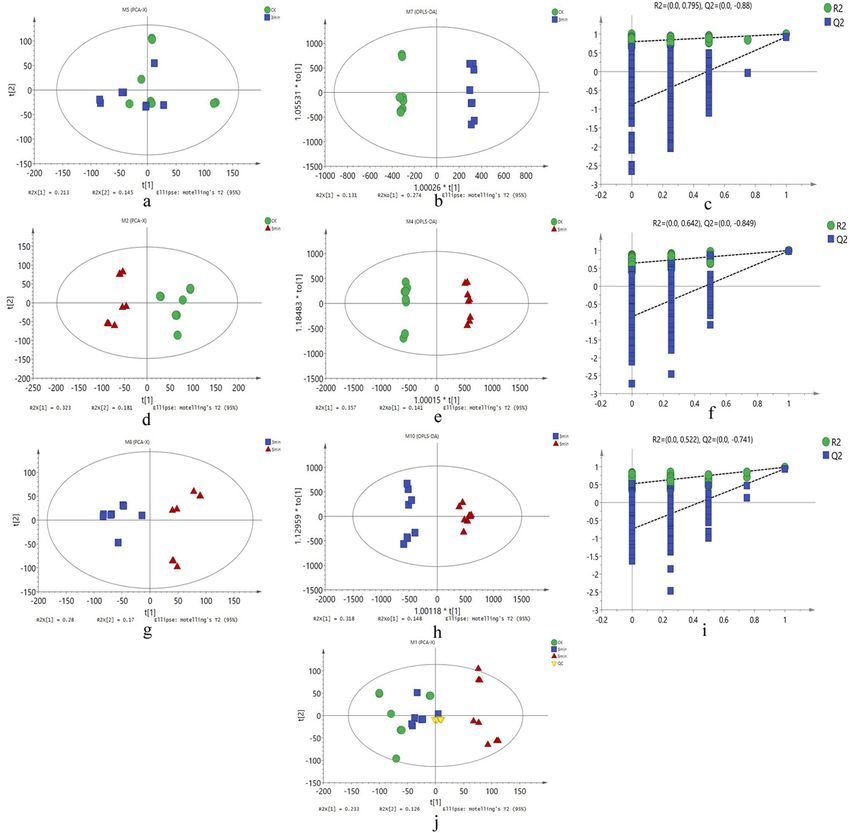
Heatmap of 119 common differential metabolites. The 119 common differential metabolites from
the 3 min/CK and 5 min/CK groups were further divided into three categories based on STC (Subject To Clas-
sification), and are represented by A, B and C in Table S5. Furthermore, the metabolites in these three categories
were grouped into eight types of compounds (Table 2). Category A included 68 metabolites, which were mainly
lipids, fatty acid and carbohydrates (Table 2). The contents of these metabolites increased gradually. The metabo-
lites of category B comprised 40 compounds, and were mostly fatty acids and lipids (Table 2). The contents of
these metabolites decreased as the time from cutting increased. There were 11 components in category C, mainly
lipids (Table 2). Interestingly, their contents and expression levels decreased at 3 min, but increased at 5 min.
However, they were lower than those at 0 min (CK) as a whole. In order to express the clustering relationships
between A, B and C, the peak areas of 33 metabolites were selected to construct a heatmap (Fig. 3).
Metabolite content changes. Six phenols associated with browning were selected from the data matrix.
The content levels of the selected metabolites at different treatment intervals are shown in Fig. 4. Fresh-cut
treatment promoted the continuous increase of the contents of chlorogenic acid, (−)-epigallocatechin, and cou-
maric acid, and there was an increase of 42.7%, 41.5% and 44.6% from min 0 to min 5 after cutting, respectively
(Fig. 4). However, there was no remarkable alteration in the content of some metabolites, such as ethylvanillin
glucoside, quercetin, and dopamine (Fig. 4). These results show that polyphenols are the basic substances for
browning. The content of chlorogenic acid was highest at 5 min after cutting, suggesting that it may be more
important to browning activity in fresh-cut eggplant.
Scientific Reports | (2021) 11:6937 | https://doi.org/10.1038/s41598-021-86311-1 2
Vol:.(1234567890)
www.nature.com/scientificreports/

                                  Figure 1.  Score scatter plots from PCA, PLS-DA, OPLS-DA and validation plots of OPLS-DA for three
                                  comparative groups. (a) PLS-DA for 3 min/CK comparative group. (b) OPLS-DA for 3 min/CK comparative
                                  group. (c) Validation plots of OPLS-DA for 3 min/CK comparative group. (d) PLS-DA for 5 min/CK
                                  comparative group. (e) OPLS-DA for 5 min/CK comparative group. (f) Validation plots of OPLS-DA for
                                  5 min/CK comparative group. (g) PLS-DA for 3 min/5 min comparative group. (h) OPLS-DA for 3 min/5 min
                                  comparative group. (i) Validation plots of OPLS-DA for 3 min/5 min comparative group. (j) Score scatter plots
                                  of PCA for 3 min/CK comparative group, 5 min/CK comparative group and 3 min/5 min comparative group.

                                  KEGG pathway analysis. Subsequently, all 119 common differential metabolites in 5 min/CK and 3 min/
                                  CK contrastive groups were annotated to biological pathways in the KEGG database using MetaboAnylst 3.0
                                  (Table S6), and the top-10 KEGG pathways are shown in Fig. 5; these include glycerophospholipid metabolism,
                                  glutathione metabolism, ABC transporters, glycosylphosphatidylinositol (GPI)-anchor biosynthesis, nitrogen
                                  metabolism, taurine and hypotaurine metabolism, arginine biosynthesis, stilbenoid, diarylheptanoid and gin-
                                  gerol biosynthesis, alanine, aspartate and glutamate metabolism. Moreover, phenolic metabolic pathways such
                                  as phenylpropanoid biosynthesis and flavonoid biosynthesis were also enriched.

Scientific Reports |   (2021) 11:6937 |               https://doi.org/10.1038/s41598-021-86311-1                                                  3

                                                                                                                                          Vol.:(0123456789)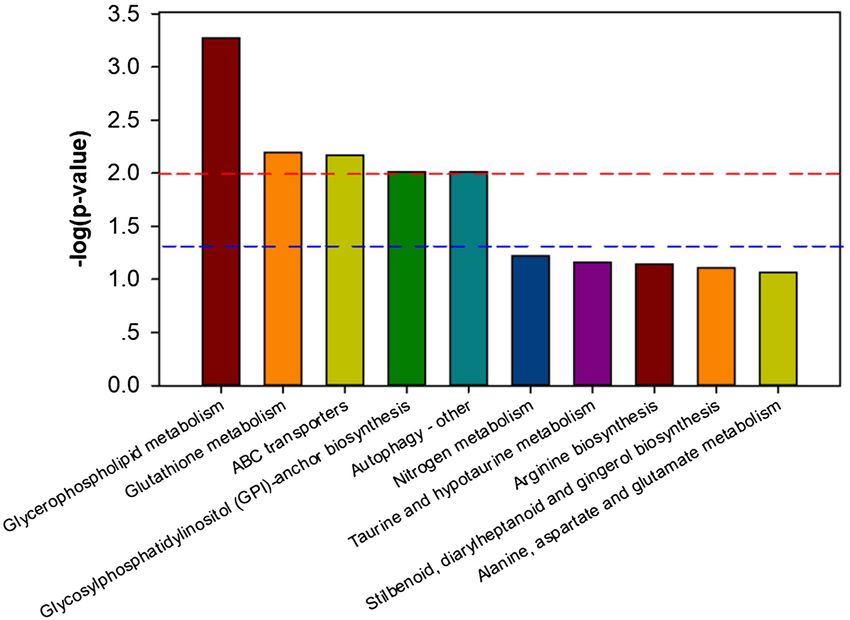
www.nature.com/scientificreports/

                                             No. Model               Type      A            N    R2X(cum)    R2Y(cum)    Q2(cum)        R2      Q2
                                             All           M1        PCA-X     6            32   0.651                   0.356
                                             5 min/CK      M2        PCA-X     3            16   0.62                    0.416
                                             5 min/CK      M3        PLS-DA    2            16   0.502       0.989       0.955
                                             5 min/CK      M4        OPLS-DA   1+2+0        16   0.64        0.998       0.987          0.642   −0.849
                                             3 min/CK      M5        PCA-X     4            16   0.612                   0.106
                                             3 min/CK      M6        PLS-DA    3            16   0.479       0.995       0.889
                                             3 min/CK      M7        OPLS-DA   1+3+0        16   0.595       0.998       0.925          0.795   − 0.88
                                             3 min/5 min   M8        PCA-X     4            16   0.662                   0.321
                                             3 min/5 min   M9        PLS-DA    3            16   0.562       0.995       0.956
                                             3 min/5 min   M10       OPLS-DA   1+1+0        16   0.466       0.985       0.943         0.522    − 0.741

                                            Table 1.  The parameters for the assessment of these models. Note A represents the number of principal
                                            components (PC) while each model is constructed, N represents the numbers of samples analyzed, M1-M10
                                            represents Model 1–10, R2X (cum) represents the interpretation rate of each model in the X axis direction
                                            in multivariate statistical analysis modeling, R2Y (cum) represents the interpretation rate of each model in
                                            Y axis direction in multivariate statistical analysis modeling, Q2 (cum) represents the prediction rate of each
                                            model, R2 represents the intercept value of the Y axis and the regression line, which is obtained when Linear
                                            regression analysis between the Y matrix of the original classification, the Y matrices of N times’ different
                                            permutations and R2Y was conducted during model validation, and Q2 for the intercept value of the Y
                                            axis and the regression line, which is obtained when Linear regression analysis between the Y matrix of the
                                            original classification, the Y matrices of N times’ different permutations and Q2Y was conducted during model
                                            validation. For Q2 in external validation, general requirement is that Q2 < 0, overfitting is avoided. For R2X,
                                            general requirement is that R2X > 0.4, the model is good. For R2 in internal validation, general requirement is
                                            that R2 > 0.5, the closer to 1, the better the model.

                                            Figure 2.  Venn diagram of the differential metabolites among three comparative groups.

                                                                                                         Organoheterocyclic
                                                    Benzenoids   Fatty acids   Lipids   Organic acids    compounds                 Carbohydrates          Amines   Hydrocarbons
                                             A      1            13            22       6                9                         17                     0        0
                                             B      3            14            13       3                4                         1                      1        1
                                             C      1            1             7        2                0                         0                      0        0

                                            Table 2.  Classification of metabolites.

          Scientific Reports |   (2021) 11:6937 |                    https://doi.org/10.1038/s41598-021-86311-1                                                                   4

Vol:.(1234567890)
www.nature.com/scientificreports/
Figure 3. Heatmap showing the differences in expression levels of metabolites.
0min
1600 a
1400 3min
content ng/kg
1200 5min
1000 bc b
800 a
600 bc b
400 a
bc b a b ab
200 a a a b
a a
0
d
e
d
in
in
e
id
in
ci
i
ac
ch
et
ca
os
am
rc
te
ic
uc
ni
ue
ca
op
ar
gl
e
Q
llo
D
m
og
in
ou
ga
or
ill
C
pi
hl
an
-E
C
lv
(-)
hy
Et
Figure 4. Contents of phenolic substances related to browning.
ROS contents of fresh‑cut eggplants. H2O2 contents and the rate of O 2·− production in fresh-cut egg-
plants were also determined for investigation of ROS levels in fresh-cut eggplants. As shown in Fig. 6, H2O2
content exhibited a slow but steady increasing trend within 0–30 min after fresh-cut treatment. However, the
accumulation of H2O2 from 30 to 120 min showed a significant growth trend (p < 0.05). Compared with CK, the
H2O2 content increased by 50.9% at 120 min after cutting. In addition, a similar tendency was also found in the
rate of O2·− production (Fig. 7). Between 60 and 120 min after cutting, the rate of O 2·− production showed a
sharp increase of 29.6%.
Scientific Reports | (2021) 11:6937 | https://doi.org/10.1038/s41598-021-86311-1 5
Vol.:(0123456789)www.nature.com/scientificreports/
Figure 5. KEGG enrichment of the differential metabolic pathways.
0.8
a
H2O2 content (mmol/g)
0.6
b
c
d
0.4 d
e e
0.2
0.0
0min 3min 5min 10min 30min 60min 120min
Fresh-cut time
Figure 6. H2O2 content of Fresh-Cut eggplants.
MDA contents of fresh‑cut eggplants. Malondialdehyde (MDA) is one of the products of membrane
lipid peroxidation. The content of MDA can represent the damage of the membrane system of fruits and vegeta-
bles, and is an important index to evaluate the decomposition of fresh-cut products. The degree of cell membrane
lipid peroxidation caused by cutting increases with time along with MDA content of fresh-cut eggplant. It can be
seen from Fig. 8 that MDA content always presents an increasing trend during the storage period of freshly cut
eggplant. During the whole process, MDA was the highest at 120 min after fresh cutting treatment, indicating
that the degree of membrane lipid peroxidation was high and the browning of fresh-cut eggplant was serious.
Activities of PPO, POD, and LOX and relevant gene expression. It can be seen from Fig. 9, A, B,
C that the activity of PPO, POD and LOX increased with time after fresh cutting; compared with 0 min, they
showed increases of 31.7%, 68.7% and 70.5% at 120 min, respectively. Figure 9D–F shows the changes of expres-
sion levels of genes encoding PPO, POD, and LOX relative to time after cutting, respectively. The changes in
expression levels of SmePPO, SmePOD, and SmeLOX gene were consistent with activity changes of the respective
enzymes.
Activities of PAL, C4H, and 4CL and relevant gene expression. The changes in activities of phe-
nylalanine ammonia-lyase (PAL), cinnamate 4-hydroxylase (C4H), and 4-coumaric acid: coenzyme A ligase
Scientific Reports | (2021) 11:6937 | https://doi.org/10.1038/s41598-021-86311-1 6
Vol:.(1234567890)www.nature.com/scientificreports/
12
a
production(nmol/g/min)
10
8 b
Rate of O2•−
c
6 de cd
e de
4
2
0
0min 3min 5min 10min 30min 60min 120min
Fresh-cut time
Figure 7. Rate of O2·− production of Fresh-Cut eggplants.
25.0
a
20.0
b
MDA content
15.0
c
10.0 de d d
e
5.0
0.0
0min 3min 5min 10min 30min 60min 120min
Fresh-cut time
Figure 8. MDA content of Fresh-Cut eggplants.
(4CL) relative to time after fresh cutting of eggplant are shown in Fig. 10A–C. The activity of PAL increased
significantly in the initial stage (0–5 min) of fresh-cut treatment, peaked at 5 min, and then decreased gradually.
A similar tendency was also found in the activity of C4H, which increased sharply during the first 5 min, and was
followed by a gradual decrease in the subsequent time. The activity of 4CL showed virtually no significant change
during the initial stage (0–5 min), and declined very slowly thereafter, resulting in a 32.9% decrease at the last
stage (120 min) compared to 0 min. Figure 10D–F shows the changes in expression levels of SmePAL, SmeC4H,
and Sme4CL, respectively; these were consistent with the changes in activities of the respective enzymes.
Activities of SOD, APX, and CAT and relevant gene expression. As shown in Fig. 11A–C, the activ-
ity of SOD increased significantly in the initial stage (0–10 min) of fresh-cut treatment, peaked at 10 min, and
then decreased gradually. Relative to 0 min, it increased by 34.6% by the final stage. A similar tendency was
also found in the activity of APX. The activity of CAT peaked at 3 min after fresh cutting, and then decreased
slowly and steadily. Figure 11D–F show the changes of relative expression levels of genes encoding antioxidant
enzymes. The expression changes of SmeSOD, SmeCAT, and SmeAPX gene were consistent with the changes in
activities of the respective enzymes; however, the transcriptional peak of SmeAPX gene was detected at 5 min,
which indicated that the enhancement of enzyme activities lagged behind the gene up-regulation.
Discussion
Phenolic compounds, as the substrate of browning reaction, are important factors causing browning of
fruits17. After enzymatic browning of fruits, phenols are oxidized to quinones. As one of the substances affect-
ing enzymatic browning, the type and content of phenolic compounds are of great significance to browning
characteristics18. Liu et al. studied the reaction mechanism of enzymatic browning during potato processing,
and analyzed the correlation between substrates and b rowning7. Their results showed that phenolic compounds
are closely related to browning, and chlorogenic acid is an important substrate leading to potato enzymatic
browning. The phenolic compounds identified in banana peels in recent years were mainly dopamine, followed
by chlorogenic acid and coumarin, with dopaminerase oxidation being the main factor for banana b rowning19.
Chlorogenic acid and epicatechin are the phenolic compounds with the highest contents in apple fruits20, while
the substrates in mango are mainly coffeic acid and ferulic acid21. In addition, some studies have shown that apple
browning index (BI) is negatively correlated with hyperoside4. The substrates for litchi peel browning belong
Scientific Reports | (2021) 11:6937 | https://doi.org/10.1038/s41598-021-86311-1 7
Vol.:(0123456789)www.nature.com/scientificreports/
300 10
A D a
Relative expression level SmePPO
PPO activity (U/g)
a 8
b b
200 c
d e e 6 c
e
d
d de
4 e
100
2
0 0
0min 3min 5min 10min 30min 60min 120min 0min 3min 5min 10min 30min 60min 120min
Fresh-cut time Fresh-cut time
70 a
B 5 a
60
b
E b
POD activity (U/g)
Relative expression level
50 4
c c
40 d 3 de cd
d d
SmePOD
30 e 2 e
e
20
1
10
0
0 0min 3min 5min 10min 30min 60min 120min
0min 3min 5min 10min 30min 60min 120min
Fresh-cut time
Fresh-cut time
500 a 10
LOX activity (μmol/min/g)
400
C Relative expression level 8
F
b b a
300 6
c
SmeLOX
cd c
d d
200 e 4 de
e e e
100 2
0 0
0min 3min 5min 10min 30min 60min 120min 0min 3min 5min 10min 30min 60min 120min
Fresh-cut time Fresh-cut time
Figure 9. Activities of polyphenol oxidase (PPO) (A), peroxidase (POD) (B), and lipoxygenase (LOX) (C) and
gene expression levels of SmePPO (D), SmePOD (E), and SmeLOX (F) of fresh-cut eggplant. Data represent the
means of three replicates and their standard errors.
to the collated catechenol compounds, which can rapidly interact with PPO to form browning p roducts11. Free
polyphenols are the main substrates in the browning reaction of longan peels, and the effect of anthocyanins in
the browning reaction is not o bvious22. The contents of polyphenols reflect the antioxidant capacity of fruits and
vegetables. Research results of Liu et al. showed that peach phenols consist of chlorogenic acid, neo-chlorogenic
acid and protocatechuic a cid23. Mishra et al. also showed that browning of eggplant is related to increased
contents of polyphenols24. In this study, six polyphenols, including chlorogenic acid, (−)-epigallocatechin and
coumaric acid, ethylvanillin glucoside, quercetin and dopamine were detected in the fresh-cut eggplant fruits.
Interestingly, the content of chlorogenic acid was highest at 5 min after fresh-cut, suggesting that may be more
important to fresh-cut eggplant browning activity (Fig. 4).
In addition, PAL, C4H, and 4CL play momentous roles in regulating the production of phenolic substances
in phenylpropanoid m etabolism25. l-Phenylalanine rooted in the Shikimate pathway generates trans-cinnamic
acid via PAL ammonia solution reaction. Then trans-cinnamic acid enters into phenylpropanol metabolism, and
through the catalytic action of C4H and 4CL, coumaric acid, ferulic acid, erucic acid and other intermediates
are generated. These intermediates can be further converted into coumarin and chlorogenic acid, and also can
form CoA esters. Finally, these are converted to flavonoids, lignin, alkaloids and other secondary metabolites26.
Tang et al. found a difference of enzymatic browning unrelated to in Fuji apples. Their results showed that during
browning, PPO activities and its gene expression, and total phenol content were not correlated with different
browning degrees of apples. However, levels POD, SOD, PAL and their gene expression were higher levels in
browning- resistant a pples4. In this study, we detected a phenylpropanol metabolic pathway with accumulation
of chlorogenic acid, (−)-epigallocatechin, and coumaric acid. At the same time, the physiological experiments
showed that the activities of PAL, C4H, 4CL were increased; these increases were mediated by increases in gene
Scientific Reports | (2021) 11:6937 | https://doi.org/10.1038/s41598-021-86311-1 8
Vol:.(1234567890)www.nature.com/scientificreports/
60 7
a
a a D
Relative expression level
A
PAL activity (U/min/g)
a 6
40 5
b b
4 b
SmePAL
c c c c c
3
20 d
2 d
1
0 0
0min 3min 5min 10min 30min 60min 120min 0min 3min 5min 10min 30min 60min 120min
500
a aFresh-cut time 6
Fresh-cut time
B ab
ab E
C4H activity (U/g)
Relative expression
400 a
bc a
level SmeC4H
4 a
300 c b
b
200 d 2 c
c
100
0
0 0min 3min 5min 10min 30min 60min 120min
0min 3min 5min 10min 30min 60min 120min Fresh-cut time
30 Fresh-cut time 2.5
C F a a
4CL activity (U/g)
a a a a 2 a
Relative expression level
a
20 b
bc c 1.5 b
Sme4CL
c
1
10 d
0.5
0 0
0min 3min 5min 10min 30min 60min 120min 0min 3min 5min 10min 30min 60min 120min
Fresh-cut time Fresh-cut time
Figure 10. Activities of phenylalanine ammonium lyase (PAL) (A), cinnamate-4-hydroxylase (C4H) (B), and
4-coumarate coenzyme A ligase (4CL) (C) and the gene expression levels of SmePAL (D), SmeC4H (E), and
Sme4CL (F) of fresh-cut eggplant. Data represent the means of three replicates and their standard errors.
expression levels of SmePAL, SmeC4H and Sme4CL within 0–5 min of fresh cutting, and they coincided with
increased accumulation of phenolic substances (Fig. 10).
Existing research demonstrates that phenols usually accumulate in vacuoles, and PPO mainly exists in the
cytoplasmic membrane and cell w alls27. Fruit tissue structure and regionalization of the cell space are damaged
by fresh cutting, destroying partitions between PPO and substrate polyphenols and allowing contact between
enzymes and substrates for catalysis by PPO, and catalyzing the conversion of phenolic compounds into quinone
compounds28; quinone compounds can further produce enzymatic browning by polymerizing with intracellular
macromolecules to deposit pigment on the surface of damaged t issues29. In this study, we detected activity and
gene expression of PPO, and the results showed that the activity of PPO in fruits and vegetables would gener-
ally increase by cutting (Fig. 9A,D). With increased time after fresh cutting, the activity of PPO in eggplant was
gradually enhanced, rising from an initial 161.1 U g−1·min−1 to 236.0 U·g−1 min−1 at 120 min after fresh cutting
(Fig. 9A). In addition, some researchers believe that the browning reaction is at least partly due to the action of
POD on polyphenols30. It was found that one POD gene was differentially regulated in fresh-cut luffa fruits31. In
a study on browning of fresh-cut apples, the activity of POD increased with time from fresh cutting. Our results
showed that the activity and gene expression of POD increased with time from the fresh cutting of eggplant fruits
(Fig. 9B,E), which is consistent with these previous results.
Substrates (phenolic substances), enzymes and reactive oxygen species (ROS) are three material conditions
for enzymatic browning. Under normal circumstances, the generation and clearance of ROS is in dynamic
equilibrium, and fresh-cut processing leads to an imbalance in ROS metabolism. Excessive generation of free
radicals initiates membrane lipid peroxidation and destruction of membrane structure, prompting contact of
phenoloxidase with phenolics; in the presence of oxygen, phenolics are oxidized to quinone, resulting in enzy-
matic browning32. In fresh-cut apple, wounds acquired during cutting and storage induce the accumulation of
ROS, such as O2·− and H2O24. MDA is the main product of membrane lipid peroxidation, and its accumulation
reflects the degree of membrane lipid peroxidation and cellular membrane integrity. Its accumulation can cause
further damage to cell membranes and accelerate the browning degree of fruits and vegetables5. Our studies
confirmed that H 2O2, MDA content and the rate of O 2·− production increased with time after fresh cutting. LOX
is an enzyme that uses polyunsaturated fatty acids as catalytic substrates; it can initiate membrane lipid peroxi-
dation, destroy membrane structure, and its activity increases during browning5. Similar to a previous study,
the enzyme activity and gene expression of LOX increased with time following fresh cutting in our experiment
(Fig. 9C,F), suggesting that LOX may play an important role in the degradation of cellular membranes during
fresh-cut eggplant browning.
Scientific Reports | (2021) 11:6937 | https://doi.org/10.1038/s41598-021-86311-1 9
Vol.:(0123456789)www.nature.com/scientificreports/
200 6
A
SOD activity (U/g)
a a
5 D
Relative expression
150 b
c
level SmeSOD
d d 4
100
e 3
2
50
1
0 0
0min 3min 5min 10min 30min 60min 120min 0min 3min 5min 10min 30min 60min 120min
Fresh-cut time Fresh-cut time
0.50 8
B a E
Relative expression level
0.40
cd bc 6
(μmol/min/g)
bc
APX activity
e c
0.30
SmeAPX
a 4
0.20
0.10 2
0.00 0
0min 3min 5min 10min 30min 60min 120min 0min 3min 5min 10min 30min 60min 120min
Fresh-cut time
Fresh-cut time
5
350
F
CAT activity (μmol/min/g)
C a a a b
Relative expression level
300 c 4
d e
250
3
200
SmeCAT
150 2
100
1
50
0 0
0min 3min 5min 10min 30min 60min 120min 0min 3min 5min 10min 30min 60min 120min
Fresh-cut time Fresh-cut time
Figure 11. Activities of superoxide dismutase (SOD) (A), ascorbate peroxidase (APX) (B), and catalase (CAT)
(C) and gene expression levels of SmeCu/ZnSOD (D), SmeAPX (E), and SmeCAT(F) of fresh-cut eggplant. Data
represent the means of three replicates and their standard errors.
In ROS metabolic pathway, SOD, APX, and CAT are three antioxidant enzymes that regulate the contents of
2·− in cells to produce H
ROS, which protects plants from oxidative s tress33. SOD can catalyze O 2O2 and O
2. APX
and CAT can clear H2O2. They can clear the ROS produced during metabolic processes, reduce the content of
ROS by enzymatic browning reaction, and have an inhibitory effect on browning34. In this study, the activities
of these three enzymes increased significantly in the initial stage of fresh-cut treatment, peaked at 5/10 min,
and then decreased gradually (Fig. 11). The expression changes of SmeSOD, SmeCAT, and SmeAPX gene were
consistent with the change in activities of enzymes; however, the transcriptional peak of SmeAPX gene were
detected at 5 min, which indicated that the enhancement of enzyme activities lagged behind gene up-regulation
(Fig. 11B,E). These results suggest that maintaining higher SOD, CAT, and APX may be crucial to browning
resistance. At the same time, the glutathione metabolism pathway was found in our metabolome data, and the
content of l-Glutamate involved in this pathway increased. APX is a key enzyme in the glutathione cycle, which
can effectively remove ROS and improve the antioxidant capacity of plants through this cycle. Generation of
ROS and transcription of most of the antioxidant genes increased during the late stage of fresh-cut eggplant
browning in this study; these results indicate that changes in the redox state maybe one of the main reasons for
fresh-cut eggplant browning.
Conclusion
This study provides insights into the physiological and molecular mechanisms of fresh-cut eggplant browning
by combining plant physiological and metabolomics approaches. The relationship between the gene expression
of ROS metabolism, oxidation and reduction reactions, membrane lipid metabolism and enzymatic browning
and core physiology was studied. Antioxidant enzymes play an important role in the browning process, and
highly active APX can help delay the browning of fresh-cut eggplant. Our results provide a reference for further
investigation into mitigation of browning in other fresh-cut products.
Material and methods
Plant material and fresh‑cut treatments. Eggplant cultivar ‘Huqie 5′ is a breeding line produced by
our lab at the Shanghai Academy of Agricultural Sciences, Shanghai, China. This cultivar is a new combination
of early maturity eggplant materials with high yield and good quality; it was bred by using excellent germplasm
Scientific Reports | (2021) 11:6937 | https://doi.org/10.1038/s41598-021-86311-1 10
Vol:.(1234567890)www.nature.com/scientificreports/
materials and the multi-generation self-crossing separation technique. The growth characteristics of this cultivar
are: strong plant growth, long and thin fruit, deep pericarp coloration, strong luster, good quality, high fruiting
rate of high-quality commodity, strong propensity for sustained fruiting. The eggplant fruit were used for untar-
geted metabolomics analyses at 0, 3 and 5 min after. For the molecular experiments, samples were taken at 0, 3,
5, 10, 30, 60, 120 min after peeling. Samples were collected by slicing them into small segments in liquid nitrogen
and then storing the slices in a freezer at − 80 °C until analysis.
Instruments and chemicals. Vortex oscillator (TYXH-I, Shanghai Hanno Instrument Co., Ltd); Auto-
matic rapid sample grinding machine (JXFSTPRP-24/32, Shanghai Jingxin Industrial Development Co., Ltd);
Table top high-speed refrigerated centrifuge (TGL-16MS, Shanghai Lu Xiangyi Centrifuge Instrument Co., Ltd);
Ultrasonic cleaning machine (SB-5200DT, Ningbo Xinzhi Biotechnology Co., Ltd); Ultra high performance
liquid chromatography (ACQUITY UPLC, Waters); Chromatographic column (ACQUITY UPLC BEH C18
(100 mm × 2.1 mm, 1.7 µm), Waters) ; High-resolution mass spectrometry (AB Triple TOF 5600, AB Sciex).
We selected methanol, formic acid, acetonitrile and water from CNW Technologies GmbH and l-2-chlorophe-
nylalanine from Shanghai Hengchuang Biotechnology co., LTD. Note: all chemical reagents and solvents were
analytical purity or chromatographic grade.
Metabolomic analysis. Sample preparation. Preparation of samples for metabolites extraction was con-
ducted by transferring 80 mg of lyophilized sample to a 1.5 mL Ep tube. The internal standard was 2-chlorine-
l-phenylalanine (20 µL, 0.3 mg mL−1 soluble in methanol). Each sample was added with a methanol and water
mixture (7:3,v/v, 1000 µL) and placed at − 20 °C for 2 min. Samples were ground at 60 Hz for 2 min, followed by
4 °C ultrasound for 30 min after being subject to a brief eddy current. Samples were then placed at − 20 °C for
20 min and were centrifuged at 1000 × g and 4 °C for 15 min. The supernatants (200 µL per tube) were gathered
with a crystal syringe, filtered through a 0.22 µm microfilter and transferred to an automatic sampling bottle for
LC–MS analysis. The vials were stored at − 80 °C until they were used for LC–MS analysis. QC (Quality control)
samples were made from a mixture of each of the samples; the volume of each QC sample was the same as that
of the sample. Before use, all extraction reagents were precooled to − 20 °C.
LC–MS analysis. The analytical instrument of this experiment is The UHPLC system, which is composed of
liquid-mass coupling system consisting of AB Sciex Triple TOF 5600 high resolution mass spectrometer. It was
applied to analyze metabolic profiles in both TIC + and TIC- modes.
Chromatographic conditions were as follows: Chromatographic column: ACQUITY UPLC BEH C18
(100 mm × 2.1 mm, 1.7 μm); column temperature: 45 °C; mobile phase: A—water (containing 0.1% formic
acid), B—acetonitrile (containing 0.1% formic acid); flow rate: 0.4 mL min−1; injection volume: 5 µL. The elution
gradient is shown in Table S1. Mass spectrometry conditions are shown in Table S2. In addition, in order to assess
the reproducibility of the whole analysis process, we added one QC sample per 8 analysis samples.
Data preprocessing and statistical analyses. The original data were disposed using Progenesis QI made by
Waters Corporation from Milford of USA. Then, we constructed a data matrix that was inputted into XCMS
software (version 14.0, Umetrics, Umeå, Sweden), in which PCA, PLS-DA and OPLS-DA were executed. A
confidence interval is a measure of confidence, and usually bigger is better. R2X represents the cumulative inter-
pretation rate of the multivariate statistical analysis modeling, which generally requires R2X > 0.4 for indication
that the model is credible. The 95% confidence interval that defines the change of the model is represented by
the Hotelling’s T2 region. It is represented as an ellipse in the rating diagram of the model. The reliability of the
model is illuminated by the terms R2X or R2Y and Q2. R2X represents the cumulative interpretation rate of
the multivariate statistical analysis modeling. R2Y represents the cumulative interpretation rate in the Y-axis
model. Therefore, R2X or R2Y indicate the goodness of fit. R2 and Q2 are the parameters of response sequencing
test, used to measure whether the model is overfitted, so as to represent predictability, which can be calculated
through the cross-validation process. External validation generally requires Q2 < 0 to avoid over-fitting. Internal
validation generally requires R2, > 0.5; The closer R2 is to 1, the better the model. To prevent overfitting of the
model, seven-fold cross-validation and 200 RPT were applied to evaluate the quality of the model.
Identification of differential metabolites. The differential metabolites between groups were screened out using
the methods of multi-dimensional analysis and one-dimensional analysis. The screening criteria were VIP > 1 for
the first principal component of the OPLS-DA model, and p < 0.05 for the Student’s t-test, where the variation
multiple was the ratio of the average metabolites in the two groups. Metabolites were described using Progenesis
QI (Waters Corporation, Milford, USA) metabolic data software based on public databases (http://www.hmdb.
ca/; http://www.lipidmaps.org/) and a self-built database. Furthermore, the identified metabolites were classified
to different categories of compounds using the Human Metabolome Database (HMDB, http://www.hmdb.ca/).
KEGG pathway analysis. These differential metabolites were mapped onto the KEGG database, and metabolic
pathways were analyzed based on KEGG (http://www.genome.jp/KEGG/pathway.html) pathway analysis.
Physiological analysis. Sample preparation. Fresh frozen eggplant samples (0.2 g) were weighed and
then homogenized with an extraction liquid volume (1:5, v/v). The homogenate was centrifuged at 12,000×g for
10 min at 4 °C, and the resulting supernatant was placed on ice for subsequent determination.
Scientific Reports | (2021) 11:6937 | https://doi.org/10.1038/s41598-021-86311-1 11
Vol.:(0123456789)www.nature.com/scientificreports/
Physiological index assay. The following physiological indices were determined using the appropriate kits
according to the instruction manual (Suzhou Grace Biotechnology Co., Ltd., Suzhou, China): Total Phenolics
Content (TPC), superoxide radicals (O2·−), H2O2, MDA, superoxide dismutase (SOD) activity, ascorbate peroxi-
dase (APX) activity, catalase (CAT) activity, PPO, POD, LOX). TPC content was determined by Folin-Ciocalteu
method, and the absorbance was measured at 760 nm to calculate the content of TPC; O2·− content: the readings
at 530 nm were recorded and the results were expressed as nanomolar pergram per minute (nmol g −1 min−1);
H2O2 content: the reading of 415 nm was recorded to calculate the content; MDA content: The difference of
absorbance between 532 and 600 nm was used to calculate the content of MDA. SOD activity: the change of
absorbance of reaction solution at 450 nm per minute was 0.001 as one enzyme activity unit, and the result was
expressed as U mg−1 protein; APX activity: 0.001 change of absorbance of reaction solution at 290 nm per min-
ute was taken as one enzyme activity unit, and the result was expressed as U mg−1 protein; CAT activity: 0.001
change of absorbance of reaction solution at 240 nm per minute was taken as one enzyme activity unit, and the
result was expressed as U mg−1 protein; PPO activity: the change of absorbance of reaction solution at 420 nm
per minute was 0.001 as one enzyme activity unit, and the result was expressed as U mg−1 protein; POD activity:
the change of absorbance of reaction solution at 470 nm per minute was 0.001 as 1 enzyme activity unit, and the
result was U mg−1 protein; LOX activity: the change of absorbance of reaction solution at 234 nm per minute was
0.001 as 1 enzyme activity unit, and the result was U mg−1 protein.
The physiological data for PAL, C4H, 4CL were determined with kits provided by Beijing Solarbio Science
& Technology co., Ltd., Beijing, China. PAL activity: PAL activity was calculated by measuring the increase rate
of absorption value at 290 nm. The 0.1 change in absorbance value at 290 nm per minute for each g of tissue in
the reaction system per mL is defined as an enzyme activity unit; C4H activity: The absorbance value at 340 nm
was determined for calculation of C4H activity. The amount of enzyme that reduces 1 nmol NADPH per minute
per g of tissue in the reaction system is defined as a unit of enzyme activity; 4CL activity: The absorbance value
at 333 nm was determined for calculation of 4CL activity. The production of 1 nmol 4-coumaric acid coenzyme
A per minute per g of tissue is defined as A unit of enzyme activity.
Quantitative real‑time PCR (qRT‑PCR) and gene expression assays. qRT-PCR was performed to analyze the
expression levels of SmePPO, SmePOD, SmeLOX, Sme PAL, SmeC4H, Sme4CL, SmeSOD, SmeCAT, SmeAPX
gene. Total RNA was extracted using the Quick RNA isolation Kit (Beijing TsingKe Biotech Co., Ltd., Beijing,
China) according to the manufacturer’s protocol. First-strand cDNA was synthesized from 2 μg of total RNA
using M-MLV reverse transcriptase (Beijing TsingKe Biotech Co., Ltd., Beijing, China) and Oligo (dT)18 in a
25-μL reaction. Real-time PCR was performed with SYBR Green PCR mix (Takara, Shiga, Japan). SmPKG was
used as an endogenous control gene for qRT-PCR analyses. Relative expression levels of the target genes were
calculated using the 2− ΔΔCt method. The primers used are listed in Table S3.
Compliance with ethical standards. All conducted experiments complied with the laws of China.
Received: 2 December 2020; Accepted: 15 March 2021
References
1. Rivas-Sendra, A., Campos-Vega, M., Calabuig-Serna, A. & Segui-Simarro, J. M. Development and characterization of an eggplant
(Solanum melongena) doubled haploid population and a doubled haploid line with high androgenic response. Euphytica 213, 1–14
(2017).
2. Saini, D. K. & Kaushik, P. Visiting eggplant from a biotechnological perspective: A review. Sci Hortic. 253, 327–340 (2019).
3. Haocheng, W. et al. Preservation effect of Spirulina polysaccharides on fresh-cut apple. Food Ind. 20–26 (2019).
4. Tang, T. et al. A difference of enzymatic browning unrelated to PPO from physiology, targeted metabolomics and gene expression
analysis in Fuji apples. Postharvest. Biol. Technol. 170, 111323 (2020).
5. Tao, D. B., Wang, J. W., Zhang, L., Jiang, Y. G. & Lv, M. 1-Methylcyclopropene alleviates peel browning of “Nanguo” pears by
regulating energy, antioxidant and lipid metabolisms after long term refrigeration. Sci. Hortic. 247, 254–263 (2019).
6. Wang, Y.-H. et al. Sequencing, assembly, annotation, and gene expression: Novel insights into browning-resistant Luffa cylindrica.
Peerj 8, e9961 (2020).
7. Liu, X. et al. Effect of purslane (Portulaca oleracea L.) extract on anti-browning of fresh-cut potato slices during storage. Food
Chem. 283, 445–453 (2019).
8. Xu, F. X., Dong, S. Z., Xu, Q. & Liu, S. Y. Control of brown heart in Huangguan pears with 1-methylcyclopropene microbubbles
treatment. Sci. Hortic. 259, 108820 (2020).
9. Sajid, A. et al. Effect of postharvest oxalic acid application on enzymatic browning and quality of lotus (Nelumbo nucifera Gaertn)
root slices. Food Chem. 312, 126051 (2020).
10. Toivonen, P. M. A. & Brummell, D. A. Biochemical bases of appearance and texture changes in fresh-cut fruit and vegetables.
Postharvest. Biol. Technol. 48, 1–14 (2008).
11. Ali, S. et al. Modified atmosphere packaging delays enzymatic browning and maintains quality of harvested litchi fruit during low
temperature storage. Sci. Hortic. 254, 14–20 (2019).
12. Wei, D. & Zhao, X. H. Calcium maintained higher quality and enhanced resistance against chilling stress by regulating enzymes
in reactive oxygen and biofilm metabolism of Chinese winter jujube fruit. J. Food Biochem. 44, e13161 (2020).
13. Zhang, S. et al. De novo transcriptome assembly of the fresh-cut white husk of Juglans cathayensis Dode: Insights for enzymatic
browning mechanism of fresh-cut husk of walnut. Sci. Hortic. 257, 108654 (2019).
14. Fiehn, O. Metabolomics: The link between genotypes and phenotypes. Plant Mol. Biol. 48, 155–171 (2002).
15. Hong, J., Yang, L. T., Zhang, D. B. & Shi, J. X. Plant metabolomics: An indispensable system biology tool for plant science. Int. J.
Mol. Sci. 17, 767 (2016).
Scientific Reports | (2021) 11:6937 | https://doi.org/10.1038/s41598-021-86311-1 12
Vol:.(1234567890)www.nature.com/scientificreports/
16. Du, B. G. et al. Climate and development modulate the metabolome and antioxidative system of date palm leaves. J. Exp. Bot. 70,
5959–5969 (2019).
17. Lysiak, G. P., Michalska-Ciechanowska, A. & Wojdylo, A. Postharvest changes in phenolic compounds and antioxidant capacity
of apples cv. Jonagold growing in different locations in Europe. Food Chem. 310, 125912 (2020).
18. Liang, Y. D. & Were, L. Cysteine’s effects on chlorogenic acid quinone induced greening and browning: Mechanism and effect on
antioxidant reducing capacity. Food Chem. 309, 125697 (2020).
19. Escalante-Minakata, P. et al. Comparative study of the banana pulp browning process of “Giant Dwarf ” and FHIA-23 during fruit
ripening based on image analysis and the polyphenol oxidase and peroxidase biochemical properties. 3 Biotech 8, 30 (2017).
20. Park, S. Y., Kang, T. M., Kim, M. J. & Kim, M. J. Enzymatic browning reaction of apple juices prepared using a blender and a low-
speed masticating household juicer. Biosci. Biotechnol. Biochem. 82, 2000–2006 (2018).
21. Prasad, K., Sharma, R. R. & Srivastav, M. Postharvest treatment of antioxidant reduces lenticel browning and improves cosmetic
appeal of mango (Mangifera indica L.) fruits without impairing quality. J. Food Sci. Technol. Mysore 53, 2995–3001 (2016).
22. Wang, H. et al. The changes in metabolisms of membrane lipids and phenolics induced by Phomopsis longanae Chi infection in
association with pericarp browning and disease occurrence of postharvest Longan fruit. J. Agric. Food Chem. 66, 12794–12804
(2018).
23. Liu, H., Jiang, W. B., Cao, J. K. & Li, Y. C. Effect of chilling temperatures on physiological properties, phenolic metabolism and
antioxidant level accompanying pulp browning of peach during cold storage. Sci. Hortic. 255, 175–182 (2019).
24. Mishra, B. B., Gautam, S. & Sharma, A. Free phenolics and polyphenol oxidase (PPO): The factors affecting post-cut browning in
eggplant (Solanum melongena). Food Chem. 139, 105–114 (2013).
25. Tomas-Barberan, F. & Espin, J. C. Phenolic compounds and related enzymes as determinants of quality in fruits and vegetables. J.
Sci. Food Agric. 81, 853–876 (2001).
26. Bhushan, B. et al. Combinatorial approaches for controlling pericarp browning in Litchi (Litchi chinensis) fruit. J. Food Sci. Technol.
Mysore 52, 5418–5426 (2015).
27. Qi, J., Li, G.-Q., Dong, Z. & Zhou, W. Transformation of tobacco plants by Yali PPO-GFP fusion gene and observation of subcel-
lular localization. Am. J. Transl. Res. 8, 698–704 (2016).
28. Taranto, F. et al. Polyphenol oxidases in crops: Biochemical, physiological and genetic aspects. Int. J. Mol. Sci. 18, 377 (2017).
29. Yingsanga, P., Srilaong, V., Kanlayanarat, S., Noichinda, S. & McGlasson, W. B. Relationship between browning and related enzymes
(PAL, PPO and POD) in rambutan fruit (Nephelium lappaceum Linn.) cvs. Rongrien and See-Chompoo. Postharvest. Biol. Technol.
50, 164–168 (2008).
30. Cano, M. P., deAncos, B., Lobo, M. G. & Santos, M. Improvement of frozen banana (Musa cavendishii, cv Enana) colour by
blanching: Relationship between browning, phenols and polyphenol oxidase and peroxidase activities. Zeitschrift Fur Lebensmittel-
Untersuchung Und-Forschung a-Food Res. Technol. 204, 60–65 (1997).
31. Zhu, H. et al. De novo sequencing and analysis of the transcriptome during the browning of fresh-cut Luffa cylindrica “Fusi-3”
fruits. PLoS ONE 12, e0187117 (2017).
32. Li, T. T. et al. Sodium para-aminosalicylate delays pericarp browning of litchi fruit by inhibiting ROS-mediated senescence during
postharvest storage. Food Chem. 278, 552–559 (2019).
33. Meilin, L. et al. Physiological and metabolomic analysis of cold plasma treated fresh-cut strawberries. J. Agric. Food Chem. 67,
4043–4053 (2019).
34. Meilin, L. et al. UV-C treatment maintains quality and enhances antioxidant capacity of fresh-cut strawberries. Postharvest. Biol.
Technol. 156, 110945–110945 (2019).
Acknowledgements
This work was supported by the Shanghai Municipal Agriculture Commission 02-08-00-12-F-1482(2020), China
Agriculture Research System (Grant No. CARS–25) and Excellent Team of Shanghai Academy of Agricultural
Sciences (Agricultural Science Innovation 2017(B-06)). The funding bodies did not play a role in the design of
the study, the collection, analysis, and interpretation of data, or the writing the manuscript.
Author contributions
Z.D.S., W.X.X. and L.Y. conceived the study idea; L.X.H. and S.J. performed the preparation and treatments of
test materials. W.X.X. and Z.A.D. designed and performed the experiments. L.X.H. analyzed the data and wrote
the manuscript. Z.A.D. and L.Y. revised the article. All authors read and approved the final manuscript.
Competing interests
The authors declare no competing interests.
Additional information
Supplementary Information The online version contains supplementary material available at https://doi.org/
10.1038/s41598-021-86311-1.
Correspondence and requests for materials should be addressed to X.W. or D.Z.
Reprints and permissions information is available at www.nature.com/reprints.
Publisher’s note Springer Nature remains neutral with regard to jurisdictional claims in published maps and
institutional affiliations.
Open Access This article is licensed under a Creative Commons Attribution 4.0 International
License, which permits use, sharing, adaptation, distribution and reproduction in any medium or
format, as long as you give appropriate credit to the original author(s) and the source, provide a link to the
Creative Commons licence, and indicate if changes were made. The images or other third party material in this
article are included in the article’s Creative Commons licence, unless indicated otherwise in a credit line to the
material. If material is not included in the article’s Creative Commons licence and your intended use is not
permitted by statutory regulation or exceeds the permitted use, you will need to obtain permission directly from
the copyright holder. To view a copy of this licence, visit http://creativecommons.org/licenses/by/4.0/.
© The Author(s) 2021
Scientific Reports | (2021) 11:6937 | https://doi.org/10.1038/s41598-021-86311-1 13
Vol.:(0123456789)You can also read