PulSync: The Heart Rate Variability as a Unique Fingerprint for the Alignment of Sensor Data Across Multiple Wearable Devices
←
→
Page content transcription
If your browser does not render page correctly, please read the page content below
PerHealth 2021: 5th IEEE PerCom Workshop on Pervasive Health Technologies

         PulSync: The Heart Rate Variability
      as a Unique Fingerprint for the Alignment
  of Sensor Data Across Multiple Wearable Devices
           Florian Wolling & Kristof Van Laerhoven                              Pekka Siirtola & Juha Röning
                      Ubiquitous Computing                               Biomimetics and Intelligent Systems Group
                       University of Siegen                                          University of Oulu
                        Siegen, Germany                                               Oulu, Finland
           0000-0002-4431-2378 & 0000-0001-5296-5347                    0000-0002-5995-5421 & 0000-0001-9993-8602

   Abstract—Most off-the-shelf wearable devices do not provide       body, however, such a synchronization can suffer from soft
reliable synchronization interfaces, causing multi-device sensing    tissue deformation and delays due to motion sequences and
and machine learning approaches, e.g. for activity recognition,      inertia of the body parts. Patterns in accelerometers’ signals
still to suffer from inaccurate clock sources and unmatched time.
Instead of using active online synchronization techniques, such as   can therefore exhibit significant shifts: for a standing jump for
those based on bidirectional wireless communication, we propose      instance, the arms’ sensors produce a pattern first, followed
in this work to use the human heartbeat as a reference signal        by a delayed pattern in the sensors at the torso. In contrast
that is continuously and ubiquitously available throughout the       to the above approaches, we propose to synchronise with the
entire body surface. We introduce PulSync, a novel approach          human heartbeat, a signal that is continuously and ubiquitously
that enables the alignment of sensor data across multiple devices
utilizing the unique fingerprint-like character of the heart rate    available throughout the entire body surface.
variability interval function. In an evaluation on a dataset from       Different measurement principles enable the detection of
25 subjects, we demonstrate the reliable alignment of independent    the heartbeat, either by capturing the pulse wave that travels
ECG recordings with a mean accuracy of −0.71 ± 3.44 samples,         through the blood vessels, or by detecting the electric field,
respectively −2.86 ± 11.43 ms at 250 Hz sampling rate.               originated in the cardiac muscle, at the skin surface. For
   Index Terms—wearable, synchronization, heart rate variability
                                                                     decades, electrocardiography (ECG) was exclusively present
                                                                     in clinical environments. In recent years, however, the progress
                       I. I NTRODUCTION                              in miniaturization and signal processing has enabled more con-
   The proper alignment of independent time bases across             venient wearable devices to detect the tiny, pulsatile electric
multiple wearable devices, attached to various body locations,       field changes at the body surface. It is predicted that most
is a major challenge for a range of today’s sensing tasks. Most      common wearables will soon have access to the vital sign
off-the-shelf devices do not support hardware synchronization        through an on-board heart rate sensor [11], [12]. Inter-beat
as it is complex and tends to exceed their small energy              intervals for heart rate variability (HRV) analysis are com-
budget. For this reason, available research datasets contain         monly calculated from such signals, with the HRV interval
often manually, and thus often inaccurately, matched sensor          function [13] being a unique, fingerprint-like signal exhibiting
channels. Especially applications that apply advanced machine        identical patterns at all body locations. ECG signals also
learning techniques on multi-modal sensor signals, such as           have a high propagation velocity [14], so that the pulsatile
activity recognition from wearable devices, are suffering from       signals show up nearly simultaneously throughout a person’s
a poor alignment of coincident events as these inaccuracies          body surface. ECG is thus an attractive reference for aligning
inevitably result in a poor classification [1], [2].                 time series across wearables, either as independent and offline
   Several approaches are aiming at the synchronization of           recordings, or online and solely data-driven, based on the com-
nodes in wireless sensor networks (WSN) such as body-worn            pressed information of the detected heartbeats’ timestamps.
sensing systems. They can be divided into two fundamental
                                                                     In this paper, we make the following contributions:
categories. The first one, aiming for online synchronization, is
                                                                     • We present PulSync, a novel approach for the data-driven
usually network-based and relies on wireless technology such
as Bluetooth [3]–[5]. The required protocols, however, result          alignment of sensors solely based on the human heartbeat.
in an overhead in the already energy-intensive radio commu-          • We propose to utilize the ubiquitously, continuously avail-

nication. The second one, aiming for offline synchronization,          able vital sign and the derived location-independent, unique,
exploits spontaneous and sporadic events to align the recorded         and fingerprint-like heart rate variability (HRV) interval
time series subsequently [2], [6]–[10]. Typical examples use           function to match the local times across multiple devices.
external events such as motion patterns, to observe and identify     • Our evaluation demonstrates the method’s general feasibility
simultaneously occurring events in the sensors’ measurements           and an achieved alignment accuracy in the order of few ms
to match the time bases. As these sensors are attached to the          for a publicly available dataset from 25 subjects [15].

      978-1-6654-0424-2/21/$31.00 ©2021 IEEE                     188
PerHealth 2021: 5th IEEE PerCom Workshop on Pervasive Health Technologies

              II. T HEORETICAL BACKGROUND                           physical actions that are known to have been detected simulta-
   The following section first gives an overview of relevant        neously by multiple sensors. In contrast to predefined synchro-
online and offline synchronization methods for body-worn            nization actions, context markers are incidentally performed
sensing systems. Subsequently, the origin of the heartbeat          throughout the entire recording and do not interrupt the ex-
and its detection are described exemplary for ECG-related           periment. The presented method reduced the synchronization
techniques. Finally, the heart rate variability and its unique,     error to 20 ms in comparison to the use of solely NTP with
fingerprint-like characteristics are explained, which eventually    250 ms or exclusively context markers with 1312 ms.
enable the data-driven alignment of the signals.                       Instead of explicit synchronization actions, signal couplings,
                                                                    or context markers, Hölzemann et al. [9] utilize the uniqueness
A. Present Synchronization Methods                                  of variations present in accelerometer signals from inertial
   A large variety of methods and research approaches aims at       measurement units (IMU) to align the independently recorded
the time synchronization in diverse applications with entirely      time series. The alignment, with an accuracy in the order of
different requirements on accuracy and precision as well as         seconds, requires sufficient periods of resting with low varia-
limits in costs and complexity. The established network time        tions as well as similarities and accordance in the simultaneous
protocol (NTP) and the precision time protocol (PTP) are            measurements at diverse locations such as head and wrist.
widely used in wired networks such as the Internet. Also               Ahmed et al. [10] present an approach that specifically aims
the popular global positioning system (GPS) provides precise        at the multi-modal detection and analysis of cough events
time information. In wireless sensor networks (WSN) and             across multiple devices. Coughs are high energy events with a
particularly in body area networks (BAN), with multiple body-       concise length of 0.3 to 0.7 s and simultaneously perceptible in
worn nodes, energy efficiency, and respectively the resulting       audio and acceleration measurements. The alignment of these
battery life, is a critical parameter [11]. The surveys [16] and    sporadic events, by means of a normalized cross-correlation,
[17] provide a brief overview of common online synchroniza-         resulted in an average synchronization error of 46 ms.
tion techniques for WSN. Based on the short-range wireless             The entirely different approach of Li et al. [18] presents a
standard Bluetooth, approaches for synchronized measure-            time division multiple access (TDMA) protocol for medium-
ments in body sensor networks (BSN) achieved accuracies             access control (MAC) which utilizes the rhythm of the heart-
ranging from 3.5 ms [3] over 100 µs using the sniff mode [4]        beat, instead of periodically broadcasted radio beacons, to
to even 17.4 µs utilizing the spark state mechanism which,          schedule the time slots in star-topology wireless BSNs. Based
however, is not supported by all devices [5].                       on the assumption that body-worn devices have access to the
   The method of Bannach et al. [6] is not intended to compete      wearer’s vital signs, the “naturally synchronized” information
with network-based online approaches. It rather aims at on-         are used to allocate time slots, to achieve a coarse synchroniza-
body applications of stand-alone devices without the capability     tion without the need to enable the energy-consuming radio to
of synchronization via wireless communication as it would           receive periodic timing information.
exceed their energy budget. Instead, synchronization actions of
the wearer, such as clapping, shaking, or jumping, are used as      B. Human Heartbeat Detection
characteristic signatures to automatically align signal segments       The heart is the center of the human cardiovascular system
from different sensors. This content-based synchronization          and pumps the blood through the entire body. This physio-
enables to reduce communication to a unidirectional channel         logical activity can be captured by means of different sensing
or even an offline alignment of the recorded data. The quality      modalities. Since each contraction of the cardiac muscle is
of event spotting is essential for the accuracy of alignment, and   initiated through action potentials, their accumulated electric
for different sensing modalities specific spotting algorithms are   field can be detected using electrocardiography (ECG). First
required. However, the required synchronization performance         experiments and the actual invention of traditional ECG can be
largely depends on the target applications. According to the        traced back into the end of the 19th century. It is considered a
authors, an accuracy below 1 s is sufficient for the recognition    gold standard in today’s medicine, and an essential instrument
of motion-related activities in daily life while a performance      to diagnose heart diseases and to reliably monitor heart rate.
better than 0.1 s is considered as not required.                    Each heartbeat generates a wave pattern with unique attributes,
   Bennett et al. [7], [8] present a data-driven offline synchro-   labeled with P, Q, R, S, and T, caused by superimposed stimuli
nization technique that detects physical and cyber couplings        in the cardiac muscle. To obtain the ECG signal’s typical, well-
between the interacting signals of multiple wearable sensors.       known contour, multiple wet electrodes are placed at specific
Couplings are events that happen to the sensors at the same         locations on chest and extremities. Depending on the applied
global time, irrespective of their local timestamps. A shortest     lead system, they detect the local electric potential differences
path algorithm is then applied to determine those signal            along e.g. 12 leads, paired electrodes. The high reliability and
couplings that minimize the overall clock drift in the system.      accuracy of ECG originates from the sharp R peak of the
   Likewise, Wang et al. [2] present an advanced method that        characteristic QRS complex [19]. With its large amplitude,
combines the single-time use of the energy-demanding NTP            resulting in a high signal-to-noise ratio (SNR), the peak serves
with the continuous identification and alignment of context         as a significant fiducial point that is less affected by noise and
markers. Similar to the previous signal couplings, these are        interference, and reliably detectable at most body locations.

                                                                189
PerHealth 2021: 5th IEEE PerCom Workshop on Pervasive Health Technologies
Fig. 1: PulSync processing pipeline for the alignment of independent wearables’ time bases, applied on ECG measurements.
Example from dataset 716 [15]: subject 23, Einthoven II (orange) and resembled V2-V1 (blue) leads. From left to right:
1) original ECG signals, labeled with precise fiducial points at the prominent R peaks (red); 2) derived HRV interval
functions (bottom) from the original, unaligned time series (top); 3) identification of the positions with maximum accordance
(red) and determination of the time series’ relative alignment offset ∆ using normalized cross-correlation; exemplary correlation
of five 60 s segments αp with their associated reference βq ; 4) aligned interval functions (bottom) and ECG time series (top).
Therefore, ECG allows to determine the heart rate by either system [13]. The predominating variations are originated in
counting the number of peaks per unit time or by calculating the phenomenon respiratory sinus arrhythmia (RSA) [28].
the individual reciprocal of the R-R inter-beat interval (IBI) In medical context, the heart rate variability (HRV) is
for an instantaneous measure [20]. often plotted in an interval tachogram, a discrete visualization
Progress in signal processing and miniaturization are suc- of enumerated, consecutive IBIs. However, as signals from
cessively enabling advanced ECG techniques aiming at smaller wearable devices tend to be affected by motion artifacts,
and more convenient wearables for ambulant health care, long- erroneously detected, spurious peaks can misalign and distort
term monitoring, and fitness tracking. Measured at a single these sequences. In contrast, the HRV interval function [13]
spot [21], [22], such as the chest or even the wrist, the tiny is a function of time, expressed through equation (4), that is
electrical bio-potential differences are ranging from hundreds less and, in case of artifacts, only locally disturbed.
to only tens of µV [23] and require particularly sensitive Due to their rich information content, features derived from
analog front-ends with a very high input impedance beyond HRV are often used in biometric identification and authenti-
several GΩ [24]. The described setup inevitably results in a cation approaches [29], [30]. The location independence and
less robust signal with a low SNR and, depending on the lead noise immunity in combination with a high degree of intrinsic
orientation, the pulse can also show an inverse amplitude. variation and uniqueness allows the use of the HRV similar
Advanced filters nevertheless enable to extract and identify to a temporal fingerprint. This specificity enables PulSync to
the prominent R peaks of the QRS complexes. An overview align the time series obtained from independent devices.
of common algorithms is provided by Köhler et al. [19].
III. S YNCHRONIZATION M ETHOD
To date, most wearable devices apply the optical measure-
ment principle photoplethysmography (PPG) as it is cheap and PulSync utilizes the natural, irregular rhythm of the heart-
easy to implement, however its accuracy still did not catch up beat that is ubiquitously and simultaneously available through-
with ECG [25]. PPG captures the pulse wave traveling through out the entire body surface of every living human. The ECG
blood vessels at a low propagation velocity of about 5.2 to signal’s prominent R peaks are significant fiducial points and
14.6 m s−1 [26] and thus suffers from a strong location depen- serve as coincident landmarks for the alignment. In contrast to
dency and a varying pulse arrival time (PAT), depending on the the commonly used motion signals, such as synchronization
distance from the heart. In contrast, the electrical ECG signal actions in acceleration signals [6], the vital sign is continuously
showed a lower-bound velocity of at least 250 m s−1 [14]. available. Even at rest, the heart rate results in an update rate
Consequently, the general feasibility of PulSync is evaluated of about 0.8 Hz (48 bpm), but it can vary within the extreme
on ECG signals as the prominent R peaks can be assumed boundaries ranging from 0.5 Hz in case of bradycardia up
to be immediately and simultaneously detectable throughout to 3.0 Hz in case of tachycardia or heavy physical activity
the entire body surface. However, future enhancements might (30–180 bpm) [31], [32]. Because the heart rate is modulated
enable to use other techniques such as the optical PPG. by physiological processes, the heart rate variability (HRV)
interval function [13] is highly varying and unique like a
C. Heart Rate Variability fingerprint, but also location-independent and hence identical
The pointed ECG signal shows a pseudo-periodic run [13], throughout the entire body surface. This singularity enables
influenced by physiological processes which modulate its to unambiguously align the independent recordings with their
intensity, amplitude, and pulse frequency [27]. The quasi- local time bases by matching these HRV fingerprints.
random modulation of the IBI is of particular interest as it The method’s processing pipeline is illustrated in Figure 1.
contains frequency components which reflect parasympathetic The heartbeat’s fiducial R points in real time t∗ define a unique
and sympathetic activities of the subject’s autonomic nervous sequence of timestamps t∗i ∈ T ∗ , allocated by equation (1).
190PerHealth 2021: 5th IEEE PerCom Workshop on Pervasive Health Technologies
T ∗ := ht∗0 , ..., t∗i , ..., t∗∞ ii∈N (1)
These heartbeat events t∗i are now captured by two exemplary
devices, denoted as A and B, which sample the individual
subsets TA∗ ⊂ T ∗ and TB∗ ⊂ T ∗ , and hence translate t∗i into
their local times tA (t∗i ) and tB (t∗i ). These images TA∗ → TA
and TB∗ → TB are specified by the equations (2) and (3).
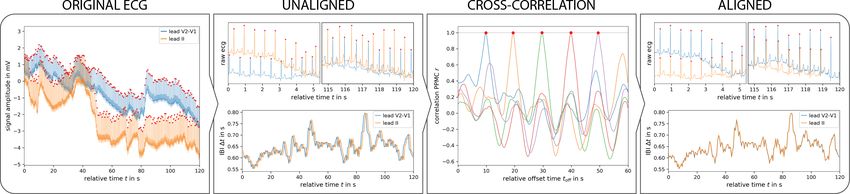
Fig. 2: The measurement setup (left) uses an exercise chest
TA (TA∗ ) := htA A A ∗
0 , ..., tj , ... | tj = tA (ti )ij∈N (2)
strap at the torso, resembling a V2-V1 ECG lead (blue), and
TB (TB∗ ) := htB B B ∗
0 , ..., tk , ... | tk = tB (ti )ik∈N (3) the traditional Einthoven II ECG lead (orange). At the right,
an excerpt from the “sitting” recordings of subject 23 [15]
Because the devices were supposedly not started at the exact shows non-stationary physiological signals, superimposed by
same moment, ∀x ∈ N: tA B
x 6= tx applies. Furthermore, as strong baseline wandering; V2-V1 lead (blue), II lead (orange);
∗
the individual ti are not retrievable, the relative but unique identified R peaks (red); matched by the PulSync method.
inter-beat distances (IBI) t∗i − t∗i−1 are used as a fingerprint
∗
pattern TW = ht∗x , ..., t∗x+w−1 i, with begin x and length w.
∗
Because TW is contained in both overlapping sequences A. Dataset
∗
TW ⊂ (TA∗ ∩ TB∗ ), the sequence TW ∗
⊂ TA∗ is translated to
tA and used as a search window TW ⊂ TA in counterpart TB . The evaluation of PulSync requires recordings from different
To enable this search by means of an approved tool, namely measurement sites with the largest possible diversity. The final
the cross-correlation, the sequences are first transformed into decision was made on the research dataset 716 of Howell
HRV interval functions by applying equation (4). and Porr from the University of Glasgow which is accessible
through the university’s research data portal [15]. The dataset
kT k−1
HRV (TX ) := h {tx , tx − tx−1 } , ...ix=1
X
(4) contains a large collection of two-minute ECG recordings from
25 subjects. Those performed 5 different tasks of which the
As these are sampled by means of the irregular heartbeat, the
“sitting” subtask has been chosen due to the availability of
sequences have to be linearly interpolated and resampled at the
precise peak labels. In addition, the absence of motion artifacts
sampling rate fhrv [13], resulting in α = intp(HRV (TA )) and
in these recordings supports the evidence of the general feasi-
β = intp(HRV (TB )), for the devices A and B respectively.
kT k−1 kT k−1 bility independently from specific situations. As illustrated in
To finally align α = hai ii=1A and β = hbi ii=1B , just
Figure 2, two independent devices recorded the ECG signals
like the associated TA and TB , a windowed segment αp ⊆ α
at a sampling rate fs of 250 Hz, pretended synchronously,
with position p is sliding along βq ⊂ β at position q. In
with one device measuring the traditional Einthoven II lead
doing so, a normalized cross-correlation with Pearson product-
while the second one, an exercise chest strap ECG, resembled
moment correlation (PPMC) coefficient r [33] is applied, as
approximately a V2-V1 lead. The dataset provides validated R
defined in equation (5), to determine the position q̂ of maxi-
peak annotations with a very high precision of ±1 sample. As
mum accordance argmax q (r(αp , βq )) between the segments.
no R peaks have to be identified before the derivation of the
Cov(αp , βq ) HRV interval functions, the evaluation is independent from the
r(αp , βq ) :=
σαp σβq selection of any preprocessing and QRS detection algorithm
Pw
(ai − ā)(bi − b̄) (5) which in turn ensures the results’ reproducibility.
= qP i=1 To enable the PPMC normalized cross-correlation, the HRV
w 2
Pw 2
i=1 (ai − ā) i=1 (bi − b̄) interval functions have been linearly interpolated and regularly
resampled at fhrv of 25 Hz. The evaluation has been conducted
The resulting difference p−q̂, based on fhrv , is then multiplied
with a window length w of 60 s and an overlap of 1 %,
by the factor fs /fhrv to translate it back into the original time
resulting in 101 segments of the V2-V1 lead’s HRV that were
base of fs . The original time series can finally be aligned
fs shifted along and correlated with the reference HRV interval
according to the determined relative offset ∆ = fhrv (p − q̂),
function of the Einthoven II lead. Due to boundary effects of
by adjusting their time bases towards each other.
datasets with large displacement, the first or last few segments’
IV. E VALUATION r values were rejected to prevent a falsification of the results.
The performance of PulSync is evaluated using a pub-
licly available dataset from 25 subjects, monitored with two B. Ground Truth
independent ECG devices attached to the chest. The evaluation There exist no publicly available datasets of two or more
primarily aims at the demonstration of the general feasibility independent and at the same time hardware-synchronized ECG
of the data-driven alignment, solely utilizing the HRV interval devices. Hence, a metric has been developed according to the
function as a unique fingerprint. Furthermore, the accuracy of fundamental assumption that ECG signals are immediately and
the time series’ alignment is determined by means of a metric simultaneously detectable throughout the entire body surface,
based on the distance between their proximate peaks. and delays of the signal can be neglected. In accordance with
191PerHealth 2021: 5th IEEE PerCom Workshop on Pervasive Health Technologies
the previous assumption, equation (6) introduces the alignment
error ε(j, k). Applied to all proximate peaks, with a minimum
temporal distance, it serves as a metric of synchronicity.
ε(j, k) := tA B
j − tk (6)
Any displacement of the time series results in an asynchronous
interference pattern that generates an ε 6= 0, with a large
standard deviation in presence of drift. In contrast, ideally Fig. 4: Illustration of the remaining alignment error ε for
aligned time series result in a minimum ε → 0, and a minimum all individual 25 subjects’ recordings. Differences between
deviation as the peaks are simultaneously following the same proximate peaks after the alignment, ε in samples at 250 Hz.
IBI pattern, respectively heartbeat rhythm.
C. Limitations for the proximate peaks with a minimum distance (middle,
orange). Accordingly, the misalignment (left, red), determined
As no QRS detection has to be applied before deriving the
by means of the presented method, range from 0.035 s (sub-
HRV interval functions, the evaluation is independent from the
ject 5) to even 4.961 s (subject 19) with an overall average
selection of an algorithm, hence ensuring the reproducibility.
ε of 15.328 ± 428.023 samples (0.061 ± 1.712 s). In contrast,
The previously made assumption, that the fiducial R points
the proposed alignment approach resulted in a remaining aver-
are immediately and simultaneously detectable at every arbi-
age error ε of −0.714 ± 3.440 samples (−2.856 ± 11.427 ms).
trary location, is exclusively valid for ECG-related measure-
Besides small drift, another reason for the large standard de-
ments and the targeted accuracy in the order of a few ms.
viation might be the HRV interval functions’ coarse temporal
As the electrical signals propagate in tissue with a lower-
resolution, fhrv of 25 Hz, to limit the computational efforts.
bound velocity of at least 250 m s−1 [14], there are, how-
ever, perceivable delays. Assuming a maximum distance of Without exception, for all recordings and valid segments,
1.5 m between the measurement location on the body surface Pearson’s r is virtually 1 and the deviation negligible as the
and the heart, the origin of the electrical action potentials, two devices’ HRV interval functions are almost identical. For
would consequently result in a worst-case delay of 6 ms. This signals interfered by motion artifacts, this ideal value will
systematic bias adds to the accuracy determined, but still likely decrease according to the ratio of the affected heartbeats.
results in a considerably better accuracy than the dataset’s
V. C ONCLUSION
original, manual alignment, and is furthermore sufficient for
the targeted applications such as activity recognition [6]. We presented PulSync, a data-driven method for the align-
ment of independent time bases across multiple wearable
D. Results and Discussion
devices, which exploits the local heartbeat measurements of
Figure 3 shows a typical trace of the determined offsets ∆ the common user. We propose to utilize the derived heart rate
for 100 matched segments αp along the reference βq . Only 1 variability (HRV) interval functions as unique and location-
of 101 determined r values is rejected due to boundary effects. independent temporal fingerprints that enable the distinct and
The quantization steps, intersecting the straight line, indicate accurate matching of sensor data from body-worn devices.
a small drift of about 2 samples over the entire 120 s length. Our evaluation results demonstrate not only the approach’s
Figure 4 details the achieved accuracies for all 25 indi- general feasibility, but also show a promising accuracy of
vidual recordings while the overall results are summarized −0.714 ± 3.440 samples and accordingly −2.856 ± 11.427 ms
in Figure 5. Since the original recordings have been aligned at 250 Hz sampling rate. The achieved accuracy is superior to
manually [15], the time bases are not ideally synchronized. a manual alignment and is located between online, wireless
This is reflected by the original dataset’s large initial error synchronization techniques in the order of µs to few ms
ε of −28.921 ± 89.015 samples (−115.684 ± 356.060 ms) [3]–[5] and the offline, motion-based methods in the order of
tens to hundreds of ms [2], [6]–[10]. Our evaluation revealed
the approach’s potential to sensitively track the relative drift
between devices’ local time bases. The method is particularly
promising as an accurate and energy-efficient method for
wearables that contain ECG, as it can be applied exclusively
on recorded data and then neither requires an extra channel
nor imposes an overhead on radio communication. Especially
scenarios in which body-worn devices are deployed over long
Fig. 3: Illustration of the determined offset ∆ for subject 1, term, and which avoid online synchronization methods due to
from 100 matched segments, 1 of 101 rejected. Visible quanti- energy requirements, will benefit from our PulSync method.
zation steps demonstrate the approach’s sensitivity and hence PulSync is implemented as a Python toolbox for the offline
the potential to detect even small drift across devices’ times. alignment of ECG recordings. It is available for public down-
PPMC r of 0.999 428 ± 0.000 159, ∆ in samples at 250 Hz. load on this website: https://github.com/fwolling/PulSync
192PerHealth 2021: 5th IEEE PerCom Workshop on Pervasive Health Technologies
[13] G. Baselli, S. Cerutti, S. Civardi, F. Lombardi, A. Malliani, M. Merri,
M. Pagani, and G. Rizzo, “Heart rate variability signal processing: A
quantitative approach as an aid to diagnosis in cardiovascular patholo-
gies,” International Journal of Bio-Medical Computing, vol. 20, no. 1,
pp. 51–70, 1987.
[14] T. Buchner and J. Gierałtowski, “How fast does the ecg signal propagate
within the body,” Working Group for Cardiovascular Physics. Faculty
of Physics, Warsaw University of Technology. 6th Cardiology Meets
Physics & Mathematics., vol. 6, 2015.
[15] L. Howell and B. Porr, “High precision ecg database with annotated
r peaks, recorded and filmed under realistic conditions.” [Online].
Available: http://researchdata.gla.ac.uk/716/
[16] B. Sundararaman, U. Buy, and A. D. Kshemkalyani, “Clock synchro-
nization for wireless sensor networks: a survey,” Ad Hoc Networks,
vol. 3, no. 3, pp. 281–323, 2005.
Fig. 5: Summary of the overall evaluation results. Y axes: [17] S. M. Lasassmeh and J. M. Conrad, “Time synchronization in wireless
error ε distribution in samples at 250 Hz. Left (red): ε of sensor networks: A survey,” in SoutheastCon. IEEE, 2010, pp. 242–245.
assigned peaks shows initial misalignment of the original data. [18] H. Li and J. Tan, “Heartbeat-driven medium-access control for body
sensor networks,” IEEE EMBC’10, vol. 14, no. 1, pp. 44–51, 2010.
Middle (orange): ε of interference between proximate peaks in [19] B.-U. Köhler, C. Hennig, and R. Orglmeister, “The principles of software
original, unaligned data. Right (green): ε of proximate peaks qrs detection,” IEEE Engineering in Medicine and Biology Magazine,
after the alignment. Note the different scaling of the y axes. vol. 21, no. 1, pp. 42–57, 2002.
[20] D. Chabot, M. Bayer, and A. de Roos, “Instantaneous heart rates and
other techniques introducing errors in the calculation of heart rate,”
ACKNOWLEDGMENTS Canadian Journal of Zoology, vol. 69, no. 4, pp. 1117–1120, 1991.
[21] R. F. Yazicioglu, T. Torfs, J. Penders, I. Romero, H. Kim, P. Merken,
The main author’s research visit at the Biomimetics and B. Gyselinckx, H. J. Yoo, and C. van Hoof, “Ultra-low-power wearable
Intelligent Systems Group of the University of Oulu, Finland biopotential sensor nodes,” IEEE EMBC’09, pp. 3205–3208, 2009.
[22] Y. Sun and X. B. Yu, “Capacitive biopotential measurement for elec-
has been supported by the University of Siegen and the trophysiological signal acquisition: A review,” IEEE Sensors Journal,
German Academic Exchange Service (DAAD). The data has vol. 16, no. 9, pp. 2832–2853, 2016.
been processed by the HoRUS cluster, University of Siegen. [23] S. Ha, C. Kim, Y. M. Chi, and G. Cauwenberghs, “Low-power integrated
circuit design for wearable biopotential sensing,” in Wearable sensors.
Elsevier, 2014, pp. 323–352.
R EFERENCES [24] Y. M. Chi, C. Maier, and G. Cauwenberghs, “Ultra-high input
impedance, low noise integrated amplifier for noncontact biopotential
[1] R. Ohmura, F. Naya, H. Noma, and K. Kogure, “B-pack: A bluetooth- sensing,” IEEE Journal on Emerging and Selected Topics in Circuits
based wearable sensing device for nursing activity recognition,” in and Systems, vol. 1, no. 4, pp. 526–535, 2011.
Wireless Pervasive Computing (ISWPC). IEEE, 2006, pp. 1–6. [25] D. Castaneda, A. Esparza, M. Ghamari, C. Soltanpur, and H. Nazeran,
[2] C. Wang, Z. Sarsenbayeva, C. Luo, J. Goncalves, and V. Kostakos, “A review on wearable photoplethysmography sensors and their potential
“Improving wearable sensor data quality using context markers,” ser. future applications in health care,” International journal of biosensors
UbiComp/ISWC ’19. ACM, 2019. & bioelectronics, vol. 4, no. 4, pp. 195–202, 2018.
[3] M. Ringwald and K. Romer, “Practical time synchronization for blue- [26] F.U.S. Mattace-Raso, A. Hofman, G.C. Verwoert et al., “Determinants
tooth scatternets,” in 4th International Conference on Broadband Com- of pulse wave velocity in healthy people and in the presence of
munications, Networks & Systems, 2007, pp. 337–345. cardiovascular risk factors: ‘establishing normal and reference values’,”
[4] M. Pflugradt, I. Fritzsch, S. Mann et al., “A novel pulseoximeter for European Heart Journal, vol. 31, no. 19, pp. 2338–2350, 2010.
bluetooth synchronized measurements in a body sensor network,” in [27] P. H. Charlton, D. A. Birrenkott, T. Bonnici, M. A. F. Pimentel, A. E. W.
EDERC’14. IEEE, 2014, pp. 21–25. Johnson, J. Alastruey, L. Tarassenko, P. J. Watkinson, R. Beale, and
[5] H. J. G. Roberto Casas, “Synchronization in wireless sensor networks D. A. Clifton, “Breathing rate estimation from the electrocardiogram
using bluetooth,” in 3rd International Workshop on Intelligent Solutions and photoplethysmogram: A review,” IEEE Reviews in Biomedical
in Embedded Systems. IEEE, 2005, pp. 79–88. Engineering, vol. 11, pp. 2–20, 2018.
[6] D. Bannach, O. Amft, and P. Lukowicz, “Automatic event-based syn- [28] G. B. Moody, R. G. Mark, A. Zoccola, and S. Mantero, “Derivation of
chronization of multimodal data streams from wearable and ambient respiratory signals from multi-lead ecgs,” vol. 12, pp. 113–116, 1985.
sensors,” ser. EuroSSC’09. Springer, 2009, pp. 135–148. [29] S. A. Israel, J. M. Irvine, A. Cheng, M. D. Wiederhold, and B. K.
[7] T. R. Bennett, N. Gans, and R. Jafari, “Multi-sensor data-driven syn- Wiederhold, “Ecg to identify individuals,” Pattern Recognition, vol. 38,
chronization using wearable sensors,” ser. ISWC’15. ACM, 2015. no. 1, pp. 133–142, 2005.
[8] ——, “A data-driven synchronization technique for cyber-physical sys- [30] N. Akhter, S. Tharewal, V. Kale, A. Bhalerao, and K. V. Kale, “Heart-
tems,” in 2nd International Workshop on the Swarm at the Edge of the based biometrics and possible use of heart rate variability in biometric
Cloud. ACM, 2015, pp. 49–54. recognition systems,” in Advanced computing and systems for security,
[9] A. Hölzemann, H. Odoemelem, and K. Van Laerhoven, “Using an in-ear ser. Advances in intelligent systems and computing. Springer, 2015,
wearable to annotate activity data across multiple inertial sensors,” ser. vol. 1, pp. 15–29.
EarComp’19. ACM, 2019. [31] P. Dehkordi, A. Garde, B. Molavi, J. M. Ansermino, and G. A. Dumont,
[10] T. Ahmed, M. Y. Ahmed, M. M. Rahman, E. Nemati, B. Islam, “Extracting instantaneous respiratory rate from multiple photoplethys-
K. Vatanparvar, V. Nathan, D. McCaffrey, J. Kuang, and J. A. Gao, mogram respiratory-induced variations,” Frontiers in physiology, vol. 9,
“Automated time synchronization of cough events from multimodal p. 948, 2018.
sensors in mobile devices,” in International Conference on Multimodal [32] S. Fleming, M. Thompson, R. Stevens, C. Heneghan, A. Plüddemann,
Interaction. ACM, 2020, pp. 614–619. I. Maconochie, L. Tarassenko, and D. Mant, “Normal ranges of heart
[11] Y.-L. Zheng, X.-R. Ding, C. C. Y. Poon, B. P. L. Lo, H. Zhang, X.- rate and respiratory rate in children from birth to 18 years of age: a
L. Zhou, G.-Z. Yang, N. Zhao, and Y.-T. Zhang, “Unobtrusive sensing systematic review of observational studies,” The Lancet, vol. 377, no.
and wearable devices for health informatics,” IEEE transactions on bio- 9770, pp. 1011–1018, 2011.
medical engineering, vol. 61, no. 5, pp. 1538–1554, 2014. [33] K. Pearson, “Note on regression and inheritance in the case of two
[12] A. K. Yetisen, J. L. Martinez-Hurtado, B. Ünal, A. Khademhosseini, and parents,” Proceedings of the Royal Society of London, vol. 58, no. 347-
H. Butt, “Wearables in medicine,” Advanced Materials, vol. 30, no. 33, 352, pp. 240–242, 1895.
p. 1706910, 2018.
193You can also read